TIDMHL.
RNS Number : 4357B
Hargreaves Lansdown PLC
08 October 2020
Trading update
8 October 2020
Hargreaves Lansdown plc ('the Group') today publishes a trading
update in respect of the three month period to 30 September 2020
('the period'). The comparatives are for the period from 1 July
2019 to 30 September 2019 ("2019").
Highlights
   --       Net new business of GBP0.8 billion in the period
   --       Net new clients of 31,000
-- Assets under administration ("AUA") of GBP106.9 billion as at
30 September 2020, up 3% since 30 June 2020
-- Revenue for the period of GBP143.7 million (2019: GBP128.1 million), up 12%
Chris Hill, Chief Executive Officer, commented:
"Today we report a good start to our financial year, with growth
in clients, assets and revenue. These results are against the
ongoing backdrop of market uncertainty and highlight the resilience
of our business model and client proposition. We are confident that
the strategy we have invested in, with our focus on the needs of UK
investors and savers and delivering the highest level of client
service, means that we continue to be well positioned to deliver
continued attractive long-term growth."
Assets under administration and net new business
 GBP billion             Three months       Three months
                      to 30 September    to 30 September
                                 2020               2019
 Opening AUA                    104.0               99.3
 Net new business                 0.8                1.7
 Market movements                 2.1                0.8
                    -----------------  -----------------
 Closing AUA                    106.9              101.8
                    -----------------  -----------------
Net new business was GBP0.8 billion during the period (2019:
GBP1.7bn, GBP0.8bn excluding back book transfers). This is a
pleasing result given the period has seen weakening investor
sentiment arising from COVID-19 and the re-emergence of Brexit
uncertainty. As noted, last year benefited from direct back book
transfers from J.P. Morgan and Baillie Gifford of GBP0.9
billion.
During the quarter, flows into Active Savings were hampered by
the market leading rates on offer from the government backed
NS&I. However, since NS&I cut their interest rates in
mid-September we have seen a marked impact on flows back into
Hargreaves Lansdown's Active Savings.
A positive market movement of GBP2.1 billion, combined with net
new business has driven AUA to GBP106.9 billion as at 30 September
2020.
We welcomed 31,000 net new clients in the period (2019: 35,000,
17,000 excluding direct back book transfers), taking active client
numbers to 1,443,000.
Revenue
Revenue for the period was GBP143.7 million, up 12% on last year
despite, on average, the FTSE All Share being down versus the
comparative period by 18%. Revenue, was in part, driven by strong
stockbroking revenues from continued elevated share dealing volumes
. Although down on the peak levels seen earlier this year share
dealing volumes across the quarter remained high and averaged
980,000 deals per month.
Contacts:
 Investors                         Media
 Philip Johnson, Chief Financial   Danny Cox, Head of External
  Officer                           Relations
  James Found, Head of Investor     +44(0)7989 672071
  Relations
  +44(0)7970 066634
Forward looking statements
This announcement contains forward-looking statements with
respect to the financial condition, results and business of the
Group. By their nature, forward-looking statements involve risk and
uncertainty because they relate to events, and depend on
circumstances, that will occur in the future. The Group's actual
results may differ materially from the results expressed or implied
in these forward-looking statements. Nothing in this announcement
should be construed as a profit forecast. This announcement is
unaudited. This statement should not be seen as a promotion or
solicitation to buy Hargreaves Lansdown plc shares. It should be
remembered that the value of shares can fall as well as rise and
therefore you could get back less than you invested.
LEI Number: 2138008ZCE93ZDSESG90
Assets under administration
 Average AUA            3 months        2 months       4 months        3 months           3 months
  (GBPbillion)       to 30 September    to 30 June    to 30 April    to 31 December    to 30 September
                          2020             2020          2020             2019              2019
 Funds                    52.4            51.1           49.4            54.6               54.6
                   -----------------  ------------  -------------  ----------------  -----------------
 Shares                   37.6            35.8           32.5            35.4               34.6
                   -----------------  ------------  -------------  ----------------  -----------------
 Cash                     13.5            13.6           13.2            11.3               11.1
                   -----------------  ------------  -------------  ----------------  -----------------
 HL Funds                 7.9              8.0           8.2              9.2               9.3
                   -----------------  ------------  -------------  ----------------  -----------------
 Active Savings           2.2              2.2           1.9              1.5               1.2
                   -----------------  ------------  -------------  ----------------  -----------------
 Double count(1)         (7.8)            (7.9)         (8.1)            (9.1)             (9.2)
                   -----------------  ------------  -------------  ----------------  -----------------
 Total                   105.8            102.8          97.1            102.9             101.6
                   -----------------  ------------  -------------  ----------------  -----------------


 AUA (GBPbillion)     As at 30     As at 30     As at 30     As at 31     As at 30
                      September    June 2020    April 2020    December    September
                        2020                                    2019        2019
 Funds                  52.8         51.7         47.9         55.9         54.2
                    -----------  -----------  ------------  ----------  -----------
 Shares                 38.2         36.4         32.5         36.5         34.9
                    -----------  -----------  ------------  ----------  -----------
 Cash                   13.5         13.6         14.1         11.1         11.3
                    -----------  -----------  ------------  ----------  -----------
 HL Funds               7.8          8.0           7.7          9.4         9.2
                    -----------  -----------  ------------  ----------  -----------
 Active Savings         2.3          2.2           2.1          1.6         1.3
                    -----------  -----------  ------------  ----------  -----------
 Double count(1)       (7.7)        (7.9)         (7.6)        (9.3)       (9.1)
                    -----------  -----------  ------------  ----------  -----------
 Total                 106.9        104.0         96.7         105.2       101.8
                    -----------  -----------  ------------  ----------  -----------
(1) All HL Funds are held in Vantage or the Portfolio Management
Service (PMS) and are included in the Funds category of the table,
with the exception of a small balance held off platform by third
parties. To avoid double counting, the amount held in Vantage or
PMS has been deducted.
 AUA (GBPbillion)           3 months        2 months       4 months        3 months           3 months
                         to 30 September    to 30 June    to 30 April    to 31 December    to 30 September
                              2020             2020          2020             2019              2019
 Opening AUA                 104.0            96.7          105.2            101.8              99.3
                       -----------------  ------------  -------------  ----------------  -----------------
 Net new business(1)          0.8              1.4           4.0              0.6               1.7
                       -----------------  ------------  -------------  ----------------  -----------------
 Market movements             2.1              5.9          (12.4)            2.8               0.8
                       -----------------  ------------  -------------  ----------------  -----------------
 Founder transfer(2)           -                -           (0.1)              -                 -
                       -----------------  ------------  -------------  ----------------  -----------------
 Closing AUA                 106.9            104.0          96.7            105.2             101.8
                       -----------------  ------------  -------------  ----------------  -----------------
(1) Net new business in the 3 months to 30 September 2019
includes GBP0.9bn of flows acquired from J.P. Morgan and Baillie
Gifford direct back books
(2) Net new business excludes the withdrawal of GBP110 million
of Hargreaves Lansdown plc placing proceeds during the period that
were held by a founder.
This information is provided by RNS, the news service of the
London Stock Exchange. RNS is approved by the Financial Conduct
Authority to act as a Primary Information Provider in the United
Kingdom. Terms and conditions relating to the use and distribution
of this information may apply. For further information, please
contact rns@lseg.com or visit www.rns.com.
RNS may use your IP address to confirm compliance with the terms
and conditions, to analyse how you engage with the information
contained in this communication, and to share such analysis on an
anonymised basis with others as part of our commercial services.
For further information about how RNS and the London Stock Exchange
use the personal data you provide us, please see our Privacy
Policy.
END
TSTBRBDGRBGDGGR
(END) Dow Jones Newswires
October 08, 2020 02:00 ET (06:00 GMT)
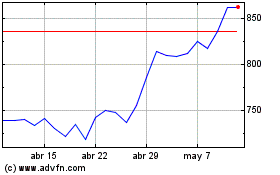
Hargreaves Lansdown (LSE:HL.)
Gráfica de Acción Histórica
De Mar 2024 a Abr 2024

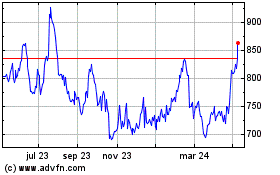
Hargreaves Lansdown (LSE:HL.)
Gráfica de Acción Histórica
De Abr 2023 a Abr 2024
