Bitcoin Hits $29,000 But Traders Prepare For More Volatility On Friday, Here’s Why
30 Marzo 2023 - 3:30AM
NEWSBTC
The Bitcoin price saw an eye-catching move today, initially rising
2.8% ($810) in 30 minutes to reach a new yearly high at $29,182,
only to fall to $28,080 in a very short period of time. At press
time, Bitcoin showed renewed strength and was trading at $28,586.
Analyst Skew has several explanations for the puzzling movement of
the BTC price. Aggregate CVDs & Delta show that there was a
quick push into spot selling liquidity that was filled. In
addition, the market showed a high premium under perps, meaning
that perps led the price and the spot market began to sell.
“Reaction is quick rally & sell off as crowded perp longs get
caught on the downside volatility,” explained the analyst, who also
has another explanation in store. Looking at Bitcoin’s Perp CVD
Buckets & Delta Orders, the analyst noted increased whale
movements that likely led to the move. We’re in whale town today it
seems, the push up was cleanly orchestrated by whales & sold by
whales. The odd one out here are the high leverage traders trying
to short to zero & long to 100k lol. $BTC Binance Market CVDs
& Delta: 15 min trend still intact bullish till we lose that
trend. He shared the chart below and added that it was forced
selling and sell orders that drove the price down to meet limit buy
orders. “Someone wants to get filled with size here. Pretty
predatory & risky because other parties will notice this setup
and hunt.” More Volatility To Come For Bitcoin On Friday For
several reasons at once, tomorrow could see even higher volatility.
The first reason are the Bitcoin options, which have enjoyed rising
popularity over the past few weeks. Related Reading: Why Is The
Bitcoin Price Up Today? Tomorrow is the quarterly settlement day,
and the quarterly contracts are currently trading very actively,
with short-term implied volatility continuing to rise, up nearly
10% in one day for the monthly maturity, according to Greeks Live.
A total of 141,000 BTC options are about to expire, with a put-call
ratio of 0.73, a maximum pain point of $24,000 and a notional value
of $3.8 billion, the largest options exchange for Bitcoin, Deribit,
shared via Twitter. Large #options expiry coming this Friday 8 AM
UTC 🚀 141K #Bitcoin options are set to expire on Deribit with a
notional value of $3.8 billion. 🔥 Max pain $24,000, put/call ratio:
0.73#Ethereum max pain $1600, $3 B. notional value, put/call ratio
0.33 🔥#Cryptooptions #ETH pic.twitter.com/JTWSaamY5p — Deribit
(@DeribitExchange) March 28, 2023 From a macroeconomic perspective,
the release of the Personal Consumption Expenditures (PCE) Index by
the Bureau of Economic Analysis at 8:30 am EST will be the most
important event of the week. The PCE is the Fed’s preferred metric
to gauge inflation and is therefore of great importance. Core PCE
is forecasted to rise +0.6% month-over-month and +4.7% on an
annualized basis. February PCE came in at +0.6%, but above the
market forecast of 0.4%. The year-to-year reading was 4.7% in
February (4.6% was expected). As a result, financial markets
corrected southward. Related Reading: Bitcoin Repeating This Price
Pattern Of Late 2019? Watch This A similar scenario is conceivable
tomorrow if the core PCE turns out worse than expected. However, if
the core inflation rate increased less than analysts expect, the
Bitcoin price is likely to receive confirmation for its upward
trend. Last but not least, the monthly candle close is also coming
up tomorrow, Friday. With a close at the current price levels,
Bitcoin would confirm a clear breakout from the macro trend.
Analysts at Rekt Capital shared the chart below and wrote: History
has repeated itself. BTC has broken the macro downtrend. This time,
around 385 days before the Halving. This Saturday, the BTC Monthly
Candle will have closed above the macro downtrend to confirm a new
bull market. Featured image from iStock, chart from TradingView.com
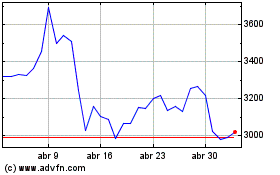
Ethereum (COIN:ETHUSD)
Gráfica de Acción Histórica
De Mar 2024 a Abr 2024

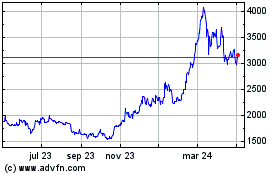
Ethereum (COIN:ETHUSD)
Gráfica de Acción Histórica
De Abr 2023 a Abr 2024
