Bitcoin Price Experiences Correction to $23,000 Support, Can Bulls Push Higher?
27 Febrero 2023 - 1:51PM
NEWSBTC
Bitcoin has experienced a correction down to $23,000 over the
weekend; with the recent downtrend, the Bitcoin price action needs
a significant push above its resistance to confirm a continuation
of the bullish trend that began in early 2023. BTC has recently
held above the $22,700 level, preventing further price declines.
After a full-throttle uptrend since January, BTC has seen a
correction to low levels since last week, dropping to $22,700. BTC
succumbed to the selling pressure. With the current price
action of BTC and the uncertainty of the direction of the next move
of the largest cryptocurrency in the market, the total amount of
liquidations data has increased over the past few days, with almost
$200 million in positions liquidated since February 22nd, according
to Coinglass data. Related Reading: Stacks (STX) Shines With
50% Weekly Gains While Market Drops Is A Bitcoin Bull Trend In Full
Effect? Data and crypto analyst CryptoCon has outlined in a
Twitter post the recent positive correlation between Bitcoin and
the U.S. dollar, as measured by the DXY Index, and how this can
drive the next bull trend for Bitcoin. The analyst states
that the bull market is in full effect, given the high correlation
after the 2022 bear market between the DXY and BTC. Two out of
three times, this correlation has been the precursor to BTC rallies
in 2011 and 2015. The 2019 rally, as seen in the chart below, makes
this the fourth time the correlation hinted at the beginning of a
new, fully formed bull market. It’s well known that crypto price
movements have been correlated with the DXY index since the
inception of the crypto market. The recent correlation has turned
positive, as the DXY index gets a correction below its annual high
of $105, as do Bitcoin and Ethereum on their respective charts.
CryptoCon concluded: Although Bitcoin is correcting, it is still
primed for Bull Market upside. Market structure compared to July
2015 is entirely different, and instead looks just like the Nov
2015 surge before the Bull Market. Bitcoin is in an uptrend, and
these are among the best cycle buying prices. BTC’s recent
reversal of the price action, which was expected to be strong
support at the $23,500 level, has formed a new resistance wall for
the flagship currency. If the Bitcoin price action
continues to wipe out the short and long positions by moving
sideways, BTC could fuel up the liquidity at higher levels. This
liquidity could allow BTC to surpass the nearest resistances of
$23,500 and $24,000 to attempt another breakthrough, the critical
resistance of $25,000, which for analysts, is the last obstacle for
Bitcoin as it seems poised to break the milestone of $30,000 in the
medium term. Related Reading: Crypto Market Crawls To A Standstill
As Investors Remain Neutral Bitcoin is trading at the $23,300
level, below the critical support lost over the weekend with the
retracement to $22,700. With this price drop, Bitcoin has seen a
slight gain of 0.7% over the past 24 hours. In broader time frames,
the price of BTC has noted a decline of -3.9% in its price in the
seven-day time frame but has managed to maintain gains in the
fourteen and thirty-day time frames of 7.1% and 1.1%, respectively.
Featured image from Unsplash, chart from TradingView.
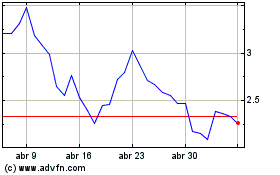
Stacks (COIN:STXUSD)
Gráfica de Acción Histórica
De Mar 2024 a Abr 2024

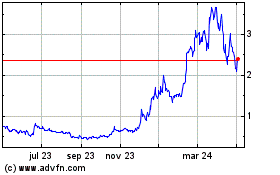
Stacks (COIN:STXUSD)
Gráfica de Acción Histórica
De Abr 2023 a Abr 2024
