TIDMPRIM
RNS Number : 3394L
Primorus Investments PLC
10 September 2021
   Primorus   Investments   plc
   ("Primorus"   or   the   "Company")
   Interim   Results   for   the   six   months   ended   30   June   2021
Primorus Investments plc (AIM: PRIM) is pleased to announce its
interim results for the six months ended 30 June 2021.
Overview
Primorus has a strong balance sheet with no debt and with total
assets (including cash of GBP1.346 million) as at 30 June 2021
amounting to GBP9.17 million (30 June 2020: GBP8.09 million).
The last six months have been a very busy time at Primorus. The
Board has spent considerable time reorganising the Company and its
balance sheet to provide investors with what it believes to be a
low cost, high impact strategy underpinned by the revised investing
policy.
The Board has reduced the overall operating costs, appointed a
new Chief Executive, fully appraised all the current investments,
and pursued new investment opportunities.
The results of the appraisal of its existing investments led to
the Company increasing its holdings in Fresho and Engage which,
along with Zuuse, are the three companies (from investments made
prior to November 2020) that the Board believes will deliver the
greatest shareholder returns.
In addition to the above, in April the Company made a new
investment into Mustang Energy PLC to gain exposure to the vanadium
flow battery storage market. The Board believes that this sector,
along with other forms of renewable energy and clean technology, is
going to be a financially rewarding market to be invested in.
Financial Results
The operating loss for the six months to 30 June 2021 was
GBP115,000 (30 June 2020: GBP3.29m profit). The net loss after tax
was GBP115,000 (30 June 2020: GBP3.29m profit).
Total assets, including cash, at 30 June 2021 amounted to
GBP9.17 million (30 June 2020: GBP8.09 million).
Outlook
The Board remains confident that significant opportunities exist
for the Company going forward. We look forward to the remainder of
2021 being a period in which we can further demonstrate our
business model which is now underpinned by the new investing
policy.
The Board are currently reviewing several exciting investment
opportunities that are aligned with the new investing policy. The
Board has been screening several opportunities and has identified
at least one that could begin to generate value for shareholders
this calendar year.
We look forward to updating shareholders as and when our
existing investments mature, and new investments present
themselves.
The Directors would like to take this opportunity to thank our
shareholders, staff and consultants for their continued
support.
Rupert Labrum Chairman
10 September 2021
This announcement contains inside information for the purposes
of the UK Market Abuse Regulation and the Directors of the Company
are responsible for the release of this announcement.
For further information please contact:
   Primorus Investments plc
    Matthew Beardmore, Chief Executive
    Officer                                 +44 (0)20 8154 7907
   Nominated Advisor
    Cairn Financial Advisers LLP
    James Caithie / Sandy Jamieson         +44 (0) 20 7213 0880
Unaudited Condensed Company Statement of Comprehensive
Income
for the six months ended 30 June 2021
                                                                6 months to  6 months to      Year to
                                                                    30 June      30 June  31 December
                                                                       2021         2020         2020
                                                                Unaudited      Unaudited      Audited
                                                  Notes             GBP'000      GBP'000      GBP'000
   Continuing operations
   Revenue
   Investment income                                                     48            1           14
   Realised gain on disposal of financial
    investments                                                         107          834        6,033
   Unrealised gain/(loss) on market
    value movement of financial investments                            (21)        2,715        (323)
   Total gains on financial investments                                 134        3,550        5,724
                                                               ------------  -----------  -----------

   Share based payments                                                (13)            -            -
                                                               ------------  -----------  -----------
   Operating costs                                                    (236)        (258)        (475)
                                                               ------------  -----------  -----------

     Impairment of financial investments                                  -            -        (633)
                                                               ------------  -----------  -----------
   (Loss)/Profit before tax                                           (115)        3,292        4,616
   Taxation                                                               -            -        (447)
                                                               ------------  -----------  -----------
   (Loss)/Profit for the period attributable
    to equity shareholders of the company                             (115)        3,292        4,169
                                                               ------------  -----------  -----------
                                                                          -            -            -
     Other comprehensive income
   Total Comprehensive Income for
    the year attributable to equity
    shareholders of the company                                       (115)        3,292        4,169
                                                               ------------  -----------  -----------

     (Loss) per share:
   Basic profit/(loss) per share (pence)                    2        (0.08)         2.35         2.98
   Diluted profit/(loss) per share
    (pence)                                                 2        (0.08)         2.09         2.98
Unaudited Condensed Company Statement of Financial Position
as at 30 June 2021
                                                                                             30 June    30 June        31
                                                                                                2021       2020  December
                                                                                                                     2020
                                                                                           Unaudited  Unaudited   Audited
                                                                                   Notes     GBP'000    GBP'000   GBP'000
   ASSETS
   Non-current assets
   Financial investments                                                                       6,998      7,390     4,612
                                                                                           ---------  ---------  --------
                                                                                               6,998      7,390     4,612
                                                                                           ---------  ---------  --------

     Current assets
   Investments                                                                                   812          -       113
   Trade and other receivables                                                                    14         22         3
   Cash and cash equivalents                                                                   1,346        676     4,673
                                                                                           ---------  ---------  --------
                                                                                               2,172        698     4,789
                                                                                           ---------  ---------  --------
   Total assets                                                                                9,170      8,088     9,401
                                                                                           ---------  ---------  --------

     EQUITY
   Equity attributable to equity holders
    of the parent
   Share capital                                                                              15,391     15,391    15,391
   Share premium account                                                                      35,296     35,296    35,296
   Share based payment reserve                                                                    13        683         -
   Retained earnings                                                                        (42,016)   (43,321)  (41,901)
                                                                                           ---------  ---------  --------
   Total equity                                                                                8,684      8,049     8,786
   LIABILITIES
   Current liabilities
   Trade and other payables                                                                      486         39       502
   Loans and borrowings                                                                            -          -       113
                                                                                           ---------  ---------  --------
   Total liabilities                                                                             486         39       615
                                                                                           ---------  ---------  --------
   Total equity and liabilities                                                                9,170      8,088     9,401
                                                                                           ---------  ---------  --------
Unaudited Condensed Company Statement of Changes in Equity
for the six months ended 30 June 2021
                                                                   Share based                                   Total
                               Share            Share                  payment      Retained              attributable
                               capital          premium                reserve      earnings                 to owners
                                                                                                             of parent
   Unaudited                   GBP'000               GBP'000           GBP'000          GBP'000                GBP'000
   Balance at 31
    December 2019               15,391                35,296               683    (46,613)                       4,757
                       ===============  ====================  ================  ================  ====================

     Profit for the
     period                          -                     -                 -             4,169                 4,169
                       ---------------  --------------------  ----------------  ----------------  --------------------
   Total
    comprehensive
    income for
    the
    period                           -                     -                 -             4,169                 4,169
   Termination and
    settlement of
    share options                    -                     -             (140)                 -                 (140)
   Cancellation of
    share options                    -                     -             (543)               543                     -
                       ---------------  --------------------  ----------------  ----------------  --------------------

     Balance at 31
     December 2020              15,391                35,296                 -        (41,901)                   8,786
                       ===============  ====================  ================  ================  ====================

     Loss for the
     period                          -                     -                 -             (115)                 (115)
                       ---------------  --------------------  ----------------  ----------------  --------------------
   Total
    comprehensive
    income for
    the period                       -                     -                 -             (115)                 (115)

     Share based
     payment                                                                13                 -                    13
   Balance at 30 June
    2021                        15,391                35,296                13          (42,016)                 8,684
                       ===============  ====================  ================  ================  ====================
Unaudited Condensed Company Statement of Cash Flows
for the six months ended 30 June 2021
                                                6 months to  6 months to    Year to
                                                  30-Jun-21    30-Jun-20  31-Dec-20
                                                  Unaudited    Unaudited    Audited
                                                    GBP'000      GBP'000    GBP'000
   Cash flows from operating activities
   Operating profit/(loss)                            (115)        3,292      4,616
   Adjustments for:
   (Profit)/Loss on disposal of financial
    investments                                       (107)        (835)    (6,033)
   Fair value movement on listed investments             21      (2,716)        323
   Impairment provision on unlisted investments           -            -        633
   Decrease/(increase) in trade and other
    receivables                                        (11)          (7)         12
   Increase/(decrease) in trade and other
    payables                                           (16)         (69)       (53)
   Foreign exchange loss/(gain)                          81          (2)       (65)
   Share based payment                                   13            -      (140)
   Taxation (paid)                                        -            -          -
                                                  ---------  -----------  ---------
   Net cash used in operating activities              (134)        (337)      (707)
   Cash flows from investing activities
   Disposal proceed from sale of financial
    investments                                       2,533        1,048      6,939
   Payment for financial investments                (5,613)         (80)    (1,737)
                                                  ---------  -----------  ---------
   Net cash (used in) investing activities          (3,080)          968      5,202
   Net change in cash and cash equivalents          (3,214)          631      4,515
                                                  ---------  -----------  ---------

     Cash and cash equivalents at beginning
     of period                                        4,560           45         45
                                                  ---------  -----------  ---------
   Cash and cash equivalents at end of
    period                                            1,346          676      4,560
                                                  ---------  -----------  ---------
Notes to the condensed interim financial statements
1. General Information
The condensed interim financial information for the 6 months to
30 June 2021 does not constitute statutory accounts for the
purposes of Section 434 of the Companies Act 2006 and has not been
audited or reviewed. No statutory accounts for the period have been
delivered to the Registrar of Companies.
The condensed interim financial information in respect of the
year ended 31 December 2020 has been produced using extracts from
the statutory accounts for that period. Consequently, this does not
constitute the statutory information (as defined in section 434 of
the Companies Act 2006) for the year ended 31 December 2020, which
was audited. The statutory accounts for this period have been filed
with the Registrar of Companies. The auditors' report was
unqualified and did not contain a statement under Sections 498 (2)
or 498 (3) of the Companies Act 2006.
The auditor's report was approved by the Directors on 07 June
2021 and is available on the Company's website at
www.primorusinvestments.com .
Basis of preparation and accounting
The financial information has been prepared on the historical
cost basis. The Company's business activities, together with the
factors likely to affect its future development, performance and
position are set out in the Chairman's Statement. This statement
also includes a summary of the Company's financial position and its
cash flows.
These condensed interim financial statements have been prepared
in accordance with International Financial Reporting Standards
(IFRS) as adopted by the European Union with the exception of
International Accounting Standard ('IAS') 34 -- Interim Financial
Reporting. Accordingly, the interim financial statements do not
include all of the information or disclosures required in the
annual financial statements and should be read in conjunction with
the Company's 2020 annual financial statements.
2. Earnings per share
Earnings per ordinary share has been calculated using the
weighted average number of shares in issue during the period. The
weighted average number of equity shares in issue was 139,830,968.
IAS 33 requires presentation of diluted EPS when a company could be
called upon to issue shares that would decrease earnings per share
or increase the loss per share.
                                              Six months   Six months   Year ended
                                                      to           to
                                                 30 June      30 June  31 December
                                                    2021         2020         2020
                                             (Unaudited)  (Unaudited)    (Audited)
                                                             restated
                                               (GBP'000)    (GBP'000)    (GBP'000)
  Net profit/(loss) attributable to equity
   holders of
   the company                                     (115)        3,292        (401)
  Weighted average number of shares          139,830,968  139,830,968  139,830,968
  Weighted average number of diluted
   shares                                    151,830,968  157,630,968  139,830,968
  Basic (loss)/profit per share (pence)           (0.08)         2.35         2.98
  Diluted (loss)/profit per share (pence)         (0.08)         2.09         2.98
-------------------------------------------  -----------  -----------  -----------

   3.       Events after the reporting date
There are no events after the end of the reporting date to
disclose that have not already been the subject of an announcement
by the Company.
, the news service of the London Stock Exchange. RNS is approved by
the Financial Conduct Authority to act as a Primary Information
Provider in the United Kingdom. Terms and conditions relating to
the use and distribution of this information may apply. For further
information, please contact rns@lseg.com or visit www.rns.com.
RNS may use your IP address to confirm compliance with the terms
and conditions, to analyse how you engage with the information
contained in this communication, and to share such analysis on an
anonymised basis with others as part of our commercial services.
For further information about how RNS and the London Stock Exchange
use the personal data you provide us, please see our Privacy
Policy.
END
IR DBGDCLUGDGBC
(END) Dow Jones Newswires
September 10, 2021 02:00 ET (06:00 GMT)
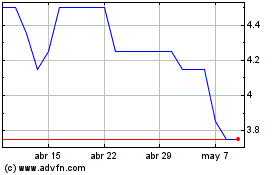
Primorus Investments (LSE:PRIM)
Gráfica de Acción Histórica
De Mar 2024 a Abr 2024

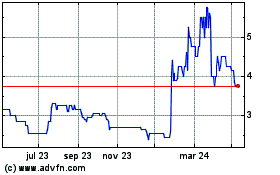
Primorus Investments (LSE:PRIM)
Gráfica de Acción Histórica
De Abr 2023 a Abr 2024
