Latest Ethereum price and analysis (ETH to USD)
20 Febrero 2020 - 12:44PM
Coin Rivet
Ethereum has remained in a more bullish formation despite
delivering a double top on the daily chart. The $286 level remains
a key area of resistance for Ethereum following two rejections in
the past seven days. However, despite sliding all the way down to
$237, it hasn’t closed a daily candle below the $258 level of
support. This exemplifies the strength and optimism surrounding
Ethereum at the moment, which has been bolstered by its outstanding
106% rally since the turn of the year. It is also trading above all
key moving average which demonstrates that momentum from a
short-term perspective is certainly on the up. The daily 50 EMA
also crossed the 200 EMA to the upside on February 10
The post
Latest Ethereum price and analysis (ETH to USD) appeared first
on Coin Rivet.
...
Continue reading Latest Ethereum price and analysis
(ETH to USD)
The post
Latest Ethereum price and analysis (ETH to USD)
appeared first on
Coin Rivet.
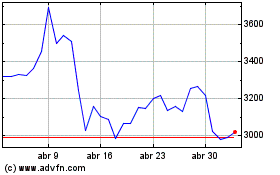
Ethereum (COIN:ETHUSD)
Gráfica de Acción Histórica
De Mar 2024 a Abr 2024

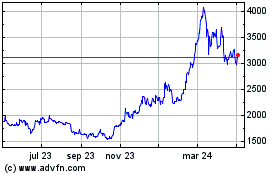
Ethereum (COIN:ETHUSD)
Gráfica de Acción Histórica
De Abr 2023 a Abr 2024
