TIDMCPG
RNS Number : 5013A
Compass Group PLC
30 September 2020
Legal Entity Identifier (LEI): No. 2138008M6MH9OZ6U2T68
30 September 2020
Pre-Close Trading Update
This statement updates investors on the Group's progress in the
current financial year, ahead of the announcement on 24 November
2020 of our results for the year to 30 September 2020.
Group
The Group's organic revenue performance in the fourth quarter
improved as clients in Education and Business & Industry began
to return to schools and offices in our main markets.
                           Organic revenue
                  Q3 2020    Q4 2020 [1]   FY 2020(1)
                ----------
 North America     (45)%       c(38)%        c(19)%
                ----------  ------------  -----------
 Europe          (53)% [2]     c(39)%        c(25)%
                ----------  ------------  -----------
 Rest of World   (21)% [3]     c(18)%        c(9)%
                ----------  ------------  -----------
 Group             (44)%       c(36)%        c(19)%
                ----------  ------------  -----------
The reopening of units and initial increase in volumes, combined
with positive contract renegotiations and a relentless focus on
efficiencies are expected to improve the Group's fourth quarter
operating margin to breakeven, before any contract impairments. We
are reviewing our contract portfolio [4] and at this preliminary
stage we estimate, subject to audit, that we will have to impair
around GBP100 million(1, [5]) of contract assets. Including
estimated contract impairments, the fourth quarter underlying
operating margin is expected to be around (3)%(1) (Q3 2020: (5.2)%)
[6] . The full year underlying operating profit margin is expected
to be around 3%(1, [7]) .
                                  Q4 2020 (1)   FY 2020
                                                  (1)
 Underlying operating margin          c0%        c3.5%
  pre- impairments
                                 ------------  --------
 Estimated contract impairments      c(3)%      c(0.5)%
                                 ------------  --------
 Underlying operating margin         c(3)%      c3% (7)
  after estimated impairments
                                 ------------  --------
Resizing costs in the fourth quarter were around GBP90
million(1) , bringing total FY2020 resizing costs to around GBP130
million(1) . These costs have been excluded from underlying
operating profit to avoid distorting the progress in the underlying
operating margin.
Regions
Performance in North America improved as clients in Education
began to re-open for the school year and Business & Industry
slowly started to recover. Healthcare remained strong, whilst our
Sports & Leisure business was still closed.
We have made some changes to our management structure in Europe.
As of the fourth quarter, our Middle East business has been managed
within our European business. Full restated numbers for Europe
including the Middle East and Rest of World excluding the Middle
East are included in the Appendix of this announcement.
In Europe - now including the Middle East - we saw continued
good performance in Healthcare and a meaningful increase in clients
reopening in both Business & Industry and Education across the
region. Our Sports & Leisure sector remained mostly closed.
In Rest of World - now excluding the Middle East - we saw an
improvement in Education in our Asia Pacific business, however we
did not see a material change in reopening rate in the rest of the
sectors around the region.
Tax
As a result of the distortive impact of unrelieved foreign taxes
and other non-tax-deductible expenses against a low profit base, we
expect the 2020 full year tax rate to be a few percentage points
higher than the HY 2020 rate of 24%.
Capital expenditure
Capital expenditure was around GBP175 million (1) in the fourth
quarter, mostly contractually committed spend but also included
investments to support new business wins in North America. FY 2020
capital expenditure is expected to be around GBP720 million (1)
.
Financial position
Our liquidity remains strong and we expect our liquidity at 30
September 2020, to be around GBP5 billion (1) (GBP2.8 billion in
undrawn credit facilities, GBP600 million available CCFF limit and
around GBP1.6 billion in cash (1) ). Our solid financial position
is allowing us to continue to invest in the business through the
crisis to strengthen our competitive advantages and support our
long-term growth prospects.
Currency
Trading results from our overseas operations are translated at
the average exchange rates for the period. At current spot rates
[8] , foreign exchange translation is expected to reduce 2019
reported revenue and underlying operating profit by around GBP355
million and GBP28 million respectively.
Summary
We are pleased with our progress in the quarter and that the
business is now at breakeven at a trading level. We continue to
proactively manage the business, reducing our costs, rebuilding our
margins and investing to strengthen our competitive advantages.
However, the pace at which our revenues and margins will recover
remains unclear, especially given the possible increase in lockdown
measures in the Northern Hemisphere through the winter months.
Despite the current challenges, when looking further ahead, we
remain excited about the significant structural market opportunity
globally, and the return to organic revenue growth, margin
improvement and returns to shareholders over time.
We will provide a further update on trading at our full year
results on 24 November 2020.
Enquiries
   Investors         Sandra Moura, Agatha Donnelly & Helen Javanshiri +44 (0) 1932 573000
   Press               Tim Danaher & Fiona Micallef-Eynaud, Brunswick   +44 (0) 207 404 5959
   Website           www.compass-group.com
APPIX
Regional Restatement
We have made minor changes to our regional reporting structure.
Our Europe region now includes the Middle East which is now
excluded from Rest of World. Our North America region remains
unchanged. To enable comparison with prior periods we are providing
restated 3 year historical figures for the new regional structure.
While these restatements affect regional results, they do not
affect the Group's overall income statement, balance sheet, or cash
flow.
 Reported figures GBP's million                           Full Year
                                                Europe                   ROW

                                         2020    2019    2018    2020   2019    2018
                                        ------  ------  ------  -----  ------  ------
 Revenue              Old                        6,160   6,050          3,298   3,379
-------------------
   Net restatement                                 231     206          (231)   (206)

   New                                           6,391   6,256          3,067   3,173
  -------------------------  -----------------  ------  ------  -----  ------  ------

 Organic revenue
  growth              Old                         5.1%    3.0%           2.4%    1.4%
-------------------
   New                                            5.2%    3.1%           2.0%    1.1%
  -------------------------  -----------------  ------  ------  -----  ------  ------

 Operating profit     Old                    .     389     414            264     257
-------------------
   Net restatement                                  32      23           (32)    (23)

   New                                             421     437            232     234
  -------------------------  -----------------  ------  ------  -----  ------  ------

 Margin               Old                         6.3%    6.8%           8.0%    7.6%
-------------------
   New                                            6.6%    7.0%           7.6%    7.4%
  -------------------------  -----------------  ------  ------  -----  ------  ------

 Cash flow            Old                          380     420            269     187
-------------------
   Net restatement                                  25      21           (25)    (21)

   New                                             405     441            244     166
  -------------------------  -----------------  ------  ------  -----  ------  ------

 ROCE                 Old                        10.0%   10.9%          31.8%   29.8%
-------------------
   New                                           10.8%   11.6%          28.6%   27.7%
  -------------------------  -----------------  ------  ------  -----  ------  ------


 Reported figures in GBP's million                         Half Year
                                                 Europe                    ROW

                                          2020    2019    2018    2020    2019    2018
                                        -------  ------  ------  ------  ------  ------
 Revenue              Old                 3,061   3,130   3,072   1,474   1,647   1,688
-------------------
  Net restatement                           124     114     100   (124)   (114)   (100)

  New                                     3,185   3,244   3,172   1,350   1,533   1,588
 -------------------------------------  -------  ------  ------  ------  ------  ------

 Organic revenue
  growth              Old                (4.3%)    6.4%    1.5%    3.1%    1.4%    1.7%
-------------------
  New                                    (3.9%)    6.4%    1.6%    2.6%    1.0%    1.6%
 -------------------------------------  -------  ------  ------  ------  ------  ------

 Operating profit     Old                   148     205     210      91     108     111
-------------------
  Net restatement                            17      14      12    (17)    (14)    (12)

  New                                       165     219     222      74      94      99
 -------------------------------------  -------  ------  ------  ------  ------  ------

 Margin               Old                  4.8%    6.5%    6.8%    6.2%    6.6%    6.6%
-------------------
  New                                      5.2%    6.8%    7.0%    5.5%    6.1%    6.2%
 -------------------------------------  -------  ------  ------  ------  ------  ------

 Cash flow            Old                    77     170     192      66     120      76
-------------------
  Net restatement                            24      11     (0)    (24)    (11)       0

  New                                       101     181     192      42     109      76
 -------------------------------------  -------  ------  ------  ------  ------  ------
Note to Editors
a) Compass Group PLC is the world's leading food service
company, which generated annual revenues of GBP25.2 billion in the
year to 30 September 2019. The Company specialises in providing
food and a range of support services across the core sectors of
Business & Industry, Healthcare & Seniors, Education,
Sports & Leisure and Defence, Offshore & Remote, with an
established brand portfolio.
b) Organic revenue growth, a term used throughout the
announcement, is calculated by adjusting for acquisitions
(excluding current period acquisitions and including a full period
in respect of prior period acquisitions), disposals (excluded from
both periods) and exchange rate movements (translating the prior
period at current period exchange rates).
c) Forward looking statements
Certain information included in this announcement is
forward-looking and involves risks, assumptions and uncertainties
that could cause actual results to differ materially from those
expressed or implied by forward-looking statements. Forward-looking
statements cover all matters which are not historical facts and
include, without limitation, projections relating to results of
operations and financial conditions and the Company's plans and
objectives for future operations, including, without limitation,
discussions of expected future revenues, financing plans, expected
expenditures and divestments, risks associated with changes in
economic conditions, the strength of the foodservice and support
services markets in the jurisdictions in which the Group operates,
fluctuations in food and other product costs and prices and changes
in exchange and interest rates. Forward-looking statements can be
identified by the use of forward-looking terminology, including
terms such as "believes", "estimates", "anticipates", "expects",
"forecasts", "intends", "plans", "projects", "goal", "target",
"aim", "may", "will", "would", "could" or "should" or, in each
case, their negative or other variations or comparable terminology.
Forward-looking statements are not guarantees of future
performance. All forward-looking statements in this announcement
are based upon information known to the Company on the date of this
announcement. Accordingly, no assurance can be given that any
particular expectation will be met and readers are cautioned not to
place undue reliance on forward-looking statements, which speak
only at their respective dates. Additionally, forward-looking
statements regarding past trends or activities should not be taken
as a representation that such trends or activities will continue in
the future. Other than in accordance with its legal or regulatory
obligations (including under the UK Listing Rules and the
Disclosure Guidance and Transparency Rules of the Financial Conduct
Authority), the Company undertakes no obligation to publicly update
or revise any forward-looking statement, whether as a result of new
information, future events or otherwise. Nothing in this
announcement shall exclude any liability under applicable laws that
cannot be excluded in accordance with such laws.
d) A copy of this release, together with all other recent
announcements and presentations can be found on Compass Group's
website at www.compass-group.com .
[1] Expected figures based on unaudited positions.
[2] Restated to include Middle East.
[3] Restated to exclude Middle East.
[4] As per IAS 36 - Impairment of assets and as per IAS 37 -
Provisions, Contingent Liabilities and Contingent Assets.
[5] Of the GBP100m charge, around half is in North America and
the other half in Europe.
[6] Excluding Q3 resizing costs of GBP42m.
[7] Excluding full year resizing costs of around GBP130m.
[8] Closing rates as at 25 September 2020.
This information is provided by RNS, the news service of the
London Stock Exchange. RNS is approved by the Financial Conduct
Authority to act as a Primary Information Provider in the United
Kingdom. Terms and conditions relating to the use and distribution
of this information may apply. For further information, please
contact rns@lseg.com or visit www.rns.com.
RNS may use your IP address to confirm compliance with the terms
and conditions, to analyse how you engage with the information
contained in this communication, and to share such analysis on an
anonymised basis with others as part of our commercial services.
For further information about how RNS and the London Stock Exchange
use the personal data you provide us, please see our Privacy
Policy.
END
TSTKKCBBOBKDACB
(END) Dow Jones Newswires
September 30, 2020 02:00 ET (06:00 GMT)
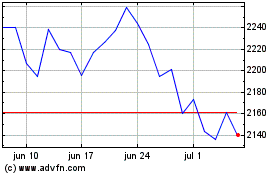
Compass (LSE:CPG)
Gráfica de Acción Histórica
De Mar 2024 a Abr 2024

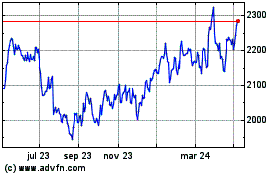
Compass (LSE:CPG)
Gráfica de Acción Histórica
De Abr 2023 a Abr 2024
