Bitcoin Stuck: Here Are 2 Things That Must Happen For BTC To Break $72,000
13 Junio 2024 - 3:00PM
NEWSBTC
At spot rates, Bitcoin is firm, but traders doubt the uptrend
following the unexpected dump on June 11. Currently, Bitcoin is
stable, trending above $67,000 and down despite gains on June 12.
Still, even at this level, there are concerns because the coin,
despite all the confidence across the board, remains below $72,000.
This reaction line is emerging as a key liquidation area. If
broken, BTC could unleash a wave of short liquidation, accelerating
the lift-off to $74,000 and beyond. Will Bitcoin Demand Soar In
Spot Markets? Taking to X, one on-chain analyst said that Bitcoin
is stagnating at spot levels below $72,000 because hedge funds are
short on futures. Related Reading: Solana On-Chain Indicators
Suggests A Return Of Bullish Sentiment, Is It Time To Buy SOL?
Though this has been a known development for a while, hedge funds
have stacked their BTC shorts via the Chicago Mercantile Exchange
(CME) by over $1 billion in the last week alone. Therefore, the
analyst says two things must happen to reverse this effect and
support prices. Although the BTC shorting on CME is not necessarily
a bearish signal, hedge funds are hedging by playing a
sophisticated arbitrate strategy, and coin holders must look at
fundamentals. Hedge funds are simultaneously shorting BTC futures
on CME and buying on the spot market. Therefore, for the coin to
break $72,000 and pierce $74,000, the analyst said users must buy
at least 2X the amount of BTC futures shorted in the spot market.
BTC Prices Must Fall For Short Sellers To Exit If there is no
incentive to lift spot prices higher, then Bitcoin prices must
fall. Falling prices will encourage short sellers, in this case,
the hedge funds, to exit their positions lest they continue paying
funding rates. In a bearish market, and when futures prices begin
to fall, short sellers must pay longs for the index not to deviate.
Whether there will be a spike in demand in the spot market remains
to be seen. However, what’s evident is that institutional interest
in Bitcoin is there, only that hedge funds, as seen from their
arbitrage trade using CME, want to profit, regardless of price
movements. Related Reading: Dogecoin Under Pressure And ‘Going To
Zero’, Analyst Says – Here’s Why The analyst also shared another
chart to solidify the bullish outlook. The trader used the “Growth
Rate” metric to compare changes in Bitcoin’s market and realized
cap. Currently, the metric is at around 0.001, way below 0.002,
meaning the market is highly likely overheated. Bulls might be
preparing to make a comeback. Feature image from DALLE, chart from
TradingView
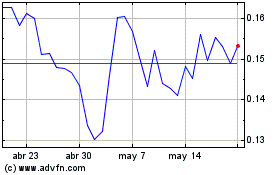
Dogecoin (COIN:DOGEUSD)
Gráfica de Acción Histórica
De May 2024 a Jun 2024

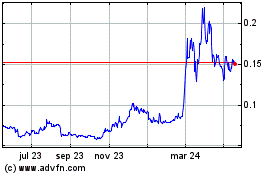
Dogecoin (COIN:DOGEUSD)
Gráfica de Acción Histórica
De Jun 2023 a Jun 2024
