UNITED STATES
SECURITIES AND EXCHANGE COMMISSION
Washington, DC 20549
FORM 6-K
REPORT OF FOREIGN PRIVATE ISSUER
PURSUANT TO RULE 13a-16 OR 15d-16
UNDER THE SECURITIES EXCHANGE ACT OF 1934
For the month of May, 2024.
Commission File Number 001-38755
Suzano S.A.
(Exact name of registrant as specified in its charter)
SUZANO INC.
(Translation of Registrant’s Name into English)
Av. Professor Magalhaes Neto, 1,752
10th Floor, Rooms 1010 and 1011
Salvador, Brazil 41 810-012
(Address of principal executive office)
Indicate by check mark whether the registrant files or will file annual reports under cover of Form 20-F or Form 40-F.
Form 20-F ☒ Form 40-F ☐
Indicate by check mark if the registrant is submitting the Form 6-K in paper as permitted by Regulation S-T Rule 101(b)(1): ☐
Indicate by check mark if the registrant is submitting the Form 6-K in paper as permitted by Regulation S-T Rule 101(b)(7): ☐
Enclosures:
SIGNATURE
Pursuant to the requirements of the Securities Exchange Act of 1934, the registrant has duly caused this report to be signed on its behalf by the undersigned, thereunto duly authorized.
Date: May 09, 2024
| | | | | | | | |
| | SUZANO S.A. |
| | |
| By: | /s/ Marcelo Feriozzi Bacci |
| Name: | Marcelo Feriozzi Bacci |
| Title: | Chief Financial and Investor Relations Officer |
| | | | | | | | | | | | | | | | | |
| EXHIBIT 99.1 EARNINGS RELEASE
1Q24 | |
| | |
More favorable market scenario
starts benefiting results in the period
São Paulo, May 9, 2024. Suzano S.A. (B3:SUZB5 | NYSE: SUZ), one of the world’s largest integrated pulp and paper producers, announces today its consolidated results for the first quarter of 2024 (1Q24).
HIGHLIGHTS
•Pulp sales of 2,401 thousand tons (-2% vs. 1Q23).
•Paper sales1 of 313 thousand tons (12% vs. 1Q23).
•Adjusted EBITDA2 and Operating cash generation3: R$4.6 billion and R$2.5 billion, respectively.
•Adjusted EBITDA2/ton from pulp of R$1,625/ton (-25% vs. 1Q23).
•Adjusted EBITDA2/ton from paper of R$2,097/ton (-28% vs. 1Q23).
•Average net pulp price in export market: US$624/ton (-13% vs. 1Q23).
•Average net paper price1 of R$6,713/ton (-9% vs. 1Q23).
•Pulp cash cost ex-downtime of R$812/ton (-13% vs. 1Q23).
•Leverage of 3.5 times in USD and 3.6 times in BRL.
•Cerrado Project completes 94% of physical progress and 87% of financial progress up to April 2024.
| | | | | | | | | | | | | | | | | | | | |
| Financial Data (R$ million) | 1Q24 | 4Q23 | Δ Q-o-Q | 1Q23 | Δ Y-o-Y | LTM 1Q24 |
| Net Revenue | 9,459 | 10,372 | -9% | 11,276 | -16% | 37,938 |
Adjusted EBITDA2 | 4,558 | 4,505 | 1% | 6,155 | -26% | 16,676 |
Adjusted EBITDA Margin2 | 48% | 43% | 5 p.p. | 55% | -7 p.p. | 44% |
| Net Financial Result | (3,040) | 2,269 | - | 2,470 | - | 271 |
| Net Income | 220 | 4,515 | -95% | 5,243 | -96% | 9,084 |
Operating Cash Generation3 | 2,499 | 2,779 | -10% | 4,689 | -47% | 9,377 |
Net Debt/ Adjusted EBITDA2 (x) (R$) | 3.6 x | 3.0 x | 0.6 x | 1.9 x | 1.7 x | 3.6 x |
Net Debt/ Adjusted EBITDA2 (x) (US$) | 3.5 x | 3.1 x | 0.4 x | 1.9 x | 1.6 x | 3.5 x |
| | | | | | | | | | | | | | | | | | | | |
| Operational Data ('000 tons) | 1Q24 | 4Q23 | Δ Q-o-Q | 1Q23 | Δ Y-o-Y | LTM 1Q24 |
| Sales | 2,714 | 3,148 | -14% | 2,735 | -1% | 11,485 |
| Pulp | 2,401 | 2,761 | -13% | 2,455 | -2% | 10,161 |
Paper1 | 313 | 386 | -19% | 280 | 12% | 1,324 |
1 Considers the results of the Consumer Goods Unit (tissue). | 2 Excluding non-recurring items. | 3 Considers Adjusted EBITDA less sustaining capex (cash basis).
The consolidated quarterly information has been prepared in accordance with the Securities and Exchange Commission (CVM) and Accounting Standards Committee (CPC) standards and is in compliance with International Accounting Standard (IFRS) issued by the International Accounting Standard Board (IASB). The data contained in this document was obtained from the financial information as made available to the CVM. The operating and financial information is presented based on consolidated numbers in Reais (R$). Summaries may diverge due to rounding.
CONTENTS
EXECUTIVE SUMMARY
The performance of the pulp market remained favorable during the first quarter of 2024, which reflected in another round of price increases, but which was not fully captured in the results of the period. Operational performance remained in line with the plan, with cash cost of production remaining stable without the effect of scheduled maintenance downtimes. This combination of factors resulted in an important increase in adjusted EBITDA per ton from pulp compared to the previous quarter. At the paper business unit, sales volume decreased chiefly due to seasonality, while prices remained stable. As such, consolidated adjusted EBITDA in the quarter totaled R$4.6 billion, while operating cash flow reached R$2.5 billion.
As for financial management, net debt in USD increased to US$11.9 billion, mainly due to the largest investment cycle in the Company’s history aimed at generating significant and sustainable value in the long term. Leverage in USD stood at 3.5 times, in line with the financial policy, an increase explained by the reduction in Adjusted EBITDA in the last 12 months and the increase in net debt. The hedging policy continued to play its part, bringing in a positive cash inflow of R$0.4 billion.
Continuing the advances made in its strategy, within the context of the “Maintain relevance in pulp” and “Be ‘best-in-class’ in the total pulp cost vision” avenues, the physical progress of Cerrado Project remains as expected, reaching 94%, while financial progress was 87% by the end of April.
Lastly, regarding the “Playing a leading role in sustainability” avenue, Suzano announced that it has adopted the recommendations of the Taskforce on Nature-related Financial Disclosures (TNFD), being one of the first Brazilian companies to commit to the initiative dedicated to creating an instrument for managing and disclosing risks and opportunities so that organizations can report and act on potential impacts related to nature.The performance of the pulp market remained favorable during the first quarter of 2024, which reflected in another round of price increases, but which was not fully captured in the results of the period. Operational performance remained in line with the plan, with cash cost of production remaining stable without the effect of scheduled maintenance downtimes. This combination of factors resulted in an important increase in adjusted EBITDA per ton from pulp compared to the previous quarter. At the paper business unit, sales volume decreased chiefly due to seasonality, while prices remained stable. As such, consolidated adjusted EBITDA in the quarter totaled R$4.6 billion, while operating cash flow reached R$2.5 billion.
As for financial management, net debt in USD increased to US$11.9 billion, mainly due to the largest investment cycle in the Company’s history aimed at generating significant and sustainable value in the long term. Leverage in USD stood at 3.5 times, in line with the financial policy, an increase explained by the reduction in Adjusted EBITDA in the last 12 months and the increase in net debt. The hedging policy continued to play its part, bringing in a positive cash inflow of R$0.4 billion.
Continuing the advances made in its strategy, within the context of the “Maintain relevance in pulp” and “Be ‘best-in-class’ in the total pulp cost vision” avenues, the physical progress of Cerrado Project remains as expected, reaching 94%, while financial progress was 87% by the end of April.
Lastly, regarding the “Playing a leading role in sustainability” avenue, Suzano announced that it has adopted the recommendations of the Taskforce on Nature-related Financial Disclosures (TNFD), being one of the first Brazilian companies to commit to the initiative dedicated to creating an instrument for managing and disclosing risks and opportunities so that organizations can report and act on potential impacts related to nature.
PULP BUSINESS PERFORMANCE
PULP SALES VOLUME AND REVENUE
The first quarter of the year was marked by paper production above expectations and low pulp inventories across the chain, which, combined with higher lead time due to logistical constraints, resulted in lower supply than demand, creating favorable market fundamentals for increases in pulp price in all regions.
In China, especially after the Chinese New Year, production by paper lines that mostly use hardwood pulp (sanitary papers, printing and writing papers and paperboard) registered a significant increase of 6% year on year. During the quarter, prices in all paper segments were below than in the same period last year, but increased gradually during 1Q24 and, in March, were higher than in January.
In the European market, demand for pulp surprised positively in the quarter, coming above expectations at the end of last year. Hardwood consumption grew 14% in the region in 1Q24 compared to the same period last year. The Red Sea crisis and strikes in Finland, which led to lower operational availability of local producers, contributed to lower supply than demand. In North America, demand for sanitary papers continues positive in response to increases in pulp prices.
Regarding the supply of chemical pulp (BCP) in the first quarter, the low inventory levels across the chain and restricted supply due to unscheduled events, especially strikes in Finland and logistics bottlenecks such as the Red Sea Crisis, had a negative effect on pulp availability.
Average PIX/FOEX prices of hardwood pulp in the quarter increased 6% in China and 23% in Europe compared to 4Q23. The difference between softwood and hardwood pulp prices in the quarter was US$82/t in China and US$208/t in Europe, in line with healthy levels.
Suzano’s pulp sales decreased from the previous quarter due to seasonal effects in the period, as well as the need of partial restocking, totaling 2,401 thousand tons, down 13% from 4Q23 and 2% from 1Q23.
Pulp Sales Volume ('000 tons)
Average net price in USD of pulp sold by Suzano was US$619/t, increasing 9% from 4Q23 and decreasing 14% from 1Q23. In the export market, average net price charged by the Company was US$624/t, up 9% from 4Q23 and down 13% from 1Q23. Average net price in BRL was R$3,066/ton in 1Q24, up 9% from 4Q23, due to the better price scenario in China and Europe. Compared to 1Q23, the 18% reduction was mainly due to the lower average net price in USD during the period and the 5% decline in average USD versus average BRL.
Average Net Price (USD/t)
Net revenue from pulp decreased 5% from 4Q23, due to lower sales volume (-13%), partially offset by the higher net average price in USD (+9%). Compared to 1Q23, revenue decreased 20% due to the lower net average price in USD (-14%), the decline in average USD against average BRL (-5%) and lower sales volume (-2%).
Pulp Net Revenue (R$ million)
PULP CASH COST
Though the Company did not carry out scheduled maintenance downtimes in 1Q24, there was an effect of R$15/ton on cash cost in the period due to the application of Regulatory Standard 13 (Inspection of Boilers and Pressure Vessels), which, in July 2022, altered the maximum period for inspecting recovery boilers from 15 months to 18 months. This change in the standard required a short intermediary interruption (40-60 hours) to wash the recovery boiler in order to maintain the operational stability of mills during the longest period between general downtimes. Note that this measure is necessary to obtain the benefits of extending general downtimes, which result in better cost performance and increased production due to fewer scheduled downtimes in the long term (one less every four years). The impact on the quarter was due to costs with washing the boilers at Jacareí and Mucuri.
Consolidated Pulp Cash Cost
ex-maintenance downtime (R$/ton)
Cash cost excluding downtime in 1Q24 stood at R$812/t, stable in comparison with 4Q23, due to: i) lower wood cost, mainly due to the reduction in average radius and lower diesel prices, as well as better operational performance during harvest. These effects were partially offset by higher logistics costs mainly due to the modal mix; and ii) lower chemical prices (especially of caustic soda caused by lower international prices - HIS). The positive factors of cash cost were offset by higher input consumption (energy) and higher fixed cost, affected by more interventions for maintenance at some mills.
Consolidated Pulp Cash Cost ex-maintenance (R$/ton)1
¹ Excludes the impact of maintenance and administrative downtimes.
Cash cost excluding downtime in 1Q24 was 13% lower than in 1Q23, due to: i) lower prices of inputs, especially chemicals (especially of caustic soda due to lower international prices (HIS) and energy (lower natural gas prices due to the decline in Brent prices); ii) the lower consumption of inputs (especially natural gas, caustic soda and lime) as a result of the benefits reaped from the higher energy efficiency project at the Jacareí mill and greater operational efficiency of mills; iii) lower specific wood consumption and lower wood costs, mainly due to lower diesel prices during the period, lower logistics costs (modal mix and efficiency gains) and higher yield from the harvest; and iv) the decline in average USD versus BRL (-5%). The positive effects on cash cost were partially offset by higher fixed costs and lower revenue from utilities.
Consolidated Pulp Cash Cost ex-maintenance (R$/ton)1
¹ Excludes the impact of maintenance and administrative downtimes.
¹ Based on cash cost excluding downtimes. Excludes energy sales.
PULP SEGMENT EBITDA
| | | | | | | | | | | | | | | | | | | | |
| Pulp Segment | 1Q24 | 4Q23 | Δ Q-o-Q | 1Q23 | Δ Y-o-Y | LTM 1Q24 |
| Adjusted EBITDA (R$ million)¹ | 3,902 | 3,756 | 4% | 5,336 | -27% | 13,761 |
| Sales volume (k ton) | 2,401 | 2,761 | -13% | 2,455 | -2% | 10,161 |
| Pulp adjusted¹ EBITDA (R$/ton) | 1,625 | 1,360 | 19% | 2,174 | -25% | 1,354 |
¹ Excludes non-recurring items.
Adjusted EBITDA from pulp increased 4% from 4Q23 due to the higher net average pulp price in USD (+9%), partially offset by the lower sales volume in the period (-13%). The 19% increase in adjusted EBITDA per ton is explained by price effect, as mentioned previously.
Compared to 1Q23, the 27% decrease in Adjusted EBITDA from pulp reflects: i) the lower net pulp price in USD (-14%); ii) the decline in average USD against average BRL (-5%); iii) the lower sales volume (-2%); and iv) to higher G&A, mainly due to higher expenses with variable compensation. These factors were partially offset by the lower COGS cash basis, which was benefited from the lower cash production cost and lower impacts from scheduled downtimes. In the analysis of adjusted EBITDA per ton, the 25% reduction in the indicator occurred due to the same reasons, ex-volumes.
Adjusted EBITDA1 (R$ million) and Adjusted EBITDA Margin (%) of Pulp
¹ Excludes non-recurring items.
Pulp Adjusted EBITDA per Ton (R$/t)
OPERATING CASH FLOW FROM THE PULP SEGMENT
| | | | | | | | | | | | | | | | | | | | |
| Pulp Segment (R$ million) | 1Q24 | 4Q23 | Δ Q-o-Q | 1Q23 | Δ Y-o-Y | LTM 1Q24 |
Adjusted EBITDA1 | 3,902 | 3,756 | 4% | 5,336 | -27% | 13,761 |
Maintenance Capex2 | (1,894) | (1,531) | 24% | (1,338) | 42% | (6,584) |
| Operating Cash Flow | 2,008 | 2,225 | -10% | 3,998 | -50% | 7,177 |
¹ Excludes non-recurring items.
² Cash basis.
Operating cash generation per ton in the pulp segment was 4%% higher than in 4Q23 due to higher EBITDA per ton, which was partially offset by higher sustaining capex per ton. In relation to 1Q23, operating cash generation per ton in the pulp segment decreased 49% due to lower EBITDA per ton and higher sustaining capex per ton.
Operating Cash Flow of Pulp per ton (R$/t)
PAPER BUSINESS PERFORMANCE
The following data and analyses incorporate the joint results of the paper and consumer goods (tissue) businesses.
PAPER SALES VOLUME AND REVENUE
According to data published by Brazil's Forestry Industry Association (IBÁ), demand for Printing and Writing in Brazil, including imports, decreased 20% in the first two months of 1Q24 compared to the same period last year.
Early this year, apart from the expected reduction in coated paper destined for the promotional segment on account of structural changes in consumption patterns, other factors adversely affected sales of uncoated paper, related to uncertainties and adjustments in textbook purchase programs. On the other hand, demand for uncoated paper, mainly destined to offices (cut size), has stayed resilient on the back of high formal employment and increase on return to on-site activities.
In the international markets, demand for Printing & Writing papers increased, due to the end of the destocking cycle and the increase of buying levels, which had a positive impact on sales in mature markets despite a scenario of macroeconomic uncertainties. In Latin America, ex Brasil, demand remained strong at the start of the year, especially in the uncoated paper segment.
Demand for paperboard in Brazil, Suzano’s flagship market for this product line, declined 6% in the first two months of 1Q24 compared to the same period last year, still reflecting inventory adjustments across the chain, albeit influenced by the consumption of population coming below expectations in certain segments.
Consolidating the market segments mentioned above (paper market accessible to Suzano), domestic sales decreased 16% in the first two months of 1Q24 compared to the same period in 1Q23. Despite a more challenging scenario in the domestic market, Suzano has been advancing on initiatives to maintain its solid results: following a unique go-to-market model, advancing on the strategy of winning new clients and expanding the regions served. Moreover, the Company’s operational flexibility and structural competitiveness enables it to adjust the allocations across markets and segments to achieve greater profitability. Finally, it continues to move ahead with its digital transformation initiatives, investing in its portfolio of innovative products targeted at the packaging and single-use plastic replacement segments.
With the acquisition of Kimberly Clark's tissue business in Brazil, the consumer goods segment has accounted for a bigger share of the paper business results since 3Q23.
Suzano’s paper sales (printing & writing, paperboard and tissue) in the domestic market totaled 209 thousand tons in 1Q24, down 22% from the previous quarter, mainly due to the historical seasonality effects. Compared to 1Q23, paper sales decreased 1%, due to the reduction in the printing & writing and paperboard lines, which was largely offset by the increase in sales in the tissue segment (resulting from the acquisition of Kimberly Clark’s tissue business in Brazil, concluded in June, 2023).
International paper sales totaled 104 thousand tons, a reduction of 12% compared to 4Q23, representing 33% of the total sales volume in 1Q24. The decline is explained by the seasonality of the period in the Printing & Writing segment. Compared to 1Q23, the increase was 49%, mainly explained by the improvement in demand, as mentioned earlier, in addition to the commercial strategy of volume allocation between markets (domestic and export) and segments.
Paper Sales Volume ('000 ton)1
¹ Includes the Consumer Goods Unit.
Average net price remained stable from the previous quarter due to optimization strategy in allocation between markets and segments (increase in domestic market price compensating for the decrease in foreign market price). Compared to 1Q23, the 9% decrease was due to price decreases in printing & writing paper and paperboard segments in the export market, where prices, much above historical levels, still reflected the increase in costs and the previously heated demand. Additionally, USD depreciated approximately 5% against the BRL during the period.
Average Net Paper Price (R$/t)1
Net revenue from paper sales amounted to R$2,099 million, down 19% from 4Q23, mainly due to the lower sales volume (-19%), while net average price remained stable. Compared to 1Q23, the increase of 1% was due to the 12% increase in sales volume partially offset by the 9% decline in the average net price, as well as the depreciation of the USD against the BRL of approximately 5% during the period.
Paper Net Revenues (R$ million)1
¹ Includes the Consumer Goods Unit.
PAPER SEGMENT EBITDA
| | | | | | | | | | | | | | | | | | | | |
| Paper Segment | 1Q24 | 4Q23 | Δ Q-o-Q | 1Q23 | Δ Y-o-Y | LTM 1Q24 |
Adjusted EBITDA (R$ million)1 | 656 | 748 | -12% | 818 | -20% | 2,916 |
| Sales volume (k ton) | 313 | 386 | -19% | 280 | 12% | 1,324 |
Paper adjusted1 EBITDA (R$/ton) | 2,097 | 1,936 | 8% | 2,921 | -28% | 2,203 |
¹ Excludes non-recurring items.
Adjusted EBITDA from paper decreased 12% from 4Q23, mainly due to lower sales volume (-19%), partially offset by the decrease in SG&A (lower expenses with variable compensation, logistics and sales) and in cash COGS (cash cost benefited by lower consumption and decrease in input prices). Adjusted EBITDA per ton increased 8% mainly due to lower SG&A expenses and lower cash production cost per ton, while average net price remained practically stable.
Compared to 1Q23, the 20% reduction was mainly due to the lower net average price (-9%) and the increase in SG&A (merger of Kimberly Clark and higher personnel expenses), partially offset by higher sales volume (+12%) and lower cash COGS (with emphasis on lower cash cost of production). The decrease in adjusted EBITDA per ton is explained by the same factors.
Adjusted EBITDA (R$ million) and Adjusted EBITDA Margin (%) of Paper
Paper Adjusted EBITDA (R$/t)
OPERATING CASH FLOW FROM THE PAPER SEGMENT
| | | | | | | | | | | | | | | | | | | | |
| Paper Segment (R$ million) | 1Q24 | 4Q23 | Δ Q-o-Q | 1Q23 | Δ Y-o-Y | LTM 1Q24 |
Adjusted EBITDA1 | 656 | 748 | -12% | 818 | -20% | 2,916 |
Maintenance Capex2 | (164) | (195) | -16% | (127) | 29% | (716) |
| Operating Cash Flow | 491 | 553 | -11% | 691 | -29% | 2,200 |
¹ Excludes non-recurring items.
² Cash basis.
Operating cash generation per ton in the paper segment was R$1,571/t in 1Q24, increasing 10% from 4Q23, driven by higher EBITDA per ton, which was partially offset by higher sustaining capex per ton. Compared to the same period last year, the decrease of 36% was due to lower EBITDA per ton and higher sustaining capex per ton.
Paper Operating Cash Generation per Ton (R$/t)
FINANCIAL PERFORMANCE
NET REVENUE
Suzano’s net revenue in 1Q24 was R$9,459 million, 78% of which came from exports (vs. 77% in 4Q23 and 81% in 1Q23). In relation to 4Q23, net revenue decreased 9% due to the lower sales volume in the period (-14%), partially offset by the higher net average pulp price in USD (+9%). The 16% reduction in consolidated net revenue in relation to 1Q23 is mainly due to the lower net average pulp price in USD (-14%), lower net average paper price (-9%) and the decline in average USD against average BRL (-5%).
| | | | | | | | | | | | | | | | | | | | | | | | | | | | | |
Net Revenue1 (R$ million) |
| | | | | | | | | |
| | | -16% | | | -9% | | | |
| | | | | | | |
| | | | | | | | | |
| | | | | | | | q |
¹ Does not include Portocel service revenue.
CALENDAR OF SCHEDULED MAINTENANCE DOWNTIMES
| | | | | | | | | | | | | | | | | | | | | | | | | | | | | | | | | | | | | | | | | | | | |
| Mill – Pulp capacity | 2023 | 2024 | 2025 |
| 1Q23 | 2Q23 | 3Q23 | 4Q23 | 1Q24 | 2Q24 | 3Q24 | 4Q24 | 1Q25 | 2Q25 | 3Q25 | 4Q25 |
| Aracruz - Mill A (ES) – 590 kt | | | | | | | | | | No downtime |
| Aracruz - Mill B (ES) – 830 kt | No downtime | | | | | | | | |
| Aracruz - Mill C (ES) – 920 kt | No downtime | | | | | No downtime |
| Imperatriz (MA)1 – 1,650 kt | | | | | | | | | No downtime |
| Jacareí (SP) – 1,100 kt | | | | | | | | | No downtime |
| Limeira (SP)² – 690 kt | | | | | | | | | | | | |
| Mucuri - Mill 1 (BA)² – 600 kt | | | | | No downtime | | | | |
| Mucuri - Mill 2 (BA) – 1,130 kt | | | | | | | | | No downtime |
| Ribas do Rio Pardo (MS) - 2,550 kt | N/A | No downtime | | | | |
| Suzano (SP)¹ – 520 kt | | | | | | | | | No downtime |
| Três Lagoas - Mill 1 (MS) – 1,300 kt | | | | | No downtime | | | | |
| Três Lagoas - Mill 2 (MS) – 1,950 kt | | | | | No downtime | | | | |
| Veracel (BA)² – 560 kt | | | | | | | | | | | | |
1 Includes integrated capacities and fluff.
2 Veracel is a joint operation between Suzano (50%) and Stora Enso (50%) with total annual capacity of 1,120 thousand tons.
COST OF GOODS SOLD (COGS)
| | | | | | | | | | | | | | | | | | | | |
| COGS (R$ million) | 1Q24 | 4Q23 | Δ Q-o-Q | 1Q23 | Δ Y-o-Y | LTM 1Q24 |
| COGS (Income statement) | 5,700 | 6,776 | -16% | 5,969 | -5% | 24,808 |
| (-) Depreciation, depletion and amortization | 1,706 | 1,904 | -10% | 1,520 | 12% | 6,905 |
| Cash COGS | 3,994 | 4,872 | -18% | 4,449 | -10% | 17,903 |
| Sales volume | 2,714 | 3,148 | -14% | 2,735 | -1% | 11,485 |
| Cash COGS/ton (R$/ton) | 1,471 | 1,548 | -5% | 1,627 | -10% | 1,559 |
Cash COGS in 1Q24 totaled R$3,994 million, or R$1,471/ton. Compared to 4Q23, cash COGS decreased by 18%, primarily due to: i) lower sales volume; ii) reversal of the provision for credit loss related to ICMS (1Q24: R$24 million | 4Q23: -R$86 million) resulting from the sale of credits during the tissue expansion project in Aracruz, as disclosed in a Material Fact on October 26, 2023; and iii) lower production costs (inventory turnover effect). These effects were partially offset by the impact of compliance with NR-13 (boiler washing) on cash costs, as explained above, and higher logistics costs, attributed to the mix of carriers serving clients in the Middle East (Red Sea crisis). On a per-ton basis, the 5% reduction is also explained by the same factors.
Compared to 1Q23, cash COGS decreased 10%, chiefly due to lower production cost ex-downtimes (as discussed previously), lower impact of scheduled maintenance downtimes and the decline in average USD against average BRL (-5%), partially offset by higher sales volume at paper business. On a per-ton basis, cash COGS decreased 10% year on year due to the same factors.
SELLING EXPENSES
| | | | | | | | | | | | | | | | | | | | |
| Selling Expenses (R$ million) | 1Q24 | 4Q23 | Δ Q-o-Q | 1Q23 | Δ Y-o-Y | LTM 1Q24 |
| Selling expenses (Income Statement) | 653 | 712 | -8% | 604 | 8% | 2,645 |
(-) Depreciation, depletion and amortization1 | 239 | 239 | 0% | 238 | 0% | 953 |
| Cash selling expenses | 414 | 473 | -12% | 367 | 13% | 1,692 |
| Sales volume | 2,714 | 3,148 | -14% | 2,735 | -1% | 11,485 |
| Cash selling expenses/ton (R$/ton) | 153 | 150 | 2% | 134 | 14% | 147 |
Cash selling expenses decreased 12% from 4Q23, mainly due to lower sales volume and lower expenses with third-party services (with marketing, IT, and consultancy being the main highlights). This reduction was partially offset by higher logistics expenses (inland freight, warehousing, and labor costs). Cash selling expenses per ton increased 2% due to higher logistics costs, as mentioned earlier.
In relation to 1Q23, the 13% increase in cash selling expenses is explained mainly by higher sales volume in the paper business, higher logistics expenses and higher costs with warehousing, labor and third-party services (mainly related to the acquisition of Kimberly Clark’s tissue assets in Brazil). These effects were partially offset by the drop in average USD versus BRL (-5%). Cash selling expenses per ton increased 14%, due to the same factors mentioned above.
GENERAL AND ADMINISTRATIVE EXPENSES
| | | | | | | | | | | | | | | | | | | | |
| General and Administrative Expenses (R$ million) | 1Q24 | 4Q23 | Δ Q-o-Q | 1Q23 | Δ Y-o-Y | LTM 1Q24 |
| General and Administrative Expenses | 503 | 615 | -18% | 390 | 29% | 2,036 |
(-) Depreciation, depletion and amortization1 | 34 | 33 | 3% | 27 | 26% | 127 |
| Cash general and administrative expenses | 469 | 582 | -19% | 363 | 29% | 1,909 |
| Sales volume | 2,714 | 3,148 | -14% | 2,735 | -1% | 11,485 |
| Cash general and administrative expenses/t (R$/ton) | 173 | 185 | -7% | 133 | 30% | 166 |
Compared to 4Q23, the 19% decrease in cash general and administrative expenses is mainly due to the decline in personnel expenses (variable compensation) and lower spending on third-party services. On a per-ton basis, these expenses decreased 7% due to the same factors.
Compared to 1Q23, cash general and administrative expenses increased 29% due to higher personnel expenses (mainly variable compensation) and third-party services. Both factor are also associated with the inclusion of expenses resulting from the acquisition of Kimberly Clark’s tissue business in Brazil. On a per-ton basis, the 30% increase is explained by the same factors.
Other operating income (expenses) was an expense of R$40 million in 1Q24, compared to an income of R$902 million in 4Q23 and an expense of R$21 million in 1Q23. The variation in relation to 4Q23 is mainly due to the absence of the updated fair value of biological assets (which happens in the second and fourth quarters of each year) and the increase in depreciation, amortization and other PPA expenses (due to the positive non-recurring effect in 4Q23). Compared to 1Q23, the variation is mainly explained by several less significant events.
ADJUSTED EBITDA
| | | | | | | | | | | | | | | | | | | | |
| Consolidated | 1Q24 | 4Q23 | Δ Q-o-Q | 1Q23 | Δ Y-o-Y | LTM 1Q24 |
| Adjusted EBITDA (R$ million)¹ | 4,558 | 4,505 | 1% | 6,155 | -26% | 16,676 |
| Adjusted EBITDA¹ Margin | 48% | 43% | 5 p.p | 55% | -6 p.p | 44% |
| Sales Volume (k ton) | 2,714 | 3,148 | -14% | 2,735 | -1% | 11,485 |
| Adjusted EBITDA¹/ton (R$/ton) | 1,679 | 1,431 | 17% | 2,250 | -25% | 1,452 |
¹ Excludes non-recurring items.
The 1% increase in Adjusted EBITDA in 1Q24 compared to 4Q23 is explained by: i) the higher average net pulp price in USD (+9%); and ii) lower SG&A cash basis (-16%), mainly due to lower administrative expenses, explained by lower personnel expenses (variable remuneration) and lower spending on third-party services, explained earlier. These factors were offset by lower sales volume in the period (-14%). Adjusted EBITDA per ton increased 17% due to the same factors explained above, excluding sales volume.
In relation to 1Q23, Adjusted EBITDA decreased 26% due to: i) the decrease of 14% in average net pulp price in USD and 9% in average net paper price in BRL; ii) the decline in average USD against average BRL (-5%); and iii) higher SG&A cash basis (+21%), chiefly due to higher administrative expenses mainly explained by higher personnel expenses (variable remuneration), as explained earlier. These factors were partially offset by lower cash COGS (-10%), mainly due to the production cost, as discussed previously. Adjusted EBITDA per ton decreased 25% due to the same factors, excluding sales volumes.
FINANCIAL RESULT
| | | | | | | | | | | | | | | | | | | | |
| Financial Result (R$ million) | 1Q24 | 4Q23 | Δ Q-o-Q | 1Q23 | Δ Y-o-Y | LTM 1Q24 |
| Financial Expenses | (1,130) | (1,175) | -4% | (1,159) | -3% | (4,631) |
| Interest on loans and financing (local currency) | (346) | (376) | -8% | (371) | -7% | (1,452) |
| Interest on loans and financing (foreign currency) | (885) | (884) | 0% | (781) | 13% | (3,423) |
| Capitalized interest¹ | 378 | 344 | 10% | 233 | 62 | 1,305 |
| Other financial expenses | (277) | (259) | 7% | (240) | 15% | (1,060) |
| Financial Income | 424 | 610 | -30% | 386 | 10% | 1,864 |
| Interest on financial investments | 409 | 565 | -28% | 277 | 48% | 1,801 |
| Other financial income | 15 | 45 | -67 | 109 | -86% | 63 |
| Monetary and Exchange Variations | (1,699) | 1,343 | - | 1,248 | - | 140 |
| Foreign exchange variations (Debt) | (2,072) | 2,024 | - | 1,511 | - | 603 |
| Other foreign exchange variations | 373 | (681) | - | (263) | - | (463) |
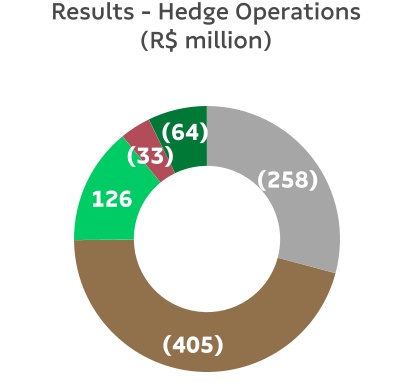
Derivative income (loss), net2 | (635) | 1,492 | - | 1,995 | - | 2,897 |
| Operating Cash flow hedge | (405) | 1,006 | - | 1,225 | - | 1,627 |
| Cash flow - Cerrado project hedge | (64) | 125 | - | 273 | - | 110 |
| Debt hedge | (258) | 299 | - | 484 | - | 790 |
| Others³ | 92 | 62 | 48% | 12 | - | 370 |
| Net Financial Result | (3,040) | 2,269 | - | 2,470 | - | 271 |
1 Capitalized interest related to work in progress.
2 Variation in mark-to-market adjustment (1Q24: R$916 million | 4Q23: R$1,994 million), plus adjustments paid and received (1Q24: = R$444 million).
3 Includes commodity hedge and embedded derivatives.
Financial expenses decreased 4% in relation to 4Q23, mainly due to the reduction in interest rates in domestic currency (1Q24: 11,28% p.a | 4Q23: 12,24% p.a), affecting the debt in BRL pegged to SELIC and CDI, in addition to the increase in capitalized interest due to the progress of the Cerrado Project. These effects were partially offset by the increase in IOF expenses (exchange operation) and inflation adjustment on lawsuits, both booked under Other financial expenses. Compared to 1Q23, financial expenses decreased 3%, with the increase in interest expenses in foreign currency (affected by the increase in the SOFR interest rate) were partially offset by the increase in capitalized interest.
Financial income declined 30% in relation to 4Q23, due to lower average cash balance and CDI rate in the period (1Q24: 11.28% p.a. | 4Q23: 12.24% p.a). Compared to 1Q23, financial income increased 10%, mainly due to the increase in U.S. interest rates (1Q24: 5.31% p.a. | 1Q23: 4.58% p.a. – reference is average SOFR interest rate) and average cash balance, partially offset by a decrease in other financial expenses related to interest on tax credits (non-recurring credits related to the exclusion of ICMS from PIS/COFINS tax bases, occurred in 1Q23).
Inflation adjustment and exchange variation had a negative impact of R$1,699 million on the Company’s financial result due to the 3% drop in BRL against USD at the close of 4Q23, which affected foreign currency debt by US$2,072 million (US$12,723 million at the end of 1Q24). This effect was partially offset by the positive result of exchange variation on other balance sheet items in foreign currency (R$373 million).
Note that the accounting impact of exchange variation on foreign currency debt has a cash impact only on the respective maturities.
Derivative operations resulted in a loss of R$635 million in 1Q24, due to the negative impact of weaker BRL and the increase in future estimations of SOFR and IPCA interest rates. The mark-to-market adjustment of derivative instruments on March 31, 2024 was positive at R$916 million, compared to R$1,994 million on December 31, 2023, representing a decrease of R$1,078 million. Note that the impact of BRL depreciation on the derivatives portfolio generates a cash impact only upon the respective maturities. The net effect on cash, which refers to the maturity of derivative operations in the first quarter, was a positive R$444 million (R$90 million gain on debt hedge, R$322 million gain on cash flow hedge and R$32 million gain from commodities).
As a result of the above factors, net financial result in 1Q24, considering all financial expense and income lines, was an expense of R$3,040 million, compared to an income of R$2,269 million in 4Q23 and an income of R$2,470 million in 1Q23.
DERIVATIVE OPERATIONS
Suzano carries out derivative operations exclusively for hedging purposes. The following table reflects the position of derivative instruments on March 31, 2024:
| | | | | | | | | | | | | | |
Hedge1 | Notional (US$ million) | Fair Value (R$ million) |
| Mar/24 | Dec/23 | Mar/24 | Dec/23 |
| Debt | 4,191 | 4,939 | (835) | (487) |
| Cash Flow – Operating (ZCC + NDF) | 5,607 | 4,844 | 1,330 | 1,958 |
| Cash Flow – Cerrado² (ZCC + NDF) | 231 | 424 | 111 | 274 |
Others3 | 394 | 437 | 310 | 250 |
| Total | 10,423 | 10,644 | 916 | 1,994 |
¹ See note 4 of the 3Q23 Quarterly Financial Statements (ITR) for further details and the fair value sensitivity analysis.
2 Hedge program related to capex in BRL (ZCC) and EUR (NDF) of the Cerrado Project.
³ Includes commodity hedging and embedded derivatives.
The Company’s foreign exchange exposure policy seeks to minimize the volatility of its cash generation and ensure greater flexibility in cash flow management. Currently, the policy stipulates that surplus dollars may be partially hedged (at least 40% and up to 75% of exchange variation exposure over the next 24 months) using plain vanilla instruments such as Zero Cost Collars (ZCC) and Non-Deliverable Forwards (NDF). At the end of 1Q24, 75% of the exchange variation exposure was covered.
Considering the foreign exchange exposure related to Capex in the Cerrado Project, since approximately 67% of Capex is pegged to local currency, the Board of Directors approved on October 28, 2021, a program for contracting additional specific hedge operations to protect from it such exposure. The program approved (established in the Derivatives Management Policy available on the Investor Relations website) initially involved a maximum amount (notional) of up to US$1 billion and a term of operations of up to 36 months. On July 27, 2022, the Board of Directors approved the expansion of the program, increasing the maximum amount (notional) to US$1.5 billion while maintaining the previously established term. To ensure transparency regarding the Cerrado Project's hedge program, since 4Q21 the Company has been prominently disclosing the operations contracted.
Since about 33% of the Capex of the Cerrado Project is denominated in EUR, in 3Q22, the Company contracted hedge operations through NDFs to protect the exposure in EUR of the Capex of the Cerrado Project, converting it into USD. This type of hedge is established in the Derivatives Management Policy available on the Investor Relations website.
ZCC transactions establish minimum and maximum limits for the exchange rate that minimize adverse effects in the event of significant appreciation of the BRL. As such, if the exchange rate is within such limits, the Company neither pays nor receives any financial adjustments. This characteristic allows for capturing greater benefits from export revenue in a potential scenario of BRL appreciation versus USD within the range contracted. In cases of extreme BRL appreciation, the Company is protected by the minimum limits, which are considered appropriate for the operation. However, this protection instrument also limits, temporarily and partially, potential gains in scenarios of extreme BRL depreciation when exchange rates exceed the maximum limits contracted.
On March 31, 2024, the outstanding notional value of operations involving forward USD sales through ZCCs related to Cash Flows (including those related to the Cerrado Project) was US$5,254 million, with an average forward rate ranging from R$5.30 to R$6.13 and maturities distributed between April 2024 and March 2026. On the same date, the outstanding notional value of operations involving forward USD sales through NDFs was US$420 million, whose maturities are distributed between April 2024 and April 2025 and with an average rate of R$5.27. Regarding hedge for foreign exchange exposure in EUR, the outstanding notional value of forward EUR purchases at the end of 1Q24 was €159 million (USD164 million), with an average contracted rate of 1.03 EUR/USD and maturities through July 2024. In 1Q24, Cash Flow and Cerrado Project hedge operations resulted in a loss of R$669 million. The mark-to-market (“MtM” or “fair value”) value of these operations totaled R$1,441 million, with R$1,330 million related to cash flow operating hedge and R$111 million related to operating hedge of the Cerrado Project.
The following table presents a sensitivity analysis of the cash impact that the Company could have on its cash flow hedge portfolios (ZCC and NDF) if the exchange rate remains the same as at the end of 1Q24 (BRL/USD = 5.00) in the coming quarters, as well as the projected cash impact for R$0.10 variations below / above the strike of put/call options, respectively, defined in each quarter. Note that the figures presented in the table are the Company’s projections based on the end-of-period curves and could vary depending on market conditions.
| | | | | | | | | | | | | | | | | |
| | | Cash Adjustment (R$ million) |
| Maturity (up to) | Strike Range | Notional
(US$ million) | Actual | Exchange Rate
1Q24 (R$ 5.00) | Sensitivity at R$
0.10 / US$
variation (+/-) |
| Zero Cost Collars |
| 1Q24 | — | — | 205 | — | — |
| 2Q24 | 5.56 - 6.40 | 560 | — | 314 | 56 |
| 3Q24 | 5.66 - 6.53 | 555 | — | 368 | 56 |
| 4Q24 | 5.71 - 6.63 | 505 | — | 358 | 51 |
| 1Q25 | 5.50 - 6.37 | 280 | — | 142 | 28 |
| 2Q25 | 5.22 - 6.03 | 642 | — | 144 | 64 |
| 3Q25 | 5.13 - 5.95 | 870 | — | 118 | 87 |
| 4Q25 | 5.04 - 5.79 | 1,095 | — | 63 | 110 |
| 1Q26 | 5.07 - 5.84 | 680 | — | 52 | 68 |
| Total | 5.29 - 6.11 | 5,187 | 205 | 1,558 | 519 |
| NDF |
| 1Q24 | — | — | 18 | — | — |
| 2Q24 | 5.25 | 350 | — | 88 | 35 |
| 3Q24 | 5.35 | 20 | – | 7 | 2 |
| 4Q24 | 5.40 | 45 | — | 18 | 5 |
| 2Q25 | 5.54 | 5 | — | 3 | 1 |
| Total | 5.27 | 420 | 18 | 116 | 42 |
| Zero Cost Collars – Cerrado Project |
| 1Q24 | — | — | 67 | — | — |
| 2Q24 | 6.10 - 7.44 | 58 | — | 64 | 6 |
| 3Q24 | 6.35 - 8.34 | 9 | — | 12 | 1 |
| Total | 6.14 - 7.56 | 67 | 67 | 76 | 7 |
| | | | | | | | | | | | | | | | | |
| | | Cash Adjustment (R$ million) |
| Maturity (up to) | Strike Range | Notional
(US$ million)¹ | Actual | Exchange Rate 1Q24 (€ 1.08) | Sensitivity at
€ 0.10 / US$ variation (+/-) |
| NDF – Projeto Cerrado (EUR/USD) |
| 1Q24 | — | — | 32 | — | — |
| 2Q24 | 1.03 | 96 | — | 23 | 46 |
| 3Q24 | 1.04 | 69 | — | 14 | 33 |
| Total | 1.03 | 164 | 32 | 37 | 79 |
1 Translated at the average contracted rate of 1.03 Euro/USD.
To mitigate the effects of exchange and interest rate variations on its debt and its cash flows, the Company also uses currency and interest rate swaps. Swap contracts are entered into considering different interest rates and inflation indices in order to mitigate the mismatch between financial assets and liabilities.
On March 31, 2024, the Company had an outstanding amount (notional value) of US$4,191 million in swap contracts as shown in the table below. In 1Q24, the result of debt hedge transactions was an expense of R$258 million, mainly due to weaker BRL and the expectation of hikes in the IPCA and SOFR rates. The mark-to-market adjustment (fair value) of these operations was a loss of R$835 million.
| | | | | | | | | | | | | | | | | | | | |
| | | Notional (US$ million) | Fair Value (R$ million) |
| Debt Hedge | Maturity
(up to) | Currency | Mar/24 | Dec/23 | Mar/24 | Dec/23 |
| Swap (PRÉ x USD) | 2024 | USD | — | 200 | — | (203) |
| Swap (CDI x USD) | 2030 | USD | 1,249 | 1,025 | (1,149) | (1,082) |
| Swap (SOFR x USD) | 2030 | USD | 1,598 | 2,556 | 453 | 741 |
| Swap (CDI x SOFR) | 2030 | USD | 350 | 125 | 16 | 26 |
| Swap SOFR | 2029 | USD | 151 | 151 | (16) | (17) |
| Swap (IPCA x CDI) | 2038 | BRL | 843¹ | 883¹ | (138) | 48 |
| Total | | | 4,191 | 4,939 | (835) | (487) |
1 Translated at the closing exchange rate (R$5.00).
The following table presents a sensitivity analysis1 of the cash impact that the Company could have on its debt hedge portfolio (swaps) if the exchange rate remains the same as at the end of 1Q24 (BRL/USD = 5.00) in the coming quarters, as well as the projected variation in cash impact for each R$0.10 variation on the same reference exchange rate (1Q24). Note that the figures presented in the table are the Company’s projections based on the end-of-period curves and could vary depending on market conditions.
| | | | | | | | | | | | | | |
| | Cash Adjustment (R$ million) |
| Maturity (up to) | Notional
(US$ million) | Actual | R$ / US$ = 5.00 (1Q24) | Sensitivity at R$ 0.10 / US$ variation (+/-)1 |
| 1Q24 | — | 90 | — | — |
| 2Q24 | 91 | — | 146 | 1 |
| 3Q24 | 232 | — | 110 | — |
| 4Q24 | 226 | — | 121 | 2 |
| 2025 | 1,494 | — | (314) | 63 |
| 2026 | 960 | — | (439) | 62 |
| 2027 | 116 | — | 120 | 3 |
| 2028 | 47 | — | 149 | 15 |
| >=2029 | 1,025 | — | (46) | 38 |
| Total | 4,191 | 90 | (153) | 184 |
¹ Sensitivity analysis considers variation only in the exchange rate (R$/US$), while other variables are presumed constant.
Other transactions involving the Company’s derivatives are related to the embedded derivative resulting from forestry partnerships and commodity hedges, as shown in the table.
| | | | | | | | | | | | | | | | | | | | | | | | | | |
| | | Notional (US$ million) | Fair Value (R$ million) | Cash Adjustment
(R$ million) |
| Other hedges | Maturity (up to) | Index | Mar/24 | Dec/23 | Mar/24 | Dec/23 | Mar/24 | Dec/23 |
Embedded
derivative | 2038 | Fixed USD | USD US-CPI | 131 | 132 | 197 | 230 | — | — |
| Commodities | 2025 | Brent/VLSFO/Others | 263 | 306 | 112 | 19 | 32 | 49 |
| Total | | | 394 | 437 | 310 | 250 | 32 | 49 |
A portion of the forestry partnership agreements and standing timber supply agreements is denominated in USD per cubic meter of standing timber, adjusted by U.S. inflation measured by the Consumer Price Index (CPI), which is not related to inflation in the economic environment where the forests are located and, hence, constitutes an embedded derivative. This instrument, presented in the table above, consists of a sale swap contract of the variations in the US-CPI during the period of the contracts. See note 4 of the 1Q24 Financial Statements for more details and for a sensitivity analysis of the fair value in case of a sharp rise in the US-CPI and USD. On March 31, 2024, the outstanding (notional) value of the operation was US$131 million. The result of this swap in 1Q24 was a loss of R$33 million. The mark-to-market (fair value) adjustment of these operations generated a gain of R$197 million at the end of the quarter.
The Company is also exposed to the price of some commodities and, therefore, constantly assesses the contracting of derivative financial instruments to mitigate such risks. On March 31, 2024, the outstanding (notional) value of the operation was US$263 million. The result from these hedges in 1Q24 was a gain of R$126 million. The mark-to-market (fair value) adjustment of these operations generated a gain of R$112 million at the end of the quarter.
 Total (635)
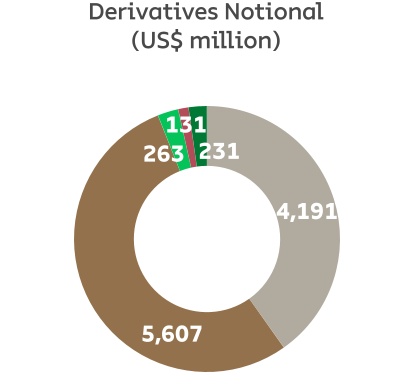 Total 10,423
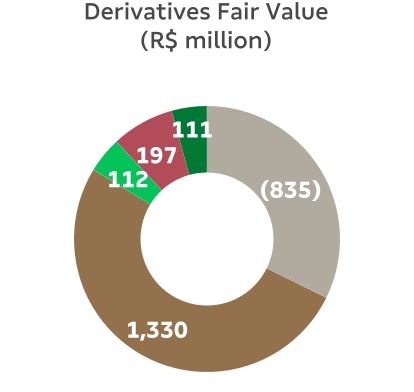 Total 916
 | | | | | | | | | | | | | | | | | | | | | | | | | | | | | | | | | | | | | | | | | | | | | | | | | | | | | | | | |
| | Debt Hedge | | | | Cash flow Hedge | | | | Commodity Hedge | | | | Embedded Derivatives | | | | Cerrado Hedge |
| | | | | | | | | | | | | |
| | | | | | | | | | | | | |
NET INCOME (LOSS)
In 1Q24, the Company posted net income of R$220 million, compared to R$4,515 million in 4Q23 and of R$5,243 million in 1Q23. The variation in relation to 4Q23 was mainly due to the negative financial result, which was explained by the impact of weaker BRL on debt and derivative operations (compared to the positive result registered in the previous quarter). In addition, the lack of revaluation of biological assets and lower net revenue contributed to a decline in net income. These effects were partially offset by IR/CSLL credits (deferred IR/CSLL levied mainly on losses from exchange variation on debt and mark-to-market adjustments of derivatives), and lower COGS, as explained earlier.
The variation in relation to 1Q23 is mainly due to financial loss (caused by weaker BRL on debt and derivative operations vs. stronger BRL in 1Q23) and lower operating result (decline in net revenue and higher SG&A). These effects were partially offset by deferred IR/CSLL credits, mainly on negative results from exchange variation and derivative operations, and by lower COGS.
DEBT
| | | | | | | | | | | | | | | | | |
| Debt (R$ million) | 1Q24 | 4Q23 | Δ Q-o-Q | 1Q23 | Δ Y-o-Y |
| Local Currency | 15,381 | 15,868 | -3% | 13,536 | 14% |
| Short Term | 649 | 1,155 | -44% | 3,087 | -79% |
| Long Term | 14,733 | 14,713 | — | 10,449 | 41% |
| Foreign Currency | 63,568 | 61,305 | 4% | 59,091 | 8% |
| Short Term | 4,395 | 3,603 | 22% | 1,037 | — |
| Long Term | 59,173 | 57,702 | 3% | 58,054 | 2% |
| Gross Debt | 78,950 | 77,173 | 2% | 72,627 | 9% |
| (-) Cash | 19,323 | 21,613 | -11% | 17,400 | 11% |
| Net debt | 59,626 | 55,560 | 7% | 55,227 | 8% |
| Net debt/Adjusted EBITDA¹ (x) - R$ | 3,6 x | 3,0 x | 0,6 x | 1,9 x | 1,7 x |
| Net debt/Adjusted EBITDA¹ (x) – US$ | 3,5 x | 3,1 x | 0,4 x | 1,9 x | 1,6 x |
1 Excluding non-recurring items.
On March 31, 2024, gross debt totaled R$79.0 billion and was composed of 94% long-term maturities and 6% short-term maturities. Foreign currency debt corresponded to 81% of the Company's total debt at the end of the quarter. The percentage of gross debt in foreign currency, considering the effect of debt hedge, was 89%. Compared to 4Q23, gross debt increased 2%, mainly due to the effect of exchange variation of R$2,072 million and net funding operations carried out during the period. Suzano ended 1Q24 with 44% of total debt linked to ESG instruments.
Suzano contracts debt in foreign currency as a natural hedge, since net operating cash generation is mostly denominated in foreign currency (USD) due to its predominant status as an exporter. This structural exposure allows the Company to match loans and financing payments in USD with receivable flows from sales.
* Corresponding mainly to transaction costs (issue, funding, goodwill, discount and loss on business combinations, etc.).
On March 31, 2024, the total average cost of debt in USD was 5.0% p.a. (considering the debt in BRL adjusted by the market swap curve), compared to 4.9% p.a. on December 31, 2023. The average term of consolidated debt at the end of the quarter was 74 months, compared to 75 months at the end of 4Q23.
1 Considers the portion of debt with swap for fixed rate in foreign currency. The exposure of the original debt was: Fixed (US$) – 54%, Libor/SOFR– 27%, CDI – 11%, Other (Fixed R$, IPCA, TJLP, others) – 8%.
² Considers the portion of debt with currency swaps. The original debt was 81% denominated in USD and 19% in BRL.
Cash and cash equivalents and financial investments on March 31, 2024 amounted to R$19.3 billion, 33% of which were in foreign currency, allocated to remunerated account or in short-term fixed-income investments abroad. The remaining 67% was invested in local currency fixed-income bonds (mainly CDBs, but also in government bonds and others), remunerated at the CDI rate.
On March 31, 2024, the company also had a stand-by credit facility totaling R$6.4 billion (US$1.3 billion) available through February 2027. This facility strengthens the company's liquidity position and can be withdrawn during times of uncertainty. As a result, the cash and cash equivalents of R$19.3 billion plus the credit facilities described above amounted to a readily available cash position of R$25.7 billion on March 31, 2024. Moreover, the Company has a financing agreement with Finnvera (US$800 million) related to the Cerrado Project, as per the Notice to the Market of November 1, 2022, which has not yet been withdrawn, further strengthening its liquidity position.
On March 31, 2024, net debt stood at R$59.6 billion (US$11.9 billion), compared to R$55.6 billion (US$11.5 billion) on December 31, 2023. The increase is mainly explained by higher gross debt (due to exchange rate variation) and free cash consumption in the period of R$2,612 million (notably Capex disbursements and interest on equity - for more details, refer to the Free Cash Flow section).
Financial leverage, measured as the ratio of net debt to Adjusted EBITDA in BRL, stood at 3.6 times on March 31, 2024 (3.0 times in 4Q23). The same ratio in USD (the measure established in Suzano’s financial policy) rose to 3.5 times on March 31, 2024 (from 3.1 times in 4Q23).
The breakdown of total gross debt between trade and non-trade finance on March 31, 2024 is shown below:
| | | | | | | | | | | | | | | | | | | | | | | |
| 3M23 | 2024 | 2025 | 2026 | 2027 | 2028 onwards | Total |
| Trade Finance¹ | 62% | 47% | 45% | 50% | 42% | 4% | 23% |
| Non-Trade Finance² | 38% | 53% | 55% | 50% | 58% | 96% | 77% |
¹ EEC, ECN, EPP
² Bonds, BNDES, CRA, Debentures, among others.
CAPEX
In 1Q24, capital expenditure (cash basis) totaled R$4,038 million. The 4% decrease in relation to 4Q23 was due to: i) lower expenses with the Cerrado Project as a result of the disbursement curve; and ii) lower spending on Expansion and Modernization due to the conclusion of the efficiency energy project in Jacareí. These factors were partially offset by higher disbursements in Land and Forests and the increase in the Maintenance line impacted by the start of the forest operation at the Cerrado Project.
Compared to 1Q23, the 9% increase was mainly due to: i) higher maintenance expenses, notably in forests, due to the start of the Cerrado Project’s forest operation, and industry, due to the carry-over of agreements of ongoing projects; ii) higher disbursement in Land and Forests. These factors were partially offset by lower expenses with the Cerrado Project.
| | | | | | | | | | | | | | | | | | | | | | | |
| Investments¹ (R$ million) | 1Q24 | 4Q23 | Δ Q-o-Q | 1Q23 | Δ Y-o-Y | LTM 1Q24 | Guidance 2024 |
| Maintenance | 2,058 | 1,726 | 19% | 1,465 | 40% | 7,300 | 7,677 |
| Industrial maintenance | 290 | 432 | -33% | 209 | 39% | 1,410 | 1,263 |
| Forestry maintenance | 1,753 | 1,221 | 44% | 1,237 | 42% | 5,716 | 6,177 |
| Others | 15 | 72 | -79% | 20 | -23% | 174 | 238 |
| Expansion and modernization | 39 | 145 | -73% | 128 | -69% | 605 | 331 |
| Land and forestry | 470 | 152 | 209% | 377 | 25% | 2,703 | 3,296 |
| Port terminals | 1 | 0 | 553% | 3 | -78% | 4 | 6 |
| Others | 0 | 12 | -98% | 11 | -98% | 37 | 538 |
| Cerrado Project | 1,469 | 2,190 | -33% | 1,735 | -15% | 8,245 | 4,605 |
| Total | 4,038 | 4,225 | -4% | 3,720 | 9% | 19,068 | 16,453 |
¹ Does not include the acquisition of Kimberly Clark’s tissue business in Brazil, in the amount of R$1,073 million, as explained in Note 15 of the 2Q23 financial statements.
CERRADO PROJECT
The Cerrado Project is progressing according to schedule on its physical and financial curves, closing the first quarter of 2024 with the “inside the fence” execution (which corresponds to industrial and infrastructure investments) reaching physical progress of 94% and financial progress of 87% (R$13.6 billion) by the end of April 2024. Regarding the capex disbursement, R$19.1 billion was already paid by April 2024, corresponding to 86% of the total capex (R$22.2 billion).
OPERATING CASH GENERATION
| | | | | | | | | | | | | | | | | | | | |
| Operating Cash Flow (R$ million) | 1Q24 | 4Q23 | Δ Q-o-Q | 1Q23 | Δ Y-o-Y | LTM 1Q24 |
Adjusted EBITDA1 | 4,558 | 4,505 | 1% | 6,155 | -26% | 16,676 |
Maintenance Capex2 | (2,058) | (1,726) | 19% | (1,465) | 40% | (7,300) |
| Operating Cash Flow | 2,499 | 2,779 | -10% | 4,689 | -47% | 9,377 |
| Operating Cash Flow (R$/ton) | 921 | 883 | 4% | 1,714 | -46% | 816 |
¹ Excludes non-recurring items.
² Cash basis.
Operating cash generation, measured by adjusted EBITDA less sustaining capex (cash basis), amounted to R$2,499 million in 1Q24. The 4% increase in operating cash generation per ton in relation to 4Q23 is due to higher Adjusted EBITDA per ton, which was partially offset by higher sustaining capex per ton. Compared to 1Q23, the 46% decrease in operating cash generation per ton is due to lower Adjusted EBITDA per ton and higher sustaining capex per ton.
Operating Cash Flow per ton (R$/ton)
FREE CASH FLOW
| | | | | | | | | | | | | | | | | | | | |
| Free Cash Flow (R$ million) | 1Q24 | 4Q23 | Δ Q-o-Q | 1Q23 | Δ Y-o-Y | LTM 1Q24 |
| Adjusted EBITDA | 4,558 | 4,505 | 1% | 6,155 | -26% | 16,676 |
| (-) Total Capex¹ | (4,243) | (4,395) | -3% | (3,843) | 10% | (20,633) |
| (-) Leases contracts – IFRS 16 | (321) | (348) | -8% | (293) | 10% | (1,246) |
(+/-) △ Working capital2 | 146 | 810 | — | (442) | — | 4,085 |
(-) Net interest3 | (1,521) | (627) | — | (1,429) | 6% | (4,140) |
| (-) Income taxes | (56) | (53) | 6% | (43) | 30% | (321) |
| (-) Dividend and interest on own capital payment/Share Buyback Program | (1,619) | (190) | — | (87) | — | (2,606) |
| (+/-) Derivative cash adjustment | 444 | 1,174 | -62% | 366 | — | 3,638 |
| Free cash flow | (2,612) | 876 | — | 384 | — | (4,547) |
| (+) Capex ex-maintenance | 2,782 | 2,763 | 1% | 2,487 | 12% | 14,026 |
| (+) Dividend and interest on own capital payment/Share Buyback Program | 1,619 | 190 | — | 87 | — | 2,606 |
Free cash flow – Adjusted4 | 1,789 | 3,829 | -53% | 2,958 | -40% | 12,085 |
¹ Accrual basis, except for the Parkia deal (payment of R$1.6 billion in 2Q23) and the investment related to the Cerrado Project in 2Q23 and 3Q23, as per note 15 (Property, Plant and Equipment) to the Financial Statements. Also considering the acquisition of Kimberly Clark Brazil's tissue business in 2Q23 in the amount of R$1,073 million (operation is a business combination and not acquisition of assets).
² Considers costs of capitalized loans paid (1Q24: R$378 million | 4Q23: R$344 million | 1Q23: R$233 million).
3 Considers interest paid on debt and interest received on financial investments.
4 Free cash flow prior to dividend and interest on own capital payments, share buyback program and capex ex-maintenance (accrual basis).
Adjusted Free Cash Flow in 1Q24 was R$1,789 million, compared to R$3,829 million in 4Q23 and R$2,958 million in 1Q23. The decrease of 53% from the previous quarter is mainly due to: ii) higher concentration of interest payments in the period; ii) decrease in positive adjustment of derivatives; iii) lower disbursement of working capital resulting from the increase in inventories (compared to the decrease in 4Q23) and the decrease in Accounts Receivable (compared to an increase in 4Q23), partially offset by lower sales volume.
Compared to 1Q23, Adjusted Free Cash Flow decreased 40%, mainly due to lower adjusted EBITDA, partially offset by the disbursement of working capital resulting from the decrease in accounts receivable and the higher impact of capitalized interest.
EVOLUTION OF NET DEBT
Following were the changes in net debt in 1Q24:
1 Accrual basis, except for the capex related to Cerrado Project (cash basis), as per the Cash Flow Statement. Considers the business combination with Kimberly Clark’s tissue business in Brazil.
2 Net of exchange variations on cash and financial investments.
3 Considers amounts (cash basis) related to derivative adjustments, lease agreements and other items.
ESG
In its constant pursuit of transparency, in March Suzano published its 2023 Annual Sustainability Report and Sustainability Center, once again disclosing them before the Annual Shareholders Meeting held on April 25, 2024, to meet the growing interest for informed voting at shareholder meetings. The report follows the standards of the Global Reporting Initiative (GRI) and takes into consideration the principles of the International Integrated Reporting Council (IIRC), Resolution 59 of the Securities and Exchange Commission of Brazil (CVM) and the 17 Sustainable Development Goals (SDG) of the United Nations.
In January, Suzano announced that it has adopted the recommendations of the Taskforce on Nature-related Financial Disclosures (TNFD), being one of the first Brazilian companies to commit to the initiative dedicated to creating an instrument for managing and disclosing risks and opportunities so that organizations can report and act on potential impacts related to nature.
TOTAL OPERATIONAL EXPENDITURE - PULP
As disclosed in the Material Fact notice of February 28, 2024, total operational expenditure forecast for 2027 is approximately R$1,750 per ton and the indicator has been evolving according to plan, considering the exchange rate and monetary premises used. Said estimate refers to the currency in real terms of 2023.
CAPITAL MARKETS
On March 31, 2024, Suzano’s stock was quoted at R$63.98/share (SUZB3) and US$12.78/share (SUZ). The Company’s stock is listed on the Novo Mercado, the listing segment of the São Paulo Stock Exchange (B3 – Brasil, Bolsa e Balcão) with the highest corporate governance standards, and on the New York Stock Exchange (NYSE) - Level II.
Source: Bloomberg.
Liquidity - SUZB3
Source: Bloomberg.
As part of the latest share buyback program announced (the “January/2024 Program”), until the end of March 2024, the Company has acquired and paid for 5,998,000 shares at an average cost of R$51.68, corresponding to market capitalization of R$310 million.
On March 31, 2024, the Company's capital stock was represented by 1,304,117,615 common shares, of which 20,649,356 were held in Treasury (considering the cancellation of 20 million shares, announced on January 26, 2024). Suzano’s market capitalization on the same date (ex-treasury shares) stood at R$82.1 billion. Free float in 1Q24 corresponded to 51% of total capital.
| | | | | | | | |
Free Float distribution 03/31/2024
(B3+NYSE) | | Ownership Structure (03/31/2024) |
FIXED INCOME
| | | | | | | | | | | | | | | | | | | | |
| Unit | Mar/24 | Dec/23 | Mar/23 | Δ Q-o-Q | Δ Y-o-Y |
| Fibria 2025 – Price | USD/k | 98.70 | 98.20 | 97.43 | 1% | 1% |
| Fibria 2025 – Yield | % | 5.74 | 5.80 | 5.53 | -1% | 4% |
| Suzano 2026 – Price | USD/k | 100.20 | 101.30 | 100.44 | -1% | 0% |
| Suzano 2026 – Yield | % | 5.66 | 5.20 | 5.60 | 9% | 1% |
| Fibria 2027 – Price | USD/k | 99.70 | 101.20 | 100.55 | -1% | -1% |
| Fibria 2027 – Yield | % | 5.62 | 5.07 | 5.34 | 11% | 5% |
| Suzano 2028 – Price | USD/k | 88.20 | 87.93 | 85.58 | 0% | 3% |
| Suzano 2028 – Yield | % | 5.52 | 5.44 | 5.61 | 1% | -2% |
| Suzano 2029 – Price | USD/k | 100.60 | 102.25 | 100.67 | -2% | 0% |
| Suzano 2029 – Yield | % | 5.86 | 5.48 | 5.86 | 7% | 0% |
| Suzano 2030 – Price | USD/k | 96.10 | 96.81 | 95.31 | -1% | 1% |
| Suzano 2030 – Yield | % | 5.80 | 5.63 | 5.85 | 3% | -1% |
| Suzano 2031 – Price | USD/k | 88.40 | 88.30 | 86.89 | 0% | 2% |
| Suzano 2031 – Yield | % | 5.85 | 5.80 | 5.87 | 1% | 0% |
| Suzano 2032 – Price | USD/k | 83.10 | 83.16 | 81.84 | 0% | 2% |
| Suzano 2032 – Yield | % | 5.85 | 5.77 | 5.79 | 1% | 1% |
| Suzano 2047 – Price | USD/k | 105.00 | 105.31 | 102.09 | 0% | 3% |
| Suzano 2047 – Yield | % | 6.58 | 6.55 | 6.82 | 0% | -4% |
| Treasury 10 years | % | 4.20 | 3.88 | 3.47 | 8% | 21% |
Note: Senior Notes issued with face value of 100 USD/k.
RATINGS
| | | | | | | | | | | |
| Agency | National Scale | Global Scale | Outlook |
| Fitch Ratings | AAA | BBB- | Stable |
| Standard & Poor’s | br.AAA | BBB- | Stable |
| Moody’s | Aaa.br | Baa3 | Positive |
UPCOMING EVENTS
Earnings Conference Call (1Q24)
Date: May 10, 2024 (Friday)
| | | | | |
| Portuguese (simultaneous translation) | English |
| 10:00 a.m. (Brasília) | 10:00 a.m. (Brasília) |
| 9 a.m. (New York) | 9:00 a.m. (New York) |
| 2:00 p.m. (London) | 2:00 p.m. (London) |
The conference call will be held in English and feature a presentation, with simultaneous webcast. The access links will be available on the Company’s Investor Relations website (www.suzano.com.br/ri).
If you are unable to participate, the webcast link will be available for future consultation on the Investor Relations website of Suzano.
IR CONTACTS
Marcelo Bacci
Camila Nogueira
Roberto Costa
Mariana Dutra
Mariana Spinola
Luísa Puccini
Arthur Trovo
Tel.: +55 (11) 3503-9330
ri@suzano.com.br
www.suzano.com.br/ri
APPENDICES
APPENDIX 1 – Operating Data
| | | | | | | | | | | | | | | | | |
| Revenue Breakdown (R$ '000) | 1Q24 | 4Q23 | Δ Q-o-Q | 1Q23 | Δ Q-o-Q |
| Exports | 7,399,944 | 7,946,224 | -7% | 9,125,564 | -19% |
| Pulp | 6,873,678 | 7,316,042 | -6% | 8,534,778 | -19% |
| Paper | 526,266 | 630,182 | -16% | 590,786 | -11% |
| Domestic Market | 2,058,658 | 2,425,321 | -15% | 2,150,819 | -4% |
| Pulp | 486,168 | 453,846 | 7% | 666,301 | -27% |
| Paper | 1,572,501 | 1,971,475 | -20% | 1,484,518 | 6% |
| Total Net Revenue | 9,458,602 | 10,371,545 | -9% | 11,276,383 | -16% |
| Pulp | 7,359,846 | 7,769,888 | -5% | 9,201,079 | -20% |
| Paper | 2,098,756 | 2,601,657 | -19% | 2,075,304 | 1% |
| | | | | | | | | | | | | | | | | |
| Sales volume (‘000) | 1Q24 | 4Q23 | Δ Q-o-Q | 1Q23 | Δ Q-o-Q |
| Exports | 2,326,582 | 2,698,453 | -14% | 2,353,622 | -1% |
| Pulp | 2,223,108 | 2,580,950 | -14% | 2,283,732 | -3% |
| Paper | 104,001 | 117,403 | -11% | 69,890 | 49% |
| Paperboard | 7,829 | 5,468 | 43% | 5,245 | 49% |
| Printing & Writing | 95,450 | 111,994 | -15% | 64,600 | 48% |
| Other paper¹ | 195 | 41 | 378% | 45 | 332% |
| Domestic Market | 386,758 | 449,089 | -14% | 381,554 | 1% |
| Pulp | 177,594 | 180,111 | -1% | 171,296 | 4% |
| Paper | 209,164 | 268,978 | -22% | 210,258 | -1% |
| Paperboard | 34,314 | 37,343 | -8% | 37,669 | -9% |
| Printing & Writing | 115,657 | 161,449 | -28% | 139,500 | -17% |
| Other paper¹ | 59,193 | 70,186 | -16% | 33,089 | 79% |
| Total Sales Volume | 2,713,340 | 3,147,542 | -14% | 2,735,176 | -1% |
| Pulp | 2,400,702 | 2,761,061 | -13% | 2,455,028 | -2% |
| Paper | 312,638 | 386,481 | -19% | 280,148 | 12 |
| Paperboard | 42,143 | 42,811 | -2% | 42,914 | -2% |
| Printing & Writing | 211,107 | 273,443 | -23% | 204,100 | 3% |
| Other paper¹ | 59,388 | 70,227 | -15% | 33,134 | 79% |
¹ Paper of other manufacturers sold by Suzano and tissue paper.
| | | | | | | | | | | | | | | | | |
| Average net price (R$/ton) | 1Q24 | 4Q23 | Δ Q-o-Q | 1Q23 | Δ Q-o-Q |
| Exports | 3,181 | 2,945 | 8% | 3,877 | -18% |
| Pulp | 3,092 | 2,835 | 9% | 3,737 | -17% |
| Paper | 5,086 | 5,363 | -5% | 8,453 | -40% |
| Domestic Market | 5,323 | 5,401 | -1% | 5,637 | -6% |
| Pulp | 2,738 | 2,520 | 9% | 3,890 | -30% |
| Paper | 7,518 | 7,330 | 3% | 7,060 | 6% |
| Total | 3,486 | 3,295 | 6% | 4,123 | -15% |
| Pulp | 3,066 | 2,814 | 9% | 3,748 | -18% |
| Paper | 6,713 | 6,732 | 0% | 7,408 | -9% |
| | | | | | | | | | | | | | | | | |
| Average net price (US$/ton) | 1Q24 | 4Q23 | Δ Q-o-Q | 1Q23 | Δ Q-o-Q |
| Exports | 642 | 594 | 8% | 746 | -14% |
| Pulp | 624 | 572 | 9% | 719 | -13% |
| Paper | 1,027 | 1,082 | -5% | 1,627 | -37% |
| Domestic Market | 1,075 | 1,090 | -1% | 1,085 | -1% |
| Pulp | 553 | 509 | 9% | 749 | -26% |
| Paper | 1,518 | 1,479 | 3% | 1,359 | 12% |
| Total | 704 | 665 | 6% | 793 | -11% |
| Pulp | 619 | 568 | 9% | 721 | -14% |
| Paper | 1,356 | 1,359 | 0% | 1,426 | -5% |
| | | | | | | | | | | | | | | | | |
| FX Rate R$/US$ | 1Q24 | 4Q23 | Δ Q-o-Q | 1Q23 | Δ Q-o-Q |
| Closing | 5.00 | 4.84 | 3% | 5.08 | -2% |
| Average | 4.95 | 4.96 | 0% | 5.20 | -5% |
APPENDIX 2 – Consolidated Statement of Income and Goodwill Amortization
| | | | | | | | | | | | | | | | | |
| Income Statement (R$ ‘000) | 1Q24 | 4Q23 | Δ Q-o-Q | 1Q23 | Δ Y-o-Y |
| | | | | |
| Net Revenue | 9,458,602 | 10,371,545 | -9% | 11,276,383 | -16% |
| Cost of Goods Sold | (5,699,870) | (6,775,564) | -16% | (5,968,674) | -5% |
| Gross Debt | 3,758,732 | 3,595,981 | 5% | 5,307,709 | -29% |
| Gross Margin | 40% | 35% | 5 p.p. | 47% | -7 p.p. |
| | | | | |
| Operating Expense/Income | (1,206,506) | (438,153) | — | (1,001,421) | 20% |
| Selling Expenses | (653,415) | (711,641) | -8% | (604,353) | 8% |
| General and Administrative Expenses | (502,975) | (614,892) | -18% | (390,235) | 29% |
| Other Operating Income (Expenses) | (40,209) | 901,929 | — | (21,304) | 89% |
| Equity Equivalence | (9,907) | (13,549) | -27% | 14,471 | — |
| EBIT | 2,552,226 | 3,157,828 | -19% | 4,306,288 | -41% |
| | | | | |
| Depreciation, Amortization & Depletion | 1,982,024 | 1,787,944 | 11% | 1,747,714 | 13% |
| | | | | |
| EBITDA | 4,534,250 | 4,945,772 | -8% | 6,054,002 | -25% |
| EBITDA Margin | 48% | 48% | — | 54% | -6 p.p. |
| | | | | |
| Adjusted EBITDA¹ | 4,557,906 | 4,504,505 | 1% | 6,154,515 | -26% |
| Adjusted EBITDA Margin¹ | 48% | 43% | 5 p.p. | 55% | -7 p.p. |
| | | | | |
| Net Financial Result | (3,040,048) | 2,269,458 | — | 2,470,107 | — |
| Financial Expenses | 424,217 | 610,005 | -30% | 385,761 | 10% |
| Financial Revenues | (1,130,400) | (1,175,488) | -4% | (1,159,025) | -2% |
| Exchange Rate Variation | (634,537) | 1,492,094 | — | 1,995,253 | — |
| Net Proceeds Generated by Derivatives | (1,699,328) | 1,342,847 | — | 1,248,118 | — |
| Earnings Before Taxes | (487,822) | 5,427,286 | — | 6,776,395 | — |
| | | | | |
| Income and Social Contribution Taxes | 707,854 | (912,564) | — | (1,533,602) | — |
| | | | | |
| Net Income (Loss) | 220,032 | 4,514,722 | -95% | 5,242,793 | -96% |
| Net Margin | 2% | 44% | -42 p.p. | 46% | -44 p.p. |
1 Excluding non-recurring items and PPA effects.
| | | | | | | | | | | | | | | | | |
| Goodwill amortization - PPA (R$ ‘000) | 1Q24 | 4Q23 | Δ Q-o-Q | 1Q23 | Δ Y-o-Y |
| COGS | (115,740) | (148,443) | -22% | (145,598) | -21% |
| Selling Expenses | (207,475) | (207,570) | 0% | (207,728) | 0% |
| General and administrative expenses | (7,967) | (7,610) | 0% | (5,022) | 59% |
| Other operational revenues (expenses) | 3,473 | 392,969 | -99% | 40,998 | -92% |
APPENDIX 3 – Consolidated Balance Sheet
| | | | | | | | | | | |
| Assets (R$ ’000) | 03/31/2024 | 12/31/2023 | 03/31/2023 |
| | | |
| Current Assets | | | |
| Cash and cash equivalents | 4,203,126 | 8,345,871 | 4,761,264 |
| Financial investments | 14,671,943 | 12,823,886 | 12,206,095 |
| Trade accounts receivable | 6,634,735 | 6,848,454 | 9,403,901 |
| Inventories | 6,521,769 | 5,946,948 | 6,250,810 |
| Recoverable taxes | 886,659 | 888,539 | 588,241 |
| Derivative financial instruments | 1,961,643 | 2,676,526 | 3,694,528 |
| Advance to suppliers | 119,962 | 113,743 | 97,658 |
| Dividend’s receivable | — | — | 4,868 |
| Other assets | 871,969 | 925,105 | 880,777 |
| Total Current Assets | 35,871,806 | 38,569,072 | 37,888,142 |
| | | |
| Non-Current Assets | | | |
| Financial investments | 448,077 | 443,400 | 432,882 |
| Recoverable taxes | 1,401,124 | 1,373,647 | 1,355,526 |
| Deferred taxes | 1,368,618 | 545,213 | 2,577,003 |
| Derivative financial instruments | 1,544,010 | 1,753,928 | 1,647,760 |
| Advance to suppliers | 2,472,894 | 2,242,229 | 1,841,724 |
| Judicial deposits | 401,758 | 361,693 | 340,426 |
| Other assets | 207,984 | 182,463 | 325,210 |
| | | |
| Biological assets | 18,721,063 | 18,278,582 | 15,114,469 |
| Investments | 620,259 | 608,013 | 628,771 |
| Property, plant and equipment | 60,640,882 | 59,289,069 | 53,065,353 |
| Right of use on lease agreements | 5,146,347 | 5,196,631 | 5,188,991 |
| Intangible | 14,554,669 | 14,749,085 | 14,964,964 |
| Total Non-Current Assets | 107,527,685 | 105,023,953 | 97,483,079 |
| Total Assets | 143,399,491 | 143,593,025 | 135,371,221 |
| | | |
| Liabilities and Equity (R$ ’000) | 03/31/2024 | 12/31/2023 | 03/31/2023 |
| | | |
| Current Liabilities | | | |
| Trade accounts payable | 4,942,766 | 5,572,219 | 6,655,038 |
| Loans, financing and debentures | 5,043,997 | 4,758,247 | 4,124,665 |
| Accounts payable for lease operations | 759,368 | 753,399 | 708,567 |
| Derivative financial instruments | 82,556 | 578,763 | 484,932 |
| Taxes payable | 480,149 | 443,454 | 489,779 |
| Payroll and charges | 534,263 | 766,905 | 447,750 |
| Liabilities for assets acquisitions and subsidiaries | 94,770 | 93,405 | 1,812,867 |
| Dividends and interest on own capital payable | 7,078 | 1,316,528 | 5,097 |
| Advance from customers | 154,588 | 172,437 | 125,734 |
| Other liabilities | 314,662 | 339,683 | 458,208 |
| Total Current Liabilities | 12,414,197 | 14,795,040 | 15,312,637 |
| | | |
| Non-Current Liabilities | | | |
| Loans, financing and debentures | 73,905,644 | 72,414,445 | 68,502,299 |
| Accounts payable for lease operations | 5,534,430 | 5,490,383 | 5,517,038 |
| Derivative financial instruments | 2,507,363 | 1,857,309 | 3,200,874 |
| Liabilities for assets acquisitions and subsidiaries | 99,159 | 93,782 | 186,141 |
| Provision for judicial liabilities | 2,876,590 | 2,860,409 | 3,214,209 |
| Actuarial liabilities | 839,185 | 833,683 | 695,964 |
| Deferred taxes | 12,596 | 11,377 | 11,377 |
| Share-based compensation plans | 320,806 | 268,489 | 170,758 |
| Provision for loss on investments in subsidiaries | 938 | — | — |
| Advance from customers | 74,715 | 74,715 | 136,161 |
| Other liabilities | 89,269 | 83,093 | 121,969 |
| Total Non-Current Liabilities | 86,260,695 | 83,987,685 | 81,756,790 |
| Total Liabilities | 98,674,892 | 98,782,725 | 97,069,427 |
| | | |
| Shareholders’ Equity | | | |
| Share capital | 9,235,546 | 9,235,546 | 9,235,546 |
| Capital reserves | 25,321 | 26,744 | 20,505 |
| Treasury shares | (935,473) | (1,484,014) | (690,343) |
| Retained earnings reserves | 34,522,473 | 35,376,198 | 22,690,645 |
| Other reserves | 1,522,641 | 1,538,296 | 1,670,888 |
| Retained earnings | 233,267 | — | 5,265,142 |
| Controlling shareholders’ | 44,603,775 | 44,692,770 | 38,192,383 |
| Non-controlling interest | 120,824 | 117,530 | 109,411 |
| Total Equity | 44,724,599 | 44,810,300 | 38,301,794 |
| Total Liabilities and Equity | 143,399,491 | 143,593,025 | 135,371,221 |
APPENDIX 4 – Consolidated Statement of Cash Flow
| | | | | | | | |
| Cash Flow (R$ ’000) | 1Q24 | 1Q23 |
| OPERATING ACTIVITIES | | |
| Net income (loss) for the period | 220,032 | 5,242,793 |
| | |
| Depreciation, depletion and amortization | 1,899,297 | 1,681,182 |
| Depreciation of right of use | 82,727 | 66,532 |
| Interest expense on lease liabilities | 109,806 | 111,966 |
| Result from sale and disposal of property, plant and equipment and biological assets, net | 47,554 | 42,748 |
| Income (expense) from associates and joint ventures | 9,907 | (14,471) |
| Exchange rate and monetary variations, net | 1,699,328 | (1,248,118) |
| Interest expenses on financing, loans and debentures | 1,230,849 | 1,152,740 |
| Capitalized loan costs | (377,560) | (233,418) |
| Accrual of interest on marketable securities | (312,425) | (196,013) |
| Amortization of transaction costs | 17,308 | 16,206 |
| Derivative gains, net | 634,537 | (1,995,253) |
| Deferred income tax and social contribution | (822,208) | 1,419,825 |
| Interest on actuarial liabilities | 18,963 | 17,307 |
| Provision for judicial liabilities, net | 29,015 | 33,728 |
| Tax litigation reduction program | — | 14,031 |
| Provision (reversal) for doubtful accounts, net | (1,317) | 2,890 |
| Provision (reversal) for inventory losses, net | 8,030 | (9,141) |
| Provision (reversal) for loss of ICMS credits, net | (23,763) | 77,674 |
| Other | 15,121 | 7,308 |
| Decrease (increase) in assets | 67,771 | (257,386) |
| Trade accounts receivable | 373,116 | 74,816 |
| Inventories | (298,050) | (371,738) |
| Recoverable taxes | 8,363 | (69,807) |
| Other assets | (15,658) | 109,343 |
| Increase (decrease) in liabilities | (299,562) | (397,913) |
| Trade accounts payable | (141,975) | (144,111) |
| Taxes payable | 90,822 | 88,148 |
| Payroll and charges | (232,642) | (226,775) |
| Other liabilities | (15,767) | (115,175) |
| Cash provided by operating activities | 4,253,410 | 5,535,217 |
| Payment of interest on financing, loans and debentures | (1,749,517) | (1,597,534) |
| Capitalized loan costs paid | 377,560 | 233,418 |
| Interest received on marketable securities | 228,249 | 168,762 |
| Payment of income taxes | (55,574) | (42,653) |
| Cash provided by operating activities | 3,054,128 | 4,297,212 |
| | |
| INVESTING ACTIVITIES | | |
| Additions to property, plant and equipment | (2,556,172) | (2,449,752) |
| Additions to intangible | (55,110) | (17) |
| Additions to biological assets | (1,631,502) | (1,393,291) |
| Proceeds from sales of property, plant and equipment and biological assets | 26,719 | 24,941 |
| Capital increase in affiliates | (18,908) | (20,263) |
| Marketable securities, net | (1,566,266) | (4,734,298) |
| Advances for acquisition (receipt) of wood from operations with development and partnerships | (235,775) | (261,018) |
| Cash used in investing activities | (6,037,014) | (8,833,698) |
| | |
| FINANCING ACTIVITIES | | |
| Proceeds from loans, financing and debentures | 4,244,874 | 50,691 |
| Receipt of derivative transactions | 444,112 | 365,724 |
| Payment of loans, financing and debentures | (4,038,400) | (59,053) |
| Payment of leases | (320,643) | (292,682) |
| Payment of interest on own capital | (1,309,450) | 5 |
| Liabilities for assets acquisitions and subsidiaries | — | (16,929) |
| Shares repurchased | (309,952) | (87,244) |
| Cash provided (used) by financing activities | (1,289,459) | (39,488) |
| | |
| EXCHANGE VARIATION ON CASH AND CASH EQUIVALENTS | 129,600 | (168,712) |
| | |
| Increase (decrease) in cash and cash equivalents, net | (4,142,745) | (4,744,687) |
| At the beginning of the period | 8,345,871 | 9,505,951 |
| At the end of the period | 4,203,126 | 4,761,264 |
| Increase (decrease) in cash and cash equivalents, net | (4,142,745) | (4,744,687) |
APPENDIX 5 – EBITDA
| | | | | | | | |
| (R$ '000, except where otherwise indicated) | 1Q24 | 1Q23 |
| Net income | 220,032 | 5,242,793 |
| Net Financial Result | 3,040,048 | (2,470,107) |
| Income and Social Contribution Taxes | (707,854) | 1,533,602 |
| EBIT | 2,552,226 | 4,306,288 |
| Depreciation, Amortization and Depletion | 1,982,024 | 1,747,714 |
| EBITDA¹ | 4,534,250 | 6,054,002 |
| EBITDA Margin | 48% | 54% |
| | |
| Equity method | 9,907 | (14,471) |
| Termination of packaging subsidiary | 1,190 | — |
| Tissue Operation Kimberly Clark Brazil | — | 6,354 |
| Effective loss of the development contract advance program | 10 | — |
| Accruals for losses on ICMS credits | (23,763) | 77,673 |
| Income from disposal and write-off of property, plant and equipment and biological assets | 36,311 | 30,957 |
| Adjusted EBITDA | 4,557,906 | 6,154,515 |
| Adjusted EBITDA Margin | 48% | 55% |
1 The Company's EBITDA is calculated in accordance with CVM Instruction 527 of October 4, 2012.
APPENDIX 6 – Segmented Income Statement
| | | | | | | | | | | | | | | | | | | | | | | | | | |
| Segmented Financial Statement (R$ '000) | 1Q24 | 1Q23 |
| Pulp | Paper | Non Segmented | Total Consolidated | Pulp | Paper | Non Segmented | Total Consolidated |
| | | | | | | | |
| Net Revenue | 7,359,846 | 2,098,756 | — | 9,458,602 | 9,201,079 | 2,075,304 | — | 11,276,383 |
| Cost of Goods Sold | (4,374,903) | (1,324,967) | — | (5,699,870) | (4,808,051) | (1,160,623) | — | (5,968,674) |
| Gross Profit | 2,984,943 | 773,789 | — | 3,758,732 | 4,393,028 | 914,681 | — | 5,307,709 |
| Gross Margin | 41% | 37% | | 40% | 48% | 44% | — | 47% |
| | | | | | | | |
| Operating Expense/Income | (872,594) | (333,912) | — | (1,206,506) | (766,979) | (234,442) | — | (1,001,421) |
| Selling Expenses | (446,409) | (207,006) | — | (653,415) | (468,807) | (135,546) | — | (604,353) |
| General and Administrative Expenses | (362,973) | (140,002) | — | (502,975) | (275,655) | (114,580) | — | (390,235) |
| Other Operating Income (Expenses) | (45,844) | 5,635 | — | (40,209) | (17,709) | (3,595) | — | (21,304) |
| Equity Equivalence | (17,368) | 7,461 | — | (9,907) | (4,808) | 19,279 | — | 14,471 |
| EBIT | 2,112,349 | 439,877 | — | 2,552,226 | 3,626,049 | 680,239 | — | 4,306,288 |
| | | | | | | | |
| Depreciation, Amortization & Depletion | 1,751,690 | 230,334 | — | 1,982,024 | 1,591,875 | 155,839 | — | 1,747,714 |
| | | | | | | | |
| EBITDA | 3,864,039 | 670,211 | — | 4,534,250 | 5,217,924 | 836,078 | — | 6,054,002 |
| EBITDA Margin | 53% | 32% | — | 48% | 57% | 40% | — | 54% |
| | | | | | | | |
| Adjusted EBITDA¹ | 3,902,250 | 655,656 | — | 4,557,906 | 5,336,202 | 818,313 | — | 6,154,515 |
| Adjusted EBITDA Margin¹ | 53% | 31% | — | 48% | 58% | 39% | — | 55% |
| | | | | | | | |
| Net Financial Result | — | — | (3,040,048) | (3,040,048) | — | — | 2,470,107 | 2,470,107 |
| | | | | | | | |
| Earnings Before Taxes | 2,112,349 | 439,877 | (3,040,048) | (487,822) | 3,626,049 | 680,239 | 2,470,107 | 6,776,395 |
| | | | | | | | |
| Income and Social Contribution Taxes | — | — | 707,854 | 707,854 | — | — | (1,533,602) | (1,533,602) |
| | | | | | | | |
| Net Income (Loss) | 2,112,349 | 439,877 | (2,332,194) | 220,032 | 3,626,049 | 680,239 | 936,505 | 5,242,793 |
| Net Margin | 29% | 21% | — | 2% | 39% | 33% | — | 46% |
1 Excluding non-recurring items and PPA effects.
Forward-Looking Statements
This release may contain forward-looking statements. Such statements are subject to known and unknown risks and uncertainties due to which such expectations may not happen at all or may substantially differ from what was expected. These risks include, among others, changes in future demand for the Company’s products, changes in factors affecting domestic and international product prices, changes in the cost structure, changes in the seasonal patterns of markets, changes in prices charged by competitors, foreign exchange variations, changes in the political or economic situation of Brazil, as well as emerging and international markets. The forward-looking statements were not reviewed by our independent auditors.
Suzano (NYSE:SUZ)
Gráfica de Acción Histórica
De Abr 2024 a May 2024

Suzano (NYSE:SUZ)
Gráfica de Acción Histórica
De May 2023 a May 2024
