Bitcoin Analyst Says The BTC Leg Up Is Halfway: Next Stop $74,000?
21 Mayo 2024 - 3:00PM
NEWSBTC
Bitcoin is firm, recently trending above $71,200 and easing past
local resistance levels, much to the delight of holders. However,
the current leg up is just the beginning for Willy Woo, an on-chain
analyst. Bitcoin Rally Getting Started: Analyst Taking to X, Woo,
who has been maintaining a bullish outlook for the world’s most
valuable coin, boldly asserts that the current Bitcoin
rally is only halfway through its welcomed bullish journey.
Sharing a chart, the on-chain analyst notes that the Bitcoin VWAP
oscillator just bottomed up from oversold territory and is now at
the zero mark, which is midway. Though Woo is upbeat and expecting
even more gains, the analyst didn’t specify when or at what level
prices will peak. Related Reading: Shiba Inu Breaks Out Of Bull
Flag Pattern-Like, Signaling Uptrend Even so, the analyst explained
that a period of consolidation below the all-time high is
necessary. Woo says this consolidation might allow users to
accumulate before a “second leg” propels the Bitcoin to new
heights. Looking at the Bitcoin daily chart, this “second leg” is
expected to be a breakout moment that will lift the coin above
March highs. At press time, Bitcoin is still in a bullish
formation. The uptick above $68,000 and last week’s high were
crucial for trend definition. Moreover, since the May 20 breakout
bar is wide-ranging and has a high trading volume, the odds of
trend continuation are high. If bulls follow through, confirming
May 20 gains, BTC will likely break $73,800, aligning with Woo’s
forecast. BTC Bull Run To Last 300 Days If There Is No Black Swan
Event Besides Woo, another analyst says the Bitcoin
uptrend is in full swing. Sharing a chart, the trader said that
barring any unforeseen disruptions, such as the impact of
a major exchange going bankrupt, it is highly likely that
the current bull run will extend for another 300 days. This
prediction is based on profit and loss analysis of short-term
holders (STHs) with a 90-day moving average. Currently, the STH is
moving lower but is relatively higher. Analysts use the STH to
determine market sentiment from short-term price movements and
trader speculations. Related Reading: Why Is The Ethereum Price Up
20% Today? As sentiment improves and prices recover, the pace at
which the coin edges higher will depend on external factors.
Besides the impact of the United States Federal Reserve and their
monetary policy declaration, inflow to spot Bitcoin exchange-traded
funds (ETFs) will be crucial. After a lull, demand is picking up,
helping to propel bulls. Feature image from DALLE, chart from
TradingView
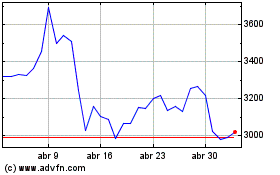
Ethereum (COIN:ETHUSD)
Gráfica de Acción Histórica
De May 2024 a Jun 2024

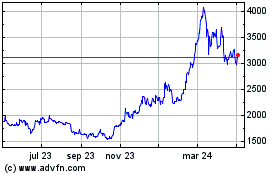
Ethereum (COIN:ETHUSD)
Gráfica de Acción Histórica
De Jun 2023 a Jun 2024
