Pay vs Performance Disclosure - USD ($)
|
5 Months Ended |
7 Months Ended |
12 Months Ended |
Sep. 25, 2021 |
May 01, 2021 |
Sep. 30, 2023 |
Sep. 24, 2022 |
Sep. 25, 2021 |
| Pay vs Performance Disclosure [Table] |
|
|
|
|
|
| Pay vs Performance [Table Text Block] |
|
|
PAY VERSUS PERFORMANCE
As required by Section 953(a) of the Dodd-Frank Wall Street Reform and Consumer Protection
Act, and Item 402(v) of Regulation S-K, we are providing the following information about the relationship between executive compensation actually paid and certain financial performance of the Company. For further information concerning how the
Company aligns executive compensation with the Company’s performance, refer to “Compensation Discussion and Analysis.”
|
2023
|
|
|
4,569,359
|
|
|
—
|
|
|
5,061,370
|
|
|
—
|
|
|
964,224
|
|
|
1,024,944
|
|
|
132.13
|
|
|
114.15
|
|
|
78,906
|
|
|
181,555
|
|
2022
|
|
|
3,048,158
|
|
|
—
|
|
|
1,999,614
|
|
|
—
|
|
|
696,179
|
|
|
560,871
|
|
|
102.64
|
|
|
111.70
|
|
|
47,235
|
|
|
124,068
|
|
2021
|
|
|
1,493,218
|
|
|
561,299
|
|
|
1,908,781
|
|
|
955,872
|
|
|
393,859
|
|
|
480,685
|
|
|
118.98
|
|
|
104.52
|
|
|
55,607
|
|
|
127,952
|
|
(1)
|
The dollar amounts reported in column (b1) are the amounts of total compensation reported for Mr. Fachner (our Chief Executive Officer) for each corresponding year in the “Total” column of the Summary Compensation Table. Mr. Fachner
began serving as Chief Executive Officer in May 2021, subsequent to Mr. Shreiber’s service as Chief Executive Officer which ended in May 2021.
|
|
(2)
|
The dollar amounts reported in column (b2) are the amounts of total compensation reported for Mr. Shreiber (our Chief Executive Officer in fiscal year 2021) for fiscal year 2021 in the “Total” column of the Summary Compensation Table
for fiscal year 2021.
|
|
(3)
|
The dollar amounts reported in column (c1) represent the amount of “compensation actually paid” to Mr. Fachner, as computed in
accordance with Item 402(v) of Regulation S-K. The dollar amounts do not reflect the actual amount of compensation earned by or paid to Mr. Fachner during the applicable year. In accordance with the requirements of Item 402(v) of
Regulation S-K, the following adjustments were made to Mr. Fachner’s total compensation for each year to determine the compensation actually paid:
|
|
2023
|
|
|
$4,569,359
|
|
|
$2,250,063
|
|
|
$492,011
|
|
|
$5,061,370
|
|
2022
|
|
|
$3,048,158
|
|
|
$1,500,032
|
|
|
$(1,048,544)
|
|
|
$1,999,614
|
|
2021
|
|
|
$1,493,218
|
|
|
—
|
|
|
$415,563
|
|
|
$1,908,781
|
|
(a)
|
The equity award adjustments include the addition (or subtraction, as applicable) of the amounts specified in the following table, in
accordance with Item 402(v) of Regulation S-K. The valuation assumptions used to calculate fair values did not materially differ from those disclosed at the time of grant. The amounts deducted or added in calculating the equity award
adjustments are as follows:
|
|
2023
|
|
|
$(2,250,063)
|
|
|
$2,429,712
|
|
|
$87,263
|
|
|
$177,672
|
|
|
—
|
|
|
$47,427
|
|
|
$492,011
|
|
2022
|
|
|
$(1,500,032)
|
|
|
$661,007(1)
|
|
|
$(120,401)
|
|
|
$(101,695)
|
|
|
—
|
|
|
$12,577
|
|
|
$(1,048,544)
|
|
2021
|
|
|
—
|
|
|
—
|
|
|
$248,077
|
|
|
$167,486
|
|
|
—
|
|
|
—
|
|
|
$415,563
|
|
(1)
|
The year end fair value of equity awards in fiscal year 2022 does not include the value of the performance-vesting restricted stock
units granted during the fiscal year. The performance condition related to these awards was determined to not likely be met as of the end of the fiscal year in which the awards were granted.
|
|
(4)
|
The dollar amounts reported in column (c2) represent the amount of “compensation actually paid” to Mr. Shreiber, as computed in
accordance with Item 402(v) of Regulation S-K. The dollar amounts do not reflect the actual amount of compensation earned by or paid to Mr. Shreiber during the applicable year. In accordance with the requirements of Item 402(v) of
Regulation S-K, the following adjustments were made to Mr. Shreiber’s total compensation to determine the compensation actually paid:
|
|
2021
|
|
|
$561,299
|
|
|
$560,600
|
|
|
$394,573
|
|
|
$955,872
|
|
(a)
|
The equity award adjustments include the addition (or subtraction, as applicable) of the amounts specified in the following table, in
accordance with Item 402(v) of Regulation S-K. The valuation assumptions used to calculate fair values did not materially differ from those disclosed at the time of grant. The amounts deducted or added in calculating the equity award
adjustments are as follows:
|
|
2021
|
|
|
$(560,600)
|
|
|
$475,061
|
|
|
$480,112
|
|
|
—
|
|
|
—
|
|
|
—
|
|
|
$394,573
|
|
(5)
|
The dollar amounts reported in column (d) represent the average of the amounts reported for the Company’s NEOs as a group (excluding
Mr. Fachner and Mr. Shreiber) in the “Total” column of the Summary Compensation Table in each applicable year. The names of each of the NEOs (excluding Mr. Fachner and Mr. Shreiber) included for purposes of calculating the average amounts
in each applicable year are as follows: (i) for 2023 and 2022, Ken Plunk, Stephen Every, Lynwood Mallard, and Bob Cranmer and (ii) for 2021, Ken Plunk, Robert Pape, Stephen Every, Lynwood Mallard, Robert Radano and Dennis Moore.
|
|
(6)
|
The dollar amounts reported in column (e) represent the average amount of “compensation actually paid” to the NEOs as a group
(excluding Mr. Fachner and Mr. Shreiber), as computed in accordance with Item 402(v) of Regulation S-K. The dollar amounts do not reflect the actual average amount of compensation earned by or paid to the NEOs as a group (excluding
Mr. Fachner and Mr. Shreiber) during the applicable year. In accordance with the requirements of Item 402(v) of Regulation S-K, the following adjustments were made to average total compensation for the NEOs as a group (excluding
Mr. Fachner and Mr. Shreiber) for each year to determine the compensation actually paid, using the same methodology described above in Note 3:
|
|
2023
|
|
|
$964,224
|
|
|
$318,786
|
|
|
$60,720
|
|
|
$1,024,944
|
|
2022
|
|
|
$696,179
|
|
|
$212,519
|
|
|
$(135,308)
|
|
|
$560,871
|
|
2021
|
|
|
$393,859
|
|
|
$34,625
|
|
|
$86,826
|
|
|
$480,685
|
|
(a)
|
The amounts deducted or added in calculating the total average equity award adjustments in accordance with Item 402(v) of Regulation
S-K are as follows:
|
|
2023
|
|
|
$(318,786)
|
|
|
$344,238
|
|
|
$15,926
|
|
|
$12,250
|
|
|
—
|
|
|
$7,092
|
|
|
$60,720
|
|
2022
|
|
|
$(212,519)
|
|
|
$93,639(1)
|
|
|
$(13,268)
|
|
|
$(5,626)
|
|
|
—
|
|
|
$2,466
|
|
|
$(135,308)
|
|
2021
|
|
|
$(34,625)
|
|
|
$40,436
|
|
|
$48,407
|
|
|
$31,972
|
|
|
—
|
|
|
$636
|
|
|
$86,826
|
|
(1)
|
The year end fair value of equity awards in fiscal year 2022 does not include the value of the performance-vesting restricted stock
units granted during the fiscal year. The performance condition related to these awards was determined to not likely be met as of the end of the fiscal year in which they were granted.
|
|
(7)
|
Cumulative TSR is calculated by dividing the sum of the cumulative amount of dividends for the measurement period, assuming dividend
reinvestment, and the difference between the Company’s share price at the end and the beginning of the measurement period by the Company’s share price at the beginning of the measurement period.
|
|
(8)
|
Represents the weighted peer group TSR, weighted according to the respective companies’ stock market capitalization at the beginning
of each period for which a return is indicated. The peer group used for this purpose is the following published industry index: S&P 500 Packaged Foods & Meats Index.
|
|
(9)
|
The dollar amounts reported represent the amount of net earnings (in thousands) reflected in the Company’s audited financial
statements for the applicable year.
|
|
(10)
|
The dollar amounts reported reflect Adjusted EBITDA (in thousands), which is a performance measure used when determining annual
non-equity incentive bonuses and a portion of our long-term equity grants. Adjusted EBITDA consists of net earnings adjusted to exclude: income taxes (benefit); investment income; interest expense; depreciation and amortization;
share-based compensation expense; COVID-19 related expenses (recoveries); net (gain) loss on sale or disposal of assets; impairment charges, restructuring costs, merger and acquisition costs, acquisition related inventory adjustments,
strategic business transformation costs, and integration costs.
|
|
|
|
| Company Selected Measure Name |
|
|
Adjusted EBITDA
|
|
|
| Named Executive Officers, Footnote [Text Block] |
|
|
|
(5)
|
The dollar amounts reported in column (d) represent the average of the amounts reported for the Company’s NEOs as a group (excluding
Mr. Fachner and Mr. Shreiber) in the “Total” column of the Summary Compensation Table in each applicable year. The names of each of the NEOs (excluding Mr. Fachner and Mr. Shreiber) included for purposes of calculating the average amounts
in each applicable year are as follows: (i) for 2023 and 2022, Ken Plunk, Stephen Every, Lynwood Mallard, and Bob Cranmer and (ii) for 2021, Ken Plunk, Robert Pape, Stephen Every, Lynwood Mallard, Robert Radano and Dennis Moore.
|
|
|
|
| Peer Group Issuers, Footnote [Text Block] |
|
|
|
(8)
|
Represents the weighted peer group TSR, weighted according to the respective companies’ stock market capitalization at the beginning
of each period for which a return is indicated. The peer group used for this purpose is the following published industry index: S&P 500 Packaged Foods & Meats Index.
|
|
|
|
| Adjustment To PEO Compensation, Footnote [Text Block] |
|
|
|
(3)
|
The dollar amounts reported in column (c1) represent the amount of “compensation actually paid” to Mr. Fachner, as computed in
accordance with Item 402(v) of Regulation S-K. The dollar amounts do not reflect the actual amount of compensation earned by or paid to Mr. Fachner during the applicable year. In accordance with the requirements of Item 402(v) of
Regulation S-K, the following adjustments were made to Mr. Fachner’s total compensation for each year to determine the compensation actually paid:
|
|
2023
|
|
|
$4,569,359
|
|
|
$2,250,063
|
|
|
$492,011
|
|
|
$5,061,370
|
|
2022
|
|
|
$3,048,158
|
|
|
$1,500,032
|
|
|
$(1,048,544)
|
|
|
$1,999,614
|
|
2021
|
|
|
$1,493,218
|
|
|
—
|
|
|
$415,563
|
|
|
$1,908,781
|
|
(a)
|
The equity award adjustments include the addition (or subtraction, as applicable) of the amounts specified in the following table, in
accordance with Item 402(v) of Regulation S-K. The valuation assumptions used to calculate fair values did not materially differ from those disclosed at the time of grant. The amounts deducted or added in calculating the equity award
adjustments are as follows:
|
|
2023
|
|
|
$(2,250,063)
|
|
|
$2,429,712
|
|
|
$87,263
|
|
|
$177,672
|
|
|
—
|
|
|
$47,427
|
|
|
$492,011
|
|
2022
|
|
|
$(1,500,032)
|
|
|
$661,007(1)
|
|
|
$(120,401)
|
|
|
$(101,695)
|
|
|
—
|
|
|
$12,577
|
|
|
$(1,048,544)
|
|
2021
|
|
|
—
|
|
|
—
|
|
|
$248,077
|
|
|
$167,486
|
|
|
—
|
|
|
—
|
|
|
$415,563
|
|
(1)
|
The year end fair value of equity awards in fiscal year 2022 does not include the value of the performance-vesting restricted stock
units granted during the fiscal year. The performance condition related to these awards was determined to not likely be met as of the end of the fiscal year in which the awards were granted.
|
|
(4)
|
The dollar amounts reported in column (c2) represent the amount of “compensation actually paid” to Mr. Shreiber, as computed in
accordance with Item 402(v) of Regulation S-K. The dollar amounts do not reflect the actual amount of compensation earned by or paid to Mr. Shreiber during the applicable year. In accordance with the requirements of Item 402(v) of
Regulation S-K, the following adjustments were made to Mr. Shreiber’s total compensation to determine the compensation actually paid:
|
|
2021
|
|
|
$561,299
|
|
|
$560,600
|
|
|
$394,573
|
|
|
$955,872
|
|
(a)
|
The equity award adjustments include the addition (or subtraction, as applicable) of the amounts specified in the following table, in
accordance with Item 402(v) of Regulation S-K. The valuation assumptions used to calculate fair values did not materially differ from those disclosed at the time of grant. The amounts deducted or added in calculating the equity award
adjustments are as follows:
|
|
2021
|
|
|
$(560,600)
|
|
|
$475,061
|
|
|
$480,112
|
|
|
—
|
|
|
—
|
|
|
—
|
|
|
$394,573
|
|
|
|
| Non-PEO NEO Average Total Compensation Amount |
|
|
$ 964,224
|
$ 696,179
|
$ 393,859
|
| Non-PEO NEO Average Compensation Actually Paid Amount |
|
|
$ 1,024,944
|
560,871
|
480,685
|
| Adjustment to Non-PEO NEO Compensation Footnote [Text Block] |
|
|
|
(6)
|
The dollar amounts reported in column (e) represent the average amount of “compensation actually paid” to the NEOs as a group
(excluding Mr. Fachner and Mr. Shreiber), as computed in accordance with Item 402(v) of Regulation S-K. The dollar amounts do not reflect the actual average amount of compensation earned by or paid to the NEOs as a group (excluding
Mr. Fachner and Mr. Shreiber) during the applicable year. In accordance with the requirements of Item 402(v) of Regulation S-K, the following adjustments were made to average total compensation for the NEOs as a group (excluding
Mr. Fachner and Mr. Shreiber) for each year to determine the compensation actually paid, using the same methodology described above in Note 3:
|
|
2023
|
|
|
$964,224
|
|
|
$318,786
|
|
|
$60,720
|
|
|
$1,024,944
|
|
2022
|
|
|
$696,179
|
|
|
$212,519
|
|
|
$(135,308)
|
|
|
$560,871
|
|
2021
|
|
|
$393,859
|
|
|
$34,625
|
|
|
$86,826
|
|
|
$480,685
|
|
(a)
|
The amounts deducted or added in calculating the total average equity award adjustments in accordance with Item 402(v) of Regulation
S-K are as follows:
|
|
2023
|
|
|
$(318,786)
|
|
|
$344,238
|
|
|
$15,926
|
|
|
$12,250
|
|
|
—
|
|
|
$7,092
|
|
|
$60,720
|
|
2022
|
|
|
$(212,519)
|
|
|
$93,639(1)
|
|
|
$(13,268)
|
|
|
$(5,626)
|
|
|
—
|
|
|
$2,466
|
|
|
$(135,308)
|
|
2021
|
|
|
$(34,625)
|
|
|
$40,436
|
|
|
$48,407
|
|
|
$31,972
|
|
|
—
|
|
|
$636
|
|
|
$86,826
|
|
(1)
|
The year end fair value of equity awards in fiscal year 2022 does not include the value of the performance-vesting restricted stock
units granted during the fiscal year. The performance condition related to these awards was determined to not likely be met as of the end of the fiscal year in which they were granted.
|
|
|
|
| Compensation Actually Paid vs. Total Shareholder Return [Text Block] |
|
|
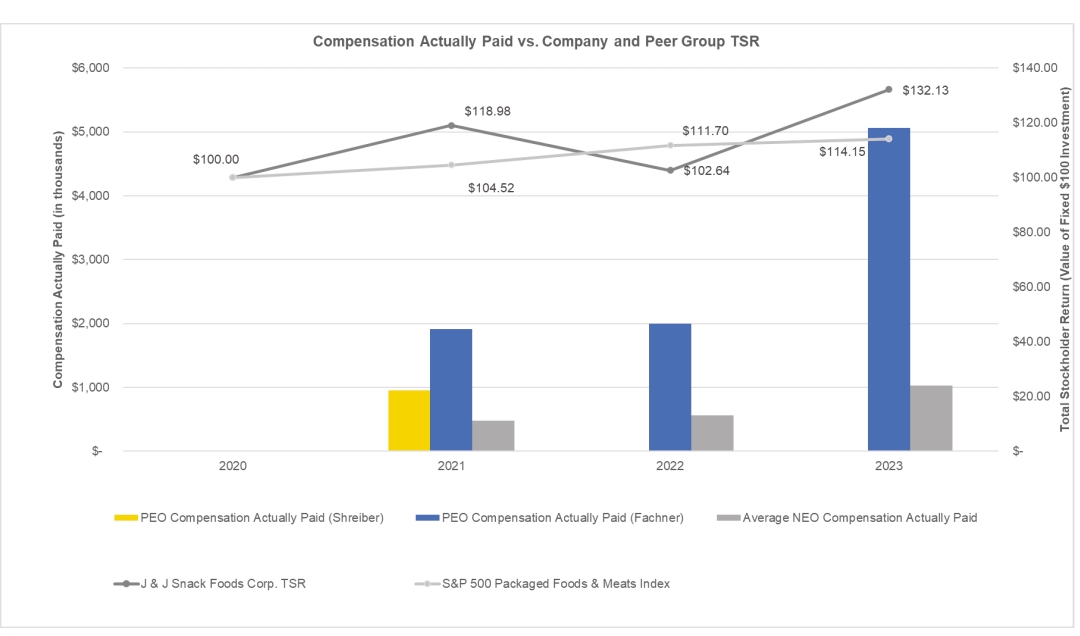
Compensation Actually Paid and Cumulative TSR
As demonstrated by the following graph, the amount of compensation actually paid to
Mr. Fachner and Mr. Shreiber, and the average amount of compensation actually paid to the Company’s NEOs as a group (excluding Mr. Fachner and Mr. Shreiber) is aligned with the Company’s cumulative TSR over the three years presented in the table.
The alignment of compensation actually paid with the Company’s cumulative TSR over the period presented is because a significant portion of the compensation actually paid to Mr. Fachner, Mr. Shreiber, and to the other NEOs, is comprised of equity
awards. The Company’s cumulative TSR over the three-year period presented in the table was 32%, while the cumulative TSR of the peer group presented for this purpose, the S&P 500 Packaged Foods & Meats Index, was 14% over the three years
presented in the table. The Company’s cumulative TSR outperformed the S&P 500 Packaged Foods & Meats Index during the three years presented in the table, representing the Company’s superior financial performance as compared to the
companies comprising the S&P 500 Packaged Foods & Meats Index.
|
|
|
| Compensation Actually Paid vs. Net Income [Text Block] |
|
|
Compensation Actually Paid and Net Earnings
As demonstrated by the following graph, the amount of compensation actually paid to
Mr. Fachner and Mr. Shreiber, and the average amount of compensation actually paid to the Company’s NEOs as a group (excluding Mr. Fachner and Mr. Shreiber) is generally aligned with the Company’s net earnings over the three years presented in
the table. While the Company does not use net earnings as a performance measure in the overall executive compensation program, the measure of net earnings is correlated with the measure Adjusted EBITDA, which the company does use for when setting
goals in the Company’s incentive plans.
|
|
|
| Compensation Actually Paid vs. Company Selected Measure [Text Block] |
|
|
Compensation Actually Paid and Adjusted EBITDA
As demonstrated by the following graph, the amount of compensation actually paid to
Mr. Fachner and Mr. Shreiber and the average amount of compensation actually paid to the Company’s NEOs as a group (excluding Mr. Fachner and Mr. Shreiber) is generally aligned with the Company’s Adjusted EBITDA over the three years presented in
the table. The Company has determined that Adjusted EBITDA is the financial performance measure that, in the Company’s assessment, represents the most important performance measure (that is not otherwise required to be disclosed in the table)
used by the Company to link compensation actually paid to the company’s NEOs, for the most recently completed fiscal year, to Company performance. The Company utilizes Adjusted EBITDA when determining annual non-equity incentive bonuses and the
Company’s long term equity awards.
|
|
|
| Total Shareholder Return Vs Peer Group [Text Block] |
|
|
Compensation Actually Paid and Cumulative TSR
As demonstrated by the following graph, the amount of compensation actually paid to
Mr. Fachner and Mr. Shreiber, and the average amount of compensation actually paid to the Company’s NEOs as a group (excluding Mr. Fachner and Mr. Shreiber) is aligned with the Company’s cumulative TSR over the three years presented in the table.
The alignment of compensation actually paid with the Company’s cumulative TSR over the period presented is because a significant portion of the compensation actually paid to Mr. Fachner, Mr. Shreiber, and to the other NEOs, is comprised of equity
awards. The Company’s cumulative TSR over the three-year period presented in the table was 32%, while the cumulative TSR of the peer group presented for this purpose, the S&P 500 Packaged Foods & Meats Index, was 14% over the three years
presented in the table. The Company’s cumulative TSR outperformed the S&P 500 Packaged Foods & Meats Index during the three years presented in the table, representing the Company’s superior financial performance as compared to the
companies comprising the S&P 500 Packaged Foods & Meats Index.
|
|
|
| Tabular List [Table Text Block] |
|
|
Financial Performance Measures
The financial measures that the Company uses for both our long-term and short-term
incentive awards are selected based on an objective of incentivizing our NEOs to increase the value of our enterprise for our shareholders. The most important financial performance measures used by the Company to link executive compensation
actually paid to the Company’s NEOs, for the most recently completed fiscal year, to the Company’s performance are as follows:
|
|
|
| Total Shareholder Return Amount |
|
|
$ 132.13
|
102.64
|
118.98
|
| Peer Group Total Shareholder Return Amount |
|
|
114.15
|
111.7
|
104.52
|
| Net Income (Loss) |
|
|
$ 78,906,000
|
$ 47,235,000
|
$ 55,607,000
|
| Company Selected Measure Amount |
|
|
181,555,000
|
124,068,000
|
127,952,000
|
| PEO Name |
Mr. Fachner
|
Mr. Shreiber
|
Mr. Fachner
|
Mr. Fachner
|
|
| Measure [Axis]: 1 |
|
|
|
|
|
| Pay vs Performance Disclosure [Table] |
|
|
|
|
|
| Measure Name |
|
|
Adjusted EBITDA
|
|
|
| Measure [Axis]: 2 |
|
|
|
|
|
| Pay vs Performance Disclosure [Table] |
|
|
|
|
|
| Measure Name |
|
|
Net Sales
|
|
|
| Mr. Fachner [Member] |
|
|
|
|
|
| Pay vs Performance Disclosure [Table] |
|
|
|
|
|
| PEO Total Compensation Amount |
|
|
$ 4,569,359
|
$ 3,048,158
|
$ 1,493,218
|
| PEO Actually Paid Compensation Amount |
|
|
5,061,370
|
1,999,614
|
1,908,781
|
| Mr. Shreiber [Member] |
|
|
|
|
|
| Pay vs Performance Disclosure [Table] |
|
|
|
|
|
| PEO Total Compensation Amount |
|
|
0
|
0
|
561,299
|
| PEO Actually Paid Compensation Amount |
|
|
0
|
0
|
955,872
|
| PEO [Member] | Mr. Fachner [Member] | Equity Award Adjustments [Member] |
|
|
|
|
|
| Pay vs Performance Disclosure [Table] |
|
|
|
|
|
| Adjustment to Compensation Amount |
|
|
492,011
|
(1,048,544)
|
415,563
|
| PEO [Member] | Mr. Fachner [Member] | Grant Date Fair Value of Equity Awards Granted in the Year [Member] |
|
|
|
|
|
| Pay vs Performance Disclosure [Table] |
|
|
|
|
|
| Adjustment to Compensation Amount |
|
|
(2,250,063)
|
(1,500,032)
|
0
|
| PEO [Member] | Mr. Fachner [Member] | Year End Fair Value of Equity Awards [Member] |
|
|
|
|
|
| Pay vs Performance Disclosure [Table] |
|
|
|
|
|
| Adjustment to Compensation Amount |
|
|
2,429,712
|
661,007
|
0
|
| PEO [Member] | Mr. Fachner [Member] | Year Over Year Change in Fair Value of Outstanding and Unvested Equity Awards [Member] |
|
|
|
|
|
| Pay vs Performance Disclosure [Table] |
|
|
|
|
|
| Adjustment to Compensation Amount |
|
|
87,263
|
(120,401)
|
248,077
|
| PEO [Member] | Mr. Fachner [Member] | Change in Fair Value of Equity Awards Granted in Prior Years that Vested in the Year [Member] |
|
|
|
|
|
| Pay vs Performance Disclosure [Table] |
|
|
|
|
|
| Adjustment to Compensation Amount |
|
|
177,672
|
(101,695)
|
167,486
|
| PEO [Member] | Mr. Fachner [Member] | Fair Value at the End of the Prior Year of Equity Awards that Failed to Meet Vesting Conditions in the Year [Member] |
|
|
|
|
|
| Pay vs Performance Disclosure [Table] |
|
|
|
|
|
| Adjustment to Compensation Amount |
|
|
0
|
0
|
0
|
| PEO [Member] | Mr. Fachner [Member] | Value of Dividends or other Earnings Paid on Stock or Option Awards not Otherwise Reflected in Fair Value or Total Compensation [Member] |
|
|
|
|
|
| Pay vs Performance Disclosure [Table] |
|
|
|
|
|
| Adjustment to Compensation Amount |
|
|
47,427
|
12,577
|
0
|
| PEO [Member] | Mr. Shreiber [Member] | Equity Award Adjustments [Member] |
|
|
|
|
|
| Pay vs Performance Disclosure [Table] |
|
|
|
|
|
| Adjustment to Compensation Amount |
|
|
|
|
394,573
|
| PEO [Member] | Mr. Shreiber [Member] | Grant Date Fair Value of Equity Awards Granted in the Year [Member] |
|
|
|
|
|
| Pay vs Performance Disclosure [Table] |
|
|
|
|
|
| Adjustment to Compensation Amount |
|
|
|
|
(560,600)
|
| PEO [Member] | Mr. Shreiber [Member] | Year End Fair Value of Equity Awards [Member] |
|
|
|
|
|
| Pay vs Performance Disclosure [Table] |
|
|
|
|
|
| Adjustment to Compensation Amount |
|
|
|
|
475,061
|
| PEO [Member] | Mr. Shreiber [Member] | Year Over Year Change in Fair Value of Outstanding and Unvested Equity Awards [Member] |
|
|
|
|
|
| Pay vs Performance Disclosure [Table] |
|
|
|
|
|
| Adjustment to Compensation Amount |
|
|
|
|
480,112
|
| PEO [Member] | Mr. Shreiber [Member] | Change in Fair Value of Equity Awards Granted in Prior Years that Vested in the Year [Member] |
|
|
|
|
|
| Pay vs Performance Disclosure [Table] |
|
|
|
|
|
| Adjustment to Compensation Amount |
|
|
|
|
0
|
| PEO [Member] | Mr. Shreiber [Member] | Fair Value at the End of the Prior Year of Equity Awards that Failed to Meet Vesting Conditions in the Year [Member] |
|
|
|
|
|
| Pay vs Performance Disclosure [Table] |
|
|
|
|
|
| Adjustment to Compensation Amount |
|
|
|
|
0
|
| PEO [Member] | Mr. Shreiber [Member] | Value of Dividends or other Earnings Paid on Stock or Option Awards not Otherwise Reflected in Fair Value or Total Compensation [Member] |
|
|
|
|
|
| Pay vs Performance Disclosure [Table] |
|
|
|
|
|
| Adjustment to Compensation Amount |
|
|
|
|
0
|
| Non-PEO NEO [Member] | Equity Award Adjustments [Member] |
|
|
|
|
|
| Pay vs Performance Disclosure [Table] |
|
|
|
|
|
| Adjustment to Compensation Amount |
|
|
60,720
|
(135,308)
|
86,826
|
| Non-PEO NEO [Member] | Grant Date Fair Value of Equity Awards Granted in the Year [Member] |
|
|
|
|
|
| Pay vs Performance Disclosure [Table] |
|
|
|
|
|
| Adjustment to Compensation Amount |
|
|
(318,786)
|
(212,519)
|
(34,625)
|
| Non-PEO NEO [Member] | Year End Fair Value of Equity Awards [Member] |
|
|
|
|
|
| Pay vs Performance Disclosure [Table] |
|
|
|
|
|
| Adjustment to Compensation Amount |
|
|
344,238
|
93,639
|
40,436
|
| Non-PEO NEO [Member] | Year Over Year Change in Fair Value of Outstanding and Unvested Equity Awards [Member] |
|
|
|
|
|
| Pay vs Performance Disclosure [Table] |
|
|
|
|
|
| Adjustment to Compensation Amount |
|
|
15,926
|
(13,268)
|
48,407
|
| Non-PEO NEO [Member] | Change in Fair Value of Equity Awards Granted in Prior Years that Vested in the Year [Member] |
|
|
|
|
|
| Pay vs Performance Disclosure [Table] |
|
|
|
|
|
| Adjustment to Compensation Amount |
|
|
12,250
|
(5,626)
|
31,972
|
| Non-PEO NEO [Member] | Fair Value at the End of the Prior Year of Equity Awards that Failed to Meet Vesting Conditions in the Year [Member] |
|
|
|
|
|
| Pay vs Performance Disclosure [Table] |
|
|
|
|
|
| Adjustment to Compensation Amount |
|
|
0
|
0
|
0
|
| Non-PEO NEO [Member] | Value of Dividends or other Earnings Paid on Stock or Option Awards not Otherwise Reflected in Fair Value or Total Compensation [Member] |
|
|
|
|
|
| Pay vs Performance Disclosure [Table] |
|
|
|
|
|
| Adjustment to Compensation Amount |
|
|
$ 7,092
|
$ 2,466
|
$ 636
|