Prospectus Filed Pursuant to Rule 424(b)(3) (424b3)
18 Abril 2023 - 8:08AM
Edgar (US Regulatory)

Filed pursuant to Rule 424(b)(3)
File No. 333-264570
EATON VANCE
TAX-MANAGED GLOBAL BUY-WRITE OPPORTUNITIES FUND
Supplement to Prospectus dated April 29, 2022
The following replaces the Financial Highlights contained in the Prospectus:
| |
Year Ended December 31, |
| |
2022 |
2021 |
2020 |
2019 |
2018 |
| Net asset value – Beginning of year |
$ 10.930 |
$ 10.300 |
$ 10.470 |
$ 9.690 |
$ 11.590 |
| Income (Loss) From Operations |
|
|
|
|
|
| Net investment income(1) |
$ 0.102 |
$ 0.079 |
$ 0.087 |
$ 0.129 |
$ 0.141 |
| Net realized and unrealized gain (loss) |
(1.810) |
1.421 |
0.615 |
1.523 |
(0.950) |
| Total income (loss) from operations |
$ (1.708) |
$ 1.500 |
$ 0.702 |
$ 1.652 |
$ (0.809) |
| Less Distributions |
|
|
|
|
|
| From net investment income |
$ (0.112) |
$ (0.164) |
$ (0.080) |
$ (0.142) |
$ (0.129) |
| From net realized gain |
(0.651) |
(0.527) |
(0.436) |
(0.089) |
(0.550) |
| Tax return of capital |
(0.080) |
(0.181) |
(0.356) |
(0.641) |
(0.413) |
| Total distributions |
$ (0.843) |
$ (0.872) |
$ (0.872) |
$ (0.872) |
$ (1.092) |
| Premium from common shares sold through shelf offering(1) |
$ 0.001 |
$ 0.002 |
$ — |
$ — |
$ 0.001 |
| Net asset value – End of year |
$ 8.380 |
$ 10.930 |
$ 10.300 |
$ 10.470 |
$ 9.690 |
| Market value – End of year |
$ 7.760 |
$ 11.190 |
$ 9.680 |
$ 10.370 |
$ 9.530 |
| Total Investment Return on Net Asset Value(2) |
(15.73)% |
15.19% |
8.55% |
18.05% |
(7.72)% |
| Total Investment Return on Market Value(2) |
(23.77)% |
25.48% |
3.00% |
18.88% |
(11.76)% |
| Ratios/Supplemental Data |
|
|
|
|
|
| Net assets, end of year (000’s omitted) |
$ 918,958 |
$ 1,189,319 |
$ 1,107,600 |
$ 1,125,503 |
$ 1,040,883 |
| Ratios (as a percentage of average daily net assets): |
|
|
|
|
|
| Expenses |
1.11%(3) |
1.09% |
1.10% |
1.10% |
1.09% |
| Net investment income |
1.11% |
0.74% |
0.91% |
1.26% |
1.27% |
| Portfolio Turnover |
12% |
3% |
7% |
2% |
4% |
(See related footnotes.)
| |
Year Ended December 31, |
| |
2017 |
2016 |
2015 |
2014 |
2013 |
| Net asset value – Beginning of year |
$ 10.710 |
$ 11.560 |
$ 12.290 |
$ 13.130 |
$ 12.370 |
| Income (Loss) From Operations |
|
|
|
|
|
| Net investment income(1) |
$ 0.135 |
$ 0.163 |
$ 0.183 |
$ 0.233 |
$ 0.173 |
| Net realized and unrealized gain |
1.850 |
0.155 |
0.255 |
0.095 |
1.754 |
| Total income from operations |
$ 1.985 |
$ 0.318 |
$ 0.438 |
$ 0.328 |
$ 1.927 |
| Less Distributions |
|
|
|
|
|
| From net investment income |
$ (0.149) |
$ (0.155) |
$ (0.183) |
$ (0.242) |
$ (0.189) |
| Tax return of capital |
(0.956) |
(1.013) |
(0.985) |
(0.926) |
(0.979) |
| Total distributions |
$ (1.105) |
$ (1.168) |
$ (1.168) |
$ (1.168) |
$ (1.168) |
| Anti-dilutive effect of share repurchase program(1) |
$ — |
$ — |
$ — |
$ — |
$ 0.001 |
| Net asset value – End of year |
$ 11.590 |
$ 10.710 |
$ 11.560 |
$ 12.290 |
$ 13.130 |
| Market value – End of year |
$ 11.920 |
$ 10.070 |
$ 11.230 |
$ 11.020 |
$ 12.100 |
| Total Investment Return on Net Asset Value(2) |
19.28% |
3.46% |
3.92% |
2.97% |
17.46% |
| Total Investment Return on Market Value(2) |
30.47% |
0.14% |
12.59% |
0.19% |
25.26% |
| Ratios/Supplemental Data |
|
|
|
|
|
| Net assets, end of year (000’s omitted) |
$ 1,236,915 |
$ 1,139,577 |
$ 1,230,445 |
$ 1,308,077 |
$ 1,397,576 |
| Ratios (as a percentage of average daily net assets): |
|
|
|
|
|
| Expenses(4) |
1.09% |
1.10% |
1.09% |
1.10% |
1.10% |
| Net investment income |
1.20% |
1.50% |
1.50% |
1.80% |
1.37% |
| Portfolio Turnover |
1% |
8% |
7% |
2% |
2% |
| (1) | Computed using average shares outstanding. |
| (2) | Returns are historical and are calculated by determining the percentage change in net asset value or market value with all distributions
reinvested. Distributions are assumed to be reinvested at prices obtained under the Fund’s dividend reinvestment plan. |
| (3) | Includes a reduction by the investment adviser of a portion of its adviser fee due to the Fund’s investment in the Liquidity
Fund (equal to less than 0.005% of average daily net assets for the year ended December 31, 2022). |
| (4) | Excludes the effect of custody fee credits, if any, of less than 0.005%. Effective September 1, 2015, custody fee credits, which were
earned on cash deposit balances, were discontinued by the custodian. |
April 18, 2023
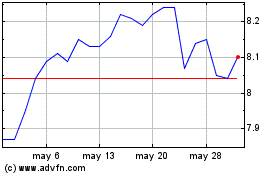
Eaton Vance Tax Managed ... (NYSE:ETW)
Gráfica de Acción Histórica
De May 2024 a Jun 2024

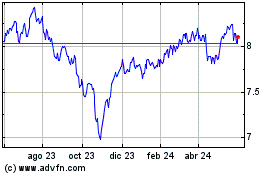
Eaton Vance Tax Managed ... (NYSE:ETW)
Gráfica de Acción Histórica
De Jun 2023 a Jun 2024
