SECURITIES AND EXCHANGE COMMISSION
Washington, DC 20549
FORM 6-K
REPORT OF FOREIGN ISSUER
PURSUANT TO RULE 13a-16 OR 15d-16 OF THE
SECURITIES EXCHANGE ACT OF 1934
For May, 2024
(Commission File No. 1-31317)
Companhia de Saneamento Básico do Estado de São Paulo - SABESP
(Exact name of registrant as specified in its charter)
Basic Sanitation Company of the State of Sao Paulo - SABESP
(Translation of Registrant's name into English)
Rua Costa Carvalho, 300
São Paulo, S.P., 05429-900
Federative Republic of Brazil
(Address of Registrant's principal executive offices)
Indicate by check mark whether the registrant files or will file
annual reports under cover Form 20-F or Form 40-F.
Form 20-F ___X___ Form 40-F ______
Indicate by check mark if the registrant is submitting the Form 6-K
in paper as permitted by Regulation S-T Rule 101(b)(1)__.
Indicate by check mark if the registrant is submitting the Form 6-K
in paper as permitted by Regulation S-T Rule 101(b)(7)__.
Indicate by check mark whether the registrant by furnishing the
information contained in this Form is also thereby furnishing the
information to the Commission pursuant to Rule 12g3-2(b) under
the Securities Exchange Act of 1934.
Yes ______ No ___X___
If "Yes" is marked, indicated below the file number assigned to the
registrant in connection with Rule 12g3-2(b):
 |
EARNINGS
RESULTS 1Q24 |
| |
|
Videoconference
May 10, Friday
10:00 a.m. (New York) / 11:00
a.m. (Brasília)
Simultaneously translation
Click
here to access the replay
ri.sabesp.com.br/en/ |
| |
 |
Earnings
Results 1Q24 |
Page 3 |
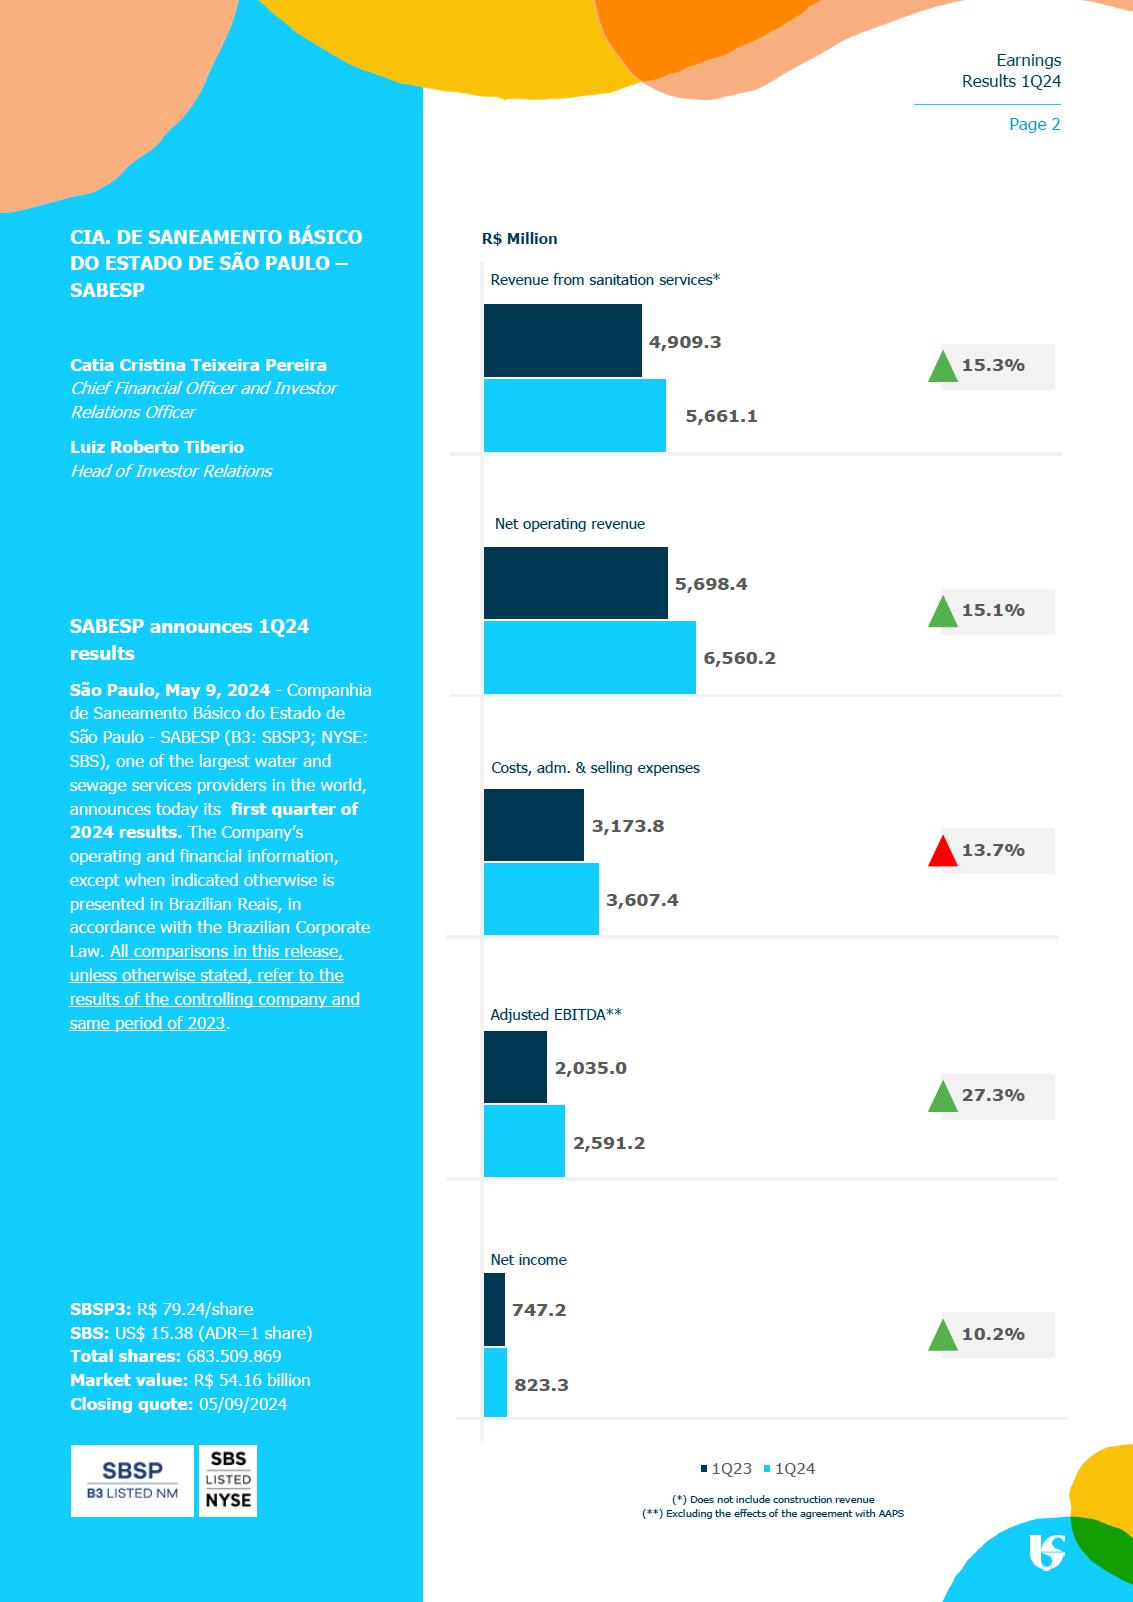
Adjusted EBITDA totaled
R$ 2,428.8 million in 1Q24, up by R$ 393.8 million (+19.4%) over the R$ 2,035.0 million reported in 1Q23. Consequently, the adjusted EBITDA
margin reached 37.0% compared to 35.7% in 1Q23, and the adjusted EBITDA margin (excluding construction revenue) reached 46.5% compared
to the 45.0% reported in 1Q23.
Excluding the effects of
the agreement with AAPS (Sabesp’s Association of Retirees and Pensioners), adjusted EBITDA was R$ 2,591.2 million in 1Q24, with
an adjusted EBITDA margin of 39.5%.
Net income came to R$ 823.3
million in 1Q24, up by R$ 76.1 million (+10.2%) over the R$ 747.2 million recorded in 1Q23.
Excluding the agreement
with AAPS, net income totaled R$ 985.7 million in 1Q24.
Revenue from sanitation services
Increase of R$ 751.8 million
(+15.3%), impacted by (i) a 9.6% tariff adjustment implemented since May 2023; and (ii) a 5.3% increase in total billed volume.
R$ million
| |
1Q24 |
1Q23 |
Var. (R$) |
% |
| Revenues from sanitation services |
5,661.1 |
4,909.3 |
751.8 |
15.3 |
| Billed volume (million m3) |
1,085.6 |
1,030.5 |
55.1 |
5.3 |
| Average tarifs |
5.2 |
4.8 |
0.5 |
9.5 |
Impacts from the exchange variation
In April 2024, the Company
executed derivative financial agreements with the financial institutions defined in the Financial Risk Policy to reduce the exposure of
the total balance in foreign currency of existing debts, totaling US$ 531 million, against fluctuations in the foreign exchange market
and mitigate the impacts of these fluctuations on the Company’s economic and financial results. The agreements are valid until December
2024.
| |
1Q24 |
1Q23 |
| Foreign currency debt - R$ million |
2,631.1 |
2,634.0 |
| Foreign currency debt as a percentage of total debt - % |
12.0 |
14.0 |
| U.S. dollar variation in the quarter - % |
3.2 |
(2.6) |
| Yen variation in the quarter - % |
(3.5) |
(3.3) |
The Company executed derivative
financial agreements with selected financial institutions to reduce the exposure of the total balance in foreign currency of the outstanding
debt, totaling US$ 531 million, against fluctuations in the foreign exchange market and mitigate the impacts of these fluctuations on
the Company’s economic and financial results. The agreements are valid until December 2024
AAPS Agreement
An agreement between SABESP
and AAPS (Sabesp’s Association of Retirees and Pensioners) regarding financial compensation for the migration of retirees, former
employees, pensioners, and dependents between health plans was approved in January 2024 to address the current and future deficits related
to beneficiaries who joined the migration, in addition to the withdrawal by AAPS of the lawsuit seeking the merger of active and inactive
asset masses into a single plan, which could have led to post-employment liabilities with an expected potential loss of R$303.9 million
on December 31, 2022.
The impact of this agreement
generated a non-recurring expense of R$ 162.4 million, accounted for under general expenses in 1Q24. Payments will be made in 60 monthly
installments starting in March 2024.
| | | Earnings
Results 1Q24 |
| | | Page 4 |
| 1. | Result for the period (Consolidated) |
R$ million
| |
|
1Q24 |
1Q23 |
Var. (R$) |
% |
| |
Revenue from sanitation services |
5,661.1 |
4,909.3 |
751.8 |
15.3 |
| |
COFINS and PASEP/TRCF taxes |
(437.7) |
(390.4) |
(47.3) |
12.1 |
| (=) |
Revenue from sanitation services, net |
5,223.4 |
4,518.9 |
704.5 |
15.6 |
| |
Construction revenue |
1,336.8 |
1,179.5 |
157.3 |
13.3 |
| (=) |
Net operating income |
6,560.2 |
5,698.4 |
861.8 |
15.1 |
| |
Construction costs |
(1,306.7) |
(1,153.0) |
(153.7) |
13.3 |
| |
Costs and expenses |
(3,607.4) |
(3,173.8) |
(433.6) |
13.7 |
| |
Other operating income (expenses), net |
7.1 |
14.6 |
(7.5) |
(51.4) |
| |
Equity results |
8.9 |
6.3 |
2.6 |
41.3 |
| (=) |
Earnings before financial result, income tax, and social contribution |
1,662.1 |
1,392.5 |
269.6 |
19.4 |
| |
Financial result |
(338.2) |
(259.5) |
(78.7) |
30.3 |
| (=) |
Earnings before income tax and social contribution |
1,323.9 |
1,133.0 |
190.9 |
16.8 |
| |
Income tax and social contribution |
(500.6) |
(385.8) |
(114.8) |
29.8 |
| (=) |
Net income |
823.3 |
747.2 |
76.1 |
10.2 |
| |
Earnings per share (R$)* |
1.20 |
1.09 |
|
|
* Number of shares = 683,509,869
The net operating income, which includes construction
revenue, totaled R$ 6,560.2 million in 1Q24, an increase of 15.1% over 1Q23.
Excluding construction costs and the provision
for the agreement with AAPS, costs and expenses totaled R$ 3,445.0 million, an increase of R$ 271.2 million (+8.5%). Considering the agreement,
costs and expenses totaled R$ 3,607.4 million (+13.7%).
The Company recorded a net income of R$ 823.3
million in 1Q24, compared to R$ 747.2 million in 1Q23.
Adjusted
EBITDA Reconciliation (Non-accounting measures)
R$ million
| |
|
1Q24 |
1Q23 |
Var. (R$) |
% |
| |
Net income |
823.3 |
747.2 |
76.1 |
10.2 |
| |
Agreement with AAPS |
162.4 |
- |
162.4 |
- |
| (=) |
Adjusted Net Income |
985.7 |
747.2 |
238.5 |
31.9 |
| |
Income tax and social contribution |
500.6 |
385.8 |
114.8 |
29.8 |
| |
Financial result |
338.2 |
259.5 |
78.7 |
30.3 |
| |
Other operating income (expenses), net |
(7.1) |
(14.6) |
7.5 |
(51.4) |
| |
Depreciation and amortization |
773.8 |
657.1 |
116.7 |
17.8 |
| (=) |
Adjusted EBITDA (excluding the agreement with AAPS)* |
2,591.2 |
2,035.0 |
556.2 |
27.3 |
| |
(%) Adjusted EBITDA margin (excluding the agreement with AAPS) |
39.5 |
35.7 |
|
|
| |
(%) Adjusted EBITDA margin (excluding the agreement with AAPS) on Net Revenue,
excluding Construction |
49.6 |
45.0 |
|
|
* Adjusted EBITDA corresponds to income before
(i) other operating income (expenses), net; (ii) financial result; (iii) income tax and social contribution; (iv) depreciation and amortization
expenses; and (v) excluding the agreement with AAPS.
| | | Earnings
Results 1Q24 |
| | | Page 5 |
Excluding the effects of
the agreement with AAPS, adjusted EBITDA was R$ 2,591.2 million in 1Q24, with an adjusted EBITDA margin of 39.5%.
Considering the agreement
with AAPS and construction revenue, adjusted EBITDA came to R$ 2,428.8 million in 1Q24, with an adjusted EBITDA margin of 37.0% (R$ 9,500.3
million and 35.9% in the last 12 months).
Excluding the effects of
the agreement with AAPS and construction costs, the adjusted EBITDA margin reached 49.6% in 1Q24, compared to 45.0% in 1Q23.
| 2. | Revenue from sanitation services |
The gross operating income from sanitation services,
which excludes construction revenue, totaled R$ 5,661.1 million in 1Q24, an increase of R$ 751.8 million (+15.3%) over the R$ 4,909.3
million recorded in 1Q23.
The main factors that led to the increase were:
| · | Tariff adjustment of 9.6% since May 2023; and |
| · | An increase of 5.3% in the total billed volume. |
Construction revenue increased
by R$ 157.3 million (+13.3%), due to higher investments made.
The following tables show
the water and sewage billed volumes per customer category on quarter-over-quarter basis.
| WATER AND SEWAGE BILLED VOLUME1 PER CUSTOMER CATEGORY – million m3 |
| |
|
Water |
|
|
Sewage |
|
Water + Sewage |
| Category |
1Q24 |
1Q23 |
% |
1Q24 |
1Q23 |
% |
1Q24 |
1Q23 |
% |
| Residential |
498.2 |
472.2 |
5.5 |
437.2 |
412.8 |
5.9 |
935.4 |
885.0 |
5.7 |
| Commercial |
47.2 |
46.7 |
1.1 |
45.5 |
43.9 |
3.6 |
92.7 |
90.6 |
2.3 |
| Industrial |
8.9 |
8.6 |
3.5 |
9.6 |
9.3 |
3.2 |
18.5 |
17.9 |
3.4 |
| Public |
11.4 |
10.0 |
14.0 |
10.3 |
9.2 |
12.1 |
21.7 |
19.2 |
13.1 |
| Total Retail |
565.7 |
537.5 |
5.2 |
502.6 |
475.2 |
5.8 |
1,068.3 |
1,012.7 |
5.5 |
| Wholesale2 |
11.6 |
12.2 |
(4.9) |
5.7 |
5.6 |
1.8 |
17.3 |
17.8 |
(2.8) |
| Total |
577.3 |
549.7 |
5.0 |
508.3 |
480.8 |
5.7 |
1,085.6 |
1,030.5 |
5.3 |
1. Not reviewed by external auditors
2. Wholesale includes volumes of reuse water and non-domestic sewage
| 5. | Costs, administrative & selling expenses |
Costs, administrative and
selling expenses increased by R$ 433.6 million in 1Q24 (+13.7%).
Costs, administrative and
selling expenses as a percentage of net revenue (excluding construction revenue) were 69.1% in 1Q24 compared to 70.2% in 1Q23.
Excluding the agreement
with AAPS, costs and expenses totaled R$ 3,445.0 million, an increase of R$ 271.2 million (+8.5%).
| | | Earnings
Results 1Q24 |
| | | Page 6 |
R$ million
| 23 |
1Q24 |
1Q23 |
Var. (R$) |
% |
| Salaries, payroll charges and benefits, and Pension plan obligations |
708.4 |
744.2 |
(35.8) |
(4.8) |
| General supplies |
90.8 |
87.5 |
3.3 |
3.8 |
| Treatment supplies |
141.4 |
164.9 |
(23.5) |
(14.3) |
| Services |
682.8 |
624.9 |
57.9 |
9.3 |
| Electricity |
394.3 |
395.8 |
(1.5) |
(0.4) |
| General expenses |
605.0 |
314.8 |
290.2 |
92.2 |
| Agreement with AAPS |
162.4 |
- |
162.4 |
- |
| Share of the municipal government in the collection (São Paulo) |
170.1 |
149.6 |
20.5 |
13.7 |
| Share of the municipal government in the collection (other municipalities) |
75.1 |
36.9 |
38.2 |
103.5 |
| Other general expenses |
197.4 |
128.3 |
69.1 |
53.9 |
| Tax expenses |
20.4 |
21.8 |
(1.4) |
(6.4) |
| Depreciation and amortization |
773.8 |
657.1 |
116.7 |
17.8 |
| Allowance for doubtful accounts |
190.5 |
162.8 |
27.7 |
17.0 |
| Costs, administrative & selling expenses |
3,607.4 |
3,173.8 |
433.6 |
13.7 |
| % of net revenue (excluding construction revenue) |
69.1 |
70.2 |
|
|
SALARIES, PAYROLL CHARGES
AND BENEFITS, AND PENSION PLAN OBLIGATIONS
In 1Q24, the R$ 35.8 million
decrease (-4.8%) was mainly due to the 10.9% reduction in the average number of employees, with an impact of R$ 64.4 million.
The aforementioned decrease
was partially offset by the 4.9% salary adjustment in May 2023 and the application of 2.0% referring to the Career and Salary Plan in
February 2024.
TREATMENT SUPPLIES
Treatment supplies fell by R$ 23.5 million (-14.3%)
in 1Q24 compared to 1Q23.
The decrease was mainly due to:
| · | Price reductions for some products due to external market conditions and the use of new products; and |
| · | Greater water availability that allowed the optimization of water source usage, resulting in reduced use of algaecides, coagulants,
and disinfectants. The Company manages the advancement or retreat of the Production Systems by using systems that provide the best cost-effectiveness. |
SERVICES
Service expenses totaled R$ 682.8 million, an
increase of R$ 57.9 million (+9.3%) over the R$ 624.9 million recorded in 1Q23. The main increases were:
| · | R$ 47.9 million for the maintenance of water and sewage networks, connections, and systems; and |
| · | R$ 10.6 million with technical services. |
| | | Earnings
Results 1Q24 |
| | | Page 7 |
ELECTRICITY
Electricity expenses totaled
R$ 394.3 million in 1Q24, a decrease of R$ 1.5 million (-0.4%) from the R$ 395.8 million recorded in 1Q23. The Free Market Tariffs (ACL)
accounted for 51.0% of total electricity expenses in 1Q24 (55.0% in 1Q23) while the Regulated Market Tariffs (ACR) accounted for 49.0%
(45.0% in 1Q23).
The main factors that contributed
to this variation were:
| · | An average decrease of 4.5% in ACL prices (including Grid Market Tariffs - TUSD), with a 5.0% decrease in consumption; and |
| · | An average increase of 8.6% in ACR tariffs, with a decrease of 1.8% in consumption. |
GENERAL EXPENSES
Increase of R$ 290.2 million
(+92.2%), totaling R$ 605.0 million in 1Q24, compared to the R$ 314.8 million reported in 1Q23, mainly due to:
| · | Provision of R$ 162.4 million in 1Q24, referring to AAPS agreement; |
| · | Increase of R$ 68.7 million in expenses with lawsuits; and |
| · | Increased provision for transfer to the Municipal Funds for Environmental Sanitation and Infrastructure, of R$ 58.7 million. |
Expenses with municipal
transfers totaled R$ 245.2 million in 1Q24, compared to the R$ 186.5 million reported in 1Q23.
Expenses with the use of
water totaled R$ 25.0 million in 1Q24, compared to the R$ 25.2 million reported in 1Q23.
R$ million
| MUNICIPAL TRANSFERS |
| Municipality |
2024 |
2023 |
Var. (R$) |
% |
Start |
| São Paulo |
170.1 |
149.6 |
20.5 |
13.7 |
Jun/10 |
| Barueri |
10.7 |
- |
10.7 |
- |
May/23 |
| Guarulhos |
7.4 |
- |
7.4 |
- |
Dec/23 |
| Diadema |
2.7 |
- |
2.7 |
- |
Jul/23 |
| Other municipalities |
54.3 |
36.9 |
17.4 |
47.2 |
|
| Total |
245.2 |
186.5 |
58.7 |
31.5 |
|
DEPRECIATION AND AMORTIZATION
The R$ 116.7 million increase
(+17.8%) was due to the beginning of operations of intangible assets, totaling R$ 7.2 billion.
ALLOWANCE FOR DOUBTFUL
ACCOUNTS
Increase of R$ 27.7 million (+17.0%), moving
up from R$ 162.8 million in 1Q23 to R$ 190.5 million in 1Q24, in line with the increase in sanitation revenue.
Expenses with allowance for doubtful accounts
as a percentage of sanitation revenue moved up from 3.3% in 1Q23 to 3.4% in 1Q24.
| | | Earnings
Results 1Q24 |
| | | Page 8 |
| 6. | Other net operating income (expenses) |
Negative variation of R$ 7.5 million, mainly
due to the non-recurring revenue from the sale of unusable materials in 1Q23, of R$ 6.1 million.
R$ million
| |
1Q24 |
1Q23 |
Var. (R$) |
% |
| Financial expenses, net of revenue |
(302.9) |
(257.2) |
(45.7) |
17.8 |
| Monetary and exchange variations, net |
(35.3) |
(2.3) |
(33.0) |
1,434.8 |
| Financial Result |
(338.2) |
(259.5) |
(78.7) |
30.3 |
Financial
expenses, net of revenue
R$ million
| |
1Q24 |
1Q23 |
Var. (R$) |
% |
| Financial expenses |
|
|
|
|
| Interest and charges on domestic borrowings and financing |
(276.6) |
(273.1) |
(3.5) |
1.3 |
| Interest and charges on international borrowings and financing |
(28.7) |
(21.0) |
(7.7) |
36.7 |
| Other financial expenses |
(189.3) |
(122.1) |
(67.2) |
55.0 |
| Total financial expenses |
(494.6) |
(416.2) |
(78.4) |
18.8 |
| Financial revenue |
191.7 |
159.0 |
32.7 |
20.6 |
| Financial expenses, net of revenue |
(302.9) |
(257.2) |
(45.7) |
17.8 |
The main impacts resulted from:
| · | Increase of R$ 7.7 million in interest and charges on international borrowings and financing, mainly due to new IDB fundraising; |
| · | Increase of R$ 67.2 million in other financial expenses, due to the R$ 60.1 million increase in interest on PPPs; and |
| · | Increase of R$ 32.7 million in financial revenues, mainly due to higher interest charged on overdue bills in 1Q24. |
Monetary
and exchange variations, net
R$ million
| |
1Q24 |
1Q23 |
Var. (R$) |
% |
| Monetary and exchange variations on liabilities |
|
|
|
|
| Monetary variations on borrowings and financing |
(54.0) |
(70.5) |
16.5 |
(23.4) |
| Exchange variations on borrowings and financing |
6.3 |
83.8 |
(77.5) |
(92.5) |
| Other monetary variations |
(43.5) |
(75.7) |
32.2 |
(42.5) |
| Total monetary and exchange variations on liabilities |
(91.2) |
(62.4) |
(28.8) |
46.2 |
| Monetary and exchange variations on assets |
55.9 |
60.1 |
(4.2) |
(7.0) |
| Monetary and exchange variations, net |
(35.3) |
(2.3) |
(33.0) |
1,434.8 |
| | | Earnings
Results 1Q24 |
| | | Page 9 |
The negative effect of net monetary and exchange
variations in 1Q24 was R$ 33.0 million, especially due to:
| · | A decrease of R$ 16.5 million in monetary variations on borrowings and financing, mainly because of (i) a decrease in IPCA (from 2.09%
in 1Q23 to 1.42% in 1Q24); and (ii) higher capitalization of monetary variation on debentures in 1Q24, of R$ 5.5 million; |
| · | A reduction of R$ 77.5 million in exchange variation gains on borrowings and financing, due to the appreciation of the U.S. dollar
and depreciation of the Yen in 1Q24 (3.2% and -3.5%, respectively), compared to the depreciation recorded in both currencies in 1Q23 (-2.6%
and -3.3%, respectively); and |
| · | A decrease of R$ 32.2 million in other monetary variations, mainly due to lower monetary variation on Public-Private Partnership (PPPs)
agreements in 1Q24, of R$ 34.2 million. |
| 8. | Income tax and social contribution |
The R$ 114.8 million increase (+29.8%) in 1Q24
was mainly due to the R$ 861.8 million increase in net operating income, mainly offset by:
| · | R$ 433.6 million increase in costs and expenses; and |
| · | Negative variation of R$ 78.7 million in the financial result. |
| Operational indicators* |
1Q24 |
1Q23 |
% |
| Water connections1 |
9,424 |
9,375 |
0.5 |
| Sewage connections1 |
8,119 |
8,049 |
0.9 |
| Population directly served - water2 |
28.1 |
28.1 |
0.0 |
| Population directly served - sewage2 |
24.9 |
24.8 |
0.4 |
| Number of employees |
10,672 |
12,211 |
(12.6) |
| Volume of water produced in the quarter3 |
772 |
733 |
5.4 |
| IPM - Measured Water Loss (%) |
29.2 |
29.5 |
(1.0) |
| IPDt (liters/connection x day)3 |
260 |
255 |
2.0 |
1. Active connections, in thousand units at the
end of the period.
2. In million inhabitants, at the end of the period. Does not include wholesale.
3. In millions of m3.
* Not reviewed by external auditors
| | | Earnings
Results 1Q24 |
| | | Page 10 |
| Economic variables at the close of the quarter* |
1Q24 |
1Q23 |
| IPCA - Amplified Consumer Price Index1 |
1.42 |
2.09 |
| INPC - National Consumer Price Index1 |
1.58 |
1.88 |
| IPC - Consumer Price Index1 |
1.18 |
1.46 |
| DI - Interbank Deposit² |
11.28 |
13.65 |
| U.S. dollar3 |
4.9962 |
5.0804 |
| Japanese yen³ |
0.03301 |
0.03827 |
1. Accrued in the quarter (%)
2. Average quarterly rate (%)
3. Ptax sale rate on the last day
* Not reviewed by external auditors
| 10. | Borrowings and financing |
R$ Thousand
| DEBT PROFILE |
| INSTITUTION |
2024 |
2025 |
2026 |
2027 |
2028 |
2029 |
2030 onwards |
TOTAL |
% of Total |
| Local currency |
|
|
|
|
|
|
|
|
|
| Caixa Econômica Federal |
82,048 |
115,356 |
122,556 |
130,195 |
138,177 |
143,481 |
868,098 |
1,599,913 |
7 |
| IDB |
139,754 |
260,899 |
330,209 |
315,069 |
420,959 |
385,919 |
1,971,918 |
3,824,727 |
17 |
| IFC |
22,800 |
44,200 |
61,800 |
80,800 |
123,600 |
181,600 |
1,209,145 |
1,723,945 |
8 |
| Debentures |
905,061 |
1,328,730 |
1,217,890 |
1,387,314 |
665,375 |
1,304,027 |
3,218,442 |
10,026,839 |
46 |
| BNDES |
210,955 |
260,803 |
250,860 |
238,124 |
84,351 |
34,189 |
189,563 |
1,268,845 |
6 |
| Other |
2,254 |
2,771 |
142 |
- |
- |
- |
- |
5,167 |
0 |
| Leases (concession agreements, program contracts, and contract asset)1 |
78,403 |
42,199 |
19,538 |
19,538 |
19,538 |
19,012 |
114,209 |
312,437 |
1 |
| Leases (others)2 |
73,415 |
90,971 |
44,524 |
3,361 |
39,379 |
- |
- |
251,650 |
1 |
| Interest and other charges |
304,965 |
74,729 |
- |
- |
- |
- |
- |
379,694 |
2 |
| Total in local currency |
1,819,655 |
2,220,658 |
2,047,519 |
2,174,401 |
1,491,379 |
2,068,228 |
7,571,375 |
19,393,215 |
88 |
| Foreign currency |
|
|
|
|
|
|
|
|
|
| IDB |
25,676 |
71,361 |
40,019 |
40,019 |
40,019 |
40,019 |
556,235 |
813,348 |
4 |
| IBRD |
15,188 |
30,375 |
30,375 |
30,375 |
30,375 |
41,525 |
329,045 |
507,258 |
2 |
| JICA |
75,585 |
141,639 |
141,639 |
141,639 |
141,639 |
141,526 |
503,886 |
1,287,553 |
6 |
| Interest and other charges |
19,741 |
3,192 |
- |
- |
- |
- |
- |
22,933 |
0 |
| Total in foreign currency |
136,190 |
246,567 |
212,033 |
212,033 |
212,033 |
223,070 |
1,389,166 |
2,631,092 |
12 |
| Total |
1,955,845 |
2,467,225 |
2,259,552 |
2,386,434 |
1,703,412 |
2,291,298 |
8,960,541 |
22,024,307 |
100 |
1. Refers to work contracts signed as Assets Lease;
2. Obligations related to leasing agreements, mainly vehicle
leases.
| | | Earnings
Results 1Q24 |
| | | Page 11 |
Covenants
The table below shows the most restrictive clauses
in 1Q24:
| |
Covenants |
| Adjusted EBITDA / Adjusted Financial Expenses |
Equal to or higher than 2.80 |
| EBITDA / Financial Expenses Paid |
Equal to or higher than 2.35 |
| Adjusted Net Debt / Adjusted EBITDA |
Equal to or lower than 3.80 |
| Net Debt / Adjusted EBITDA |
Equal to or lower than 3.50 |
| Other Onerous Debt1 / Adjusted EBITDA |
Equal to or lower than 1.30 |
| Adjusted Current Ratio |
Higher than 1.00 |
1. “Other Onerous Debts” correspond to the sum
of pension plan obligations and healthcare plan, installment payment of tax debts, and installment payment of debts with the electricity
supplier.
In 1Q24 and 1Q23, the Company
met the requirements of its borrowings and financing agreements.
Investments totaled R$ 1,420.3
million in 1Q24, presented as additions in the notes to the quarterly information under Contract Asset, Intangible Assets, and Property,
Plant and Equipment, of R$ 1,270.6 million, R$ 133.8 million, and R$ 15.9 million, respectively. Cash disbursed in 2Q23 referring to investments,
including from previous periods, totaled R$ 587.3 million.
The table below shows investments
broken down by water and sewage:
R$ million
| |
Water |
Sewage |
Total |
| Investments |
669.2 |
751.1 |
1,420.3 |
| 12. | Public-Private Partnership - PPP |
The chart below shows expenses with Public-Private
Partnerships in 1Q24, compared to the figures reported in 1Q23:
R$ thousand
| SÃO LOURENÇO PRODUCTION SYSTEM |
1Q24 |
1Q23 |
Var. (R$) |
% |
| General supplies |
4,906.7 |
4,797.8 |
108.9 |
2.3 |
| Services |
10,353.4 |
10,123.7 |
229.7 |
2.3 |
| General expenses |
1,355.9 |
1,325.8 |
30.1 |
2.3 |
| Amortization |
4,078.0 |
4,055.6 |
22.4 |
0.6 |
| Interest |
138,671.0 |
49,493.0 |
89,178.0 |
180.2 |
| Monetary adjustment |
- |
32,314.0 |
(32,314.0) |
(100.0) |
| Total |
159,365.0 |
102,109.9 |
57,255.1 |
56.1 |
| ALTO TIETÊ PRODUCTION SYSTEM |
1Q24 |
1Q23 |
Var. (R$) |
% |
| Services |
12,645.8 |
18,358.2 |
(5,712.4) |
(31.1) |
| Amortization |
42,474.5 |
42,474.5 |
- |
- |
| Interest |
(24,568.3) |
4,464.1 |
(29,032.4) |
(650.4) |
| Monetary adjustment |
261.9 |
2,168.9 |
(1,907.0) |
(87.9) |
| Total |
30,813.9 |
67,465.7 |
(36,651.8) |
(54.3) |
| Total expenses with PPP |
190,178.9 |
169,575.6 |
20,603.3 |
12.1 |
| | | Earnings
Results 1Q24 |
| | | Page 12 |
| | | Earnings
Results 1Q24 |
| | | Page 13 |
Holding - Income Statement
| Brazilian Corporate Law |
|
R$ '000 |
| |
1Q/24 |
1Q/23 |
| Net Operating Income |
6.551.713 |
5.698.369 |
| Operating Costs |
(3.971.227) |
(3.653.723) |
| Gross Profit |
2.580.486 |
2.044.646 |
| Operating Expenses |
|
|
| Selling |
(209.843) |
(225.657) |
| Estimated losses with doubtful accounts |
(190.518) |
(162.805) |
| Administrative expenses |
(537.374) |
(284.679) |
| Other operating revenue (expenses), net |
7.086 |
14.634 |
| Operating Income Before Shareholdings |
1.649.837 |
1.386.139 |
| Equity Result |
8.837 |
6.334 |
| Earnings Before Financial Results, net |
1.658.674 |
1.392.473 |
| Financial, net |
(342.125) |
(343.151) |
| Exchange gain (loss), net |
6.333 |
83.623 |
| Earnings before Income Tax and Social Contribution |
1.322.882 |
1.132.945 |
| Income Tax and Social Contribution |
|
|
| Current |
(516.796) |
(383.488) |
| Deferred |
17.209 |
(2.245) |
| Net Income for the period |
823.295 |
747.212 |
| Registered common shares ('000) |
683.509 |
683.509 |
| Earnings per shares - R$ (per share) |
1,20 |
1,09 |
| Depreciation and Amortization |
(772.552) |
(657.145) |
| Adjusted EBITDA |
2.424.140 |
2.034.984 |
| % over net revenue |
37,0% |
35,7% |
| | | Earnings
Results 1Q24 |
| | | Page 14 |
Holding - Balance Sheet
| Brazilian Corporate Law |
|
|
R$ '000 |
| ASSETS |
03/31/2024 |
|
03/31/2023 |
| Current assets |
|
|
|
| Cash and cash equivalents |
2.019.256 |
|
838.338 |
| Financial investments |
4.169.871 |
|
2.425.921 |
| Trade receivables |
3.584.889 |
|
3.580.962 |
| Related parties and transactions |
266.624 |
|
261.273 |
| Inventories |
121.610 |
|
85.953 |
| Restricted cash |
45.694 |
|
54.944 |
| Currrent recoverable taxes |
328.158 |
|
494.645 |
| Other assets |
75.401 |
|
37.296 |
| Total current assets |
10.611.503 |
|
7.779.332 |
| |
|
|
|
| Noncurrent assets |
|
|
|
| Trade receivables |
345.801 |
|
272.436 |
| Related parties and transactions |
932.308 |
|
935.272 |
| Escrow deposits |
124.740 |
|
130.979 |
| Deferred income tax and social contribution |
115.285 |
|
98.076 |
| National Water and Sanitation Agency – ANA |
1.879 |
|
2.673 |
| Other assets |
243.743 |
|
237.628 |
| |
|
|
|
| Equity investments |
170.529 |
|
161.863 |
| Investment properties |
46.666 |
|
46.678 |
| Contract assets |
7.582.365 |
|
7.393.096 |
| Intangible assets |
44.312.766 |
|
43.865.269 |
| Property, plant and equipment |
484.312 |
|
474.559 |
| Total noncurrent assets |
54.360.394 |
|
53.618.529 |
| |
|
|
|
| Total assets |
64.971.897 |
|
61.397.861 |
| |
|
|
|
| LIABILITIES AND EQUITY |
|
|
|
| Current liabilities |
|
|
|
| Trade payables |
491.038 |
|
456.064 |
| Borrowings and financing |
2.716.361 |
|
2.616.406 |
| Accrued payroll and related charges |
742.587 |
|
807.440 |
| Taxes and contributions |
617.923 |
|
511.468 |
| Dividends and interest on capital payable |
837.391 |
|
837.391 |
| Provisions |
1.085.976 |
|
1.064.367 |
| Services payable |
836.294 |
|
749.226 |
| Public-Private Partnership – PPP |
435.671 |
|
487.926 |
| Program Contract Commitments |
20.896 |
|
21.969 |
| Other liabilities |
796.394 |
|
779.424 |
| Total current liabilities |
8.580.531 |
|
8.331.681 |
| |
|
|
|
| | | Earnings
Results 1Q24 |
| | | Page 15 |
| Noncurrent liabilities |
|
|
|
| Borrowings and financing |
19.307.946 |
|
16.919.944 |
| Deferred Cofins and Pasep |
169.265 |
|
164.097 |
| Provisions |
777.225 |
|
762.065 |
| Pension obligations |
2.131.230 |
|
2.142.871 |
| Public-Private Partnership – PPP |
2.787.032 |
|
2.798.688 |
| Program Contract Commitments |
12.139 |
|
12.047 |
| Other liabilities |
525.858 |
|
409.092 |
| Total noncurrent liabilities |
25.710.695 |
|
23.208.804 |
| |
|
|
|
| Total liabilities |
34.291.226 |
|
31.540.485 |
| |
|
|
|
| Equity |
|
|
|
| Paid-up capital |
15.000.000 |
|
15.000.000 |
| Profit reserve |
14.711.014 |
|
14.711.014 |
| Other comprehensive income |
146.362 |
|
146.362 |
| Retained earnings |
823.295 |
|
- |
| Total equity |
30.680.671 |
|
29.857.376 |
| |
|
|
|
| Total equity and liabilities |
64.971.897 |
|
61.397.861 |
| |
|
|
|
| | | Earnings
Results 1Q24 |
| | | Page 16 |
Holding - Cash Flow
| Brazilian Corporate Law |
|
|
R$ '000 |
| |
|
1Q/24 |
|
1Q/23 |
| Cash flow from operating activities |
|
|
|
| Profit before income tax and social contribution |
1.322.882 |
|
1.132.945 |
| Adjustment for Net income reconciliation: |
|
|
|
| Depreciation and amortization |
772.552 |
|
657.145 |
| Residual value of property, plant and equipment and intangible assets written-off |
918 |
|
3.515 |
| Allowance for doubtful accounts |
190.518 |
|
162.805 |
| Provision and inflation adjustment |
83.945 |
|
70.031 |
| Interest calculated on loans and financing payable |
344.775 |
|
316.805 |
| Inflation adjustment and foreign exchange gains (losses) on loans and financing |
47.701 |
|
(13.316) |
| Interest and inflation adjustment losses |
5.271 |
|
6.915 |
| Interest and inflation adjustment gains |
(60.490) |
|
(28.976) |
| Financial charges from customers |
(109.237) |
|
(95.653) |
| Margin on intangible assets arising from concession |
(30.046) |
|
(26.519) |
| Provision for Consent Decree (TAC), Knowledge Retention Program (PRC) and Separation Incentive Program (PDI) |
(107.796) |
|
(345) |
| Equity result |
(8.837) |
|
(6.334) |
| Interest and inflation adjustment (Public-Private Partnership) |
145.823 |
|
123.045 |
| Provision from São Paulo agreement |
174.673 |
|
155.387 |
| Pension obligations |
48.879 |
|
51.921 |
| Other adjustments |
4.346 |
|
4.119 |
| |
|
2.825.877 |
|
2.513.490 |
| Changes in assets |
|
|
|
| Trade accounts receivable |
(152.421) |
|
(183.680) |
| Accounts receivable from related parties |
6.591 |
|
10.172 |
| Inventories |
(35.657) |
|
6.951 |
| Recoverable taxes |
166.487 |
|
(23.531) |
| Escrow deposits |
12.497 |
|
(742) |
| Other assets |
(43.426) |
|
(33.323) |
| Changes in liabilities |
|
|
|
| Trade payables and contractors |
(418.697) |
|
(414.033) |
| Services payable |
(87.605) |
|
(274.097) |
| Accrued payroll and related charges |
33.630 |
|
(2.630) |
| Taxes and contributions payable |
(84.938) |
|
(225.360) |
| Deferred Cofins/Pasep |
(47.176) |
|
(31.604) |
| Provisions |
5.168 |
|
1.591 |
| Pension obligations |
(60.520) |
|
(58.324) |
| Other liabilities |
74.379 |
|
(232.389) |
| Cash generated from operations |
2.194.189 |
|
1.052.491 |
| |
|
|
|
|
| Interest paid |
(473.596) |
|
(543.850) |
| Income tax and contribution paid |
(325.403) |
|
(113.335) |
| |
|
|
|
|
| Net cash generated from operating activities |
1.395.190 |
|
395.306 |
| | | Earnings
Results 1Q24 |
| | | Page 17 |
| |
|
|
|
|
| Cash flows from investing activities |
|
|
|
| Acquisition of contract assets and intangible assets |
(571.059) |
|
(570.332) |
| Restricted cash |
9.250 |
|
(10.827) |
| Financial investments |
(1.704.848) |
|
28.560 |
| Purchases of tangible assets |
(15.911) |
|
(30.954) |
| Net cash used in investing activities |
(2.282.568) |
|
(583.553) |
| |
|
|
|
|
| Cash flow from financing activities |
|
|
|
| Loans and financing |
|
|
|
| Proceeds from loans |
2.939.695 |
|
121.611 |
| Repayments of loans |
(660.026) |
|
(716.239) |
| Public-Private Partnership – PPP |
(209.734) |
|
(208.764) |
| Program Contract Commitments |
(1.639) |
|
(39.396) |
| Net cash used in financing activities |
2.068.296 |
|
(842.788) |
| |
|
|
|
|
| Increase/(decrease) in cash and cash equivalents |
1.180.918 |
|
(1.031.035) |
| |
|
|
|
|
| Represented by: |
|
|
|
| Cash and cash equivalents at beginning of the year |
838.338 |
|
1.867.485 |
| Cash and cash equivalents at end of the year |
2.019.256 |
|
836.450 |
| Increase/(decrease) in cash and cash equivalents |
1.180.918 |
|
(1.031.035) |
| | | Earnings
Results 1Q24 |
| | | Page 18 |
Consolidated - Income Statement
| Brazilian Corporate Law |
|
R$ '000 |
| |
1Q/24 |
1Q/23 |
| Net Operating Income |
6.560.246 |
- |
| Operating Costs |
(3.975.427) |
- |
| Gross Profit |
2.584.819 |
- |
| Operating Expenses |
|
|
| Selling |
(210.087) |
- |
| Estimated losses with doubtful accounts |
(190.518) |
- |
| Administrative expenses |
(538.138) |
- |
| Other operating revenue (expenses), net |
7.086 |
- |
| Operating Income Before Shareholdings |
1.653.162 |
- |
| Equity Result |
8.893 |
- |
| Earnings Before Financial Results, net |
1.662.055 |
- |
| Financial, net |
(344.528) |
- |
| Exchange gain (loss), net |
6.333 |
- |
| Earnings before Income Tax and Social Contribution |
1.323.860 |
- |
| Income Tax and Social Contribution |
|
|
| Current |
(517.774) |
- |
| Deferred |
17.209 |
- |
| Net Income for the period |
823.295 |
- |
| Registered common shares ('000) |
683.509 |
- |
| Earnings per shares - R$ (per share) |
1,20 |
- |
| Depreciation and Amortization |
(773.785) |
- |
| Adjusted EBITDA |
2.428.754 |
- |
| % over net revenue |
37,0% |
|
| | | Earnings
Results 1Q24 |
| | | Page 19 |
Consolidated - Balance Sheet
| Brazilian Corporate Law |
|
|
R$ '000 |
| ASSETS |
03/31/2024 |
|
03/31/2023 |
| Current assets |
|
|
|
| Cash and cash equivalents |
2.019.391 |
|
838.484 |
| Financial investments |
4.172.591 |
|
2.426.752 |
| Trade receivables |
3.590.432 |
|
3.584.287 |
| Related parties and transactions |
266.662 |
|
261.280 |
| Inventories |
122.166 |
|
86.008 |
| Restricted cash |
45.694 |
|
54.944 |
| Currrent recoverable taxes |
328.173 |
|
494.647 |
| Other assets |
74.586 |
|
37.048 |
| Total current assets |
10.619.695 |
|
7.783.450 |
| |
|
|
|
| Noncurrent assets |
|
|
|
| Trade receivables |
345.801 |
|
272.436 |
| Related parties and transactions |
932.308 |
|
935.272 |
| Escrow deposits |
124.740 |
|
130.979 |
| Deferred income tax and social contribution |
115.285 |
|
98.076 |
| National Water and Sanitation Agency – ANA |
1.879 |
|
2.673 |
| Other assets |
162.684 |
|
159.017 |
| |
|
|
|
| Equity investments |
170.529 |
|
161.863 |
| Investment properties |
46.666 |
|
46.678 |
| Contract assets |
7.582.725 |
|
7.393.096 |
| Intangible assets |
44.459.122 |
|
44.012.858 |
| Property, plant and equipment |
484.312 |
|
474.559 |
| Total noncurrent assets |
54.426.051 |
|
53.687.507 |
| |
|
|
|
| Total assets |
65.045.746 |
|
61.470.957 |
| |
|
|
|
| LIABILITIES AND EQUITY |
|
|
|
| Current liabilities |
|
|
|
| Trade payables |
490.494 |
|
456.215 |
| Borrowings and financing |
2.716.361 |
|
2.616.406 |
| Accrued payroll and related charges |
742.587 |
|
807.440 |
| Taxes and contributions |
619.028 |
|
511.972 |
| Dividends and interest on capital payable |
837.391 |
|
837.391 |
| Provisions |
1.085.976 |
|
1.064.367 |
| Services payable |
838.703 |
|
750.732 |
| Public-Private Partnership – PPP |
435.671 |
|
487.926 |
| Program Contract Commitments |
20.896 |
|
21.969 |
| Other liabilities |
870.394 |
|
853.424 |
| Total current liabilities |
8.657.501 |
|
8.407.842 |
| |
|
|
|
| | | Earnings
Results 1Q24 |
| | | Page 20 |
| Noncurrent liabilities |
|
|
|
| Borrowings and financing |
19.307.946 |
|
16.919.944 |
| Deferred Cofins and Pasep |
169.265 |
|
164.097 |
| Provisions |
777.225 |
|
762.065 |
| Pension obligations |
2.131.230 |
|
2.142.871 |
| Public-Private Partnership – PPP |
2.787.032 |
|
2.798.688 |
| Program Contract Commitments |
12.139 |
|
12.047 |
| Other liabilities |
522.737 |
|
406.027 |
| Total noncurrent liabilities |
25.707.574 |
|
23.205.739 |
| |
|
|
|
| Total liabilities |
34.365.075 |
|
31.613.581 |
| |
|
|
|
| Equity |
|
|
|
| Paid-up capital |
15.000.000 |
|
15.000.000 |
| Profit reserve |
14.711.014 |
|
14.711.014 |
| Other comprehensive income |
146.362 |
|
146.362 |
| Retained earnings |
823.295 |
|
- |
| Total equity |
30.680.671 |
|
29.857.376 |
| |
|
|
|
| Total equity and liabilities |
65.045.746 |
|
61.470.957 |
| | | Earnings
Results 1Q24 |
| | | Page 21 |
Consolidated - Cash Flow
| Brazilian Corporate Law |
|
|
R$ '000 |
| |
|
1Q/24 |
|
1Q/23 |
| Cash flow from operating activities |
|
|
|
| Profit before income tax and social contribution |
1.323.860 |
|
- |
| Adjustment for Net income reconciliation: |
|
|
|
| Depreciation and amortization |
773.785 |
|
- |
| Residual value of property, plant and equipment and intangible assets written-off |
918 |
|
- |
| Allowance for doubtful accounts |
190.518 |
|
- |
| Provision and inflation adjustment |
83.945 |
|
- |
| Interest calculated on loans and financing payable |
344.775 |
|
- |
| Inflation adjustment and foreign exchange gains (losses) on loans and financing |
47.701 |
|
- |
| Interest and inflation adjustment losses |
5.271 |
|
- |
| Interest and inflation adjustment gains |
(60.490) |
|
- |
| Financial charges from customers |
(109.237) |
|
- |
| Margin on intangible assets arising from concession |
(30.055) |
|
- |
| Provision for Consent Decree (TAC), Knowledge Retention Program (PRC) and Separation Incentive Program (PDI) |
(107.796) |
|
- |
| Equity result |
(8.893) |
|
- |
| Interest and inflation adjustment (Public-Private Partnership) |
145.823 |
|
- |
| Provision from São Paulo agreement |
174.673 |
|
- |
| Pension obligations |
48.879 |
|
- |
| Other adjustments |
4.346 |
|
- |
| |
|
2.828.023 |
|
- |
| Changes in assets |
|
|
|
| Trade accounts receivable |
(154.632) |
|
- |
| Accounts receivable from related parties |
6.553 |
|
- |
| Inventories |
(36.158) |
|
- |
| Recoverable taxes |
166.474 |
|
- |
| Escrow deposits |
12.497 |
|
- |
| Other assets |
(41.024) |
|
- |
| Changes in liabilities |
|
|
|
| Trade payables and contractors |
(419.392) |
|
- |
| Services payable |
(86.703) |
|
- |
| Accrued payroll and related charges |
33.630 |
|
- |
| Taxes and contributions payable |
(85.314) |
|
- |
| Deferred Cofins/Pasep |
5.168 |
|
- |
| Provisions |
(47.176) |
|
- |
| Pension obligations |
(60.520) |
|
- |
| Other liabilities |
74.993 |
|
- |
| Cash generated from operations |
2.196.419 |
|
- |
| |
|
|
|
|
| Interest paid |
(473.596) |
|
- |
| Income tax and contribution paid |
(325.403) |
|
- |
| |
|
|
|
|
| Net cash generated from operating activities |
1.397.420 |
|
- |
| | | Earnings
Results 1Q24 |
| | | Page 22 |
| |
|
|
|
|
| Cash flows from investing activities |
|
|
|
| Acquisition of contract assets and intangible assets |
(571.410) |
|
- |
| Restricted cash |
9.250 |
|
- |
| Financial investments |
(1.706.738) |
|
- |
| Investment properties |
- |
|
- |
| Purchases of tangible assets |
(15.911) |
|
- |
| Net cash used in investing activities |
(2.284.809) |
|
- |
| |
|
|
|
|
| Cash flow from financing activities |
|
|
|
| Loans and financing |
|
|
|
| Proceeds from loans |
2.939.695 |
|
- |
| Repayments of loans |
(660.026) |
|
- |
| Public-Private Partnership – PPP |
(209.734) |
|
- |
| Program Contract Commitments |
(1.639) |
|
- |
| Net cash used in financing activities |
2.068.296 |
|
- |
| |
|
|
|
|
| Increase/(decrease) in cash and cash equivalents |
1.180.907 |
|
- |
| |
|
|
|
|
| Represented by: |
|
|
|
| Cash and cash equivalents at beginning of the year |
838.484 |
|
- |
| Cash and cash equivalents at end of the year |
2.019.391 |
|
- |
| Increase/(decrease) in cash and cash equivalents |
1.180.907 |
|
- |
| | | Earnings
Results 1Q24 |
| | | Page 23 |
SIGNATURE
Pursuant to the requirements of the Securities Exchange Act of 1934, the registrant has duly caused this report to be signed on its behalf by the undersigned, thereunto duly authorized, in the city São Paulo, Brazil.
Date: May 10, 2024
|
Companhia de Saneamento Básico do Estado de São Paulo - SABESP |
|
|
|
| By: |
/s/ Catia Cristina Teixeira Pereira
|
|
| |
Name: Catia Cristina Teixeira Pereira
Title: Chief Financial Officer and Investor Relations Officer |
|
FORWARD-LOOKING STATEMENTS
This press release may contain forward-looking statements. These statements are statements that are not historical facts, and are based on management's current view and estimates of future economic circumstances, industry conditions, company performance and financial results. The words "anticipates", "believes", "estimates", "expects", "plans" and similar expressions, as they relate to the company, are intended to identify forward-looking statements. Statements regarding the declaration or payment of dividends, the implementation of principal operating and financing strategies and capital expenditure plans, the direction of future operations and the factors or trends affecting financial condition, liquidity or results of operations are examples of forward-looking statements. Such statements reflect the current views of management and are subject to a number of risks and uncertainties. There is no guarantee that the expected events, trends or results will actually occur. The statements are based on many assumptions and factors, including general economic and market conditions, industry conditions, and operating factors. Any changes in such assumptions or factors could cause actual results to differ materially from current expectations.
Companhia Sanea (NYSE:SBS)
Gráfica de Acción Histórica
De Abr 2024 a May 2024

Companhia Sanea (NYSE:SBS)
Gráfica de Acción Histórica
De May 2023 a May 2024
