Amerigo Resources Ltd. (TSX:ARG) -
--  Record annual copper and molybdenum production
--  Operating cash flow of $12.3 million
--  Dividends of $6.8 million paid in 2012
Amerigo Resources Ltd. ("Amerigo" or the "Company") reported
today results for the year ended December 31, 2012.
Amerigo's President and CEO, Dr. Klaus Zeitler, stated, "In 2012
the Company set annual copper and molybdenum production records,
generated record revenues and $12.3 million in operating cash flow
and paid $6.8 million in dividends. Despite these positive results,
however, the Company incurred a net loss of $8.2 million for the
year, mainly due to lower metal prices and high power costs.
Results were also adversely affected by the one-time payment of
$4.6 million in bonuses on the signing of a new 4 year union
agreement and higher extraction costs and lower metal recoveries in
the Colihues tailings pond due to extremely difficult mining
conditions during the latter part of the year."
Dr. Zeitler continued, "Amerigo continues to be in a strong
financial position, with cash and investments totaling in excess of
$13 million. Although challenging mining conditions in Colihues are
expected to continue for the first few months this year, we believe
that operating cash flow will increase significantly in 2013
because of the change in the Company's power contract from a
variable to much lower fixed cost for the next five years (January
2013 power costs/kWh were one-half of those in January 2012), and a
reduction in budgeted capital expenditures by approximately $13.5
million from 2012 levels. I also remain confident that MVC will
reach an agreement for the processing of tailings from the
Cauquenes tailings pond during 2013, which will allow the Company
to substantially increase copper and molybdenum production."
Comparative Annual Overview

---------------------------------------------------------------------------
                                           Years ended December 31,
                                                                    Change
                                      2012         2011            $      %
---------------------------------------------------------------------------
Copper produced, million
 pounds                               51.7         43.7         8.01    18%
Copper sold, million pounds           51.6         43.4          8.2    19%
Molybdenum produced, pounds      1,057,717      785,068      272,649    35%
Molybdenum sold, pounds          1,170,703      693,410      477,293    69%
Percentage of copper
 production from old tailings          47%          45%                  2%
Revenue ($)                    181,760,724  166,073,816   15,686,908     9%
Cost of sales (1) ($)          182,850,919  156,296,713   26,554,206    17%
El Teniente royalty costs ($)   43,873,612   41,544,730    2,328,882     6%
Gross (loss) profit ($)         (1,090,195)   9,777,103  (10,867,298) (111%)
Net (loss) profit ($)           (8,192,396)   8,700,518  (16,892,914) (194%)
Operating cash flow ($)         12,283,566   20,046,088   (7,762,522)  (39%)
Cash flow paid for plant
 expansion ($)                 (23,707,654) (21,346,199)  (2,361,455)   11%
Cash and cash equivalents ($)    9,249,540   20,819,467  (11,569,927)  (56%)
Bank debt ($)                    1,482,624    4,619,149   (3,136,525)  (68%)
Average realized copper price
 per pound                            3.58         3.86        (0.28)   (7%)
Cash cost per pound                   2.48         2.40         0.08     3%
Total cost per pound                  3.64         3.69        (0.05)   (1%)
---------------------------------------------------------------------------
(1) Includes El Teniente royalty costs.

Financial results

--  Revenue was $181,760,724 compared to $166,073,816 in 2011. Revenues
    increased due to stronger copper and molybdenum production, despite
    lower average metal prices.

--  Cost of sales was $182,850,919, compared to $156,296,713 in 2011, an
    increase of 17% driven by higher production levels and $4,559,327 for
    bonus payments on the signing of a four-year union agreement with MVC
    workers.

--  Gross loss was $1,090,195, compared to gross profit of $9,777,103 in
    2011. The decrease in gross profit was driven by higher production costs
    and lower metal prices.

--  Net loss was $8,192,396 compared to a net profit of $8,700,518 in 2011.

Production

--  The Company produced 51.7 million pounds of copper, 18% higher than the
    43.7 million pounds produced in 2011.

--  Molybdenum production was 1,057,717 pounds, 35% higher than the 785,068
    pounds produced in 2011.

Revenue

--  Revenue increased to $181,760,724 compared to $166,073,816 in 2011, due
    to higher production levels despite lower metal prices. The Company's
    copper selling price before smelting, refining and other charges was
    $3.58/lb compared to $3.86/lb in 2011, and the Company's molybdenum
    selling price was $12.64/lb compared to $16.16/lb in 2011. Copper and
    molybdenum sales volume increased 18% and 69% respectively in 2012.

Costs

--  Cash cost (the aggregate of smelting, refining and other charges,
    production costs net of molybdenum-related net benefits, administration
    and transportation costs) before El Teniente royalty was $2.48/lb,
    compared to $2.40/lb in 2011. Cash costs increased in 2012 mostly as a
    result of higher labour and Colihues processing costs.

--  Total cost (the aggregate of cash cost, El Teniente royalty,
    depreciation and accretion) was $3.64/lb compared to $3.69/lb in 2011.
    The decrease in total cost was driven by lower El Teniente royalty unit
    costs.

--  Power costs in 2012 were $50,677,232 ($0.1895/kwh) compared to
    $45,365,873 ($0.1903/kwh) in 2011.

--  Total El Teniente royalties were $43,873,612 in 2012, compared to
    $41,544,730 in 2011, due to higher production.

--  In 2012 the Company recorded a $4,559,327 ($0.09/lb) expense for bonuses
    payable on the signing of a four-year union labour agreement with MVC
    workers. Signing bonuses are customary in Chile and in recent years the
    mining industry has paid historically high bonuses due to a shortage of
    skilled workers. Most of the cost of the signing bonuses was allocated
    to direct labour costs, with a smaller amount allocated to
    administration costs.

Cash and Financing Activities

--  Cash balance was $9,249,540 at December 31, 2012 compared to $20,819,467
    at December 31, 2011.

Dividends

--  The Company declared two semi-annual dividends of Cdn$0.02 per share in
    2012, for total dividend payments of $6,844,750, representing an annual
    yield of 7.02%.

Investments

--  Cash payments for capital expenditures ("Capex") were $23,707,654
    compared to $21,346,199 in 2011. Capex payments have been funded from
    operating cash flow and cash at hand.

--  Capex incurred in 2012 included totaled $22,162,429 (2011: $26,226,646)
    and included project investments in anticipation of the Company
    obtaining the rights to process tailings from Cauquenes.

--  The Company's investments in Candente Copper Corp. ("Candente Copper")
    Candente Gold Corp. ("Candente Gold"), Cobriza Metals Corp. ("Cobriza")
    and Los Andes Copper Ltd. ("Los Andes") had aggregate fair values of
    $4,149,388 at December 31, 2012 (December 31, 2011: $8,722,744).

Outlook

--  In 2013 production is expected to be between 45 and 50 million pounds of
    copper and one million pounds of molybdenum.

--  Cash cost is projected to be reduced to between $1.95/lb and $2.15/lb in
    2013, mainly as a result of the change in the remaining five years of
    the Company's power contract from a variable to a lower fixed rate.

--  Excluding the Cauquenes project, 2013 Capex at MVC is estimated to be
    approximately $7 million. Capex for Cauquenes engineering and permitting
    in 2013 is estimated to be up to $1.9 million. The Company is in the
    process of finalizing an agreement with El Teniente for reimbursement of
    this amount in case the parties are unable to reach an agreement for the
    processing of the Cauquenes tailings.
The information in this news release and the Selected Financial
Information contained in the following page should be read in
conjunction with the Audited Consolidated Financial Statements and
Management Discussion and Analysis for the years ended December 31,
2012 and 2011, which will be available at the Company's website at
www.amerigoresources.com and at www.sedar.com.
Amerigo Resources Ltd. produces copper and molybdenum under a
long term partnership with the world's largest copper producer,
Codelco, by means of processing fresh and old tailings from the
world's largest underground copper mine, El Teniente near Santiago,
Chile. Tel: (604) 681-2802; Fax: (604) 682-2802; Web:
www.amerigoresources.com; Listing: (TSX:ARG).
Certain of the information and statements contained herein that
are not historical facts, constitute "forward-looking information"
within the meaning of the Securities Act (British Columbia),
Securities Act (Ontario) and the Securities Act (Alberta)
("Forward-Looking Information"). Forward-Looking Information is
often, but not always, identified by the use of words such as
"seek", "anticipate", "believe", "plan", "estimate", "expect" and
"intend"; statements that an event or result is "due" on or "may",
"will", "should", "could", or might\" occur or be achieved; and,
other similar expressions. More specifically, Forward-Looking
Information contained herein includes, without limitation,
information concerning future tailings production volumes and the
Company's copper and molybdenum production, all of which involve
known and unknown risks, uncertainties and other factors which may
cause the actual results, performance or achievements of the
Company, or industry results, to be materially different from any
future results, performance or achievements expressed or implied by
such Forward-Looking Information; including, without limitation,
material factors and assumptions relating to, and risks and
uncertainties associated with, the supply of tailings from El
Teniente and extraction of tailings from the Colihues tailings
impoundment, the achievement and maintenance of planned production
rates, the evolving legal and political policies of Chile, the
volatility in the Chilean economy, military unrest or terrorist
actions, metal price fluctuations, favourable governmental
relations, the availability of financing for activities when
required and on acceptable terms, the estimation of mineral
resources and reserves,
current and future environmental and regulatory requirements,
the availability and timely receipt of permits, approvals and
licenses, industrial or environmental accidents, equipment
breakdowns, availability of and competition for future mineral
acquisition opportunities, availability and cost of insurance,
labour disputes, land claims, the inherent uncertainty of
production and cost estimates, currency fluctuations, expectations
and beliefs of management and other risks and uncertainties,
including those described under Risk Factors in the Company's
Annual Information Form and in Management's Discussion and Analysis
in the Company's financial statements. Such Forward-Looking
Information is based upon the Company's assumptions regarding
global and Chilean economic, political and market conditions and
the price of metals, including copper and molybdenum, and future
tailings production volumes and the Company's copper and molybdenum
production. Among the factors that have a direct bearing on the
Company's future results of operations and financial conditions are
changes in project parameters as plans continue to be refined,
interruptions in the supply of fresh tailings from El Teniente,
further delays in the extraction of tailings from the Colihues
tailings impoundment, a change in government policies, competition,
currency fluctuations and restrictions and technological changes,
among other things. Should one or more of any of the aforementioned
risks and uncertainties materialize, or should underlying
assumptions prove incorrect, actual results may vary materially
from any conclusions, forecasts or projections described in the
Forward-Looking Information. Accordingly, readers are advised not
to place undue reliance on Forward-Looking Information. Except as
required under applicable securities legislation, the Company
undertakes no obligation to publicly update or revise
Forward-Looking Information, whether as a result of new
information, future events or otherwise.
AMERIGO RESOURCES LTD.
SELECTED FINANCIAL INFORMATION

YEARS ENDED DECEMBER 31, 2012 AND 2011
All figures expressed in US Dollars and presented under IFRS

Consolidated Statements of Financial Position
                                                  December 31,  December 31,
                                                         2012          2011
                                                            $             $
                                                 --------------------------
Cash and cash equivalents                           9,249,540    20,819,467
Property, plant and equipment                     157,073,232   138,638,900
Other assets                                       38,093,547    45,871,252
                                                 --------------------------

Total assets                                      204,416,319   205,329,619
                                                 --------------------------

Total liabilities                                  72,217,963    66,348,005
Shareholders' equity                              132,198,356   138,981,614
                                                 --------------------------

Total liabilities and shareholders' equity        204,416,319   205,329,619
                                                 --------------------------


Consolidated Statements of Comprehensive (Loss) Income
                                                   Year ended    Year ended
                                                  December 31,  December 31,
                                                         2012          2011
                                                            $             $
                                                 --------------------------
Total revenue, net of smelter and refinery
 charges                                          181,760,724   166,073,816
Cost of sales                                    (182,850,919) (156,296,713)
Other expenses                                     (3,750,961)   (6,891,870)
Non operating (loss) gain                          (1,056,030)    8,443,698
Income tax expense                                 (2,295,210)   (2,628,413)
                                                 --------------------------
(Loss) profit for the year                         (8,192,396)    8,700,518
Other comprehensive income (loss)                   7,105,211   (26,905,645)
                                                 --------------------------
Comprehensive (loss) income                        (1,087,185)  (18,205,127)
                                                 --------------------------

(LPS) EPS - Basic and Diluted                           (0.05)         0.05


Consolidated Statements of Cash Flows
                                                  December 31,  December 31,
                                                         2012          2011
                                                            $             $
                                                 --------------------------
Net cash provided by operating activities          22,724,841    14,050,484
Net cash used in investing activities             (23,707,654)  (10,919,263)
Net cash (used in)/provided by financing
 activities                                       (10,192,664)  (16,342,933)
                                                 --------------------------
Net cash (outflow) inflow during the period       (11,175,477)  (13,211,712)
                                                 --------------------------
Contacts: Amerigo Resources Ltd. Dr. Klaus Zeitler President
(604) 218-7013 Amerigo Resources Ltd. (604) 697-6201
www.amerigoresources.com
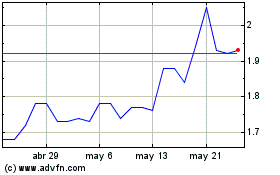
Amerigo Resources (TSX:ARG)
Gráfica de Acción Histórica
De May 2024 a Jun 2024

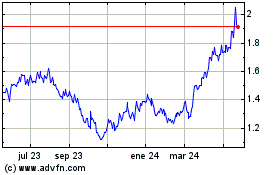
Amerigo Resources (TSX:ARG)
Gráfica de Acción Histórica
De Jun 2023 a Jun 2024
