false
0001515816
0001515816
2024-05-01
2024-05-01
0001515816
plym:CommonStockParValue0.01PerShareMember
2024-05-01
2024-05-01
iso4217:USD
xbrli:shares
iso4217:USD
xbrli:shares
UNITED STATES
SECURITIES AND EXCHANGE COMMISSION
WASHINGTON, D.C. 20549
FORM 8-K
CURRENT REPORT
PURSUANT TO SECTION 13 OR 15(d) OF
THE SECURITIES EXCHANGE ACT OF 1934
May 1, 2024
Date of Report (Date of earliest event reported)
PLYMOUTH INDUSTRIAL REIT, INC.
(Exact Name of Registrant as Specified in Its Charter)
| maryland |
|
001-38106 |
|
27-5466153 |
(State or Other Jurisdiction
of Incorporation) |
|
(Commission
File Number) |
|
(IRS Employer
Identification No.) |
20 Custom House Street, 11th Floor
Boston, MA 02110
(Address of Principal Executive Offices) (Zip Code)
(617) 340-3814
(Registrant’s Telephone Number, Including Area Code)
Check the appropriate box below if the Form 8-K filing
is intended to simultaneously satisfy the filing obligation of the registrant under any of the following provisions (see General Instruction
A.2. below):
|
Written communications pursuant to Rule 425 under the Securities Act (17 CFR 230.425) |
| ☐ |
Soliciting material pursuant to Rule 14a-12 under the Exchange Act (17 CFR 240.14a-12) |
| ☐ |
Pre-commencement communications pursuant to Rule 14d-2(b) under the Exchange Act (17 CFR 240.14d-2(b)) |
| ☐ |
Pre-commencement communications pursuant to Rule 13e-4(c) under the Exchange Act (17 CFR 240.13e-4(c)) |
Indicate by check mark whether the registrant is an
emerging growth company as defined in as defined in Rule 405 of the Securities Act of 1933 (§230.405 of this chapter) or Rule 12b-2
of the Securities Exchange Act of 1934 (§240.12b-2 of this chapter).
Emerging growth company ☐
If an emerging growth
company, indicate by check mark if the registrant has elected not to use the extended transition period for complying with any new or
revised financial accounting standards provided pursuant to Section 13(a) of the Exchange Act. ☐
| Securities registered pursuant to Section 12(b) of the Act: |
| |
| Title of Each Class |
Trading Symbol |
Name of Each Exchange on Which Registered |
| Common Stock, par value $0.01 per share |
PLYM |
New York Stock Exchange |
| |
|
|
| |
|
|
| Item 2.02 |
Results of Operations and Financial Condition |
On May 1, 2024, Plymouth Industrial REIT,
Inc. (the “Company”) issued a press release (the “Earnings Release”) announcing, among other things, earnings
for the three months ended March 31, 2024. The text of the Earnings Release is included as Exhibit 99.1 to this Current Report.
The Earnings Release is furnished pursuant
to Item 2.02 and shall not be deemed "filed" for purposes of Section 18 of the Securities Exchange Act of 1934, as amended (the
"Exchange Act"), or subject to the liabilities of that Section. The information in this Current Report shall not be incorporated
by reference in any filing under the Securities Act of 1933, as amended, or the Exchange Act, except as shall be expressly set forth by
specific reference in such filing.
| Item 7.01 |
Regulation FD Disclosure. |
On May 1, 2024, the Company disclosed
a supplemental analyst package in connection with its earnings conference call for the three months ended March 31, 2024, which is scheduled
to take place on May 2, 2024. A copy of the supplemental analyst package is attached hereto as Exhibit 99.2.
The supplemental analyst package is furnished
pursuant to Item 7.01 and shall not be deemed “filed” for purposes of Section 18 of the Exchange Act, or subject to the liabilities
of that Section. The information in this Current Report shall not be incorporated by reference in any filing under the Securities Act
of 1933, as amended, or the Exchange Act, except as shall be expressly set forth by specific reference in such filing.
| Item 9.01 |
Financial Statements and Exhibits. |
(d) Exhibits:
SIGNATURES
Pursuant to the requirements of the Securities Exchange Act
of 1934, the Company has duly caused this report to be signed on its behalf by the undersigned hereunto duly authorized.
| |
|
|
|
PLYMOUTH INDUSTRIAL REIT, INC. |
| |
|
|
|
|
| Date: May 1, 2024 |
|
|
|
By: |
|
/s/ Jeffrey E. Witherell |
| |
|
|
|
|
|
Jeffrey E. Witherell |
| |
|
|
|
|
|
Chief Executive Officer |
Exhibit 99.1

PLYMOUTH INDUSTRIAL REIT REPORTS FIRST QUARTER 2024 RESULTS
BOSTON, May 1, 2024 – Plymouth Industrial REIT, Inc. (NYSE:
PLYM) (the “Company”) today announced its financial results for the first quarter ended March 31, 2024, and other recent developments.
First Quarter and Subsequent Highlights
| · | Reported results for the first quarter of 2024 reflect net income attributable to common stockholders
of $0.14 per weighted average common share; Core Funds from Operations attributable to common stockholders and unit holders (“Core
FFO”) of $0.45 per weighted average common share and units; and Adjusted FFO (“AFFO”) of $0.45 per weighted average
common share and units. |
| · | Same store NOI (“SS NOI”) increased 2.9% on a GAAP basis excluding early termination income
for the first quarter compared with the same period in 2023; increased 7.0% on a cash basis excluding early termination income. |
| · | Commenced leases during the first quarter experienced a 17.1% increase in rental rates on a cash basis
from leases greater than six months with new leases experiencing a 48.4% increase on a cash basis and renewal leases experiencing an 5.9%
increase on a cash basis. Through April 29, 2024, executed leases scheduled to commence during 2024,
which includes the first quarter activity, total an aggregate of 4,148,844 square feet, all of which are associated with terms of at least
six months. The Company will experience a 16.5% increase in rental rates on a cash basis from these leases. |
| · | Completed 54,008 square feet of development leasing through the first quarter, bringing the total 772,622-square-foot
development program to 93% leased. |
| · | Recorded an approximate $8.0 million net gain on sale of real estate related to a tenant’s notice
of intent to exercise a fixed purchase option for $21.5 million for a property located in Columbus, OH. |
| · | Increased the regular quarterly cash dividend for the first quarter of 2024 by 6.7% to $0.240 per share
for the common stock, or an annualized rate of $0.96 per share. |
| · | Affirmed the full year 2024 guidance range for Core FFO per weighted average common share and units previously
issued on February 21, 2024, and updated its range for net income per weighted average common share and units and accompanying assumptions. |
Jeff Witherell, Chief Executive Officer and Co-Founder of Plymouth,
noted, “Our goals for 2024 are to utilize our real estate operating platform to deliver on leasing and improving the portfolio and
pursuing new opportunities that can drive accretive long-term growth. The leasing we have accomplished to date supports our continued
outlook for strong same-store NOI growth. The capital allocation decisions we have made with disposition and development activity, together
with improved liquidity on our balance sheet, position us to be very selective with acquisitions later this year and into 2025.”
Financial Results for the First Quarter of 2024
Net income attributable to common stockholders for the quarter
ended March 31, 2024, was $6.1 million, or $0.14 per weighted average common share outstanding, compared with net loss attributable to
common stockholders of $4.3 million, or $(0.10) per weighted average common share outstanding, for the same period in 2023. Net income
improved year-over-year primarily due to a gain on sale of real estate recognized upon our tenant’s notice to exercise their purchase
option and decreased depreciation and amortization expense. Weighted average common shares outstanding for the first quarters ended March
31, 2024, and 2023 were 45.0 million and 42.6 million, respectively.
Consolidated total revenues for the quarter ended March 31, 2024,
were $50.2 million, compared with $49.4 million for the same period in 2023.
NOI for the quarter ended March 31, 2024, was $33.5 million compared
with $33.4 million for the same period in 2023. SS NOI excluding early termination income – GAAP basis for the quarter ended March
31, 2024, was $31.7 million compared with $30.8 million for the same period in 2023, an increase of 2.9%. SS NOI excluding early termination
income – Cash basis for the quarter ended March 31, 2024, was $31.6 million compared with $29.5 million for the same period in 2023,
an increase of 7.0%. SS NOI for the first quarter was positively impacted by rent escalations, renewal and new leasing spreads, and increased
operating expense recoveries. The same store portfolio is comprised of 200 buildings totaling 31.2 million square feet, or 91.8% of the
Company’s total portfolio, and was 98.3% occupied as of March 31, 2024.
EBITDAre for the quarter ended March 31, 2024, was $30.2
million compared with $30.0 million for the same period in 2023.
Core FFO for the quarter ended March 31, 2024, was $20.6 million
compared with $19.6 million for the same period in 2023, primarily due to the elimination of preferred stock dividends as a result of
the redemption of the Series A Preferred Stock completed in September 2023. The Company reported Core FFO for the quarter ended March
31, 2024, of $0.45 per weighted average common share and unit compared with $0.45 per weighted average common share and unit for the same
period in 2023. Weighted average common shares and units outstanding for the first quarters ended March 31, 2024, and 2023 were 45.8 million
and 43.4 million, respectively, due to the ATM activity during Q3 2023 as part of the redemption of the Series A Preferred Stock.
AFFO for the quarter ended March 31, 2024, was $20.5 million,
or $0.45 per weighted average common share and unit, compared with $17.3 million, or $0.40 per weighted average common share and unit,
for the same period in 2023. The results reflected the aforementioned changes in Core FFO and decreases within recurring capital expenditures,
straight line rent and above/below market lease rent adjustments, partially offset by the 5.5% increase in outstanding common shares.
See “Non-GAAP Financial Measures” for complete definitions
of NOI, EBITDAre, Core FFO and AFFO and the financial tables accompanying this press release for reconciliations of net income to NOI,
EBITDAre, Core FFO and AFFO.
Liquidity
As of April 29, 2024, the Company’s current cash balance
was approximately $7.4 million, excluding operating expense escrows of approximately $3.1 million, and it has approximately $194.6 million
of capacity under the existing unsecured line of credit.
Investment Activity
As of March 31, 2024, the Company had real estate investments
comprised of 211 industrial buildings totaling 34.0 million square feet.
The final project in the first
phase of Plymouth’s development program, a 52,920-square-foot, fully leased building in Jacksonville, is expected to come online
in the fourth quarter of 2024. During the first quarter, Plymouth signed a seven-year, 54,008-square-foot lease at its 154,6922-square-foot
industrial building in Cincinnati. The Company’s development program is now 93% leased.
During the three months ended March 31, 2024, the tenant occupying
an industrial property located in Columbus, Ohio, provided notice of its intention to exercise the fixed purchase option stated within
their lease. The lease agreement requires the sale to close in August 2024 at a fixed price of approximately $21.5 million. In accordance
with ASC 842, Leases, we reclassified the respective real estate property to net investment in sales-type lease totaling $21.5
million on our condensed consolidated balance sheets, de-recognized the net book value of the property assets for $13.5 million and recognized
a gain on sale of real estate of $8.0 million related to this transaction.
Leasing Activity
Leases
commencing during the first quarter ended March 31, 2024 totaled an aggregate of 1,387,977 square feet, all of which are associated with
terms of at least six months. The Company will experience a 17.1% increase in rental rates on a cash basis from these leases. These
leases included 928,217 square feet of renewal leases and 459,760 square feet of new leases. Total portfolio occupancy at March 31, 2024
was 96.9% and reflects recent new developments now in service. Same store occupancy at March 31, 2024 was 98.3%.
Executed
leases scheduled to commence during 2024, which includes the first quarter activity, total an aggregate of 3,310,261 square feet, all
of which are associated with terms of at least six months. The Company will experience a 16.5% increase in rental rates on a cash basis
from these leases. These leases, which represent 58% of its total 2024 expirations, included 3,310,261 square feet of renewal leases (25.8%
of these leases were associated with contractual renewals) and 838,583 square feet of new leases, of which 15,200 square feet was vacant
at the start of 2024.
Quarterly Distributions to
Stockholders
On February 21, 2024, the Board
of Directors declared a regular quarterly common stock dividend of $0.240 per share for the first quarter of 2024. The dividend, which
represented an increase of 6.7%, was paid on April 30, 2024 to stockholders of record on March 28, 2024.
Guidance for 2024
Plymouth affirmed its full year 2024 guidance range for
Core FFO per weighted average common share and units previously issued on February 21, 2024, and updated its range for net income per
weighted average common share and units and accompanying assumptions.
Reconciliation of
net income attributable to common stockholders and unit holders per share to Core FFO guidance:
| | |
Full Year 2024 Range1,2,3 | |
| | |
Low | | |
High | |
| Net income | |
$ | 0.08 | | |
$ | 0.12 | |
| Gain on sale of real estate | |
| (0.18 | ) | |
| (0.18 | ) |
| Real estate depreciation & amortization | |
| 1.98 | | |
| 1.98 | |
| Core FFO | |
$ | 1.88 | | |
$ | 1.92 | |
| 1) | Our 2024 guidance refers to the Company's in-place portfolio as of April 29, 2024, the aforementioned
$21.5 million disposition scheduled to close in August 2024 and does not include the impact from prospective acquisitions, dispositions,
or capitalization activities. |
| 2) | Includes non-cash stock compensation of $4.3 million for 2024. |
| 3) | As of April 29, 2024, the Company has 45,872,375 common shares and units outstanding. |
Earnings Conference Call and Webcast
The Company will host a conference call and live audio
webcast, both open for the general public to hear, on Thursday, May 2, 2024 at 9:00 a.m. Eastern Time. The number to call for this interactive
teleconference is (844) 784-1727 (international callers: (412) 717-9587). A replay of the call will be available through May 9, 2024,
by dialing (877) 344-7529 and entering the replay access code, 6841649.
The Company has posted supplemental financial information
on the first quarter results and prepared commentary that it will reference during the conference call. The supplemental information can
be found under Financial Results on the Company’s Investor Relations page. The live audio webcast of the Company’s quarterly
conference call will be available online in the Investor Relations section of the Company’s website at ir.plymouthreit.com. The
online replay will be available approximately one hour after the end of the call and archived for one year.
About Plymouth
Plymouth Industrial REIT,
Inc. (NYSE: PLYM) is a full service, vertically integrated real estate investment company focused on the acquisition, ownership and management
of single and multi-tenant industrial properties. Our mission is to provide tenants with cost effective space that is functional, flexible
and safe.
Forward-Looking Statements
This press release
includes “forward-looking statements” that are made pursuant to the safe harbor provisions of Section 27A of the Securities
Act of 1933 and of Section 21E of the Securities Exchange Act of 1934. The forward-looking statements in this release do not constitute
guarantees of future performance. Investors are cautioned that statements in this press release, which are not strictly historical statements,
including, without limitation, statements regarding management's plans, objectives and strategies, constitute forward-looking statements.
Such forward-looking statements are subject to a number of known and unknown risks and uncertainties that could cause actual results to
differ materially from those anticipated by the forward-looking statements, many of which may be beyond our control. Forward-looking
statements generally can be identified by the use of forward-looking terminology such as “may,” “plan,” “seek,”
“will,” “expect,” “intend,” “estimate,” “anticipate,” “believe”
or “continue” or the negative thereof or variations thereon or similar terminology. Any forward-looking information presented
herein is made only as of the date of this press release, and we do not undertake any obligation to update or revise any forward-looking
information to reflect changes in assumptions, the occurrence of unanticipated events, or otherwise.
###
| Contact: |
|
|
| Tripp Sullivan |
|
|
| SCR Partners |
|
|
| IR@plymouthreit.com |
|
|
PLYMOUTH INDUSTRIAL REIT, INC.
CONDENSED CONSOLIDATED BALANCE SHEETS
UNAUDITED
(In thousands, except share and per share amounts)
| | |
March 31, | | |
December 31, | |
| | |
2024 | | |
2023 | |
| Assets | |
| | | |
| | |
| Real estate properties | |
$ | 1,551,254 | | |
$ | 1,567,866 | |
| Net investment in sales-type lease | |
| 21,459 | | |
| — | |
| Less accumulated depreciation | |
| (277,253 | ) | |
| (268,046 | ) |
| Real estate properties, net | |
| 1,295,460 | | |
| 1,299,820 | |
| | |
| | | |
| | |
| Cash | |
| 16,812 | | |
| 14,493 | |
| Cash held in escrow | |
| 3,222 | | |
| 4,716 | |
| Restricted cash | |
| 7,203 | | |
| 6,995 | |
| Deferred lease intangibles, net | |
| 46,396 | | |
| 51,474 | |
| Other assets | |
| 39,670 | | |
| 42,734 | |
| Interest rate swaps | |
| 26,382 | | |
| 21,667 | |
| Total assets | |
$ | 1,435,145 | | |
$ | 1,441,899 | |
| | |
| | | |
| | |
| Liabilities and Equity | |
| | | |
| | |
| Liabilities: | |
| | | |
| | |
| Secured debt, net | |
| 265,619 | | |
| 266,887 | |
| Unsecured debt, net | |
| 448,158 | | |
| 447,990 | |
| Borrowings under line of credit | |
| 155,400 | | |
| 155,400 | |
| Accounts payable, accrued expenses and other liabilities | |
| 68,049 | | |
| 73,904 | |
| Deferred lease intangibles, net | |
| 5,590 | | |
| 6,044 | |
| Financing lease liability | |
| 2,278 | | |
| 2,271 | |
| Interest rate swaps | |
| 189 | | |
| 1,161 | |
| Total liabilities | |
| 945,283 | | |
| 953,657 | |
| | |
| | | |
| | |
| Equity: | |
| | | |
| | |
| Common stock, $0.01 par value: 900,000,000 shares authorized; 45,382,076 and 45,250,184 shares issued and outstanding at March 31, 2024 and December 31, 2023, respectively. | |
| 453 | | |
| 452 | |
| | |
| | | |
| | |
| Additional paid in capital | |
| 634,651 | | |
| 644,938 | |
| Accumulated deficit | |
| (176,388 | ) | |
| (182,606 | ) |
| Accumulated other comprehensive income | |
| 25,859 | | |
| 20,233 | |
| Total stockholders' equity | |
| 484,575 | | |
| 483,017 | |
| Non-controlling interest | |
| 5,287 | | |
| 5,225 | |
| Total equity | |
| 489,862 | | |
| 488,242 | |
| Total liabilities and equity | |
$ | 1,435,145 | | |
$ | 1,441,899 | |
PLYMOUTH INDUSTRIAL REIT, INC.
CONDENSED CONSOLIDATED STATEMENTS OF OPERATIONS
UNAUDITED
(In thousands, except share and per share amounts)
| | |
For the Three Months | |
| | |
Ended March 31, | |
| | |
2024 | | |
2023 | |
| | |
| | |
| |
| Rental revenue | |
$ | 50,190 | | |
$ | 49,371 | |
| Management fee revenue and other income | |
| 38 | | |
| 29 | |
| Total revenues | |
| 50,228 | | |
| 49,400 | |
| | |
| | | |
| | |
| Operating expenses: | |
| | | |
| | |
| Property | |
| 16,642 | | |
| 15,954 | |
| Depreciation and amortization | |
| 22,368 | | |
| 23,800 | |
| General and administrative | |
| 3,364 | | |
| 3,447 | |
| Total operating expenses | |
| 42,374 | | |
| 43,201 | |
| | |
| | | |
| | |
| Other income (expense): | |
| | | |
| | |
| Interest expense | |
| (9,598 | ) | |
| (9,535 | ) |
| Gain on sale of real estate | |
| 8,030 | | |
| — | |
| Total other income (expense) | |
| (1,568 | ) | |
| (9,535 | ) |
| | |
| | | |
| | |
| Net income (loss) | |
| 6,286 | | |
| (3,336 | ) |
| Less: Net income (loss) attributable to non-controlling interest | |
| 68 | | |
| (38 | ) |
| Net income (loss) attributable to Plymouth Industrial REIT, Inc. | |
| 6,218 | | |
| (3,298 | ) |
| Less: Preferred Stock dividends | |
| — | | |
| 916 | |
| Less: Loss on extinguishment/redemption of Series A Preferred Stock | |
| — | | |
| 2 | |
| Less: Amount allocated to participating securities | |
| 94 | | |
| 88 | |
| Net income (loss) attributable to common stockholders | |
$ | 6,124 | | |
$ | (4,304 | ) |
| | |
| | | |
| | |
| Net income (loss) per share attributable to common stockholders - basic | |
$ | 0.14 | | |
$ | (0.10 | ) |
| Net income (loss) per share attributable to common stockholders - diluted | |
$ | 0.14 | | |
$ | (0.10 | ) |
| | |
| | | |
| | |
| Weighted-average common shares outstanding - basic | |
| 44,936,597 | | |
| 42,604,770 | |
| Weighted-average common shares outstanding - diluted | |
| 44,970,884 | | |
| 42,604,770 | |
Non-GAAP Financial Measures Definitions
Net Operating Income (NOI): We consider net operating income, or NOI,
to be an appropriate supplemental measure to net income in that it helps both investors and management understand the core operations
of our properties. We define NOI as total revenue (including rental revenue and tenant reimbursements) less property-level operating expenses.
NOI excludes depreciation and amortization, general and administrative expenses, impairments, gain/loss on sale of real estate, interest
expense, and other non-operating items.
EBITDAre: We define earnings before interest, taxes, depreciation
and amortization for real estate in accordance with the standards established by the National Association of Real Estate Investment Trusts
(“NAREIT”). EBITDAre represents net income (loss), computed in accordance with GAAP, before interest expense, tax,
depreciation and amortization, gains or losses on the sale of rental property, appreciation (depreciation) of warrants, loss on impairments,
and loss on extinguishment of debt. We believe that EBITDAre is helpful to investors as a supplemental measure of our operating
performance as a real estate company as it is a direct measure of the actual operating results of our industrial properties.
Funds from Operations (“FFO”): Funds from operations, or
FFO, is a non-GAAP financial measure that is widely recognized as a measure of an REIT’s operating performance, thereby, providing
investors the potential to compare our operating performance with that of other REITs. We consider FFO to be an appropriate supplemental
measure of our operating performance as it is based on a net income analysis of property portfolio performance that excludes non-cash
items such as depreciation. The historical accounting convention used for real estate assets requires straight-line depreciation of buildings
and improvements, which implies that the value of real estate assets diminishes predictably over time. Since real estate values rise and
fall with market conditions, presentations of operating results for a REIT, using historical accounting for depreciation, could be less
informative. In December 2018, NAREIT issued a white paper restating the definition of FFO. The purpose of the restatement was not to
change the fundamental definition of FFO, but to clarify existing NAREIT guidance. The restated definition of FFO is as follows: Net Income
(calculated in accordance with GAAP), excluding: (i) Depreciation and amortization related to real estate, (ii) Gains and losses from
the sale of certain real estate assets, (iii) Gain and losses from change in control, and (iv) Impairment write-downs of certain real
estate assets and investments in entities when the impairment is directly attributable to decreases in the value of depreciable real estate
held by the entity.
We define FFO consistent with the NAREIT definition. Adjustments
for unconsolidated partnerships and joint ventures will be calculated to reflect FFO on the same basis. Other equity REITs may not calculate
FFO as we do, and, accordingly, our FFO may not be comparable to such other REITs’ FFO. FFO should not be used as a measure of our
liquidity, and is not indicative of funds available for our cash needs, including our ability to pay dividends.
Core Funds from Operations (“Core FFO”): We calculate Core
FFO by adjusting FFO for non-comparable items such as dividends paid (or declared) to holders of our preferred stock, acquisition and
transaction related expenses for transactions not completed, and certain non-cash operating expenses such as impairment on real estate
lease, appreciation/(depreciation) of warrants and loss on extinguishment of debt. We believe that Core FFO is a useful supplemental measure
in addition to FFO by adjusting for items that are not considered by us to be part of the period-over-period operating performance of
our property portfolio, thereby, providing a more meaningful and consistent comparison of our operating and financial performance during
the periods presented. As with FFO, our reported Core FFO may not be comparable to other REITs’ Core FFO, should not be used as
a measure of our liquidity, and is not indicative of our funds available for our cash needs, including our ability to pay dividends.
Adjusted Funds from Operations (“AFFO”): Adjusted funds from
operations, or AFFO, is presented in addition to Core FFO. AFFO is defined as Core FFO, excluding certain non-cash operating revenues
and expenses, capitalized interest and recurring capitalized expenditures. Recurring capitalized expenditures include expenditures required
to maintain and re-tenant our properties, tenant improvements and leasing commissions. AFFO further adjusts Core FFO for certain other
non-cash items, including the amortization or accretion of above or below market rents included in revenues, straight line rent adjustments,
non-cash equity compensation and non-cash interest expense.
We believe AFFO provides a useful supplemental measure of our
operating performance because it provides a consistent comparison of our operating performance across time periods that is comparable
for each type of real estate investment and is consistent with management’s analysis of the operating performance of our properties.
As a result, we believe that the use of AFFO, together with the required GAAP presentations, provide a more complete understanding of
our operating performance. As with Core FFO, our reported AFFO may not be comparable to other REITs’ AFFO, should not be used as
a measure of our liquidity, and is not indicative of our funds available for our cash needs, including our ability to pay dividends.
PLYMOUTH INDUSTRIAL REIT, INC.
SUPPLEMENTAL RECONCILIATION OF NON-GAAP DISCLOSURES
UNAUDITED
(In thousands, except share and per share amounts)
| | |
For the Three Months | |
| | |
Ended March 31, | |
| NOI: | |
2024 | | |
2023 | |
| Net income (loss) | |
$ | 6,286 | | |
$ | (3,336 | ) |
| General and administrative | |
| 3,364 | | |
| 3,447 | |
| Depreciation and amortization | |
| 22,368 | | |
| 23,800 | |
| Interest expense | |
| 9,598 | | |
| 9,535 | |
| Gain on sale of real estate | |
| (8,030 | ) | |
| — | |
| Management fee revenue and other income | |
| (38 | ) | |
| (29 | ) |
| NOI | |
$ | 33,548 | | |
$ | 33,417 | |
| | |
For the Three Months | |
| | |
Ended March 31, | |
| EBITDAre: | |
2024 | | |
2023 | |
| Net income (loss) | |
$ | 6,286 | | |
$ | (3,336 | ) |
| Depreciation and amortization | |
| 22,368 | | |
| 23,800 | |
| Interest expense | |
| 9,598 | | |
| 9,535 | |
| Gain on sale of real estate | |
| (8,030 | ) | |
| — | |
| EBITDAre | |
$ | 30,222 | | |
$ | 29,999 | |
| | |
For the Three Months | |
| | |
Ended March 31, | |
| FFO: | |
2024 | | |
2023 | |
| Net income (loss) | |
$ | 6,286 | | |
$ | (3,336 | ) |
| Gain on sale of real estate | |
| (8,030 | ) | |
| — | |
| Depreciation and amortization | |
| 22,368 | | |
| 23,800 | |
| FFO: | |
$ | 20,624 | | |
$ | 20,464 | |
| Preferred stock dividends | |
| — | | |
| (916 | ) |
| Acquisition expenses | |
| — | | |
| 81 | |
| Core FFO | |
$ | 20,624 | | |
$ | 19,629 | |
| | |
| | | |
| | |
| Weighted average common shares and units outstanding | |
| 45,809 | | |
| 43,432 | |
| Core FFO per share | |
$ | 0.45 | | |
$ | 0.45 | |
| | |
For the Three Months | |
| | |
Ended March 31, | |
| AFFO: | |
2024 | | |
2023 | |
| Core FFO | |
$ | 20,624 | | |
$ | 19,629 | |
| Amortization of debt related costs | |
| 438 | | |
| 568 | |
| Non-cash interest expense | |
| (102 | ) | |
| 294 | |
| Stock compensation | |
| 914 | | |
| 585 | |
| Capitalized interest | |
| (75 | ) | |
| (335 | ) |
| Straight line rent | |
| (15 | ) | |
| (912 | ) |
| Above/below market lease rents | |
| (318 | ) | |
| (734 | ) |
| Recurring capital expenditures(1) | |
| (994 | ) | |
| (1,806 | ) |
| AFFO | |
$ | 20,472 | | |
$ | 17,289 | |
| | |
| | | |
| | |
| Weighted average common shares and units outstanding | |
| 45,809 | | |
| 43,432 | |
| AFFO per share | |
$ | 0.45 | | |
$ | 0.40 | |
(1) Excludes non-recurring capital expenditures of $3,000 and $8,413 for the three
months ended March 31, 2024 and 2023, respectively.
 |
|
FIRST QUARTER 2024
Plymouth REIT
Supplemental
Information
|
Table of Contents
| Table of Contents |
|
| Executive Summary |
4 |
| Company Overview, Management, Board of Directors, and Investor Relations |
4 |
| Portfolio Snapshot |
5 |
| Total Acquisition and Replacement Cost by Market |
5 |
| Acquisition Activity |
6 |
| Development Projects |
7 |
| Value
Creation Examples |
8 |
| Guidance |
9 |
| Financial Information |
|
| Consolidated Balance Sheets |
11 |
| Consolidated Statements of Operations |
12 |
| Non-GAAP Measurements |
13 |
| Same Store Net Operating Income (NOI) |
14 |
| Debt Summary |
15 |
| Capitalization and Capital Markets Activity |
16 |
| Net Asset Value Components |
17 |
| Rentable Square Feet and Annualized Base Rent by Market |
18 |
| Operational & Portfolio Information |
|
| Leasing Activity: Lease Renewals and New Leases |
20 |
| Leasing Activity: Lease Expiration Schedule & % of Annual Base Rent Expiring |
21 |
| Leased Square Feet and Annualized Base Rent by Tenant Industry |
22 |
| Leased Square Feet and Annualized Base Rent by Type |
23 |
| Top 10 Tenants by Annualized Base Rent |
24 |
| Lease Segmentation by Size |
25 |
| Capital Expenditures |
26 |
| Appendix |
|
| Glossary |
28 |
Disclaimers
Forward-Looking Statements
This Supplemental Information contains forward-looking statements
that are made pursuant to the safe harbor provisions of Section 27A of the Securities Act of 1933 and of Section 21E of the Securities
Exchange Act of 1934. The forward-looking statements in this Supplemental Information do not constitute guarantees of future performance.
Investors are cautioned that statements in this Supplemental Information, which are not strictly historical statements, including, without
limitation, statements regarding management's plans, objectives and strategies, constitute forward-looking statements. Such forward-looking
statements are subject to a number of known and unknown risks and uncertainties that could cause actual results to differ materially from
those anticipated by the forward-looking statement, many of which may be beyond our control, including, without limitation, those factors
described under the captions “Cautionary Note Regarding Forward-Looking Statements” and “Risk Factors” in the
Company’s Annual Report on Form 10-K and Quarterly Reports on Form 10-Q filed with the Securities and Exchange Commission. Forward-looking
statements generally can be identified by the use of forward-looking terminology such as “may,” “plan,” “seek,”
“will,” “expect,” “intend,” “estimate,” “anticipate,” “believe”
or “continue” or the negative thereof or variations thereon or similar terminology. Any forward-looking information presented
herein is made only as of the date of this Supplemental Information, and we do not undertake any obligation to update or revise any forward-looking
information to reflect changes in assumptions, the occurrence of unanticipated events, or otherwise.
Definitions and Reconciliations
For definitions of certain terms used throughout this Supplemental
Information, including certain non-GAAP financial measures, refer to the Glossary on pages 28-30. For reconciliations of the non-GAAP
financial measures to the most directly comparable U.S. GAAP measures, refer to page 13.
Executive Summary
Company Overview
Plymouth Industrial REIT, Inc. (NYSE: PLYM) is a full service, vertically integrated
real estate investment company focused on the acquisition, ownership, and management of single and multi-tenant industrial properties.
Our mission is to provide tenants with cost effective space that is functional, flexible and safe.
Management, Board
of Directors, Investor Relations, and Equity RESEARCH Coverage
|
Corporate
20 Custom House Street
11th Floor
Boston, Massachusetts 02110
617.340.3814
www.plymouthreit.com
Investor Relations
Tripp Sullivan
SCR Partners
IR@plymouthreit.com
Continental Stock Transfer
& Trust Company
1 State Street, 30th Floor
New York, NY 10004
212.509.4000
|
Executive Management
Jeffrey E. Witherell
Chief Executive Officer
and Chairman
Anthony J. Saladino
Executive Vice President
and Chief Financial Officer
James M. Connolly
Executive Vice President
Asset Management
Lyndon J. Blakesley
Senior Vice President
and Chief Accounting Officer
|
Benjamin P. Coues
Senior Vice President
and Head of Acquisitions
Anne A. Hayward, ESQ.
Senior Vice President
and General Counsel
Daniel R. Heffernan
Senior Vice President
Asset Management
Scott L. Robinson
Senior Vice President
Corporate Development
|
Board of Directors
Phillip S. Cottone
Independent Director
Richard DeAgazio
Independent Director
David G. Gaw
Lead Independent Director
John W. Guinee
Independent Director
|
Caitlin Murphy
Independent Director
Pendleton P. White, Jr.
Director
Jeffrey E. Witherell
Chief Executive Officer
and Chairman
|
Equity Research Coverage1
Baird
Nicholas Thillman
414.298.5053
Barclays
Brendan Lynch
212.526.9428
BMO Capital Markets
John Kim
212.885.4115
BNP Paribas Exane
Nate Crossett
646.725.3716
B Riley Securities
Bryan Maher
646.885.5423
|
Colliers Securities
Barry Oxford
203.961.6573
JMP Securities
Mitch Germain
212.906.3537
J.P. Morgan
Mike Mueller
212.622.6689
KeyBanc Capital Markets
Todd Thomas
917.368.2375
Truist Securities
Anthony Hau
212.303.4176
|
Investor Conference Call and Webcast
The Company will host a conference call and live audio webcast, both
open for the general public to hear, on May 2, 2024 at 9:00 a.m. Eastern Time. The number to call for this interactive teleconference
is (844) 784-1727 (international callers: (412) 717-9587). A replay of the call will be available through May 9, 2024 by dialing (877)
344-7529 and entering the replay access code, 6841649.
1 The analysts listed provide research
coverage on the Company. Any opinions, estimates or forecasts regarding the Company's performance made by these analysts are theirs alone
and do not represent opinions, estimates or forecasts by the Company or its management. The Company does not by reference above imply
its endorsement of or concurrence with such information, conclusions or recommendations.
Highlights
For Three Months Ended March 31, 2024
Portfolio Snapshot
| Number of Properties |
156 |
| Number of Buildings |
211 |
| Square Footage |
34,025,101 |
| Portfolio Occupancy |
96.9% |
| Same-Store Occupancy |
98.3% |
WA Lease Term
Remaining (yrs.)1 |
3.2 |
Multi-Tenant as
% of ABR |
54.3% |
Single Tenant as
% of ABR |
45.7% |
| WA Annual Rent Escalators |
~3.0% |
Triple Net Leases as
% of ABR |
80.5% |
| Net Debt to Annualized Adjusted EBITDA |
6.7x |
| |
|
| 1 The average contractual lease term remaining as of the close of the reporting period (in years) weighted by square footage. |
Total Acquisition and Replacement Cost by Market
($ in Thousands)
| Market |
State |
# of
Buildings |
Rentable Square Feet |
Total
Acquisition Cost1 |
Replacement
Cost2 |
| Atlanta |
GA |
13 |
2,086,835 |
$ |
111,988 |
$ |
154,583 |
| Chicago |
IL, IN, WI |
40 |
6,624,335 |
|
279,750 |
|
710,499 |
| Boston |
ME |
2 |
268,713 |
|
19,023 |
|
40,729 |
| Charlotte |
NC |
1 |
155,220 |
|
20,400 |
|
20,821 |
| Cincinnati |
OH, KY |
12 |
2,710,964 |
|
106,705 |
|
190,851 |
| Cleveland |
OH |
19 |
3,979,209 |
|
201,550 |
|
362,436 |
| Columbus |
OH |
15 |
3,757,614 |
|
157,624 |
|
293,943 |
| Indianapolis |
IN |
17 |
4,085,169 |
|
149,251 |
|
356,416 |
| Jacksonville |
FL, GA |
28 |
2,132,396 |
|
159,621 |
|
219,679 |
| Kansas City |
MO |
1 |
221,911 |
|
8,600 |
|
20,451 |
| Memphis |
MS, TN |
49 |
4,783,046 |
|
185,407 |
|
349,852 |
| St. Louis |
IL, MO |
14 |
3,219,689 |
|
213,787 |
|
325,818 |
| Total |
12 |
211 |
34,025,101 ’ |
$ |
1,613,706 |
$ |
3,046,078 |
| 1 | Represents total direct consideration paid prior to
the allocations per U.S. GAAP and the allocated costs in accordance to GAAP of development properties placed in-service. |
| 2 | Replacement cost is based on the Marshall & Swift
valuation methodology for the determination of building costs. Replacement cost includes land reflected at the allocated cost in accordance
with GAAP. |
Acquisition Activity
As of March 31, 2024
Acquisitions ($
in Thousands)
| Location |
Acquisition Date |
# of
Buildings |
Purchase Price1 |
Square Footage |
Projected
Initial Yield2 |
Cost per
Square Foot3 |
| Multiple |
Full Year 2022 |
44 |
$ |
253,655 |
4,164,864 |
6.1% |
$71.54 |
| Multiple |
Full Year 2021 |
24 |
$ |
370,977 |
6,380,302 |
6.7% |
$63.15 |
| Multiple |
Full Year 2020 |
27 |
$ |
243,568 |
5,473,596 |
7.8% |
$46.99 |
| Multiple |
Full Year 2019 |
32 |
$ |
220,115 |
5,776,928 |
8.4% |
$42.21 |
| Multiple |
Full Year 2018 |
24 |
$ |
164,575 |
2,903,699 |
8.2% |
$70.54 |
| Multiple |
2017 (since IPO) |
36 |
$ |
173,325 |
5,195,563 |
8.4% |
$33.81 |
| Total Acquisitions Post-IPO |
|
187 |
$ |
1,426,215 |
29,894,952 |
7.4% |
$55.94 |
Note: Portfolio statistics and acquisitions
include wholly owned industrial properties only; excludes our property management office located in Columbus, Ohio.
| 1 | Represents total direct consideration paid rather than GAAP cost basis. |
| 2 | Weighted based on Purchase Price. |
| 3 | Calculated as Purchase Price divided by square footage. |
Development Projects
As of March 31, 2024
The total investment in completed developments is approximately $61.1
million. The proforma stabilized cash NOI yields on development projects under construction and completed range between 7.0% - 9.0%.
Plymouth is partnering with the Green Building Initiative to
align our environmental objectives with the execution of all new development and portfolio enhancement activities. Thus far, Plymouth
has achieved a Three Green Globe certification on our Cincinnati development and a Two Green Globe certification on our completed developments
in Boston, Jacksonville (2) and Atlanta (2) 1.
|
| Under Construction1 |
# of
Buildings |
Total Rentable
Square Feet (RSF) |
% Leased |
Investment
($ in millions) |
% Funded |
Estimated
Completion |
| Jacksonville - Liberty II |
1 |
52,920 |
100% |
$ |
4.0 |
54% |
Q4 2024 |
| Total |
1 |
52,920 |
|
$ |
4.0 |
|
|
| |
|
|
|
|
|
|
|
| Completed 2 |
# of
Buildings |
Total Rentable
Square Feet (RSF) |
% Leased |
Investment
($ in millions) |
% Funded |
Completed |
| Boston - Milliken Road |
1 |
68,088 |
100% |
$ |
9.3 |
100% |
Q4 2022 |
| Atlanta - New Calhoun I |
1 |
236,600 |
100% |
$ |
13.8 |
100% |
Q1 2023 |
| Cincinnati - Fisher Park I |
1 |
154,692 |
66% |
$ |
14.0 |
100% |
Q1 2023 |
| Atlanta - New Calhoun II |
1 |
180,000 |
100% |
$ |
12.1 |
100% |
Q3 2023 |
| Jacksonville – Salisbury |
1 |
40,572 |
100% |
$ |
6.2 |
100% |
Q3 2023 |
| Jacksonville – Liberty I |
1 |
39,750 |
100% |
$ |
5.7 |
100% |
Q4 2023 |
| Total |
6 |
719,702 |
93% |
$ |
61.1 |
100% |
|
| 1 | The Company is a member organization of the Green Building Initiative (GBI), a nonprofit organization and American National Standards
Institute (ANSI) Accredited Standards Developer dedicated to reducing climate impacts by improving the built environment. Founded in 2004,
the organization is the global provider of the Green Globes and federal Guiding Principles Compliance certification and assessment programs. |
| 2 | Under construction represents projects for which vertical construction has commenced. Refer to the Developable Land section of the
Net Asset Components on page 17 of this Supplemental Information for additional details on the Company's development activities. |
| 3 | Completed buildings are included within portfolio occupancy and square footage metrics as of March 31, 2024. |
Value Creation Examples
| INDIANAPOLIS: Lease-up / Building Refurbishment |
|
JACKSONVILLE: New Industrial Development |
|
CHICAGO: Disposition / Value Realized |
| |
|
|
|
|
 |
|
 |
|
 |
|
Expanded existing tenant in the building by an additional 42,910
square feet and extended term for 15 years at a rental rate increase of 18% over expiring rents.
Expanded other existing tenant by an additional 147,310 square
feet for 4 years without any downtime.
The property was acquired at a going-in yield of 6.9%. Stabilized
yield is now 8.0% with annual lease escalations averaging 3.75%. |
|
Delivered two buildings in 2023 totaling 80,322 square feet,
both of which are fully leased.
Commenced construction on a third, 100% pre-leased building at
Liberty Business Park which will comprise 52,920 square feet. The anticipated delivery is Q4 2024.
Marketing an additional fully designed and permit-ready site
at Liberty Business Park that can provide 41,958 square feet. |
|
Sold a 306,552 square-foot industrial building at 6510 West 73rd
Street in Chicago.
Net proceeds after the payoff of a $6.7 million mortgage, return
of lender escrow reserves, and other adjustments were $14.0 million.
The disposition yielded a 4.9% cap rate on in-place NOI and an
IRR of 31.1% over a six-year hold period. |
Guidance
As of March 31, 2024
Unaudited (in thousands, except per-share amounts)
PLYM affirmed its full year 2024 guidance range for Core FFO
per weighted average common share and units previously issued on February 21, 2024, and updated its range for net income per weighted
average common share and units and accompanying assumptions.
| |
Full Year 2024 Range1 |
| |
Low |
|
High |
| Core FFO attributable to common stockholders and unit holders per share |
$1.88 |
|
$1.92 |
| Same Store Portfolio NOI growth - cash basis2 |
7.00% |
|
7.50% |
| Average Same Store Portfolio occupancy - full year |
97.5% |
|
98.5% |
| General and administrative expenses3 |
$15,650 |
|
$15,150 |
| Interest expense, net |
$37,650 |
|
$37,150 |
| Weighted average common shares and units outstanding4 |
45,880 |
|
45,880 |
| |
|
|
|
| Reconciliation of net loss attributable to common stockholders and unit holders per share to Core FFO guidance: |
|
|
|
| |
Full Year 2024 Range1 |
| |
Low |
|
High |
| Net income/(loss) |
$ 0.08 |
|
$ 0.12 |
| Gain on sale of real estate |
(0.18) |
|
(0.18) |
| Depreciation and amortization |
1.98 |
|
1.98 |
| |
$1.88 |
|
$1.92 |
| 1 | Our 2024 guidance refers to the Company's in-place portfolio as of April
29, 2024, the $21.5 million disposition scheduled to close in August 2024 and does not include the impact from prospective acquisitions,
dispositions, or capitalization activities. |
| 2 | The Same Store Portfolio consists of 200 buildings aggregating 31,245,756 rentable square feet, representing approximately 92% of
total in-place portfolio square footage. The Same Store projected performance reflects an annual NOI on a cash basis, excluding termination
income. |
| 3 | Includes non-cash stock compensation of $4.3 million for 2024. |
| 4 | As of April 29, 2024, the Company has 45,872,375 common shares and units outstanding. |
 |
|
Financial
Information
|
1Q 2024 Supplemental | 10
Consolidated Balance Sheets
Unaudited ($ in thousands)
| |
March 31, 2024 |
December 31, 2023 |
September 30, 2023 |
June 30, 2023 |
March 31, 2023 |
| ASSETS |
|
|
|
|
|
|
|
|
|
|
| Real estate properties: |
|
|
|
|
|
|
|
|
|
|
| Land |
$ |
224,532 |
$ |
226,020 |
$ |
227,599 |
$ |
231,829 |
$ |
231,829 |
| Building and improvements |
|
1,326,722 |
|
1,341,846 |
|
1,343,025 |
|
1,339,505 |
|
1,331,664 |
| Net investment in sales-type lease1 |
|
21,459 |
|
- |
|
- |
|
- |
|
- |
| Less accumulated depreciation |
|
(277,253) |
|
(268,046) |
|
(254,402) |
|
(239,306) |
|
(222,418) |
| Total real estate properties, net |
$ |
1,295,460 |
$ |
1,299,820 |
$ |
1,316,222 |
$ |
1,332,028 |
$ |
1,341,075 |
| Cash, cash held in escrow and restricted cash |
27,237 |
|
26,204 |
|
30,272 |
|
38,517 |
|
38,432 |
| Deferred lease intangibles, net |
|
46,396 |
|
51,474 |
|
56,316 |
|
60,304 |
|
66,109 |
| Interest rate swaps2 |
|
26,382 |
|
21,667 |
|
34,115 |
|
31,180 |
|
23,045 |
| Other assets |
|
39,670 |
|
42,734 |
|
39,585 |
|
38,631 |
|
37,798 |
| Total assets |
$ |
1,435,145 |
$ |
1,441,899 |
$ |
1,476,510 |
$ |
1,500,660 |
$ |
1,506,459 |
| LIABILITIES, PREFERRED STOCK AND EQUITY |
|
|
|
|
|
|
|
|
|
|
| Secured debt, net |
$ |
265,619 |
$ |
266,887 |
$ |
377,714 |
$ |
386,191 |
$ |
387,942 |
| Unsecured debt, net3 |
|
603,558 |
|
603,390 |
|
512,823 |
|
535,155 |
|
534,994 |
| Interest rate swaps2 |
|
189 |
|
1,161 |
|
- |
|
- |
|
- |
| Accounts payable, accrued expenses and other liabilities |
|
68,049 |
|
73,904 |
|
75,112 |
|
70,492 |
|
70,739 |
| Deferred lease intangibles, net |
|
5,590 |
|
6,044 |
|
6,604 |
|
7,179 |
|
8,014 |
| Financing lease liability4 |
|
2,278 |
|
2,271 |
|
2,265 |
|
2,260 |
|
2,254 |
| Total liabilities |
$ |
945,283 |
$ |
953,657 |
$ |
974,518 |
$ |
1,001,277 |
$ |
1,003,943 |
| Preferred stock - Series A |
$ |
- |
$ |
- |
$ |
- |
$ |
46,803 |
$ |
46,803 |
| Equity: |
|
|
|
|
|
|
|
|
|
|
| Common stock |
$ |
453 |
$ |
452 |
$ |
452 |
$ |
431 |
$ |
430 |
| Additional paid in capital |
|
634,651 |
|
644,938 |
|
654,346 |
|
616,414 |
|
624,942 |
| Accumulated deficit |
|
(176,388) |
|
(182,606) |
|
(191,882) |
|
(200,147) |
|
(197,543) |
| Accumulated other comprehensive income |
|
25,859 |
|
20,233 |
|
33,695 |
|
30,792 |
|
22,750 |
| Total stockholders' equity |
|
484,575 |
|
483,017 |
|
496,611 |
|
447,490 |
|
450,579 |
| Non-controlling interest |
|
5,287 |
|
5,225 |
|
5,381 |
|
5,090 |
|
5,134 |
| Total equity |
$ |
489,862 |
$ |
488,242 |
$ |
501,992 |
$ |
452,580 |
$ |
455,713 |
| Total liabilities, preferred stock and equity |
$ |
1,435,145 |
$ |
1,441,899 |
$ |
1,476,510 |
$ |
1,500,660 |
$ |
1,506,459 |
| 1 | During the three months ended March 31, 2024, the tenant occupying a single tenant industrial property
located in Columbus, Ohio, provided notice of its intention to exercise its option to purchase the property at a fixed price of $21,480.
We believe the exercise of the purchase option is reasonably probable and therefore, in accordance with ASC 842, Leases, there is a lease
modification. As a result, we reclassified the respective real estate property to net investment in sales-type lease totaling $21,480
on our condensed consolidated balance sheets, effective as of the date of tenant notice, in the following amounts: (i) $19,605 from Real
estate properties, (ii) $8,094 from Accumulated depreciation, (iii) $877 from net Deferred lease intangible assets, and (iv) $1,062 from
Other assets. Further, we recognized a Gain on sale of real estate of $8,030 during the three months ended March 31, 2024 related to this
transaction. |
| 2 | Represents the fair value of the Company's interest rate swaps. We minimize the credit risk in our derivative
financial instruments by entering into transactions with various high-quality counterparties. Our exposure to credit risk at any point
is generally limited to amounts recorded as assets on the accompanying consolidated balance sheets. A summary of the Company's interest
rate swaps and accounting are detailed in Note 6 of our most recent Quarterly Report on Form 10-Q for expanded disclosure. |
| 3 | Includes borrowings under line of credit and term loans. Refer to Debt Summary in this Supplemental Information
for additional details. |
| 4 | As of March 31, 2024, we have a single finance lease in which we are the sublessee for a ground lease
with a remaining lease term of approximately 32 years. Refer to our most recent Quarterly Report on Form 10-Q for expanded disclosure. |
1Q 2024 Supplemental | 11
Consolidated Statements of Operations
Unaudited ($ in thousands, except per-share amounts)
| |
March 31, 2024 |
December 31, 2023 |
September 30, 2023 |
June 30, 2023 |
March 31, 2023 |
| Revenues: |
|
|
|
|
|
|
|
|
|
|
| Rental revenue |
$ |
37,331 |
$ |
38,642 |
$ |
37,416 |
$ |
37,814 |
$ |
37,586 |
| Tenant recoveries |
|
12,859 |
|
12,112 |
|
12,320 |
|
12,085 |
|
11,785 |
| Management fee revenue and other income |
|
38 |
|
30 |
|
29 |
|
- |
|
29 |
| Total revenues |
$ |
50,228 |
$ |
50,784 |
$ |
49,765 |
$ |
49,899 |
$ |
49,400 |
| Operating expenses: |
|
|
|
|
|
|
|
|
|
|
| Property |
|
16,642 |
|
15,144 |
|
15,754 |
|
15,690 |
|
15,954 |
| Depreciation and amortization |
|
22,368 |
|
22,793 |
|
22,881 |
|
23,417 |
|
23,800 |
| General and administrative |
|
3,364 |
|
4,318 |
|
3,297 |
|
3,842 |
|
3,447 |
| Total operating expenses |
$ |
42,374 |
$ |
42,255 |
$ |
41,932 |
$ |
42,949 |
$ |
43,201 |
| Other income (expense): |
|
|
|
|
|
|
|
|
|
|
| Interest expense |
|
(9,598) |
|
(9,686) |
|
(9,473) |
|
(9,584) |
|
(9,535) |
| Loss on extinguishment of debt |
|
- |
|
- |
|
(72) |
|
- |
|
- |
| Gain on sale of real estate1 |
|
8,030 |
|
10,534 |
|
12,112 |
|
- |
|
- |
| Total other income (expense) |
$ |
(1,568) |
$ |
848 |
$ |
2,567 |
$ |
(9,584) |
$ |
(9,535) |
| Net income (loss) |
$ |
6,286 |
$ |
9,377 |
$ |
10,400 |
$ |
(2,634) |
$ |
(3,336) |
| Less: Net income (loss) attributable to non-controlling interest |
|
68 |
|
101 |
|
114 |
|
(30) |
|
(38) |
| Net income (loss) attributable to Plymouth Industrial REIT, Inc. |
$ |
6,218 |
$ |
9,276 |
$ |
10,286 |
$ |
(2,604) |
$ |
(3,298) |
| Less: Preferred Stock dividends |
|
- |
|
- |
|
677 |
|
916 |
|
916 |
| Less: Loss on extinguishment/redemption of Series A Preferred Stock |
|
- |
|
- |
|
2,021 |
|
- |
|
2 |
| Less: Amount allocated to participating securities |
|
94 |
|
84 |
|
83 |
|
82 |
|
88 |
| Net income (loss) attributable to common stockholders |
$ |
6,124 |
$ |
9,192 |
$ |
7,505 |
$ |
(3,602) |
$ |
(4,304) |
| Net income (loss) per share attributable to common stockholders – basic2 |
$ |
0.14 |
$ |
0.20 |
$ |
0.17 |
$ |
(0.08) |
$ |
(0.10) |
| Net income (loss) per share attributable to common stockholders – diluted2 |
$ |
0.14 |
$ |
0.20 |
$ |
0.17 |
$ |
(0.08) |
$ |
(0.10) |
| Weighted-average common shares outstanding - basic |
|
44,937 |
|
44,879 |
|
44,057 |
|
42,647 |
|
42,605 |
| Weighted-average common shares outstanding - diluted |
|
44,971 |
|
44,992 |
|
44,140 |
|
42,647 |
|
42,605 |
| 1 | During the three months ended March 31, 2024, the tenant occupying an industrial property located in
Columbus, Ohio, provided notice of its intention to exercise its option to purchase the property. We re-evaluated the lease classification
of the lease in accordance to ASC 842, Leases, concluding that the lease had transitioned to a sales-type lease, thereby recognizing
a $8 million gain on sale of real estate during Q1 2024. The sale is expected to close in Q3 2024. |
| 2 | Refer to the Q1 2024 Quarterly Report on Form 10-Q for additional information. |
1Q 2024 Supplemental | 12
Non-GAAP Measurements
Unaudited ($ in thousands, except per-share amounts)
| |
March 31, 2024 |
December 31, 2023 |
September 30, 2023 |
June 30, 2023 |
March 31, 2023 |
| Consolidated NOI |
|
|
|
|
|
|
|
|
|
|
| Net income (loss) |
$ |
6,286 |
$ |
9,377 |
$ |
10,400 |
$ |
(2,634) |
$ |
(3,336) |
| General and administrative |
|
3,364 |
|
4,318 |
|
3,297 |
|
3,842 |
|
3,447 |
| Depreciation and amortization |
|
22,368 |
|
22,793 |
|
22,881 |
|
23,417 |
|
23,800 |
| Interest expense |
|
9,598 |
|
9,686 |
|
9,473 |
|
9,584 |
|
9,535 |
| Loss on extinguishment of debt |
|
- |
|
- |
|
72 |
|
- |
|
- |
| Gain on sale of real estate1 |
|
(8,030) |
|
(10,534) |
|
(12,112) |
|
- |
|
- |
| Management fee revenue and other income |
|
(38) |
|
(30) |
|
(29) |
|
- |
|
(29) |
| Net Operating Income |
$ |
33,548 |
$ |
35,610 |
$ |
33,982 |
$ |
34,209 |
$ |
33,417 |
| Earnings Before Interest, Taxes, Depreciation and Amortization for Real Estate (EBITDAre) |
|
|
|
|
|
|
|
|
|
|
| Net income (loss) |
$ |
6,286 |
$ |
9,377 |
$ |
10,400 |
$ |
(2,634) |
$ |
(3,336) |
| Depreciation and amortization |
|
22,368 |
|
22,793 |
|
22,881 |
|
23,417 |
|
23,800 |
| Interest expense |
|
9,598 |
|
9,686 |
|
9,473 |
|
9,584 |
|
9,535 |
| Loss on extinguishment of debt |
|
- |
|
- |
|
72 |
|
- |
|
- |
| Gain on sale of real estate |
|
(8,030) |
|
(10,534) |
|
(12,112) |
|
- |
|
- |
| EBITDAre |
$ |
30,222 |
$ |
31,322 |
$ |
30,714 |
$ |
30,367 |
$ |
29,999 |
| Stock compensation |
|
914 |
|
838 |
|
827 |
|
716 |
|
585 |
| Acquisition expenses |
|
- |
|
- |
|
- |
|
4 |
|
81 |
| Pro forma effect of acquisitions/developments2 |
|
216 |
|
432 |
|
542 |
|
308 |
|
453 |
| Adjusted EBITDA |
$ |
31,352 |
$ |
32,592 |
$ |
32,083 |
$ |
31,395 |
$ |
31,118 |
| Funds from Operations (FFO), Core FFO & Adjusted Funds from Operations (AFFO) |
|
|
|
|
|
|
|
|
|
|
| Net income (loss) |
$ |
6,286 |
$ |
9,377 |
$ |
10,400 |
$ |
(2,634) |
$ |
(3,336) |
| Gain on sale of real estate1 |
|
(8,030) |
|
(10,534) |
|
(12,112) |
|
- |
|
- |
| Depreciation and amortization |
|
22,368 |
|
22,793 |
|
22,881 |
|
23,417 |
|
23,800 |
| FFO |
$ |
20,624 |
$ |
21,636 |
$ |
21,169 |
$ |
20,783 |
$ |
20,464 |
| Preferred stock dividends |
|
- |
|
- |
|
(677) |
|
(916) |
|
(916) |
| Acquisition expenses |
|
- |
|
- |
|
- |
|
4 |
|
81 |
| Loss on extinguishment of debt |
|
- |
|
- |
|
72 |
|
- |
|
- |
| Core FFO |
$ |
20,624 |
$ |
21,636 |
$ |
20,564 |
$ |
19,871 |
$ |
19,629 |
| Amortization of debt related costs |
|
438 |
|
476 |
|
570 |
|
570 |
|
568 |
| Non-cash interest expense |
|
(102) |
|
582 |
|
(50) |
|
158 |
|
294 |
| Stock compensation |
|
914 |
|
838 |
|
827 |
|
716 |
|
585 |
| Capitalized interest |
|
(75) |
|
(134) |
|
(282) |
|
(351) |
|
(335) |
| Straight line rent |
|
(15) |
|
(111) |
|
(216) |
|
(705) |
|
(912) |
| Above/below market lease rents |
|
(318) |
|
(401) |
|
(417) |
|
(669) |
|
(734) |
| Recurring capital expenditures3 |
|
(994) |
|
(880) |
|
(1,965) |
|
(1,092) |
|
(1,806) |
| AFFO |
$ |
20,472 |
$ |
22,006 |
$ |
19,031 |
$ |
18,498 |
$ |
17,289 |
| Weighted-average common shares and units outstanding4 |
|
45,809 |
|
45,740 |
|
44,922 |
|
43,526 |
|
43,432 |
| Core FFO attributable to common stockholders and unit holders per share |
$ |
0.45 |
$ |
0.47 |
$ |
0.46 |
$ |
0.46 |
$ |
0.45 |
| AFFO attributable to common stockholders and unit holders per share |
$ |
0.45 |
$ |
0.48 |
$ |
0.42 |
$ |
0.42 |
$ |
0.40 |
| 1 | During the three months ended March 31, 2024, the tenant occupying an industrial property located in
Columbus, Ohio, provided notice of its intention to exercise its option to purchase the property. We re-evaluated the lease classification
of the lease in accordance to ASC 842, Leases, concluding that the lease had transitioned to a sales-type lease, thereby recognizing
a $8 million gain on sale of real estate during Q1 2024. The sale is expected to close in Q3 2024. |
| 2 | Represents the estimated impact of wholly owned acquisitions and development properties as if they had
been acquired or stabilized on the first day of each respective quarter in which the acquisitions occurred or developments were placed
in-service. We have made a number of assumptions in such estimates and there can be no assurance that we would have generated the projected
levels of EBITDA had we owned the acquired properties and/or placed the development properties in-service as of the beginning of the respective
periods. |
| 3 | Excludes non-recurring capital expenditures of $3,000 and $8,413 for the three months ended March 31,
2024 and 2023, respectively. |
| 4 | Weighted-average common shares and units outstanding includes common stock, OP units, and restricted
stock units as of March 31, 2024 and excludes 51,410 performance stock units as they are deemed to be non-participatory. |
1Q 2024 Supplemental | 13
Same Store Net Operating Income (NOI)
Unaudited ($ and SF in thousands)
| Same Store Portfolio Statistics |
| Square footage |
31,246 |
Includes: wholly owned properties as of December 31, 2022; determined
and set once per year for the following twelve months (refer to Glossary for Same Store definition)
Excludes: wholly owned properties classified as repositioning,
lease-up during 2023 or 2024 (6 buildings representing approximately 1,755,000 of rentable square feet), placed into service 2023 and
2024, and under contract for sale. |
| Number of properties |
146 |
| Number of buildings |
200 |
| Percentage of total portfolio square footage |
91.8% |
| Occupancy at period end |
98.3% |
| |
|
|
|
|
|
| Same Store NOI - GAAP Basis |
| |
|
March 31, 2024 |
December
31, 2023 |
September 30, 2023 |
June 30, 2023 |
March 31, 2023 |
| Same
Store NOI - GAAP Basis |
|
|
|
|
|
|
|
|
|
|
| Rental
revenue |
$ |
46,930
|
$ |
46,072
|
$ |
45,609
|
$ |
45,715
|
$ |
45,342
|
| Property
expenses |
|
15,213
|
|
13,296
|
|
14,343
|
|
14,392
|
|
14,371
|
| Same
Store NOI - GAAP Basis |
$ |
31,717
|
$ |
32,776
|
$ |
31,266
|
$ |
31,323
|
$ |
30,971
|
| Early
termination revenue |
|
23
|
|
6
|
|
75
|
|
124
|
|
160
|
| Same
Store NOI - GAAP Basis excluding early termination revenue |
$ |
31,694
|
$ |
32,770
|
$ |
31,191
|
$ |
31,199
|
$ |
30,811
|
| Same
Store NOI - Cash Basis |
|
|
|
|
|
|
|
|
|
|
| Same
Store Adjustments: |
|
|
|
|
|
|
|
|
|
|
| Straight
line rent and above (below) market lease |
|
136
|
|
411
|
|
550
|
|
1,184
|
|
1,314
|
| Same
Store NOI - Cash Basis |
$ |
31,581
|
$ |
32,365
|
$ |
30,716
|
$ |
30,139
|
$ |
29,657
|
| Early
termination revenue |
|
23
|
|
6
|
|
75
|
|
124
|
|
160
|
| Same
Store NOI - Cash Basis excluding early termination revenue |
$ |
31,558
|
$ |
32,359
|
$ |
30,641
|
$ |
30,015
|
$ |
29,497
|
| Same
store occupancy at period end |
|
98.3% |
|
98.1% |
|
97.7% |
|
98.2% |
|
98.3% |
| Percentage
of total portfolio square footage |
|
91.8% |
|
91.8% |
|
91.5% |
|
91.3% |
|
91.3% |
| Same
Store NOI - GAAP Basis percent change1 |
|
2.9% |
|
|
|
|
|
|
|
| Same
Store NOI - Cash Basis percent change1 |
|
7.0% |
|
|
|
|
|
|
|
| 1 | Represents the year-over-year change between the three
months ended March 31, 2024 and three months ended March 31, 2023. |
1Q 2024 Supplemental | 14
Debt Summary
As of March 31, 2024
Unaudited ($ in thousands, except per-share amounts)
| |
Maturity Date |
Interest Rate |
Commitment |
Principal Balance |
| Unsecured Debt: |
|
|
|
|
| KeyBank Line of Credit |
August-25 |
6.51%1,2 |
$ 350,000 |
$ 155,400 |
| $100m KeyBank Term Loan |
August-26 |
3.00%1,2 |
100,000 |
100,000 |
| $200m KeyBank Term Loan |
February-27 |
3.03%1,2 |
200,000 |
200,000 |
| $150m KeyBank Term Loan |
May-27 |
4.40%1,2 |
150,000 |
150,000 |
| Total / Weighted Average Unsecured Debt |
|
4.26% ` |
$ 800,000 |
$ 605,400 |
| |
|
|
|
|
| |
Maturity Date |
Interest Rate |
# of Buildings |
Principal Balance |
| Secured Debt: |
|
|
|
|
| Ohio National Life Mortgage3 |
August-24 |
4.14% |
6 |
$ 18,245 |
| Allianz Loan |
April-26 |
4.07% |
22 |
60,971 |
| Nationwide Loan |
October-27 |
2.97% |
2 |
14,870 |
| Lincoln Life Gateway Mortgage3 |
January-28 |
3.43% |
2 |
28,800 |
| Minnesota Life Memphis Industrial Loan3 |
January-28 |
3.15% |
28 |
54,666 |
| Midland National Life Insurance Mortgage3 |
March-28 |
3.50% |
1 |
10,612 |
| Minnesota Life Loan |
May-28 |
3.78% |
7 |
19,454 |
| Transamerica Loan |
August-28 |
4.35% |
15 |
59,041 |
| Total / Weighted Average Secured Debt |
|
3.77% |
83 |
$ 266,659 |
| Total / Weighted Average Debt |
|
4.11% |
|
$ 872,059 |
| 1 | For the month of March 2024, the one-month term SOFR for our unsecured debt was 5.323% and the one-month
term SOFR for our borrowings under line of credit was at a weighted average of 5.327%. The spread over the applicable rate for the $100m,
$150m, and $200m KeyBank Term Loans and KeyBank unsecured line of credit is based on the Company’s total leverage ratio plus the
0.1% SOFR index adjustment. |
| 2 | The one-month term SOFR for the $100m, $150m and $200m KeyBank Term Loans was swapped to a fixed rate
of 1.504%, 2.904%, and 1.527%, respectively. The $100 million of the outstanding borrowings under the KeyBank unsecured line of credit
was swapped to a fixed USD-SOFR rate at a weighted average of 4.754%. |
| 3 | Debt assumed at acquisition. |
1Q 2024 Supplemental | 15
Capitalization
As of March 31, 2024
Unaudited ($ in thousands, except per-share amounts)
| Net Debt: |
March 31,2024 |
December 31, 2023 |
September 30, 2023 |
June 30, 2023 |
March 31, 2023 |
| |
|
|
|
|
|
|
|
|
| Total Debt1 |
$ |
872,059 |
$ |
873,364 |
$ |
893,877 |
$ |
925,033 |
$ |
926,959 |
| Less: Cash |
|
27,237 |
|
26,204 |
|
30,272 |
|
38,517 |
|
38,432 |
| Net Debt |
$ |
844,822 |
$ |
847,160 |
$ |
863,605 |
$ |
886,516 |
$ |
888,527 |
| Common Shares and Units Outstanding2 |
|
45,872 |
|
45,740 |
|
45,740 |
|
43,591 |
|
43,521 |
| Closing Price (as of period end) |
$ |
22.50 |
$ |
24.07 |
$ |
20.95 |
$ |
23.02 |
$ |
21.01 |
| Market Value of Common Shares3 |
$ |
1,032,120 |
$ |
1,100,962 |
$ |
958,253 |
$ |
1,003,465 |
$ |
914,376 |
| Preferred Stock - Series A (at liquidation preference)4 |
|
- |
|
- |
|
- |
|
48,845 |
|
48,845 |
| Total Market Capitalization3,5 |
$ |
1,904,179 |
$ |
1,974,326 |
$ |
1,852,130 |
$ |
1,977,343 |
$ |
1,890,180 |
| Dividend / Share (annualized) |
$ |
0.96 |
$ |
0.90 |
$ |
0.90 |
$ |
0.90 |
$ |
0.90 |
| Dividend Yield (annualized) |
|
4.3% |
|
3.7% |
|
4.3% |
|
3.9% |
|
4.3% |
| Total Debt-to-Total Market Capitalization |
|
45.8% |
|
44.2% |
|
48.3% |
|
46.8% |
|
49.0% |
| Secured Debt as a % of Total Debt |
|
30.6% |
|
30.7% |
|
42.4% |
|
41.9% |
|
42.0% |
| Unsecured Debt as a % of Total Debt |
|
69.4% |
|
69.3% |
|
57.6% |
|
58.1% |
|
58.0% |
| Net Debt-to-Annualized Adjusted EBITDA (quarter annualized) |
|
6.7x |
|
6.5x |
|
6.7x |
|
7.1x |
|
7.1x |
| Net Debt plus Preferred-to-Annualized Adjusted EBITDA (quarter annualized) |
|
6.7x |
|
6.5x |
|
6.7x |
|
7.4x |
|
7.5x |
| Weighted Average Maturity of Total Debt (years) |
|
2.7 |
|
3.0 |
|
3.0 |
|
3.2 |
|
3.4 |
| Capital Markets Activity |
| Common Shares |
Avg. Price |
Offering |
Period |
Net Proceeds |
| - |
$ - |
N/A |
Q1 2024 |
$ - |
| 1 | Total Debt is not adjusted for the amortization of debt issuance costs or fair market premiums or discounts.
|
| 2 | Common shares and units outstanding include 490 units outstanding at the end of each of the quarters
presented. |
| 3 | Based on closing price as of last trading day of the quarter and common shares and units as of the period
ended. |
| 4 | On September 6, 2023 ("Redemption Date"), the Company redeemed all outstanding Series A Preferred
Stock in cash at a redemption price equal to $25.00 per share. As of the Redemption Date and through March 31, 2024, the shares of Series
A Preferred Stock were no longer outstanding. |
| 5 | Market value of shares and units plus total debt and preferred stock as of period end. |
1Q 2024 Supplemental | 16
Net Asset Value Components
As of March 31, 2024
Unaudited ($ in thousands)
| Net Operating Income |
| Three Months Ended March 31, 2024 |
| Pro Forma Net Operating Income (NOI) |
|
|
| Total Operating NOI |
$ |
33,548 |
| Pro Forma Effect of New Lease Activity1 |
|
690 |
| Pro Forma Effect of Acquisitions2 |
|
- |
| Pro Forma Effect of Repositioning / Development3 |
|
1,586 |
| Pro Forma NOI |
$ |
35,824 |
| Amortization of above / below market lease intangibles, net |
|
(318) |
| Straight-line rental revenue adjustment |
|
(15) |
| Pro Forma Cash NOI |
$ |
35,491 |
| Developable Land |
| Market |
Owned
Land
(acres)4 |
Developable
GLA
(SF)4 |
Under Construction
(SF)5 |
Est. Investment /
Est. Completion |
Under Development (SF)5 |
| Atlanta |
9 |
200,000 |
|
|
|
| Chicago |
11 |
220,000 |
|
|
|
| Cincinnati |
18 |
285,308 |
|
|
285,308 |
| Jacksonville |
12 |
95,587 |
52,920 |
$7.4M/Q4-’24 |
42,667 |
| Memphis |
23 |
475,000 |
|
|
|
| St. Louis |
31 |
300,000 |
|
|
|
| Charlotte |
6 |
100,000 |
|
|
|
| |
110 |
1,675,895 |
52,920 |
|
327,975 |
| Other Assets and Liabilities |
| Three Months Ended March 31, 2024 |
| Cash, cash held in escrow and restricted cash |
$ |
27,237 |
| Other assets |
$ |
39,670 |
| CIP |
$ |
7,630 |
| Accounts payable, accrued expenses and other liabilities |
$ |
68,049 |
| Debt and Common Stock |
| Three Months Ended March 31, 2024 |
| |
|
|
| Secured Debt |
$ |
266,659 |
| Unsecured Debt |
$ |
605,400 |
| Common shares and units outstanding6 |
|
45,872 |
Note: We have made a number of assumptions with respect to the pro
forma effects and there can be no assurance that we would have generated the projected levels of NOI had we actually owned the acquired
properties and / or fully stabilized the repositioning / development properties as of the beginning of the period. Refer to Glossary in
this Supplemental Information for a definition and discussion of non-GAAP financial measures.
| 1 | Represents the estimated incremental base rents from uncommenced new leases as if rent commencement had
occurred as of the beginning of the period. |
| 2 | Represents the estimated impact of acquisitions as if they had been acquired at the beginning of the
period. |
| 3 | Represents the estimated impact of properties that are undergoing repositioning or lease-up and development
properties placed in-service as if the properties were stabilized and rents had commenced as of the beginning of the period. |
| 4 | Developable land represents acreage currently owned by us and identified for potential development. The
developable gross leasable area (GLA) is based on the developable land area and a land to building ratio. Developable land and GLA are
estimated and can change periodically due to changes in site design, road and storm water requirements, parking requirements and other
factors. We have made a number of assumptions in such estimates and there can be no assurance that we will develop land that we own. |
| 5 | Under construction represents projects for which vertical construction has commenced. Under development
represents projects in the pre-construction phase. |
| 6 | Common shares and units outstanding were 45,382 and 490 as of March 31, 2024 respectively. |
1Q 2024 Supplemental | 17
Rentable Square Feet and Annualized Base Rent by Market
As of March 31, 2024
Unaudited ($ in thousands)
| |
# of
Properties |
# of
Buildings |
Occupancy |
Total Rentable
Square Feet |
% Rentable
Square Feet |
ABR2 |
% ABR |
| Primary Markets1 |
|
|
|
|
|
|
|
|
| Atlanta |
11 |
13 |
99.9% |
2,086,835 |
6.1% |
$ |
9,833 |
6.5% |
| Chicago |
39 |
40 |
94.8% |
6,624,335 |
19.4% |
|
29,277 |
19.4% |
| Primary Markets Total |
50 |
53 |
96.1% |
8,711,170 |
25.5% |
$ |
39,110 |
25.9% |
| Secondary Markets1 |
|
|
|
|
|
|
|
|
| Boston |
1 |
2 |
100.0% |
268,713 |
0.8% |
$ |
2,146 |
1.4% |
| Charlotte |
1 |
1 |
100.0% |
155,220 |
0.5% |
|
1,229 |
0.8% |
| Cincinnati |
10 |
12 |
94.9% |
2,710,964 |
8.0% |
|
11,077 |
7.3% |
| Cleveland |
16 |
19 |
98.5% |
3,979,209 |
11.7% |
|
18,628 |
12.3% |
| Columbus |
15 |
15 |
100.0% |
3,757,614 |
11.0% |
|
13,737 |
9.1% |
| Indianapolis |
17 |
17 |
95.6% |
4,085,169 |
12.0% |
|
15,228 |
10.1% |
| Jacksonville |
8 |
28 |
99.6% |
2,132,396 |
6.3% |
|
16,227 |
10.7% |
| Kansas City |
1 |
1 |
69.1% |
221,911 |
0.7% |
|
558 |
0.4% |
| Memphis |
25 |
49 |
97.9% |
4,783,046 |
14.0% |
|
18,645 |
12.3% |
| St. Louis |
12 |
14 |
95.0% |
3,219,689 |
9.5% |
|
14,639 |
9.7% |
| Secondary Markets Total |
106 |
158 |
97.2% |
25,313,931 |
75.5% |
$ |
112,114 |
74.1% |
| Total |
156 |
211 |
96.9% |
34,025,101 |
100.0% |
$ |
151,224 |
100.0% |
| 1 | Primary markets means the following two metropolitan areas in the U.S., each generally consisting of
more than 300 million square feet of industrial space: Chicago and Atlanta. Secondary markets means non-primary markets, each generally
consisting of between 100 million and 300 million square feet of industrial space, including the following metropolitan areas in the U.S.:
Boston, Charlotte, Cincinnati, Cleveland, Columbus, Indianapolis, Jacksonville, Kansas City, Memphis, Milwaukee, South Florida, and St.
Louis. Our definitions of primary and secondary markets may vary from the definitions of these terms used by investors, analysts, or other
industrial REITs. |
| 2 | Annualized base rent is calculated as monthly contracted base rent as of March 31, 2024, multiplied by
12. Excludes rent abatements. |
1Q 2024 Supplemental | 18
 |
|
Operational &
Portfolio
Information
|
1Q 2024 Supplemental | 19
Leasing Activity
As of March 31, 2024
Unaudited
| Lease Renewals and New Leases |
| Year |
Type |
Square Footage |
Percent |
Expiring Rent |
New Rent |
% Change |
Tenant
Improvements1 |
Lease
Commissions1 |
| 2020 |
Renewals |
1,881,346 |
71.1% |
$ |
3.75 |
$ |
3.93 |
4.8% |
$ |
0.13 |
$ |
0.08 |
| |
New Leases |
764,314 |
28.9% |
$ |
4.31 |
$ |
5.07 |
17.6% |
$ |
0.24 |
$ |
0.19 |
| |
Total |
2,645,660 |
100.0% |
$ |
3.92 |
$ |
4.26 |
8.7% |
$ |
0.16 |
$ |
0.11 |
| 2021 |
Renewals |
2,487,589 |
49.3% |
$ |
4.25 |
$ |
4.50 |
5.9% |
$ |
0.19 |
$ |
0.10 |
| |
New Leases |
2,557,312 |
50.7% |
$ |
3.76 |
$ |
4.40 |
17.0% |
$ |
0.23 |
$ |
0.22 |
| |
Total |
5,044,901 |
100.0% |
$ |
4.00 |
$ |
4.45 |
11.1% |
$ |
0.21 |
$ |
0.16 |
| 2022 |
Renewals |
4,602,355 |
60.2% |
$ |
4.31 |
$ |
4.87 |
13.1% |
$ |
0.15 |
$ |
0.16 |
| |
New Leases |
3,041,526 |
39.8% |
$ |
3.51 |
$ |
4.51 |
28.6% |
$ |
0.40 |
$ |
0.23 |
| |
Total |
7,643,881 |
100.0% |
$ |
3.99 |
$ |
4.73 |
18.5% |
$ |
0.25 |
$ |
0.19 |
| 2023 |
Renewals |
3,945,024 |
70.4% |
$ |
3.75 |
$ |
4.36 |
16.3% |
$ |
0.14 |
$ |
0.15 |
| |
New Leases |
1,654,919 |
29.6% |
$ |
3.82 |
$ |
5.03 |
31.7% |
$ |
0.35 |
$ |
0.35 |
| |
Total |
5,599,943 |
100.0% |
$ |
3.77 |
$ |
4.56 |
21.0% |
$ |
0.21 |
$ |
0.21 |
| Q1 2024 |
Renewals |
928,217 |
66.9% |
$ |
4.71 |
$ |
4.99 |
5.9% |
$ |
0.17 |
$ |
0.12 |
| |
New Leases |
459,760 |
33.1% |
$ |
3.41 |
$ |
5.06 |
48.4% |
$ |
0.12 |
$ |
0.20 |
| |
Total |
1,387,977 |
100.0% |
$ |
4.28 |
$ |
5.01 |
17.1% |
$ |
0.15 |
$ |
0.14 |
Note: Lease renewals and new lease activity excludes leases with terms
less than six months, and leases associated with construction.
| 1 | Shown as per dollar, per square foot, per year. |
1Q 2024 Supplemental | 20
Leasing Activity (continued)
As of March 31, 2024
Unaudited
| Lease Expiration Schedule |
| Year |
Square
Footage |
ABR1 |
% of ABR
Expiring2 |
| Available |
1,061,525 |
$ |
- |
- |
| 2024 |
2,643,167 |
|
12,101,668 |
8.0% |
| 2025 |
7,766,714 |
|
33,999,980 |
22.5% |
| 2026 |
5,927,934 |
|
28,203,681 |
18.7% |
| 2027 |
4,493,284 |
|
21,396,180 |
14.1% |
| 2028 |
4,150,735 |
|
19,319,026 |
12.8% |
| Thereafter |
7,981,742 |
|
36,203,077 |
23.9% |
| Total |
34,025,101 |
$ |
151,223,612 |
100.0% |
% of Annual Base Rent Expiring2
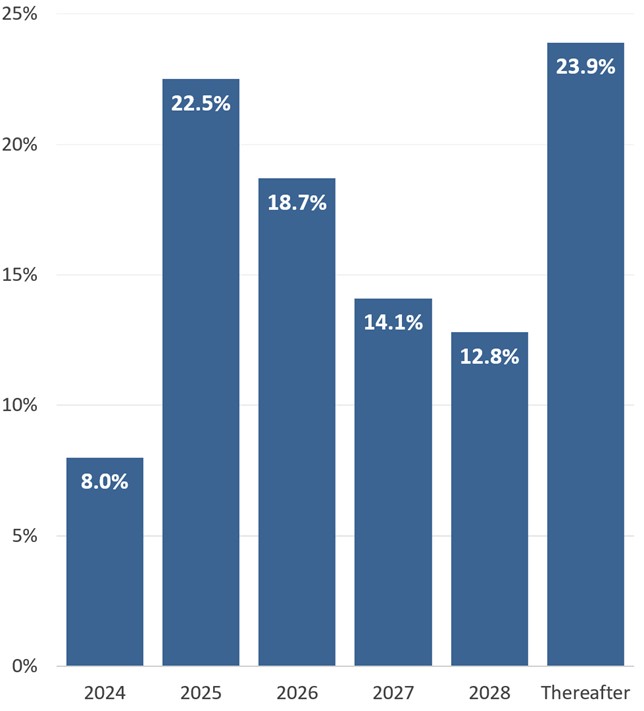
| 1 | Annualized base rent is calculated as monthly contracted base rent as of March 31, 2024, multiplied by
12. Excludes rent abatements. |
| 2 | Calculated as annualized base rent set forth in this table divided by total annualized base rent as of
March 31, 2024. |
1Q 2024 Supplemental | 21
Leased Square Feet and Annualized Base Rent by Tenant Industry
As of March 31, 2024
Unaudited
| Industry |
Total Leased
Square Feet |
# of
Leases |
% Rentable
Square Feet |
ABR1 |
% ABR |
ABR Per
Square Foot |
| Logistics & Transportation |
9,780,990 |
84 |
29.7% |
$ |
40,761,535 |
27.0% |
$ |
$ 4.17 |
| Wholesale/Retail |
2,397,143 |
28 |
7.3% |
|
11,939,672 |
7.9% |
|
4.98 |
| Automotive |
2,258,860 |
26 |
6.9% |
|
10,573,834 |
7.0% |
|
4.68 |
| Printing & Paper |
1,942,978 |
16 |
5.9% |
|
7,436,389 |
4.9% |
|
3.83 |
| Home & Garden |
1,914,586 |
18 |
5.8% |
|
6,585,525 |
4.4% |
|
3.44 |
| Construction |
1,527,936 |
41 |
4.6% |
|
7,293,813 |
4.8% |
|
4.77 |
| Cardboard and Packaging |
1,294,442 |
17 |
3.9% |
|
5,689,437 |
3.8% |
|
4.40 |
| Food & Beverage |
1,663,050 |
24 |
5.0% |
|
8,675,750 |
5.7% |
|
5.22 |
| Light Manufacturing |
1,227,572 |
11 |
3.7% |
|
4,445,727 |
2.9% |
|
3.62 |
| Healthcare |
1,024,416 |
39 |
3.1% |
|
6,234,416 |
4.1% |
|
6.09 |
| Plastics |
955,728 |
13 |
2.9% |
|
4,578,064 |
3.0% |
|
4.79 |
| Education |
925,840 |
8 |
2.8% |
|
4,515,840 |
3.0% |
|
4.88 |
| Industrial Equipment Components |
852,039 |
24 |
2.6% |
|
4,140,649 |
2.7% |
|
4.86 |
| Other Industries2 |
5,197,996 |
154 |
15.8% |
|
28,352,961 |
18.8% |
|
5.45 |
| Total |
32,963,576 |
503 |
100.0% |
$ |
151,223,612 |
100.0% |
$ |
4.59 |
| 1 | Annualized base rent is calculated as monthly contracted base rent as of March 31, 2024, multiplied by
12. Excludes rent abatements. |
| 2 | Includes over 20 tenant industries for which the total leased square feet aggregates to less than 250,000
square feet or 3% of ABR. |
1Q 2024 Supplemental | 22
Leased Square Feet and Annualized Base Rent by Type
As of March 31, 2024
Unaudited
| Leased Square Feet and Annualized Base Rent by Lease Type |
| Lease Type |
Total Leased
Square Feet |
# of
Leases |
% Leased
Square Feet |
Annualized Base Rent1 |
% ABR |
ABR Per
Square Foot |
| Triple Net |
27,247,340 |
397 |
82.7% |
$ |
121,805,248 |
80.5% |
$ |
4.47 |
| Modified Net |
3,694,231 |
62 |
11.2% |
|
19,017,017 |
12.6% |
|
5.15 |
| Gross |
2,022,005 |
44 |
6.1% |
|
10,401,347 |
6.9% |
|
5.14 |
| Total |
32,963,576 |
503 |
100.0% |
$ |
151,223,612 |
100.0% |
$ |
4.59 |
| Leased Square Feet and Annualized Base Rent by Tenant Type |
| Tenant Type |
Total Leased
Square Feet |
# of
Leases |
% Leased
Square Feet |
Annualized Base Rent1 |
% ABR |
ABR Per
Square Foot |
| Multi-Tenant |
16,426,039 |
398 |
49.8% |
$ |
82,047,826 |
54.3% |
$ |
4.99 |
| Single-Tenant |
16,537,537 |
105 |
50.2% |
|
69,175,786 |
45.7% |
|
4.18 |
| Total |
32,963,576 |
503 |
100.0% |
$ |
151,223,612 |
100.0% |
$ |
4.59 |
| Leased Square Feet and Annualized Base Rent by Building Type |
| Building Type |
Total Leased
Square Feet |
# of
Buildings |
% Leased
Square Feet |
Annualized Base Rent1 |
% ABR |
ABR Per
Square Foot |
| Warehouse/Distribution |
21,228,496 |
118 |
64.4% |
$ |
85,703,511 |
56.7% |
$ |
4.04 |
| Warehouse/Light Manufacturing |
8,349,976 |
41 |
25.3% |
|
39,190,300 |
25.9% |
|
4.69 |
| Small Bay Industrial2 |
3,385,104 |
52 |
10.3% |
|
26,329,801 |
17.4% |
|
7.78 |
| Total |
32,963,576 |
211 |
100.0% |
$ |
151,223,612 |
100.0% |
|
4.59 |
| 1 | Annualized base rent is calculated as monthly contracted base rent as of March 31, 2024, multiplied by
12. Excludes rent abatements. |
| 2 | Small bay industrial is inclusive of flex space totaling 606,799 leased square feet and annualized base
rent of $6,988,186. Small bay industrial is multipurpose space; flex space includes office space that accounts for greater than 50% of
the total rentable area. |
1Q 2024 Supplemental | 23
Top 10 Tenants by Annualized Base Rent
As of March 31, 2024
Unaudited
| Tenant |
Market |
Industry |
# of Leases |
Total Leased Square Feet |
Expiration |
ABR Per
Square Foot |
Annualized Base Rent1 |
% Total
ABR |
| FedEx Supply Chain, Inc. |
St. Louis |
Logistics & Transportation |
1 |
769,500 |
7/31/24 |
$ |
4.60 |
$ |
3,539,875 |
2.3% |
| Geodis Logistics, LLC |
St. Louis |
Logistics & Transportation |
1 |
624,159 |
8/31/25 |
|
4.36 |
|
2,718,993 |
1.8% |
| Royal Canin U.S.A, Inc. |
St. Louis |
Wholesale/Retail |
1 |
521,171 |
12/31/25 |
|
4.89 |
|
2,549,829 |
1.7% |
| Houghton Mifflin Harcourt Company |
Chicago |
Education |
1 |
513,512 |
3/31/26 |
|
4.56 |
|
2,341,615 |
1.5% |
| ODW Logistics, Inc. |
Columbus |
Logistics & Transportation |
1 |
772,450 |
6/30/25 |
|
2.99 |
|
2,312,163 |
1.5% |
| Archway Marketing Holdings, Inc. |
Chicago |
Logistics & Transportation |
3 |
503,000 |
3/31/26 |
|
4.51 |
|
2,268,180 |
1.5% |
| ASW Supply Chain Services, LLC |
Cleveland |
Logistics & Transportation |
5 |
577,237 |
11/30/27 |
|
3.65 |
|
2,104,932 |
1.4% |
| Balta US, Inc. |
Jacksonville |
Home & Garden |
2 |
629,084 |
10/31/29 |
|
3.16 |
|
1,988,036 |
1.3% |
| Communications Test Design, Inc. |
Memphis |
Logistics & Transportation |
2 |
566,281 |
12/31/24 |
|
3.41 |
|
1,930,826 |
1.3% |
| Winston Products, LLC |
Cleveland |
Wholesale/Retail |
2 |
266,803 |
4/30/32 |
|
6.94 |
|
1,852,295 |
1.2% |
| Total Largest Tenants by Annualized Rent |
19 |
5,743,197 |
|
$ |
4.11 |
$ |
23,606,744 |
15.5% |
| All Other Tenants |
484 |
27,220,379 |
|
$ |
4.69 |
$ |
127,616,868 |
84.5% |
| Total Company Portfolio |
503 |
32,963,576 |
|
$ |
4.59 |
$ |
151,223,612 |
100.0% |
| 1 | Annualized base rent is calculated as monthly contracted base rent as of March 31, 2024, multiplied by
12. Excludes rent abatements. |
1Q 2024 Supplemental | 24
Lease Segmentation by Size
As of March 31, 2024
Unaudited
| Square Feet |
# of Leases |
Total Leased
Square Feet |
Total Rentable Square Feet |
Total
Leased % |
Total Leased % Excluding Repositioning1 |
Annualized Base Rent2 |
In-Place + Uncommenced
ABR3 |
% of Total
In-Place + Uncommenced
ABR |
In-Place + Uncommenced
ABR Per SF4 |
| < 4,999 |
60 |
171,905 |
234,511 |
73.3% |
75.2% |
$ |
1,701,656 |
$ |
1,701,656 |
1.1% |
$ 9.90 |
| 5,000 - 9,999 |
71 |
500,626 |
592,362 |
84.5% |
85.3% |
|
4,451,389 |
|
4,591,349 |
3.0% |
8.92 |
| 10,000 - 24,999 |
111 |
1,891,624 |
1,942,255 |
97.4% |
97.4% |
|
14,185,137 |
|
14,185,137 |
9.3% |
7.50 |
| 25,000 - 49,999 |
90 |
3,192,194 |
3,301,311 |
96.7% |
96.7% |
|
18,829,017 |
|
18,829,017 |
12.4% |
5.90 |
| 50,000 - 99,999 |
79 |
5,535,583 |
5,711,472 |
96.9% |
98.0% |
|
25,669,202 |
|
26,039,650 |
17.2% |
4.66 |
| 100,000 - 249,999 |
63 |
10,268,208 |
10,525,772 |
97.6% |
98.9% |
|
44,633,924 |
|
44,633,924 |
29.4% |
4.35 |
| > 250,000 |
29 |
11,403,436 |
11,717,418 |
97.3% |
100.0% |
|
41,753,287 |
|
41,753,287 |
27.6% |
3.66 |
| Total/Weighted Avg. |
503 |
32,963,576 |
34,025,101 |
96.9% |
98.4% |
$ |
151,223,612 |
$ |
151,734,020 |
100.0% |
$ 4.59 |
| 1 | Total Leased % Excluding Repositioning excludes vacant square footage being refurbished or repositioned. |
| 2 | Annualized base rent is calculated as monthly contracted base rent as of March 31, 2024, multiplied by
12. Excludes rent abatements. |
| 3 | In-Place + Uncommenced ABR calculated as in-place current annualized base rent as of March 31, 2024 plus
annualized base rent for leases signed but not commenced as of March 31, 2024. |
| 4 | In-Place + Uncommenced ABR per SF is calculated as in-place current rent annualized base rent as of March
31, 2024 plus annualized base rent for leases signed but not commenced as of March 31, 2024, divided by leased square feet plus uncommenced
leased square feet. |
1Q 2024 Supplemental | 25
Capital Expenditures
Unaudited ($ in thousands)
| |
March 31, 2024 |
December 31, 2023 |
September 30, 2023 |
June 30, 2023 |
March 31, 2023 |
| Tenant improvements |
$ |
320 |
$ |
375 |
$ |
290 |
$ |
361 |
$ |
425 |
| Lease commissions |
$ |
674 |
$ |
505 |
$ |
1,675 |
$ |
731 |
$ |
1,381 |
| Total Recurring Capital Expenditures |
$ |
994 |
$ |
880 |
$ |
1,965 |
$ |
1,092 |
$ |
1,806 |
| Capital expenditures |
$ |
664 |
$ |
5,074 |
$ |
5,638 |
$ |
4,217 |
$ |
2,593 |
| Development |
$ |
2,336 |
$ |
1,107 |
$ |
2,494 |
$ |
3,423 |
$ |
5,820 |
| Total Non-recurring Capital Expenditures |
$ |
3,000 |
$ |
6,181 |
$ |
8,132 |
$ |
7,640 |
$ |
8,413 |
| Total Capital Expenditures |
$ |
3,994 |
$ |
7,061 |
$ |
10,097 |
$ |
8,732 |
$ |
10,219 |
1Q 2024 Supplemental | 26
 |
|
Appendix
|
1Q 2024 Supplemental | 27
Glossary
This glossary contains additional details for sections throughout
this Supplemental Information, including explanations and reconciliations of certain non-GAAP financial measures, and the reasons why
we use these supplemental measures of performance and believe they provide useful information to investors. Additional detail can be found
in our most recent annual report on Form 10-K and subsequent quarterly reports on Form 10-Q, as well as other documents filed with or
furnished to the SEC from time to time.
Non-GAAP Financial Measures Definitions:
Net Operating Income (NOI): We
consider net operating income, or NOI, to be an appropriate supplemental measure to net income in that it helps both investors and management
understand the core operations of our properties. We define NOI as total revenue (including rental revenue and tenant reimbursements)
less property-level operating expenses. NOI excludes depreciation and amortization, general and administrative expenses, impairments,
gain/loss on sale of real estate, interest expense, and other non-operating items.
Cash Net Operating Income - (Cash NOI): We
define Cash NOI as NOI excluding straight-line rent adjustments and amortization of above and below market leases.
EBITDAre and Adjusted EBITDA: We
define earnings before interest, taxes, depreciation and amortization for real estate in accordance with the standards established by
the National Association of Real Estate Investment Trusts (“NAREIT”). EBITDAre represents net income (loss), computed in accordance
with GAAP, before interest expense, tax, depreciation and amortization, gains or losses on the sale of rental property, appreciation/(depreciation)
of warrants, loss on impairments, and loss on extinguishment of debt. We calculate Adjusted EBITDA by adding or subtracting from EBITDAre
the following items: (i) non-cash stock compensation, (ii) loss on extinguishment of debt, (iii) acquisition expenses (iv) the proforma
impacts of acquisition, dispositions and developments and (v) non-cash impairments on real estate lease. We believe that EBITDAre and
Adjusted EBITDA are helpful to investors as supplemental measures of our operating performance as a real estate company as they are direct
measures of the actual operating results of our industrial properties. EBITDAre and Adjusted EBITDA should not be used as measures of
our liquidity and may not be comparable to how other REITs' calculate EBITDAre and Adjusted EBITDA.
Funds From Operations ("FFO"): Funds
from operations, or FFO, is a non-GAAP financial measure that is widely recognized as a measure of an REIT’s operating performance,
thereby, providing investors the potential to compare our operating performance with that of other REITs. We consider FFO to be an appropriate
supplemental measure of our operating performance as it is based on a net income analysis of property portfolio performance that excludes
non-cash items such as depreciation. The historical accounting convention used for real estate assets requires straight-line depreciation
of buildings and improvements, which implies that the value of real estate assets diminishes predictably over time. Since real estate
values rise and fall with market conditions, presentations of operating results for a REIT, using historical accounting for depreciation,
could be less informative. In December 2018, NAREIT issued a white paper restating the definition of FFO. The purpose of the restatement
was not to change the fundamental definition of FFO, but to clarify existing NAREIT guidance. The restated definition of FFO is as follows:
Net Income (calculated in accordance with GAAP), excluding: (i) Depreciation and amortization related to real estate, (ii) Gains and
losses from the sale of certain real estate assets, (iii) Gain and losses from change in control, and (iv) Impairment write-downs of
certain real estate assets and investments in entities when the impairment is directly attributable to decreases in the value of depreciable
real estate held by the entity. We define FFO, consistent with the NAREIT definition. Adjustments for unconsolidated partnerships and
joint ventures will be calculated to reflect FFO on the same basis. Other equity REITs may not calculate FFO as we do, and, accordingly,
our FFO may not be comparable to such other REITs’ FFO. FFO should not be used as a measure of our liquidity and is not indicative
of funds available for our cash needs, including our ability to pay dividends.
1Q 2024 Supplemental | 28
Glossary (continued)
Non-GAAP Financial Measures Definitions (continued):
Core Funds from Operations (“Core FFO”):
We calculate Core FFO by adjusting FFO for non-comparable items such as dividends paid (or declared)
to holders of our preferred stock, acquisition and transaction related expenses for transactions not completed, and certain non-cash operating
expenses such as impairment on real estate lease, appreciation/(depreciation) of warrants and loss on extinguishment of debt. We believe
that Core FFO is a useful supplemental measure in addition to FFO by adjusting for items that are not considered by us to be part of the
period over period operating performance of our property portfolio, thereby, providing a more meaningful and consistent comparison of
our operating and financial performance during the periods presented. As with FFO, our reported Core FFO may not be comparable to other
REITs’ Core FFO, should not be used as a measure of our liquidity, and is not indicative of our funds available for our cash needs,
including our ability to pay dividends.
Adjusted Funds from Operations attributable to
common stockholders (“AFFO”): Adjusted funds from operations, or AFFO, is presented in
addition to Core FFO. AFFO is defined as Core FFO, excluding certain non-cash operating revenues and expenses, capitalized interest and
recurring capitalized expenditures. Recurring capitalized expenditures include expenditures required to maintain and re-tenant our properties,
tenant improvements and leasing commissions. AFFO further adjusts Core FFOfor certain other non-cash items, including the amortization
or accretion of above or below market rents included in revenues, straight line rent adjustments, non-cash equity compensation and non-cash
interest expense.
We believe AFFO provides a useful supplemental measure of our
operating performance because it provides a consistent comparison of our operating performance across time periods that is comparable
for each type of real estate investment and is consistent with management's analysis of the operating performance of our properties. As
a result, we believe that the use of AFFO, together with the required GAAP presentations, provide a more complete understanding of our
operating performance.
As with Core FFO, our reported AFFO may not be comparable to
other REITs’ AFFO, should not be used as a measure of our liquidity, and is not indicative of our funds available for our cash needs,
including our ability to pay dividends.
Net Debt and Preferred Stock to Adjusted EBITDA:
Net debt and preferred stock to Adjusted EBITDA is a non-GAAP financial measure that we believe is
useful to investors as a supplemental measure in evaluating balance sheet leverage. Net debt and preferred stock is equal to the sum
of total consolidated and our pro rata share of unconsolidated joint venture debt less cash, cash equivalents, and restricted cash, plus
preferred stock calculated at its liquidation preference as of the end of the period.
1Q 2024 Supplemental | 29
Glossary (continued)
Other Definitions:
GAAP: U.S.
generally accepted accounting principles.
Lease Type: We
define our triple net leases in that the tenant is responsible for all aspects of and costs related to the property and its operation
during the lease term. We define our modified net leases in that the landlord is responsible for some property related expenses during
the lease term, but the cost of most of the expenses is passed through to the tenant. We define our gross leases in that the landlord
is responsible for all aspects of and costs related to the property and its operation during the lease term.
Non-Recurring Capital Expenditures: Non-recurring
capital expenditures include capital expenditures of long-lived improvements required to upgrade/replace existing systems or items that
previously did not exist. Non-recurring capital expenditures also include costs associated with repositioning a property, redevelopment/development
and capital improvements known at the time of acquisition.
Occupancy: We
define occupancy as the percentage of total leasable square footage as the earlier of lease term commencement or revenue recognition in
accordance to GAAP as of the close of the reporting period.
Recurring Capital Expenditures: Recurring
capitalized expenditures includes capital expenditures required to maintain and re-tenant our buildings, tenant improvements and leasing
commissions.
Replacement Cost: is
based on the Marshall & Swift valuation methodology for the determination of building costs. The Marshall & Swift building cost
data and analysis is widely recognized within the U.S. legal system and has been written into in law in over 30 U.S. states and recognized
in the U.S. Treasury Department Internal Revenue Service Publication. Replacement cost includes land reflected at the allocated cost in
accordance with Financial Accounting Standards Board ("FASB") ASC 805.
Same Store Portfolio: The
Same Store Portfolio is a subset of the consolidated portfolio and includes properties that are wholly owned by the Company as of December
31, 2022. The Same Store Portfolio is evaluated and defined on an annual basis based on the growth and size of the consolidated portfolio.
The Same Store Portfolio excludes properties that are classified as repositioning, lease-up during 2023 or 2024 (6 buildings representing
approximately 1,755,000 of rentable square feet placed into service during 2023 or 2024) or under contract for sale. For 2024, the Same
Store Portfolio consists of 146 properties aggregating 31.2 million rentable square feet. Properties that are being repositioned generally
are defined as those properties where a significant amount of space is held vacant in order to implement capital improvements that enhance
the functionality, rental cash flows, and value of that property. We define a significant amount of space at a property using both the
size of the space and its proportion to the properties total square footage as a determinate. Our computation of same store NOI may not
be comparable to other REITs.
Weighted Average Lease Term Remaining: The
average contractual lease term remaining as of the close of the reporting period (in years) weighted by square footage.
1Q 2024 Supplemental | 30
Exhibit 99.3
FIRST QUARTER 2024 PREPARED
COMMENTARY
MAY 1, 2024
This prepared commentary should be read in conjunction with the earnings press release,
quarterly supplemental financial information and the Form 10-Q. All this information can be found on our Investor Relations page at ir.plymouthreit.com.
Before we get into the relevant detail from each area of the company, we’d like
to call out some of the important takeaways from the quarter:
| · | The results were in line with our expectations for the quarter and consistent with the
full year forecast we provided on February 21, 2024. |
| · | SSNOI growth of 7.0% on a cash basis was consistent with our full year outlook. |
| · | We started the year with strong leasing results, have addressed 58% of our 2024 expirations,
and are on track for our expected mark-to-market of 18% to 20%. |
| · | The development program is now 93% leased with one space left to lease. |
| · | Net debt to Adjusted EBITDA increased sequentially from 6.5X at year end to 6.7X at
March 31 with the transitory uptick due to the effects of operating expense seasonality, coupled with the timing of recoveries and the
previously discussed sequential decline in occupancy in Q1. There was no incremental borrowing in the quarter. |
Golden Triangle and PLYM Market Commentary
We were pleased to see continued investment in the Golden Triangle region and adjacent
markets through reshoring, onshoring, and nearshoring. Just last week, Toyota announced a new $1.4 billion investment in its Princeton,
Indiana facility that raises its total investment in Indiana to $8 billion. This facility is located nearly equidistant between St. Louis
and Indianapolis. Toyota also has a $13.9 billion lithium-ion battery facility outside Greensboro, North Carolina slated to begin production
in 2025.
In an example of a nearshoring investment, Honda Motor made an announcement last week
that it plans to establish a “comprehensive electric vehicle value chain” in Ontario, Canada. Honda and its joint venture
partners are expected to invest approximately CAD$15 billion in this value chain. Honda Motor referenced their Honda EV Hub project in
Ohio and how that project is an important part of their value chain in North America.
For ease of research, we have included links to the Toyota and Honda announcements
below:
Toyota (April 25, 2024)
https://pressroom.toyota.com/toyota-charges-up-investment-and-jobs-in-u-s-manufacturing/
Honda (April 24, 2024)
https://global.honda/en/newsroom/news/2024/c240425deng.html?from=latest_area
Honda (April 12, 2024)
https://hondanews.com/en-US/honda-corporate/releases/release-c0e904130abdddafe05400397a01473d-honda-progress-in-establishment-of-ev-hub-in-ohio-will-lead-to-ev-production-in-north-america
The Honda investment is one of several we have previously referenced in Ohio, and
it is noted in our new market portrait for Columbus. During 2024, we intend to showcase individual PLYM markets. Columbus is our first
market report that we’ve prepared in conjunction with the team at Avison Young. You can find a copy of this report on our corporate
site at https://www.plymouthreit.com/columbus.
One of the highlights from the Columbus report is a snapshot of where some of our
Columbus properties are located in relation to key logistics infrastructure such as the railroads and John Glenn Columbus International
Airport and Rickenbacker International Airport.
There are two buildings in the Rickenbacker Submarket. 2626 Port Road is a rear load,
156,000- square-foot building which practically overlooks the Rickenbacker Airport. 3100 Creekside Parkway in Lockbourne also benefits
from close proximity to Rickenbacker as it is 3.2 miles north of the airport. New World Drive and Williams Road are less than 10 miles
from Norfolk Southern Rickenbacker Intermodal.
7001 Americana Parkway in Reynoldsburg measures 54,100 square feet and is the closest
building in the portfolio to the technology and data center developments on the northeast side of the market. This asset also is just
under 1.5 miles from the I-70 / Brice Road full interchange.
The second largest building in the portfolio, measures 527,100 square feet and is
located at 3500 Southwest Boulevard in Grove City next door to Walmart’s Regional DC and two doors down from FedEx Ground. This
building is also the closest to CSX Intermodal and UPS Hub at I-70 & I-270.
The four Lewis Center assets on the north side of the market have less proximity to
logistics infrastructure but benefit from proximity to affluent housing clusters and major corporate employment hubs and retail.
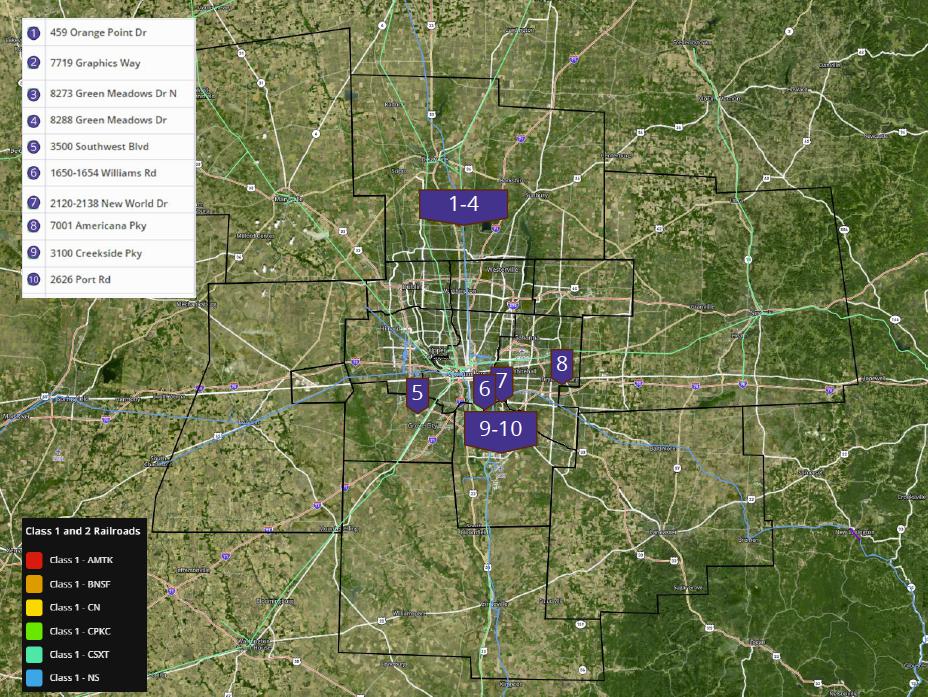
Source: Avison Young, US Industrial Group
The other five assets we own in the Columbus market total 1,191,536 square feet and
are located approximately one-hour from Columbus.
Development Program Update
We have one project left to deliver in the first phase of our development program.
This project is a 52,920-square-foot fully leased industrial building in Jacksonville that will deliver in Q4 of this year. With the signing
of a 54,008-square-foot lease at our project in Cincinnati, we are now 93% leased across the entire 772,622-square-foot program. We have
several RFPs out with tenants on the remaining 53,000 square feet available in Cincinnati.
The development program will ultimately represent a total investment of $68.5 million,
$61.1 million of which has been funded (see page 7 of the supplemental). The proforma stabilized cash NOI yields on the projects
under construction and completed range between 7% to 9%.
Leasing Update
Leasing activity at our properties remains strong, with nearly 1.4 million square
feet of leases commencing during Q1 at a rate 17.1% higher than expiring rents. These results are tempered by the large number of fixed
rate renewals that kicked in during the quarter. The leasing results for Q1 are broken down as follows for leases commencing during these
periods (calculated on a cash basis and excluding development program leases):
| o | 928,217 SF of renewal leases commenced at a 5.9% increase |
| o | 41.6% of these renewals were contractual, which are typically at a lower rental rate
increases and are frequently exercised earlier in the year |
| o | 459,760 SF of new leases commenced at a 48.4% increase |
| o | Blended increase of 17.1% |
As reported last quarter, we addressed over 45% of our 2024 lease rollover before
the year began. With additional activity performed through April 29, we now have addressed over 58% of the 2024 expirations.
Based on the blended rate of 16.5% achieved to date and the leases yet to expire,
we estimate the mark-to-market in the portfolio to be 18% to 20%. Again, our results so far are a bit tempered by the fixed rate renewals
(these contractual renewals show up in the early part of the year since they usually have a six-to-nine-month notification requirement).
There will be no further fixed rate renewals impacting 2024 rate increases. If you add in annual lease escalators that are now approximately
3% across the portfolio, we have a significant opportunity to drive organic growth through our leasing activities.
| · | Full year 2024 (executed through April 29, 2024) |
| o | 3,310,261 SF of renewal leases signed at a 13.1% increase |
| o | Renewal rate so far of 79.8% |
| o | 25.8% of these renewals were contractual |
| o | 838,583 SF of new leases signed at a 28.9% increase |
| o | Blended increase of 16.5% |
We continue to actively market our largest lease expiration in 2024, the 769,500-square-foot
single-tenant lease at our Class A industrial building in the Metro East submarket of St. Louis. Over the past several weeks we have been
working with two manufacturing groups and a leading logistics provider to potentially relocate their operations into our facility. As
they continue to work on their business plans over the next few weeks, we expect to refine our lease proposals to meet their requirements.
In addition to these activities, we are also aggressively marketing the property to users across the country. A marketing video of the
property can be found at the following link: https://walkthruit.com/3919-lakeview-drive/. As you can see, the building is located in an
attractive park with access to major interstates in the St. Louis area. We are confident we will be able to get this building leased given
its location and recent build. We have not updated any of the possible scenarios with this property that we previously outlined in our
Fourth Quarter 2023 Commentary. We refer investors to those comments.
Looking across the portfolio, there are no other tenants within our top 10 list scheduled
to expire during the year, but Communication Test Design, Inc does expire at the end of the year (see page 24 of the supplemental).
We have been in renewal negotiations with this tenant and expect to have this lease addressed shortly.
There are two known moveouts that we discussed on the Q3 call. These two expirations
were the drivers for the overall occupancy drop from Q4 2023 from 98.1% to 96.9% at the end of Q1 2024. The first is for 313,982 square
feet in Chicago which occurred at the end of 2023. We are actively marketing that space and the moveout is baked into guidance, but we
have several very good prospects looking at the space, including interest from another in-place tenant.
The second known move out, is located at 9150 Latty Avenue in St. Louis. We had previously
mentioned that we had agreed to terms with a new tenant for this 142,364-square-foot facility and continue to work through a longer tenant
deliberation as we progress toward execution.
Disposition Update
During the three months ended March 31, 2024, the tenant occupying an industrial property
located in Columbus, Ohio, provided notice of its intention to exercise the fixed purchase option stated within their lease. The lease
agreement requires the sale to close in August 2024 at a fixed price of approximately $21.5 million. In accordance with GAAP, we reclassified
the respective real estate property to net investment in sales-type lease totaling $21.5 million on our condensed consolidated balance
sheets, de-recognized the net book value of the property assets for $13.5 million and recognized a gain on sale of real estate of $8.0
million related to this transaction. For more detailed information on the accounting treatment for sales-type leases, please refer to
Footnote 4 of our Form 10-Q.
In addition to the exercise of the tenant purchase option noted above, there are a
handful of potential dispositions that we continue to evaluate over the next twelve months. These potential dispositions would serve as
accretive sources of capital to fund additional growth opportunities; we would estimate that these potential dispositions could generate
net proceeds of up to $50 million in 2024.
We now have better visibility on a number of acquisition opportunities that we are
evaluating in our existing markets in which we could realize accretive yields, capture incremental property management fees and drive
value creation. The size of these acquisitions range from $10 million for our traditional “singles and doubles” type takedowns
to $100 million for larger portfolios that contain a mix of single- and multi-tenant occupiers, generally less than 4 years of remaining
lease term, with above 85% occupancy and mark-to-market opportunities consistent with our portfolio averages.
Balance Sheet Update
Some of the balance sheet highlights as of March 31, 2024 are as follows (see pages
15-16 of the supplemental):
| · | Net debt to EBITDA of 6.7X |
| · | 69.4% of our total debt is unsecured |
| · | 93.7% of our debt is fixed, including with the use of interest rate swaps with a total
weighted average cost of 3.99% |
| · | $194.6 million of capacity on our unsecured credit facility |
| · | Our only debt maturity until August 2025 is a life company secured mortgage loan totaling
$18.2 million that matures in August 2024, which we plan to pay off through borrowings on the credit facility |
As previously discussed, we intend to stay in the 6X range in terms of net debt to
Adjusted EBITDA. We will fluctuate a bit this year based on seasonality – like we saw in the first quarter. We will be flexible
to go a little below where we were at year end 2023 to slightly above it to complete a transaction – assuming that we don’t
have disposition proceeds to help offset those borrowings as well. Our bias for 2025 is still to operate at the low end of the 6X range.
Discussion of First Quarter of 2024
The first quarter Core FFO was $0.45 per share driven by the elimination of preferred
stock dividends as a result of the redemption of the Series A Preferred Stock completed September 2023, sequential improvement in leasing
spreads within our same store portfolio, contributions from our phase 1 developments, namely Jacksonville and Atlanta, partially offset
by increases in operating expenses primarily due to increase real estate tax assessments and decline in occupancy during Q1 2024.
Same store NOI, excluding early termination fees, experienced a 7.0% increase on a
cash basis during the quarter which is consistent with the full year guidance. Same store performance reflects the sequential growth in
revenue from our new and renewal leasing in the portfolio supported by improved expense reimbursement as we convert expiring rollover
to triple-net lease structures.
G&A for the quarter was slightly lower than anticipated but consistent with Q1
2023 results.
Interest expense during the first quarter reflected the full quarterly net impact
of the AIG refinancing using the line of credit and the $100 million of interest rate swaps that were executed. As of March 31, 2024,
our only variable rate exposure is the $55.4 million of the $155.4 million outstanding balance on the line of credit that has not been
fixed via interest rate swaps.
Discussion of 2024 Guidance and Assumptions
For our FY 2024 outlook (see page 9 of the supplemental), absent the potential
impacts from the leasing surrounding the 769,500-square-foot building in St. Louis, we anticipate the quarterly cadence within Core FFO
to trend very similar to FY 2023, with Q1 being more muted as a result of weather-related impacts and the timing of professional fees,
then ramping up during the second half of the year as the balance of phase 1 developments stabilize, we execute on the reminder of 2024
lease expirations and experience improved flow through on tenant recoveries as a percentage of operating expenses. With 93.7% of our debt
fixed (inclusive of interest rate swaps) and only $18.2 million of 2024 debt maturities, we do not anticipate interest rate variability
to be notable.
Additionally, similar to what we’ve experienced in the second half of 2023,
we expect GAAP rent adjustments to remain subdued (meaning that there are less straight line rent adjustments included within Core FFO
to report and therefore to project in guidance or modeling) as market rent adjustments recorded upon prior acquisitions continue to burn
off, coupled with a decline in free rent concessions and other lease incentives during recent lease executions and negotiations. This
trend also means that NOI on a GAAP basis is now converging with NOI on a cash basis.
We affirmed our full year guidance range for Core FFO that we issued on February 21,
2024, and included the impacts of the aforementioned tenant exercise of its purchase option. The reconciliation of net income attributable
to common stockholders and unit holders per share to Core FFO guidance was updated to reflect the gain on sale of real estate associated
with the tenant purchase option.
Conclusion
Looking ahead to the balance of the year, we are focused on driving growth through
improved portfolio operations in the three areas we mentioned last quarter: SS NOI growth, stabilization of the development program, and
improvement in NOI margin.
Thank you for your continued interest and investment in Plymouth.
Jeff Witherell, Chairman and CEO
Forward-Looking Statements
This commentary includes “forward-looking
statements” that are made pursuant to the safe harbor provisions of Section 27A of the Securities Act of 1933 and of Section
21E of the Securities Exchange Act of 1934. The forward-looking statements in this release do not constitute guarantees of future performance.
Investors are cautioned that statements in this commentary, which are not strictly historical statements, including, without limitation,
statements regarding management's plans, objectives and strategies, constitute forward-looking statements. Such forward-looking statements
are subject to a number of known and unknown risks and uncertainties that could cause actual results to differ materially from those anticipated
by the forward-looking statement, many of which may be beyond our control, including, without limitation, those factors described under
the captions “Cautionary Note Regarding Forward-Looking Statements” and “Risk Factors” in the Company’s
Annual Report on Form 10-K and Quarterly Reports on Form 10-Q filed with the Securities and Exchange Commission. Forward-looking
statements generally can be identified by the use of forward-looking terminology such as “may,” “plan,” “seek,”
“will,” “expect,” “intend,” “estimate,” “anticipate,” “believe”
or “continue” or the negative thereof or variations thereon or similar terminology. Any forward-looking information presented
herein is made only as of the date of this commentary, and we do not undertake any obligation to update or revise any forward-looking
information to reflect changes in assumptions, the occurrence of unanticipated events, or otherwise.
v3.24.1.u1
Cover
|
May 01, 2024 |
| Document Type |
8-K
|
| Amendment Flag |
false
|
| Document Period End Date |
May 01, 2024
|
| Entity File Number |
001-38106
|
| Entity Registrant Name |
PLYMOUTH INDUSTRIAL REIT, INC.
|
| Entity Central Index Key |
0001515816
|
| Entity Tax Identification Number |
27-5466153
|
| Entity Incorporation, State or Country Code |
MD
|
| Entity Address, Address Line One |
20 Custom House Street
|
| Entity Address, Address Line Two |
11th Floor
|
| Entity Address, City or Town |
Boston
|
| Entity Address, State or Province |
MA
|
| Entity Address, Postal Zip Code |
02110
|
| City Area Code |
(617)
|
| Local Phone Number |
340-3814
|
| Written Communications |
false
|
| Soliciting Material |
false
|
| Pre-commencement Tender Offer |
false
|
| Pre-commencement Issuer Tender Offer |
false
|
| Entity Emerging Growth Company |
false
|
| Common Stock, par value $0.01 per share |
|
| Title of 12(b) Security |
Common Stock, par value $0.01 per share
|
| Trading Symbol |
PLYM
|
| Security Exchange Name |
NYSE
|
| X |
- DefinitionBoolean flag that is true when the XBRL content amends previously-filed or accepted submission.
| Name: |
dei_AmendmentFlag |
| Namespace Prefix: |
dei_ |
| Data Type: |
xbrli:booleanItemType |
| Balance Type: |
na |
| Period Type: |
duration |
|
| X |
- DefinitionFor the EDGAR submission types of Form 8-K: the date of the report, the date of the earliest event reported; for the EDGAR submission types of Form N-1A: the filing date; for all other submission types: the end of the reporting or transition period. The format of the date is YYYY-MM-DD.
| Name: |
dei_DocumentPeriodEndDate |
| Namespace Prefix: |
dei_ |
| Data Type: |
xbrli:dateItemType |
| Balance Type: |
na |
| Period Type: |
duration |
|
| X |
- DefinitionThe type of document being provided (such as 10-K, 10-Q, 485BPOS, etc). The document type is limited to the same value as the supporting SEC submission type, or the word 'Other'.
| Name: |
dei_DocumentType |
| Namespace Prefix: |
dei_ |
| Data Type: |
dei:submissionTypeItemType |
| Balance Type: |
na |
| Period Type: |
duration |
|
| X |
- DefinitionAddress Line 1 such as Attn, Building Name, Street Name
| Name: |
dei_EntityAddressAddressLine1 |
| Namespace Prefix: |
dei_ |
| Data Type: |
xbrli:normalizedStringItemType |
| Balance Type: |
na |
| Period Type: |
duration |
|
| X |
- DefinitionAddress Line 2 such as Street or Suite number
| Name: |
dei_EntityAddressAddressLine2 |
| Namespace Prefix: |
dei_ |
| Data Type: |
xbrli:normalizedStringItemType |
| Balance Type: |
na |
| Period Type: |
duration |
|
| X |
- Definition
+ References
+ Details
| Name: |
dei_EntityAddressCityOrTown |
| Namespace Prefix: |
dei_ |
| Data Type: |
xbrli:normalizedStringItemType |
| Balance Type: |
na |
| Period Type: |
duration |
|
| X |
- DefinitionCode for the postal or zip code
| Name: |
dei_EntityAddressPostalZipCode |
| Namespace Prefix: |
dei_ |
| Data Type: |
xbrli:normalizedStringItemType |
| Balance Type: |
na |
| Period Type: |
duration |
|
| X |
- DefinitionName of the state or province.
| Name: |
dei_EntityAddressStateOrProvince |
| Namespace Prefix: |
dei_ |
| Data Type: |
dei:stateOrProvinceItemType |
| Balance Type: |
na |
| Period Type: |
duration |
|
| X |
- DefinitionA unique 10-digit SEC-issued value to identify entities that have filed disclosures with the SEC. It is commonly abbreviated as CIK. Reference 1: http://www.xbrl.org/2003/role/presentationRef
-Publisher SEC
-Name Exchange Act
-Number 240
-Section 12
-Subsection b-2
| Name: |
dei_EntityCentralIndexKey |
| Namespace Prefix: |
dei_ |
| Data Type: |
dei:centralIndexKeyItemType |
| Balance Type: |
na |
| Period Type: |
duration |
|
| X |
- DefinitionIndicate if registrant meets the emerging growth company criteria. Reference 1: http://www.xbrl.org/2003/role/presentationRef
-Publisher SEC
-Name Exchange Act
-Number 240
-Section 12
-Subsection b-2
| Name: |
dei_EntityEmergingGrowthCompany |
| Namespace Prefix: |
dei_ |
| Data Type: |
xbrli:booleanItemType |
| Balance Type: |
na |
| Period Type: |
duration |
|
| X |
- DefinitionCommission file number. The field allows up to 17 characters. The prefix may contain 1-3 digits, the sequence number may contain 1-8 digits, the optional suffix may contain 1-4 characters, and the fields are separated with a hyphen.
| Name: |
dei_EntityFileNumber |
| Namespace Prefix: |
dei_ |
| Data Type: |
dei:fileNumberItemType |
| Balance Type: |
na |
| Period Type: |
duration |
|
| X |
- DefinitionTwo-character EDGAR code representing the state or country of incorporation.
| Name: |
dei_EntityIncorporationStateCountryCode |
| Namespace Prefix: |
dei_ |
| Data Type: |
dei:edgarStateCountryItemType |
| Balance Type: |
na |
| Period Type: |
duration |
|
| X |
- DefinitionThe exact name of the entity filing the report as specified in its charter, which is required by forms filed with the SEC. Reference 1: http://www.xbrl.org/2003/role/presentationRef
-Publisher SEC
-Name Exchange Act
-Number 240
-Section 12
-Subsection b-2
| Name: |
dei_EntityRegistrantName |
| Namespace Prefix: |
dei_ |
| Data Type: |
xbrli:normalizedStringItemType |
| Balance Type: |
na |
| Period Type: |
duration |
|
| X |
- DefinitionThe Tax Identification Number (TIN), also known as an Employer Identification Number (EIN), is a unique 9-digit value assigned by the IRS. Reference 1: http://www.xbrl.org/2003/role/presentationRef
-Publisher SEC
-Name Exchange Act
-Number 240
-Section 12
-Subsection b-2
| Name: |
dei_EntityTaxIdentificationNumber |
| Namespace Prefix: |
dei_ |
| Data Type: |
dei:employerIdItemType |
| Balance Type: |
na |
| Period Type: |
duration |
|
| X |
- DefinitionLocal phone number for entity.
| Name: |
dei_LocalPhoneNumber |
| Namespace Prefix: |
dei_ |
| Data Type: |
xbrli:normalizedStringItemType |
| Balance Type: |
na |
| Period Type: |
duration |
|
| X |
- DefinitionBoolean flag that is true when the Form 8-K filing is intended to satisfy the filing obligation of the registrant as pre-commencement communications pursuant to Rule 13e-4(c) under the Exchange Act. Reference 1: http://www.xbrl.org/2003/role/presentationRef
-Publisher SEC
-Name Exchange Act
-Number 240
-Section 13e
-Subsection 4c
| Name: |
dei_PreCommencementIssuerTenderOffer |
| Namespace Prefix: |
dei_ |
| Data Type: |
xbrli:booleanItemType |
| Balance Type: |
na |
| Period Type: |
duration |
|
| X |
- DefinitionBoolean flag that is true when the Form 8-K filing is intended to satisfy the filing obligation of the registrant as pre-commencement communications pursuant to Rule 14d-2(b) under the Exchange Act. Reference 1: http://www.xbrl.org/2003/role/presentationRef
-Publisher SEC
-Name Exchange Act
-Number 240
-Section 14d
-Subsection 2b
| Name: |
dei_PreCommencementTenderOffer |
| Namespace Prefix: |
dei_ |
| Data Type: |
xbrli:booleanItemType |
| Balance Type: |
na |
| Period Type: |
duration |
|
| X |
- DefinitionTitle of a 12(b) registered security. Reference 1: http://www.xbrl.org/2003/role/presentationRef
-Publisher SEC
-Name Exchange Act
-Number 240
-Section 12
-Subsection b
| Name: |
dei_Security12bTitle |
| Namespace Prefix: |
dei_ |
| Data Type: |
dei:securityTitleItemType |
| Balance Type: |
na |
| Period Type: |
duration |
|
| X |
- DefinitionName of the Exchange on which a security is registered. Reference 1: http://www.xbrl.org/2003/role/presentationRef
-Publisher SEC
-Name Exchange Act
-Number 240
-Section 12
-Subsection d1-1
| Name: |
dei_SecurityExchangeName |
| Namespace Prefix: |
dei_ |
| Data Type: |
dei:edgarExchangeCodeItemType |
| Balance Type: |
na |
| Period Type: |
duration |
|
| X |
- DefinitionBoolean flag that is true when the Form 8-K filing is intended to satisfy the filing obligation of the registrant as soliciting material pursuant to Rule 14a-12 under the Exchange Act. Reference 1: http://www.xbrl.org/2003/role/presentationRef
-Publisher SEC
-Name Exchange Act
-Number 240
-Section 14a
-Subsection 12
| Name: |
dei_SolicitingMaterial |
| Namespace Prefix: |
dei_ |
| Data Type: |
xbrli:booleanItemType |
| Balance Type: |
na |
| Period Type: |
duration |
|
| X |
- DefinitionTrading symbol of an instrument as listed on an exchange.
| Name: |
dei_TradingSymbol |
| Namespace Prefix: |
dei_ |
| Data Type: |
dei:tradingSymbolItemType |
| Balance Type: |
na |
| Period Type: |
duration |
|
| X |
- DefinitionBoolean flag that is true when the Form 8-K filing is intended to satisfy the filing obligation of the registrant as written communications pursuant to Rule 425 under the Securities Act. Reference 1: http://www.xbrl.org/2003/role/presentationRef
-Publisher SEC
-Name Securities Act
-Number 230
-Section 425
| Name: |
dei_WrittenCommunications |
| Namespace Prefix: |
dei_ |
| Data Type: |
xbrli:booleanItemType |
| Balance Type: |
na |
| Period Type: |
duration |
|
| X |
- Details
| Name: |
us-gaap_StatementClassOfStockAxis=plym_CommonStockParValue0.01PerShareMember |
| Namespace Prefix: |
|
| Data Type: |
na |
| Balance Type: |
|
| Period Type: |
|
|
Plymouth Industrial REIT (AMEX:PLYM-A)
Gráfica de Acción Histórica
De Abr 2024 a May 2024

Plymouth Industrial REIT (AMEX:PLYM-A)
Gráfica de Acción Histórica
De May 2023 a May 2024
