Storm Ahead? Bitcoin Price Could Tumble 20% Due To M2 Supply Concerns
28 Noviembre 2024 - 8:30AM
NEWSBTC
Investors have expressed apprehension regarding the recent price
fluctuations of Bitcoin, particularly in light of analysts’
predictions of a 20-25% decline in the global M2 money supply.
Related Reading: Crypto Bloodbath: Over $500 Million Liquidated As
Bitcoin Slides To $92K – Report At $92,864, bitcoin is down nearly
9% from its recent high of just under $100,000. That fall is part
of a trend of profit-taking by long-term holders, who sold 366,000
BTC in the last month, the most since April 2024. Introduction To
The M2 Money Supply Connection Market researchers have been
studying the relationship between Bitcoin prices and global M2
money circulation. Crypto analyst Joe Consorti noted that Bitcoin
prices have regularly tracked M2 pricing, albeit 70 days later.
Bitcoin has tracked global M2 with a ~70-day lag since September
2023. I don’t want to alarm anyone, but if it continues, bitcoin
could be in for a 20-25% correction. Global M2 in ⚪️ Bitcoin in 🟠
pic.twitter.com/PlPoaHUoFR — Joe Consorti ⚡️ (@JoeConsorti)
November 25, 2024 That is, Bitcoin’s price is likely to follow the
trend of M2 going down in the near future. The latest drop in M2
shows that Bitcoin might fall to important support levels of
$88,000 or even $80,000 if things keep going the way they are.
UPDATE: One day after my last chart, bitcoin is now $5,000 lower,
following the path set by global M2 several weeks ago very closely.
So far, this correlation is shockingly accurate. We’ll have to see
if BTC follows it all the way down, or stops short & finds
support. 🍿🍿🍿 pic.twitter.com/oEGOuYYRio — Joe Consorti ⚡️
(@JoeConsorti) November 26, 2024 Bitcoin has been weakening as it
can’t stay over $94,000. Because breaking these liquidity zones
could cause greater declines, analysts are watching them
attentively. Investors are worried because Bitcoin’s chance of
reaching $100,000 by year’s end has plummeted from 92% to 64%.
Long-Term Holders’ Pressure To Sell Glassnode’s most recent data
indicates that long-term holders (LTHs) have been more active in
selling, with over 507,000 BTC distributed since September 2023.
This selling pressure is substantial and indicates that numerous
investors are liquidating their profits in the context of the
current market volatility. The potential shift in market sentiment,
which is suggested by the increased activity among LTHs, could
further exacerbate the downward pressure on Bitcoin’s price.
Additionally, the Realized Profit/Loss (P/L) ratio has reached new
historical highs, indicating an overheated market. An increase in
this ratio typically means that a sizable portion of investors are
benefiting from price increases. Analysts caution that Bitcoin’s
rising momentum may be waning due to the current trend of
profit-taking and decreasing liquidity. Related Reading: Shiba Inu
Eyes Explosive Growth: Over 200% Surge Ahead, Analyst Says Bitcoin
Future Outlook – What Is In Store? As it works its way through
these challenges, the future of Bitcoin is still quite foggy.
Despite the fact that there are market observers who believe that
the price of the top crypto can normalize at lower levels, there
are also analysts who warn that additional corrections might be
required if global liquidity continues to decrease. Featured image
from DALL-E, chart from TradingView
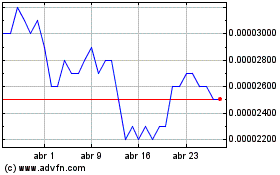
SHIBA INU (COIN:SHIBUSD)
Gráfica de Acción Histórica
De Nov 2024 a Dic 2024

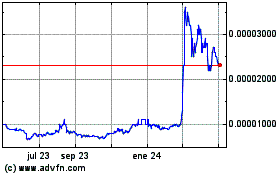
SHIBA INU (COIN:SHIBUSD)
Gráfica de Acción Histórica
De Dic 2023 a Dic 2024
