RNS Number:4611A
Oryx International Growth Fund Ld
02 July 2004

FOR IMMEDIATE RELEASE

RELEASED BY MANAGEMENT INTERNATIONAL (GUERNSEY) LIMITED

ORYX INTERNATIONAL GROWTH FUND LIMITED

PRELIMINARY ANNOUNCEMENT


THE BOARD OF DIRECTORS OF ORYX INTERNATIONAL GROWTH FUND LIMITED ANNOUNCE
RESULTS FOR THE YEAR ENDED 31 MARCH 2004:


                            UNAUDITED BALANCE SHEET

                              As at 31 March 2004

                         (Expressed in pounds sterling)

                                                                        2004          2003
                                                                          #             #
                          INVESNTS
                          Listed investments at market value           11,549,574     9,836,877
                          (cost #10,672,174; 2003 - #13,426,553)

                          Unlisted investments                          6,354,026     5,385,454
                          (cost #3,724,591; 2003 - #3,642,490)
                                                                       17,903,600    15,222,331
                          CURRENT ASSETS
                          Dividends and interest receivable               266,718        68,868
                          Amounts due from brokers                        187,653       223,746
                          Bank balances                                 3,250,789       342,697
                                                                        3,705,160       635,311
                          CURRENT LIABILITIES
                          Amounts due to brokers                          132,851        49,001
                          Creditors and accrued expenses                   61,202        62,742
                                                                          194,053       111,743

                          NET CURRENT ASSETS                            3,511,107       523,568

                          TOTAL ASSETS LESS CURRENT LIABILITIES        21,414,707    15,745,899

                          LONG TERM LIABILITIES
                          Convertible loan stock                        2,414,522     2,504,928

                          TOTAL NET ASSETS                            #19,000,185   #13,240,971

                          EQUITY SHARE CAPITAL                          3,941,616     4,049,116

                          RESERVES
                          Share premium                                 4,279,077     4,247,457
                          Reserve relating to warrants                          -        32,288
                          Capital redemption reserve                    1,239,000     1,099,000
                          Other reserves                                9,540,492     3,813,110
                                                                       15,058,569     9,191,855

                          EQUITY SHAREHOLDERS' FUNDS                  #19,000,185   #13,240,971

                          Net Asset Value per Share                         #2.41         #1.64

                          Fully Diluted Net Asset Value per Share           #2.00         #1.44


                                   UNAUDITED STATEMENT OF OPERATIONS
                                    For the year ended 31 March 2004
                                    (Expressed in pounds sterling)


                                                                                     2004          2003
                                                                                      #             #
            INCOME
            Deposit interest                                                           57,738         33,707
            Dividends and investment income                                           777,862        321,020
                                                                                      835,600        354,727

            EXPENDITURE
            Management and investment adviser's fee                                   228,161        219,876
            Finance charge                                                             23,152         25,723
            Custodian fees                                                             15,680         13,980
            Administration fees                                                        20,050         15,740
            Registrar and transfer agent fees                                           3,644          4,396
            Directors' fees and expenses                                              119,136         91,087
            Audit fee                                                                  12,516          9,498
            Insurance                                                                   9,500          6,750
            Legal and professional fees                                                47,434          7,791
            Printing and advertising expenses                                           6,425         10,601
            Miscellaneous expenses                                                     25,345         11,278

                                                                                      511,043        416,720
            NET INCOME / (EXPENSE)
            BEFORE TAXATION                                                           324,557       (61,993)
            Taxation                                                                 (96,548)       (27,295)


            NET INCOME / (EXPENSE) FOR THE YEAR AFTER TAXATION                        228,009       (89,288)
            Realised gain/ (loss) on investments                                      703,397    (1,557,611)
            Loss on foreign currency translation                                     (79,012)      (122,370)
            Movement in unrealised gain/ (loss) on revaluation of investments       5,353,186      (624,988)

            TOTAL SURPLUS/ (DEFICIT) ATTRIBUTABLE TO SHAREHOLDERS FOR THE YEAR     #6,205,580   #(2,394,257)

            EARNINGS PER SHARE FOR THE YEAR                                             #0.77        #(0.28)

            FULLY DILUTED EARNINGS PER SHARE FOR THE YEAR                               #0.57        #(0.20)


                                   UNAUDITED STATEMENT OF CASH FLOWS
                                    For the year ended 31 March 2004
                                    (Expressed in pounds sterling)


                                                                                2004           2003
                                                                                 #              #
                Net cash inflow/ (outflow) from operating activities               51,771      (108,082)

                INVESTING ACTIVITIES
                Purchase of investments                                      (13,647,072)   (18,202,781)
                Sale of investments                                            17,142,329     15,377,676
                Net cash inflow/ (outflow) from investing activities            3,495,257    (2,825,105)

                FINANCING ACTIVITIES
                Payment to holders of warrants                                   (70,946)        (6,012)
                Shares issued on exercise of warrants                                   -          4,500
                Payment to shareholders                                         (413,828)    (1,203,001)
                Payment to holders of convertible stock                          (75,150)      (110,221)
                Net cash outflow from financing activities                      (559,924)    (1,314,734)

                Net cash inflow/ (outflow)                                      2,987,104    (4,247,921)

                RECONCILIATION OF NET CASH FLOW TO MOVEMENT IN NET FUNDS
                Net cash inflow/ (outflow)                                      2,987,104    (4,247,921)
                Exchange movements                                               (79,012)      (122,370)
                Net cash at beginning of year                                     342,697      4,712,988


                Net cash at end of year                                        #3,250,789       #342,697


                              CHAIRMAN'S STATEMENT

The year under review saw a substantial recovery in equities across the world.
During the year the net asset value rose by 43.5%. While this was disappointing
in relation to our benchmark, the FTSE small cap index, it represents a very
credible performance as 33% of the portfolio is in unquoted investments, where
your board takes a very conservative view on valuation. In addition, a further
17% was held in cash awaiting investment.

In line with our stated policy, your Board do not propose paying a dividend,
however we will be continuing with our policy of buying back shares when
discounts allow. Consistent with this commitment, we purchased 280,000 ordinary
shares, 50,000 convertible loan notes and 242,375 warrants for cancellation.
This was modestly accretive to the NAV.

During the course of the coming year, the Board will be formulating proposals to
put to shareholders as the Fund will reach the end of its initial ten year term.

With confidence in markets overshadowed by threats of terrorism, our policy of
investing in situations where we believe value can be realised should continue
to provide us with opportunities.

Nigel Cayzer

Chairman


                          INVESTMENT ADVISER'S REPORT

During the year under review, the net asset value rose by 43.5%. This compares
with a rise in the FTSE 100 Index of 21.4% and a rise in the FTSE Small Cap of
59.8%. The performance was adversely impacted by the weakness of the Dollar,
which fell by 16.6% over the year, and lack of activity in the unquoted
portfolio.

I am however pleased to note that the quoted portfolio maintained the excellent
momentum of the first half. Since September 30th, Mentmore, our largest holding,
rose 30%, Quarto 20%, Whatman approximately 50%, Simon Group 15%, Charter 75%,
Paramount over 100% and Harstone Pref nearly 75%. Only two shares performed
poorly, Dowding & Mills and Lonrho Africa although the overall impact on the
portfolio was negligible.

The current year has started reasonably well with an offer to acquire Mentmore
at a premium to the value at 31st March. We are also optimistic that the
unquoted portfolio will perform well over the current year. Santa Maria is in
advanced discussions to be acquired. Waterbury has also appointed an investment
banker to sell the company and this should also result in a significant uplift
to the current holding price and Executive Air Support is subject to an offer,
which has been accepted at a 132% premium to book value.

The overall prospects for equity markets are increasingly uncertain. Interest
rates are certain to rise over the next twelve months whilst debt fed economic
growth is unlikely in the long run to be sustainable or healthy for the economy.

In the circumstances, we continue to adopt a conservative investment policy so
as to at least preserve shareholder value in the coming twelve months.


North Atlantic Value LLP


                      This information is provided by RNS
            The company news service from the London Stock Exchange
END

FR SSMFMESLSEDW
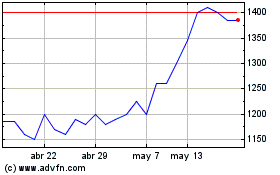
Oryx International Growth (LSE:OIG)
Gráfica de Acción Histórica
De Jun 2024 a Jul 2024

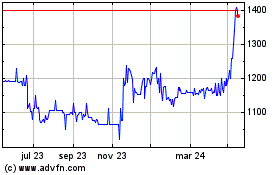
Oryx International Growth (LSE:OIG)
Gráfica de Acción Histórica
De Jul 2023 a Jul 2024
