UNITED STATES
SECURITIES AND EXCHANGE COMMISSION
Washington, D.C. 20549
FORM 6-K
REPORT OF FOREIGN
PRIVATE ISSUER PURSUANT TO RULE 13a-16 OR 15d-16 UNDER THE SECURITIES EXCHANGE ACT OF 1934
For the month of August 2023
Commission File
Number: 001-39938
Vinci Partners Investments Ltd.
(Exact name of registrant as specified in its
charter)
Av. Bartolomeu Mitre, 336
Leblon – Rio de Janeiro
Brazil 22431-002
+55 (21) 2159-6240
(Address of principal executive office)
Indicate by check mark whether the registrant files
or will file annual reports under cover of Form 20-F or Form 40-F:
Indicate by check mark if the registrant is submitting
the Form 6-K in paper as permitted by Regulation S-T Rule 101(b)(1):
Indicate by check mark if the registrant is submitting
the Form 6-K in paper as permitted by Regulation S-T Rule 101(b)(7):
TABLE OF CONTENTS
| EXHIBIT |
|
| 99.1 |
Vinci Partners Investments Ltd. Second Quarter 2023 Earnings Presentation |
| 99.2 |
Press release dated August 10, 2023 – Vinci Partners Reports Second Quarter 2023 Results |
| 99.3 |
Vinci Partners Investments Ltd. Interim Financial Statements as of June 30, 2023 and For the Six-Month Period Ended June 30, 2023 and 2022 |
SIGNATURE
Pursuant to the requirements of the Securities
Exchange Act of 1934, the registrant has duly caused this report to be signed on its behalf by the undersigned, thereunto duly authorized.
| |
Vinci Partners Investments Ltd. |
| |
|
| |
|
| |
By: |
/s/ Sergio Passos Ribeiro |
| |
|
Name: |
Sergio Passos Ribeiro |
| |
|
Title: |
Chief Financial Officer |
Date: August 10, 2023
Exhibit 99.1

Second Quarter 2023 Earnings Presentation August 10, 2023

Disclaimer This presentation contains forward - looking statements that can be identified by the use of words such as “anticipate,” “believe,” “could,” “expect,” “should,” “plan,” “intend,” “estimate” and “potential,” among others . By their nature, forward - looking statements are necessarily subject to a high degree of uncertainty and involve known and unknown risks, uncertainties, assumptions and other factors because they relate to events and depend on circumstances that will occur in the future whether or not outside of our control . Such factors may cause actual results, performance or developments to differ materially from those expressed or implied by such forward - looking statements and there can be no assurance that such forward - looking statements will prove to be correct . Accordingly, you should not place undue reliance on forward - looking statements . The forward - looking statements included herein speak only as at the date of this presentation and we do not undertake any obligation to update these forward - looking statements . Past performance does not guarantee or predict future performance . Moreover, neither we nor our affiliates, officers, employees and agents undertake any obligation to review, update or confirm expectations or estimates or to release any revisions to any forward - looking statements to reflect events that occur or circumstances that arise in relation to the content of the presentation . Further information on these and other factors that could affect our financial results is included in filings we have made and will make with the U . S . Securities and Exchange Commission (the “SEC”) from time to time, including in the section titled “Risk Factors” in our latest fillings with the SEC . These documents are available on the SEC Filings section of the investor relations section of our website at : https : //ir . vincipartners . com/financials/sec - filings . We have prepared this presentation solely for informational purposes . The information in this presentation does not constitute or form part of, and should not be construed as, an offer or invitation to subscribe for, underwrite or otherwise acquire, any of our securities or securities of our subsidiaries or affiliates, not should it or any part of it form the basis of, or be relied on, in connection with any contract to purchase or subscribe for any of our securities or securities of any of our subsidiaries or affiliates, nor shall it or any part of it form the basis of, or be relied on, in connection with any contract or commitment whatsoever . This presentation also includes certain non - GAAP financial information . We believe that such information is meaningful and useful in understanding the activities and business metrics of our operations . We also believe that these non - GAAP financial measures reflect an additional way of viewing aspects of our business that, when viewed with our International Financial Reporting Standards (“IFRS”) results, as issued by the International Accounting Standards Board, provide a more complete understanding of factors and trends affecting our business . Further, investors regularly rely on non - GAAP financial measures to assess operating performance and such measures may highlight trends in our business that may not otherwise be apparent when relying on financial measures calculated in accordance with IFRS . We also believe that certain non - GAAP financial measures are frequently used by securities analysts, investors and other interested parties in the evaluation of public companies in our industry, many of which present these measures when reporting their results . The non - GAAP financial information is presented for informational purposes and to enhance understanding of the IFRS financial statements . The non - GAAP measures should be considered in addition to results prepared in accordance with IFRS, but not as a substitute for, or superior to, IFRS results . As other companies may determine or calculate this non - GAAP financial information differently, the usefulness of these measures for comparative purposes is limited . A reconciliation of such non - GAAP financial measures to the nearest GAAP measure is included in this presentation . 2

3 Presenters Alessandro Horta Chief Executive Officer Sergio Passos Chief Operating Officer & Chief Financial Officer Bruno Zaremba Private Equity Chairman & Head of Investor Relations

Opening Remarks
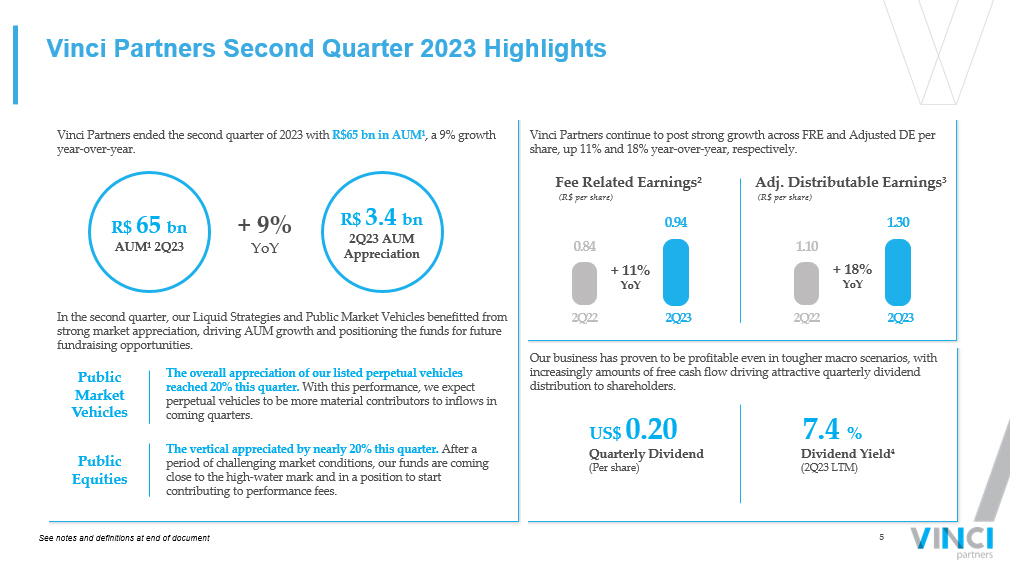
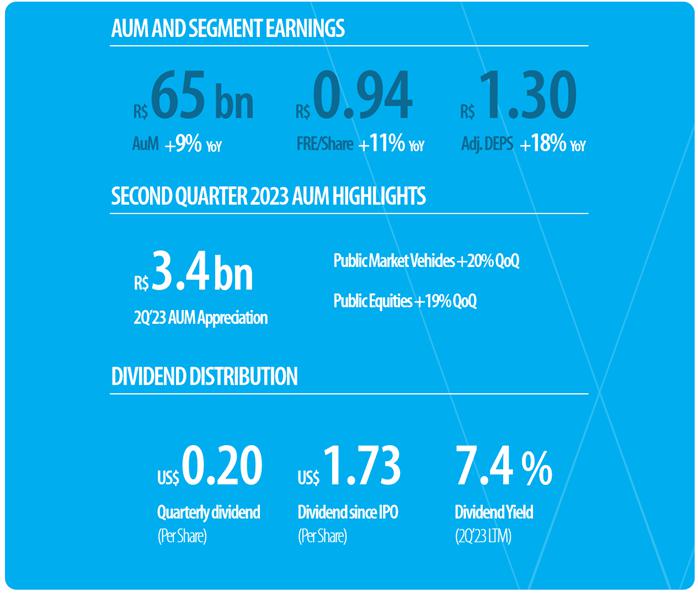
5 Vinci Partners Second Quarter 2023 Highlights R$ 65 bn AUM¹ 2Q23 Vinci Partners ended the second quarter of 2023 with R$65 bn in AUM¹ , a 9% growth year - over - year. Our business has proven to be profitable even in tougher macro scenarios, with increasingly amounts of free cash flow driving attractive quarterly dividend distribution to shareholders. In the second quarter, our Liquid Strategies and Public Market Vehicles benefitted from strong market appreciation, driving AUM growth and positioning the funds for future fundraising opportunities. US$ 0.20 + 9 % YoY The overall appreciation of our listed perpetual vehicles reached 20% this quarter. With this performance, we expect perpetual vehicles to be more material contributors to inflows in coming quarters. See notes and definitions at end of document Public Market Vehicles The vertical appreciated by nearly 20% this quarter. After a period of challenging market conditions, our funds are coming close to the high - water mark and in a position to start contributing to performance fees. Public Equities Vinci Partners continue to post strong growth across FRE and Adjusted DE per share, up 11% and 18% year - over - year, respectively. R$ 3.4 bn 2Q23 AUM Appreciation 2Q22 2Q23 0.84 0.94 + 11 % YoY Fee Related Earnings² (R$ per share) 2Q22 2Q23 1.10 1.30 + 18 % YoY Adj. Distributable Earnings³ (R$ per share) Quarterly Dividend (Per share) 7.4 % Dividend Yield 4 (2Q23 LTM)

Financial Highlights
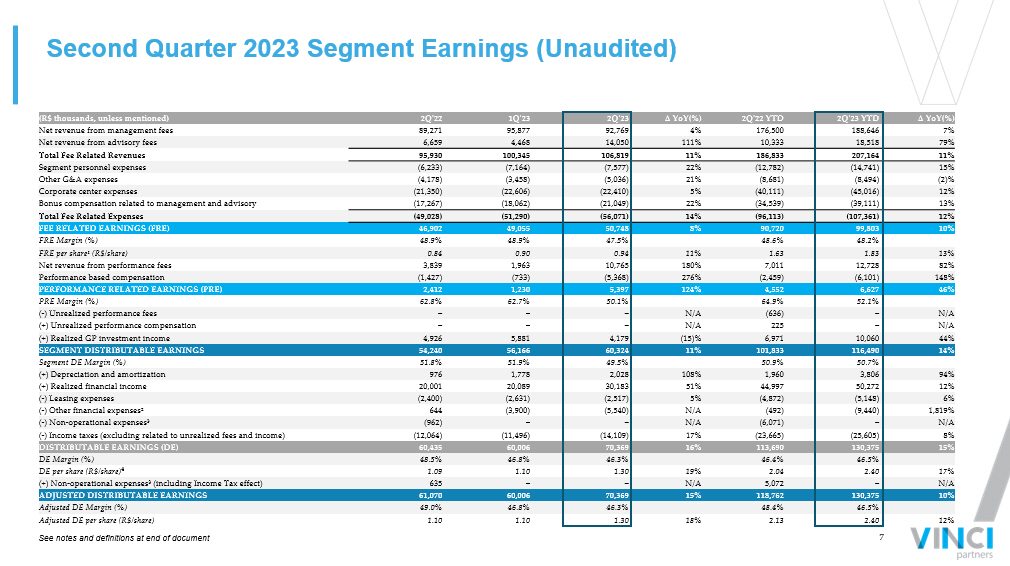
7 (R$ thousands, unless mentioned) 2Q'22 1Q'23 2Q'23 ∆ YoY(%) 2Q'22 YTD 2Q'23 YTD ∆ YoY(%) Net revenue from management fees 89,271 95,877 92,769 4% 176,500 188,646 7% Net revenue from advisory fees 6,659 4,468 14,050 111% 10,333 18,518 79% Total Fee Related Revenues 95,930 100,345 106,819 11% 186,833 207,164 11% Segment personnel expenses (6,233) (7,164) (7,577) 22% (12,782) (14,741) 15% Other G&A expenses (4,178) (3,458) (5,036) 21% (8,681) (8,494) (2)% Corporate center expenses (21,350) (22,606) (22,410) 5% (40,111) (45,016) 12% Bonus compensation related to management and advisory (17,267) (18,062) (21,049) 22% (34,539) (39,111) 13% Total Fee Related Expenses (49,028) (51,290) (56,071) 14% (96,113) (107,361) 12% FEE RELATED EARNINGS (FRE) 46,902 49,055 50,748 8% 90,720 99,803 10% FRE Margin (%) 48.9% 48.9% 47.5% 48.6% 48.2% FRE per share¹ (R$/share) 0.84 0.90 0.94 11% 1.63 1.83 13% Net revenue from performance fees 3,839 1,963 10,765 180% 7,011 12,728 82% Performance based compensation (1,427) (733) (5,368) 276% (2,459) (6,101) 148% PERFORMANCE RELATED EARNINGS (PRE) 2,412 1,230 5,397 124% 4,552 6,627 46% PRE Margin (%) 62.8% 62.7% 50.1% 64.9% 52.1% ( - ) Unrealized performance fees – – – N/A (636) – N/A (+) Unrealized performance compensation – – – N/A 225 – N/A (+) Realized GP investment income 4,926 5,881 4,179 (15)% 6,971 10,060 44% SEGMENT DISTRIBUTABLE EARNINGS 54,240 56,166 60,324 11% 101,833 116,490 14% Segment DE Margin (%) 51.8% 51.9% 49.5% 50.9% 50.7% (+) Depreciation and amortization 976 1,778 2,028 108% 1,960 3,806 94% (+) Realized financial income 20,001 20,089 30,183 51% 44,997 50,272 12% ( - ) Leasing expenses (2,400) (2,631) (2,517) 5% (4,872) (5,148) 6% ( - ) Other financial expenses² 644 (3,900) (5,540) N/A (492) (9,440) 1,819% ( - ) Non - operational expenses³ (962) – – N/A (6,071) – N/A ( - ) Income taxes (excluding related to unrealized fees and income) (12,064) (11,496) (14,109) 17% (23,665) (25,605) 8% DISTRIBUTABLE EARNINGS (DE) 60,435 60,006 70,369 16% 113,690 130,375 15% DE Margin (%) 48.5% 46.8% 46.3% 46.4% 46.5% DE per share (R$/share) 4 1.09 1.10 1.30 19% 2.04 2.40 17% (+) Non - operational expenses³ (including Income Tax effect) 635 – – N/A 5,072 – N/A ADJUSTED DISTRIBUTABLE EARNINGS 61,070 60,006 70,369 15% 118,762 130,375 10% Adjusted DE Margin (%) 49.0% 46.8% 46.3% 48.4% 46.5% Adjusted DE per share (R$/share) 1.10 1.10 1.30 18% 2.13 2.40 12% Second Quarter 2023 Segment Earnings (Unaudited) See notes and definitions at end of document
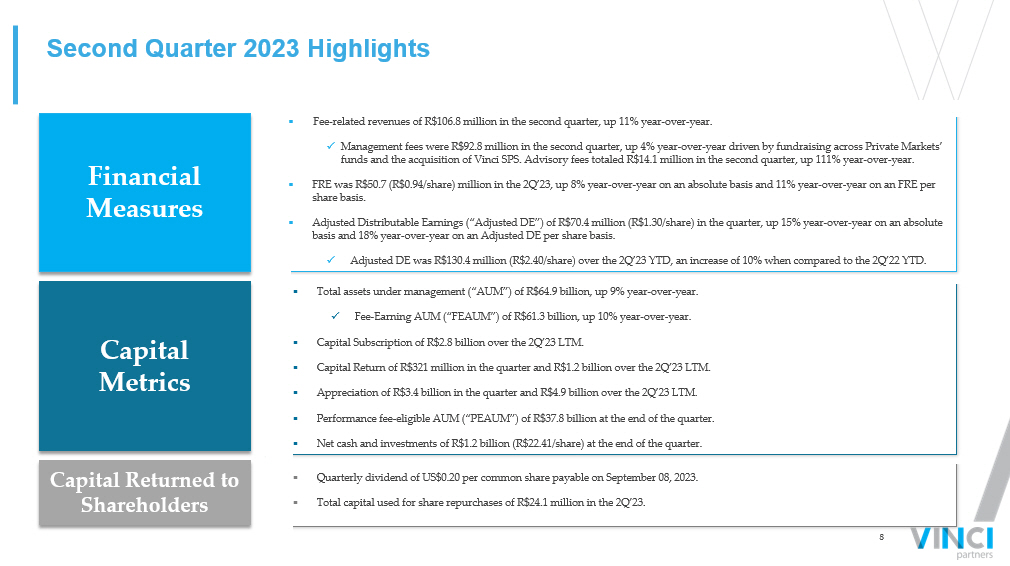
8 ▪ Fee - related revenues of R$106.8 million in the second quarter, up 11% year - over - year. x Management fees were R$92.8 million in the second quarter, up 4% year - over - year driven by fundraising across Private Markets’ funds and the acquisition of Vinci SPS. Advisory fees totaled R$14.1 million in the second quarter, up 111% year - over - year. ▪ FRE was R$ 50 .7 (R$0.94/share) million in the 2Q’23, up 8% year - over - year on an absolute basis and 11% year - over - year on an FRE per share basis. ▪ Adjusted Distributable Earnings (“Adjusted DE”) of R$7 0 .4 million (R$1.30/share) in the quarter, up 15% year - over - year on an absolute basis and 18% year - over - year on an Adjusted DE per share basis. x Adjusted DE was R$ 130.4 million (R$ 2.40 /share) over the 2Q’23 YTD, an increase of 10% when compared to the 2Q’22 YTD. ▪ Total assets under management (“AUM”) of R$64.9 billion, up 9% year - over - year. x Fee - Earning AUM (“FEAUM”) of R$61.3 billion, up 10% year - over - year. ▪ Capital Subscription of R$2.8 billion over the 2Q’23 LTM. ▪ Capital Return of R$ 321 million in the quarter and R$1.2 billion over the 2Q’23 LTM. ▪ Appreciation of R$ 3.4 billion in the quarter and R$4.9 billion over the 2Q’23 LTM. ▪ Performance fee - eligible AUM (“PEAUM”) of R$37.8 billion at the end of the quarter. ▪ Net cash and investments of R$1.2 billion (R$22.41/share) at the end of the quarter. Second Quarter 2023 Highlights Financial Measures Capital Metrics Capital Returned to Shareholders ▪ Quarterly dividend of US$0.20 per common share payable on September 08, 2023. ▪ Total capital used for share repurchases of R$24.1 million in the 2Q’23.
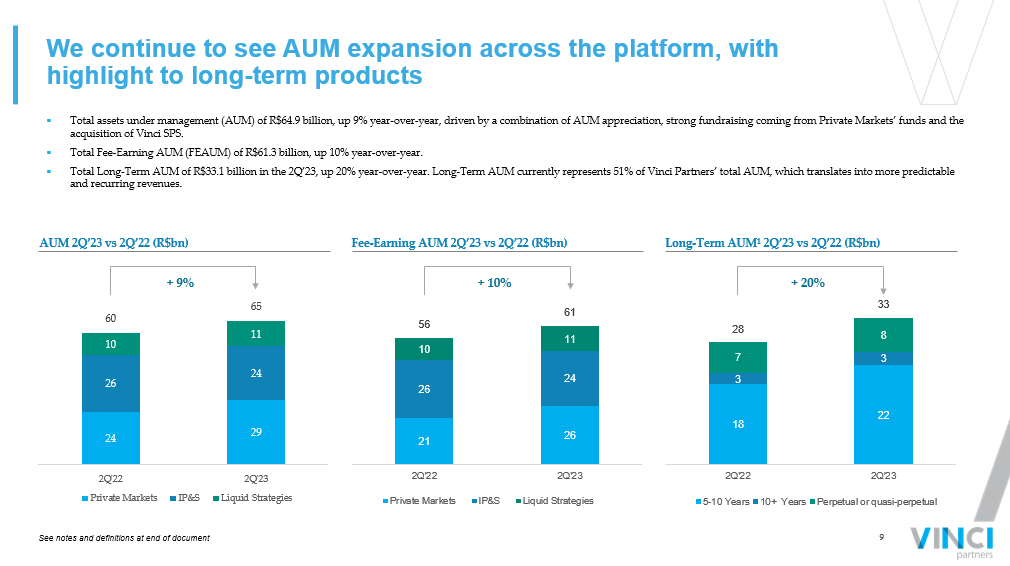
9 18 22 3 3 7 8 28 33 2Q'22 2Q'23 5-10 Years 10+ Years Perpetual or quasi-perpetual 21 26 26 24 10 11 56 61 2Q'22 2Q'23 Private Markets IP&S Liquid Strategies 24 29 26 24 10 11 60 65 2Q'22 2Q'23 Private Markets IP&S Liquid Strategies We continue to see AUM expansion across the platform, with highlight to long - term products ▪ Total assets under management (AUM) of R$64.9 billion, up 9% year - over - year, driven by a combination of AUM appreciation, strong fundraising coming from Private Markets’ funds and the acquisition of Vinci SPS. ▪ Total Fee - Earning AUM (FEAUM) of R$61.3 billion, up 10% year - over - year. ▪ Total Long - Term AUM of R$33.1 billion in the 2Q’23, up 20% year - over - year. Long - Term AUM currently represents 51% of Vinci Partn ers’ total AUM, which translates into more predictable and recurring revenues. Fee - Earning AUM 2Q’23 vs 2Q’22 (R$bn) Long - Term AUM¹ 2Q’23 vs 2Q’22 (R$bn) + 9% + 10% + 20% See notes and definitions at end of document AUM 2Q’23 vs 2Q’22 (R$bn)
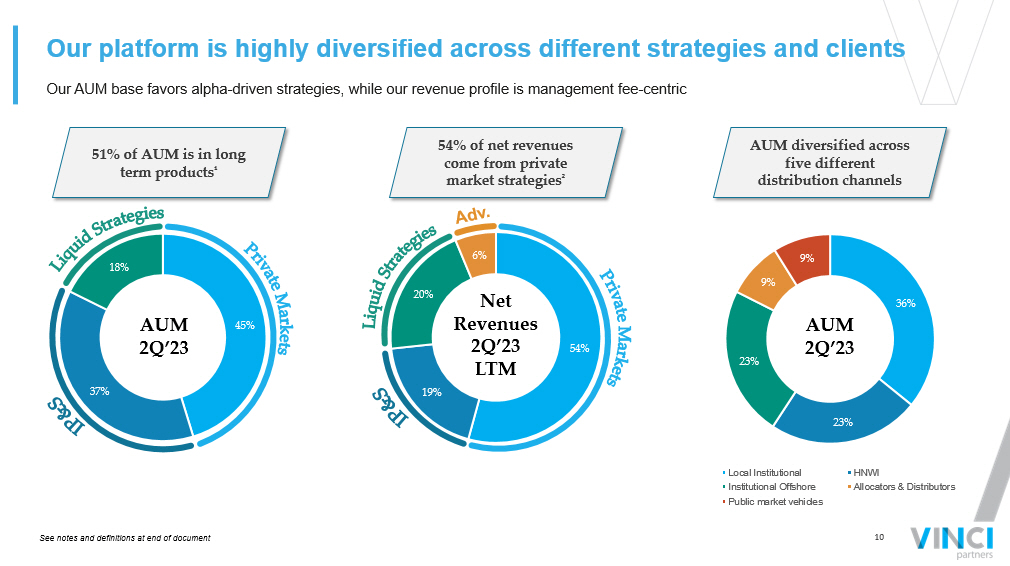
10 Our AUM base favors alpha - driven strategies, while our revenue profile is management fee - centric Our platform is highly diversified across different strategies and clients 54 % of net revenues come from private market strategies ² 51 % of AUM is in long term products ¹ AUM diversified across five different distribution channels AUM 2Q’23 Net Revenues 2Q’23 LTM See notes and definitions at end of document AUM 2Q’23 45% 37% 18% 36% 23% 23% 9% 9% Local Institutional HNWI Institutional Offshore Allocators & Distributors Public market vehicles 54% 19% 20% 6%
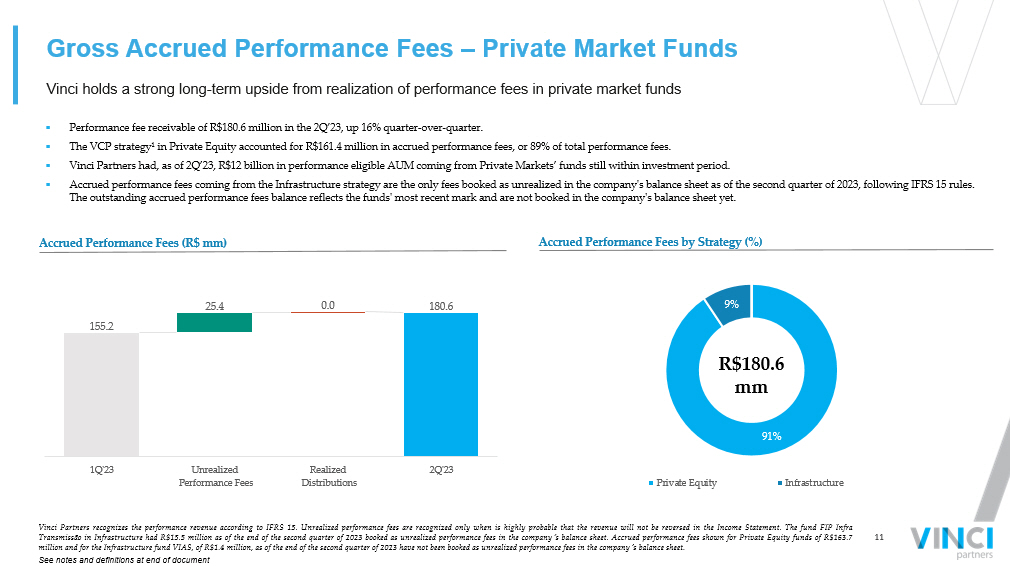
11 91% 9% Private Equity Infrastructure Vinci holds a strong long - term upside from realization of performance fees in private market funds Gross Accrued Performance Fees – Private Market Funds ▪ Performance fee receivable of R$180.6 million in the 2Q’23, up 16% quarter - over - quarter. ▪ The VCP strategy¹ in Private Equity accounted for R$161.4 million in accrued performance fees, or 89% of total performance fe es. ▪ Vinci Partners had, as of 2Q’23, R$12 billion in performance eligible AUM coming from Private Markets’ funds still within inv est ment period. ▪ Accrued performance fees coming from the Infrastructure strategy are the only fees booked as unrealized in the company's bala nce sheet as of the second quarter of 2023, following IFRS 15 rules. The outstanding accrued performance fees balance reflects the funds' most recent mark and are not booked in the company's bal anc e sheet yet. R$180.6 mm Accrued Performance Fees (R$ mm) Accrued Performance Fees by Strategy (%) Vinci Partners recognizes the performance revenue according to IFRS 15 . Unrealized performance fees are recognized only when is highly probable that the revenue will not be reversed in the Income Statement . The fund FIP Infra Transmissão in Infrastructure had R $ 15 . 5 million as of the end of the second quarter of 2023 booked as unrealized performance fees in the company ´ s balance sheet . Accrued performance fees shown for Private Equity funds of R $ 163 . 7 million and for the Infrastructure fund VIAS, of R $ 1 . 4 million, as of the end of the second quarter of 2023 have not been booked as unrealized performance fees in the company ´ s balance sheet . See notes and definitions at end of document
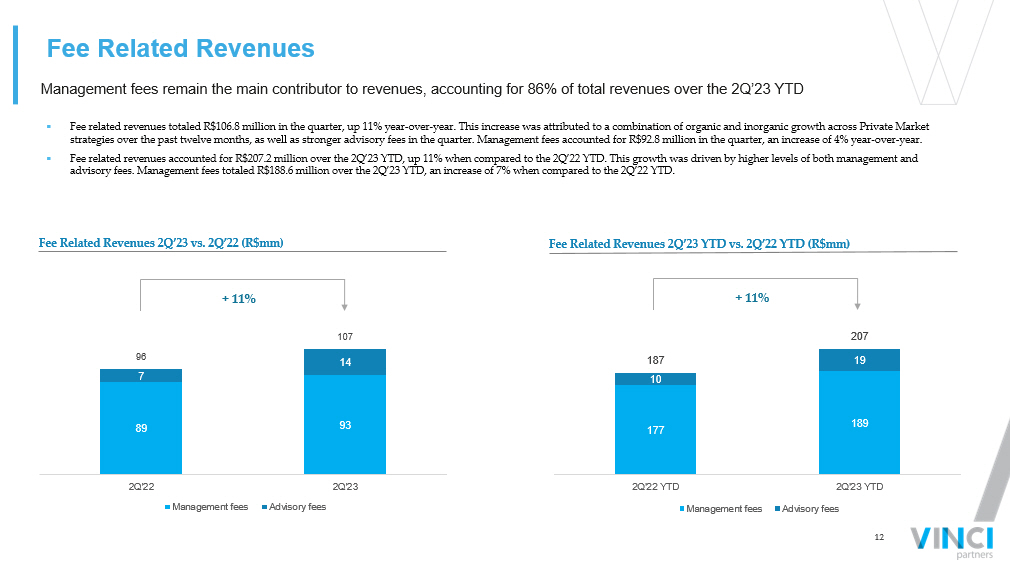
12 Fee Related Revenues Management fees remain the main contributor to revenues, accounting for 86% of total revenues over the 2Q’23 YTD ▪ Fee related revenues totaled R$106.8 million in the quarter, up 11% year - over - year. This increase was attributed to a combinatio n of organic and inorganic growth across Private Market strategies over the past twelve months, as well as stronger advisory fees in the quarter. Management fees accounted for R$92. 8 m illion in the quarter, an increase of 4% year - over - year. ▪ Fee related revenues accounted for R$207.2 million over the 2Q’23 YTD, up 11% when compared to the 2Q’22 YTD. This growth was dr iven by higher levels of both management and advisory fees. Management fees totaled R$188.6 million over the 2Q’23 YTD, an increase of 7% when compared to the 2Q’22 YTD. Fee Related Revenues 2Q’23 vs. 2Q’22 (R$mm) Fee Related Revenues 2Q’23 YTD vs. 2Q’22 YTD (R$mm) 177 189 10 19 187 207 2Q'22 YTD 2Q'23 YTD Management fees Advisory fees 89 93 7 14 96 107 2Q'22 2Q'23 Management fees Advisory fees + 11% + 11%
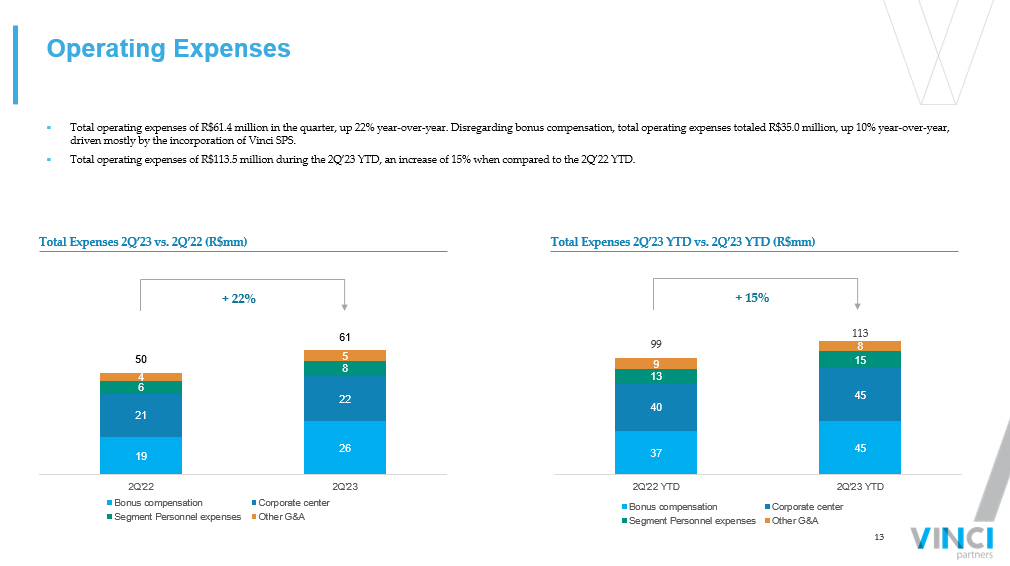
13 19 26 21 22 6 8 4 5 50 61 2Q'22 2Q'23 Bonus compensation Corporate center Segment Personnel expenses Other G&A 37 45 40 45 13 15 9 8 99 113 2Q'22 YTD 2Q'23 YTD Bonus compensation Corporate center Segment Personnel expenses Other G&A Operating Expenses ▪ Total operating expenses of R$61.4 million in the quarter, up 22% year - over - year. Disregarding bonus compensation, total operati ng expenses totaled R$35.0 million, up 10% year - over - year, driven mostly by the incorporation of Vinci SPS. ▪ Total operating expenses of R$113.5 million during the 2Q’23 YTD, an increase of 15% when compared to the 2Q’22 YTD. Total Expenses 2Q’23 YTD vs. 2Q’23 YTD (R$mm) + 15% + 22% Total Expenses 2Q’23 vs. 2Q’22 (R$mm)
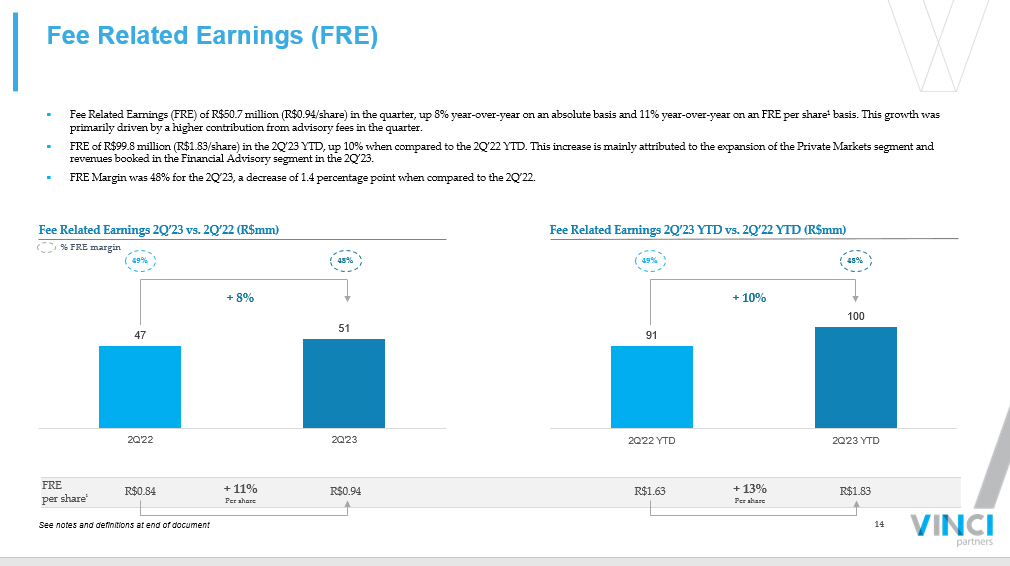
14 47 51 2Q'22 2Q'23 91 100 2Q'22 YTD 2Q'23 YTD Fee Related Earnings (FRE) ▪ Fee Related Earnings (FRE) of R$50.7 million (R$0.94/share) in the quarter, up 8% year - over - year on an absolute basis and 11% ye ar - over - year on an FRE per share¹ basis. This growth was primarily driven by a higher contribution from advisory fees in the quarter. ▪ FRE of R$99.8 million (R$1.83/share) in the 2Q’23 YTD, up 10% when compared to the 2Q’22 YTD. This increase is mainly attribu ted to the expansion of the Private Markets segment and revenues booked in the Financial Advisory segment in the 2Q’23. ▪ FRE Margin was 48% for the 2Q’23, a decrease of 1.4 percentage point when compared to the 2Q’22. See notes and definitions at end of document FRE per share ¹ R$0.94 R$0.84 R$1.83 R$1.63 48 % 49% Fee Related Earnings 2Q’23 vs. 2Q’22 (R$mm) Fee Related Earnings 2Q’23 YTD vs. 2Q’22 YTD (R$mm) % FRE margin + 8% 48 % 49% + 10% + 11% Per share + 13% Per share
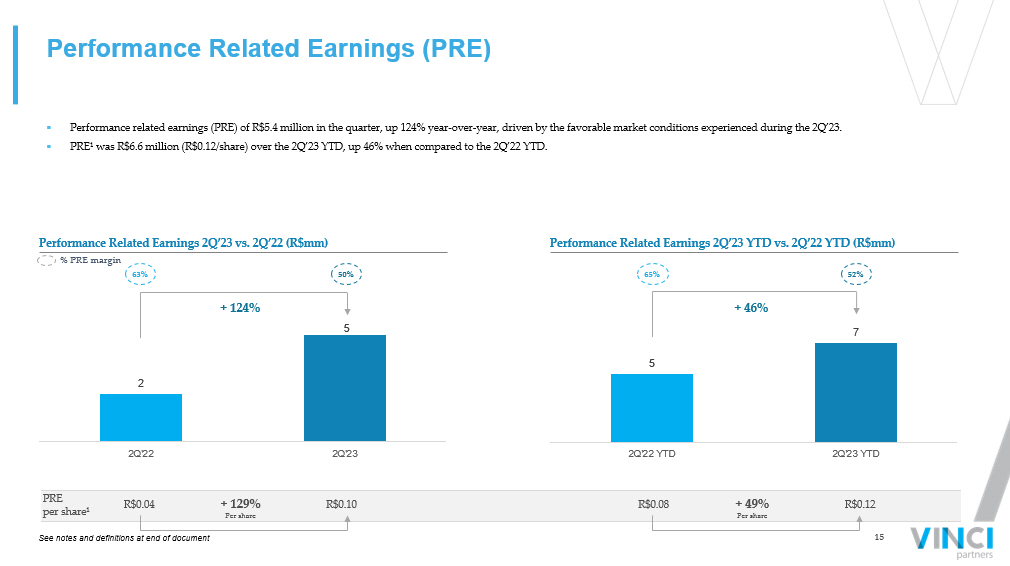
15 2 5 2Q'22 2Q'23 5 7 2Q'22 YTD 2Q'23 YTD Performance Related Earnings (PRE) ▪ Performance related earnings (PRE) of R$5.4 million in the quarter, up 124% year - over - year, driven by the favorable market condi tions experienced during the 2Q’23. ▪ PRE¹ was R$6.6 million (R$0.12/share) over the 2Q’23 YTD, up 46% when compared to the 2Q’22 YTD. Performance Related Earnings 2Q’23 vs. 2Q’22 (R$mm) Performance Related Earnings 2Q’23 YTD vs. 2Q’22 YTD (R$mm) % PRE margin 52 % 65% R$0.04 R$0.10 R$0.08 R$0.12 See notes and definitions at end of document 50% 63 % + 46% + 124% + 129% Per share + 49% Per share PRE per share¹

16 45 50 7 10 52 60 2Q'22 YTD 2Q'23 YTD Realized Financial Income Realized GP Investment Income 20 30 5 4 25 34 2Q'22 2Q'23 Realized Financial Income Realized GP Investment Income Realized GP Investment and Financial income ▪ Realized GP Investment¹ and Financial income² of R$34.4 million in the 2Q’23, up 38% year - over - year, driven by realized gains in our liquid funds' portfolio. ▪ Realized GP Investment income of R$4.2 million in the quarter, coming primarily from dividend distributions of the company’s pro prietary stake in listed REITs. ▪ Realized GP Investment¹ and Financial income² accounted for R$60.3 million over the 2Q’23 YTD , up 16% when compared to the 2 Q’2 2 YTD. See notes and definitions at end of document Realized GP Investment¹ and Financial income² 2Q’23 vs 2Q’22 (R$mm) + 16% Realized GP Investment¹ and Financial income² 2Q’23 YTD vs 2Q’22 YTD (R$mm) + 38%
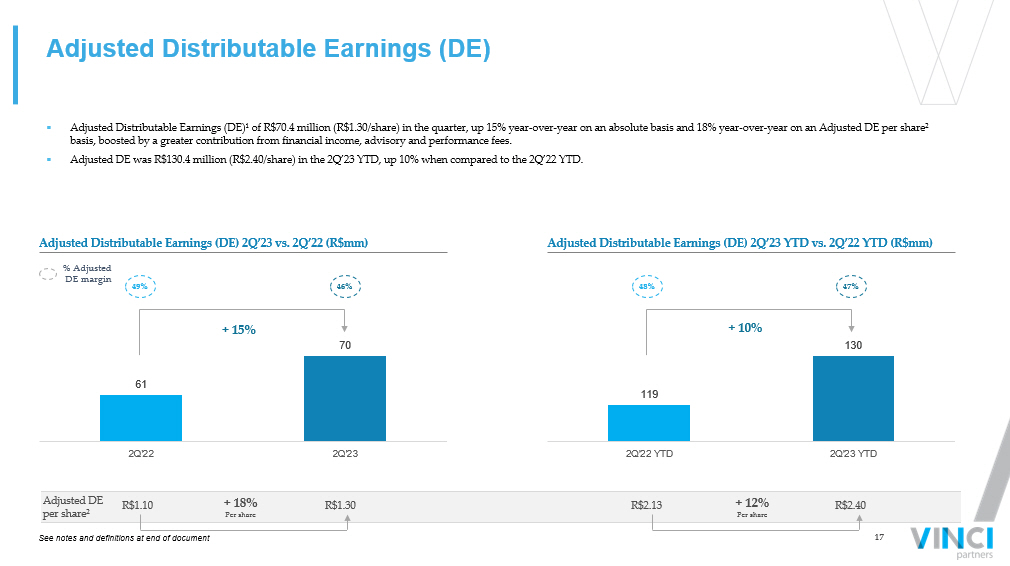
17 119 130 2Q'22 YTD 2Q'23 YTD 61 70 2Q'22 2Q'23 Adjusted Distributable Earnings (DE) ▪ Adjusted Distributable Earnings (DE)¹ of R$70.4 million (R$1.30/share) in the quarter, up 15% year - over - year on an absolute basi s and 18% year - over - year on an Adjusted DE per share² basis, boosted by a greater contribution from financial income, advisory and performance fees. ▪ Adjusted DE was R$130.4 million (R$2.40/share) in the 2Q’23 YTD, up 10% when compared to the 2Q’22 YTD. Adjusted Distributable Earnings (DE) 2Q’23 vs. 2Q’22 (R$mm) Adjusted Distributable Earnings (DE) 2Q’23 YTD vs. 2Q’22 YTD (R$mm) + 15% % Adjusted DE margin R$1.10 R$1.30 + 10% 47 % 48% R$2.13 R$2.40 See notes and definitions at end of document 46 % 49% + 18% Per share + 12% Per share Adjusted DE per share²
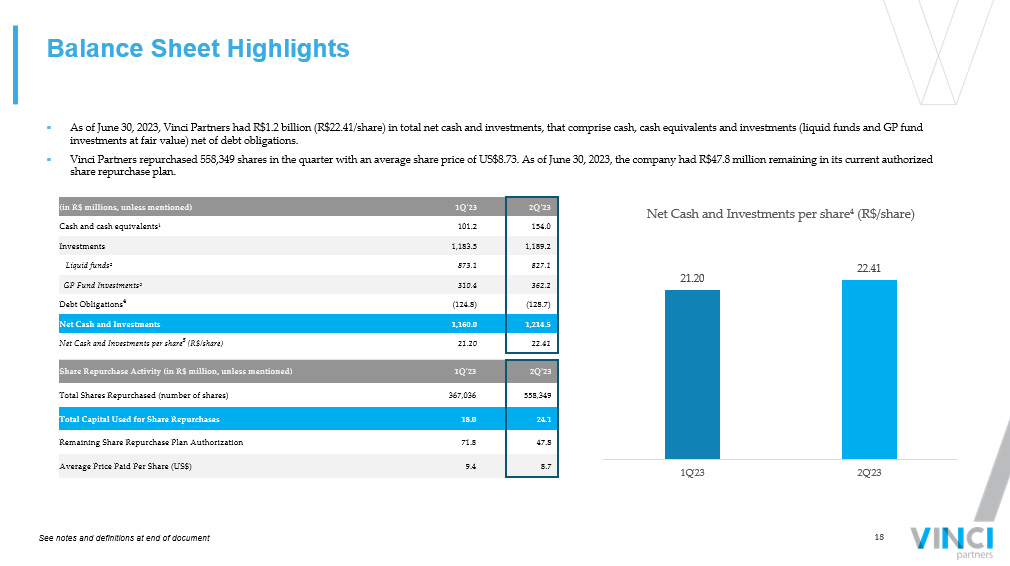
18 21.20 22.41 1Q'23 2Q'23 Net Cash and Investments per share 4 (R$/share) Share Repurchase Activity (in R$ million, unless mentioned) 1Q'23 2Q'23 Total Shares Repurchased (number of shares) 367,036 558,349 Total Capital Used for Share Repurchases 18.0 24.1 Remaining Share Repurchase Plan Authorization 71.8 47.8 Average Price Paid Per Share (US$) 9.4 8.7 (in R$ millions, unless mentioned) 1Q'23 2Q'23 Cash and cash equivalents¹ 101.2 154.0 Investments 1,183.5 1,189.2 Liquid funds² 873.1 827.1 GP Fund Investments³ 310.4 362.2 Debt Obligations 4 (124.8) (128.7) Net Cash and Investments 1,160.0 1,214.5 Net Cash and Investments per share 5 (R$/share) 21.20 22.41 Balance Sheet Highlights ▪ As of June 30, 2023, Vinci Partners had R$1.2 billion (R$22.41/share) in total net cash and investments, that comprise cash, cas h equivalents and investments (liquid funds and GP fund investments at fair value) net of debt obligations. ▪ Vinci Partners repurchased 558,349 shares in the quarter with an average share price of US$8.73. As of June 30, 2023, the com pan y had R$47.8 million remaining in its current authorized share repurchase plan. See notes and definitions at end of document

Segment Highlights
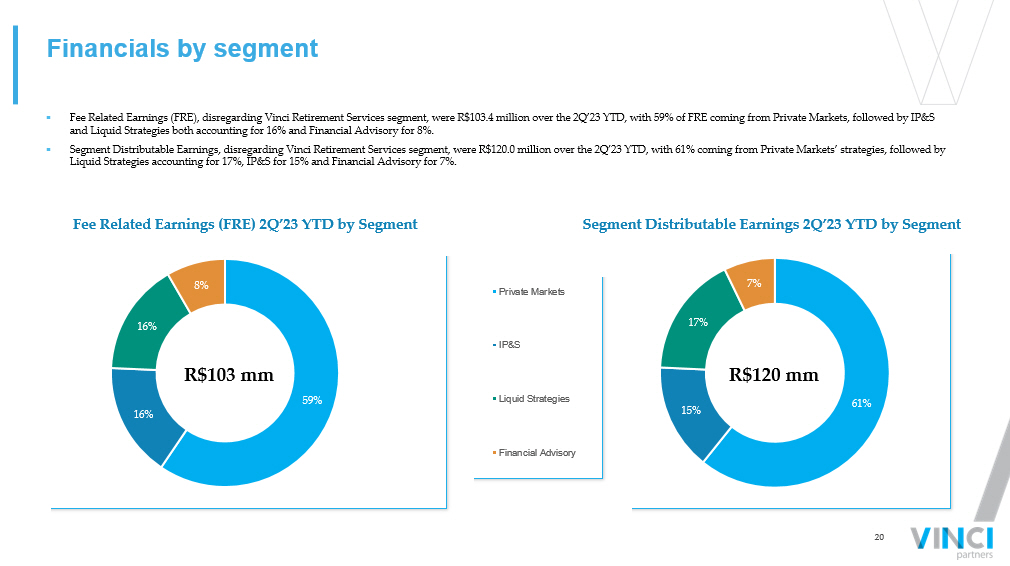
20 61% 15% 17% 7% Private Markets IP&S Liquid Strategies Financial Advisory 59% 16% 16% 8% Financials by segment ▪ Fee Related Earnings (FRE), disregarding Vinci Retirement Services segment, were R$103.4 million over the 2Q’23 YTD, with 59% of FRE coming from Private Markets, followed by IP&S and Liquid Strategies both accounting for 16% and Financial Advisory for 8%. ▪ Segment Distributable Earnings, disregarding Vinci Retirement Services segment, were R$120.0 million over the 2Q’23 YTD, with 61 % coming from Private Markets’ strategies, followed by Liquid Strategies accounting for 17%, IP&S for 15% and Financial Advisory for 7%. Segment Distributable Earnings 2Q’23 YTD by Segment Fee Related Earnings (FRE) 2Q’23 YTD by Segment R$103 mm R$120 mm
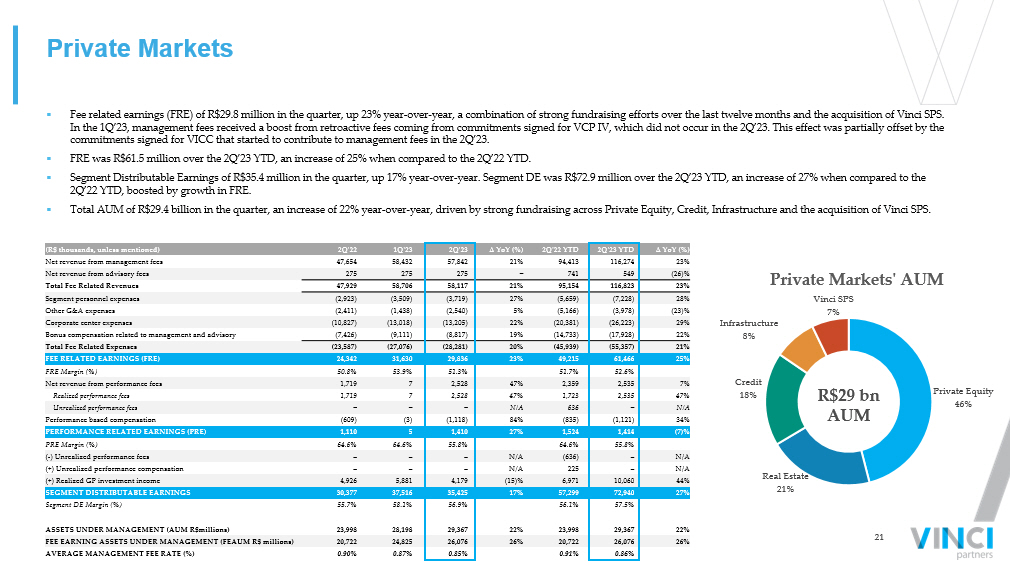
21 Private Equity 46% Real Estate 21% Credit 18% Infrastructure 8% Vinci SPS 7% Private Markets' AUM (R$ thousands, unless mentioned) 2Q'22 1Q'23 2Q'23 ∆ YoY (%) 2Q'22 YTD 2Q'23 YTD ∆ YoY (%) Net revenue from management fees 47,654 58,432 57,842 21% 94,413 116,274 23% Net revenue from advisory fees 275 275 275 – 741 549 (26)% Total Fee Related Revenues 47,929 58,706 58,117 21% 95,154 116,823 23% Segment personnel expenses (2,923) (3,509) (3,719) 27% (5,659) (7,228) 28% Other G&A expenses (2,411) (1,438) (2,540) 5% (5,166) (3,978) (23)% Corporate center expenses (10,827) (13,018) (13,205) 22% (20,381) (26,223) 29% Bonus compensation related to management and advisory (7,426) (9,111) (8,817) 19% (14,733) (17,928) 22% Total Fee Related Expenses (23,587) (27,076) (28,281) 20% (45,939) (55,357) 21% FEE RELATED EARNINGS (FRE) 24,342 31,630 29,836 23% 49,215 61,466 25% FRE Margin (%) 50.8% 53.9% 51.3% 51.7% 52.6% Net revenue from performance fees 1,719 7 2,528 47% 2,359 2,535 7% Realized performance fees 1,719 7 2,528 47% 1,723 2,535 47% Unrealized performance fees – – – N/A 636 – N/A Performance based compensation (609) (3) (1,118) 84% (835) (1,121) 34% PERFORMANCE RELATED EARNINGS (PRE) 1,110 5 1,410 27% 1,524 1,414 (7)% PRE Margin (%) 64.6% 64.6% 55.8% 64.6% 55.8% ( - ) Unrealized performance fees – – – N/A (636) – N/A (+) Unrealized performance compensation – – – N/A 225 – N/A (+) Realized GP investment income 4,926 5,881 4,179 (15)% 6,971 10,060 44% SEGMENT DISTRIBUTABLE EARNINGS 30,377 37,516 35,425 17% 57,299 72,940 27% Segment DE Margin (%) 55.7% 58.1% 56.9% 56.1% 57.5% ASSETS UNDER MANAGEMENT (AUM R$millions) 23,998 28,198 29,367 22% 23,998 29,367 22% FEE EARNING ASSETS UNDER MANAGEMENT (FEAUM R$ millions) 20,722 24,825 26,076 26% 20,722 26,076 26% AVERAGE MANAGEMENT FEE RATE (%) 0.90% 0.87% 0.85% 0.91% 0.86% Private Markets R$29 bn AUM ▪ Fee related earnings (FRE) of R$29.8 million in the quarter, up 23% year - over - year, a combination of strong fundraising efforts over the last twelve months and the acquisition of Vinci SPS. In the 1Q’23, management fees received a boost from retroactive fees coming from commitments signed for VCP IV, which did not oc cur in the 2Q’23. This effect was partially offset by the commitments signed for VICC that started to contribute to management fees in the 2Q’23. ▪ FRE was R$61.5 million over the 2Q’23 YTD, an increase of 25% when compared to the 2Q’22 YTD. ▪ Segment Distributable Earnings of R$35.4 million in the quarter, up 17% year - over - year. Segment DE was R$72.9 million over the 2 Q’23 YTD, an increase of 27% when compared to the 2Q’22 YTD, boosted by growth in FRE. ▪ Total AUM of R$29.4 billion in the quarter, an increase of 22% year - over - year, driven by strong fundraising across Private Equit y, Credit, Infrastructure and the acquisition of Vinci SPS.
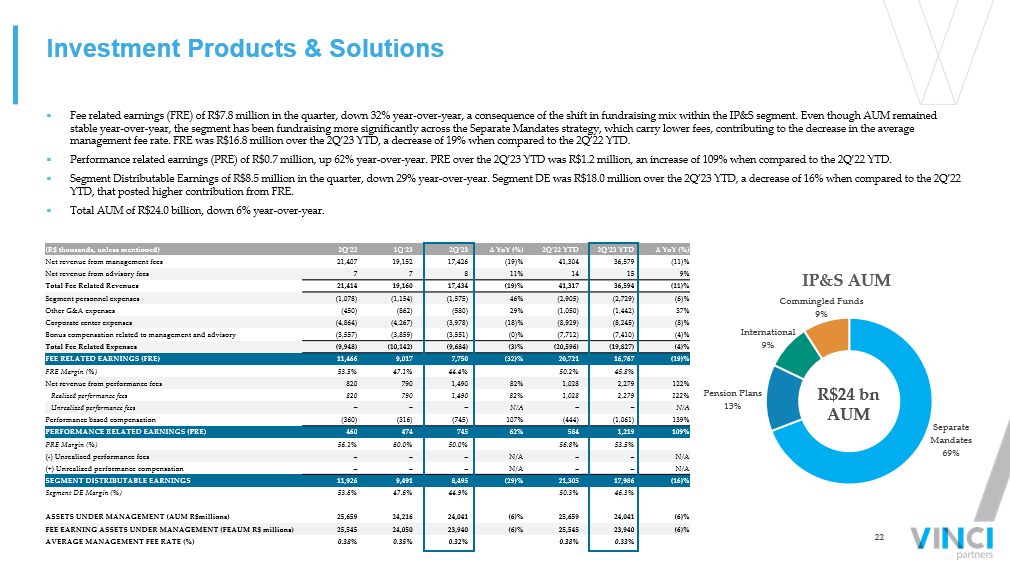
22 Separate Mandates 69% Pension Plans 13% International 9% Commingled Funds 9% IP&S AUM (R$ thousands, unless mentioned) 2Q'22 1Q'23 2Q'23 ∆ YoY (%) 2Q'22 YTD 2Q'23 YTD ∆ YoY (%) Net revenue from management fees 21,407 19,152 17,426 (19)% 41,304 36,579 (11)% Net revenue from advisory fees 7 7 8 11% 14 15 9% Total Fee Related Revenues 21,414 19,160 17,434 (19)% 41,317 36,594 (11)% Segment personnel expenses (1,078) (1,154) (1,575) 46% (2,905) (2,729) (6)% Other G&A expenses (450) (862) (580) 29% (1,050) (1,442) 37% Corporate center expenses (4,864) (4,267) (3,978) (18)% (8,929) (8,245) (8)% Bonus compensation related to management and advisory (3,557) (3,859) (3,551) (0)% (7,712) (7,410) (4)% Total Fee Related Expenses (9,948) (10,142) (9,684) (3)% (20,596) (19,827) (4)% FEE RELATED EARNINGS (FRE) 11,466 9,017 7,750 (32)% 20,721 16,767 (19)% FRE Margin (%) 53.5% 47.1% 44.4% 50.2% 45.8% Net revenue from performance fees 820 790 1,490 82% 1,028 2,279 122% Realized performance fees 820 790 1,490 82% 1,028 2,279 122% Unrealized performance fees – – – N/A – – N/A Performance based compensation (360) (316) (745) 107% (444) (1,061) 139% PERFORMANCE RELATED EARNINGS (PRE) 460 474 745 62% 584 1,219 109% PRE Margin (%) 56.1% 60.0% 50.0% 56.8% 53.5% ( - ) Unrealized performance fees – – – N/A – – N/A (+) Unrealized performance compensation – – – N/A – – N/A SEGMENT DISTRIBUTABLE EARNINGS 11,926 9,491 8,495 (29)% 21,305 17,986 (16)% Segment DE Margin (%) 53.6% 47.6% 44.9% 50.3% 46.3% ASSETS UNDER MANAGEMENT (AUM R$millions) 25,659 24,216 24,041 (6)% 25,659 24,041 (6)% FEE EARNING ASSETS UNDER MANAGEMENT (FEAUM R$ millions) 25,545 24,050 23,940 (6)% 25,545 23,940 (6)% AVERAGE MANAGEMENT FEE RATE (%) 0.38% 0.35% 0.32% 0.38% 0.33% Investment Products & Solutions ▪ Fee related earnings (FRE) of R$7.8 million in the quarter, down 32% year - over - year, a consequence of the shift in fundraising m ix within the IP&S segment. Even though AUM remained stable year - over - year, the segment has been fundraising more significantly across the Separate Mandates strategy, which carry lo wer fees, contributing to the decrease in the average management fee rate. FRE was R$16.8 million over the 2Q’23 YTD, a decrease of 19% when compared to the 2Q’22 YTD. ▪ Performance related earnings (PRE) of R$0.7 million, up 62% year - over - year. PRE over the 2Q’23 YTD was R$1.2 million, an increas e of 109% when compared to the 2Q’22 YTD. ▪ Segment Distributable Earnings of R$8.5 million in the quarter, down 29% year - over - year. Segment DE was R$18.0 million over the 2Q’23 YTD, a decrease of 16% when compared to the 2Q’22 YTD, that posted higher contribution from FRE. ▪ Total AUM of R$24.0 billion, down 6% year - over - year. R$24 bn AUM
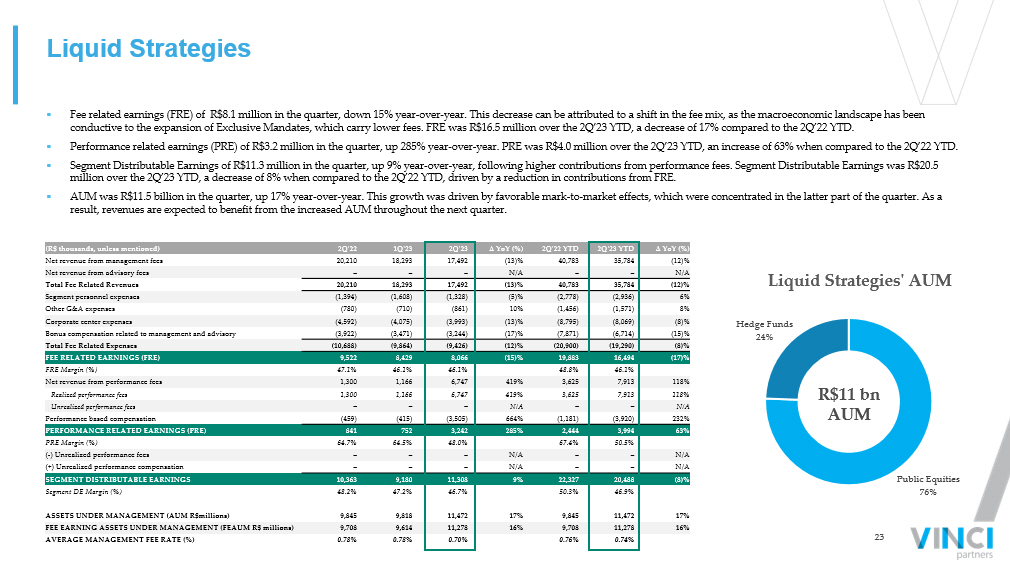
23 Public Equities 76% Hedge Funds 24% Liquid Strategies' AUM (R$ thousands, unless mentioned) 2Q'22 1Q'23 2Q'23 ∆ YoY (%) 2Q'22 YTD 2Q'23 YTD ∆ YoY (%) Net revenue from management fees 20,210 18,293 17,492 (13)% 40,783 35,784 (12)% Net revenue from advisory fees – – – N/A – – N/A Total Fee Related Revenues 20,210 18,293 17,492 (13)% 40,783 35,784 (12)% Segment personnel expenses (1,394) (1,608) (1,328) (5)% (2,778) (2,936) 6% Other G&A expenses (780) (710) (861) 10% (1,456) (1,571) 8% Corporate center expenses (4,592) (4,075) (3,993) (13)% (8,795) (8,069) (8)% Bonus compensation related to management and advisory (3,922) (3,471) (3,244) (17)% (7,871) (6,714) (15)% Total Fee Related Expenses (10,688) (9,864) (9,426) (12)% (20,900) (19,290) (8)% FEE RELATED EARNINGS (FRE) 9,522 8,429 8,066 (15)% 19,883 16,494 (17)% FRE Margin (%) 47.1% 46.1% 46.1% 48.8% 46.1% Net revenue from performance fees 1,300 1,166 6,747 419% 3,625 7,913 118% Realized performance fees 1,300 1,166 6,747 419% 3,625 7,913 118% Unrealized performance fees – – – N/A – – N/A Performance based compensation (459) (415) (3,505) 664% (1,181) (3,920) 232% PERFORMANCE RELATED EARNINGS (PRE) 841 752 3,242 285% 2,444 3,994 63% PRE Margin (%) 64.7% 64.5% 48.0% 67.4% 50.5% ( - ) Unrealized performance fees – – – N/A – – N/A (+) Unrealized performance compensation – – – N/A – – N/A SEGMENT DISTRIBUTABLE EARNINGS 10,363 9,180 11,308 9% 22,327 20,488 (8)% Segment DE Margin (%) 48.2% 47.2% 46.7% 50.3% 46.9% ASSETS UNDER MANAGEMENT (AUM R$millions) 9,845 9,818 11,472 17% 9,845 11,472 17% FEE EARNING ASSETS UNDER MANAGEMENT (FEAUM R$ millions) 9,708 9,614 11,278 16% 9,708 11,278 16% AVERAGE MANAGEMENT FEE RATE (%) 0.78% 0.78% 0.70% 0.76% 0.74% Liquid Strategies ▪ Fee related earnings (FRE) of R$8.1 million in the quarter, down 15% year - over - year. This decrease can be attributed to a shift in the fee mix, as the macroeconomic landscape has been conductive to the expansion of Exclusive Mandates, which carry lower fees. FRE was R$16.5 million over the 2Q’23 YTD, a decre ase of 17% compared to the 2Q’22 YTD. ▪ Performance related earnings (PRE) of R$3.2 million in the quarter, up 285% year - over - year. PRE was R$4.0 million over the 2Q’23 YTD, an increase of 63% when compared to the 2Q’22 YTD. ▪ Segment Distributable Earnings of R$11.3 million in the quarter, up 9% year - over - year, following higher contributions from perfo rmance fees. Segment Distributable Earnings was R$20.5 million over the 2Q’23 YTD, a decrease of 8% when compared to the 2Q’22 YTD, driven by a reduction in contributions from FRE. ▪ AUM was R$11.5 billion in the quarter, up 17% year - over - year. This growth was driven by favorable mark - to - market effects, which were concentrated in the latter part of the quarter. As a result, revenues are expected to benefit from the increased AUM throughout the next quarter. R$11 bn AUM
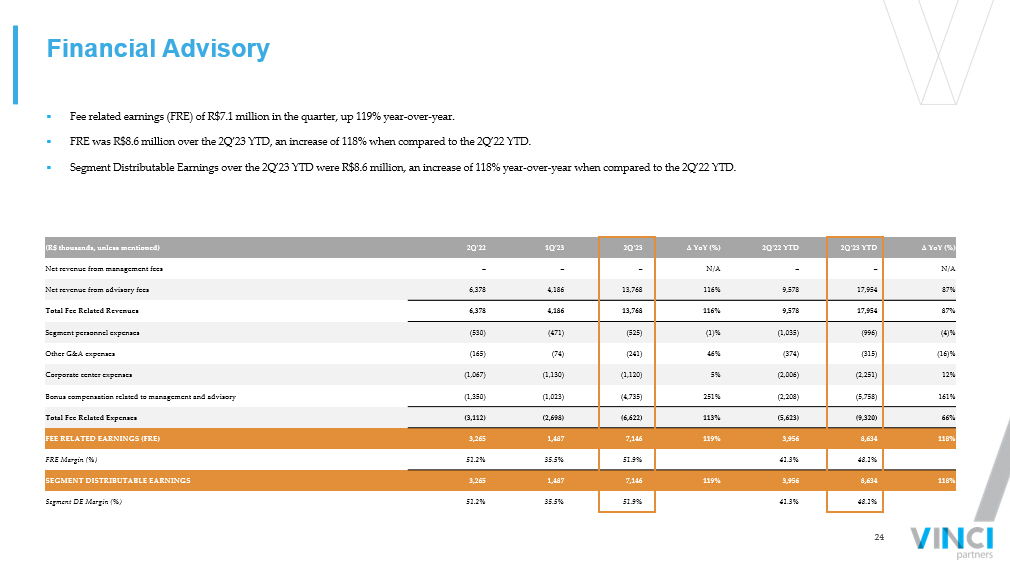
24 Financial Advisory ▪ Fee related earnings (FRE) of R$7.1 million in the quarter, up 119% year - over - year. ▪ FRE was R$8.6 million over the 2Q’23 YTD, an increase of 118% when compared to the 2Q’22 YTD. ▪ Segment Distributable Earnings over the 2Q’23 YTD were R$8.6 million, an increase of 118% year - over - year when compared to the 2Q ’22 YTD. (R$ thousands, unless mentioned) 2Q'22 1Q'23 2Q'23 ∆ YoY (%) 2Q'22 YTD 2Q'23 YTD ∆ YoY (%) Net revenue from management fees – – – N/A – – N/A Net revenue from advisory fees 6,378 4,186 13,768 116% 9,578 17,954 87% Total Fee Related Revenues 6,378 4,186 13,768 116% 9,578 17,954 87% Segment personnel expenses (530) (471) (525) (1)% (1,035) (996) (4)% Other G&A expenses (165) (74) (241) 46% (374) (315) (16)% Corporate center expenses (1,067) (1,130) (1,120) 5% (2,006) (2,251) 12% Bonus compensation related to management and advisory (1,350) (1,023) (4,735) 251% (2,208) (5,758) 161% Total Fee Related Expenses (3,112) (2,698) (6,622) 113% (5,623) (9,320) 66% FEE RELATED EARNINGS (FRE) 3,265 1,487 7,146 119% 3,956 8,634 118% FRE Margin (%) 51.2% 35.5% 51.9% 41.3% 48.1% SEGMENT DISTRIBUTABLE EARNINGS 3,265 1,487 7,146 119% 3,956 8,634 118% Segment DE Margin (%) 51.2% 35.5% 51.9% 41.3% 48.1%
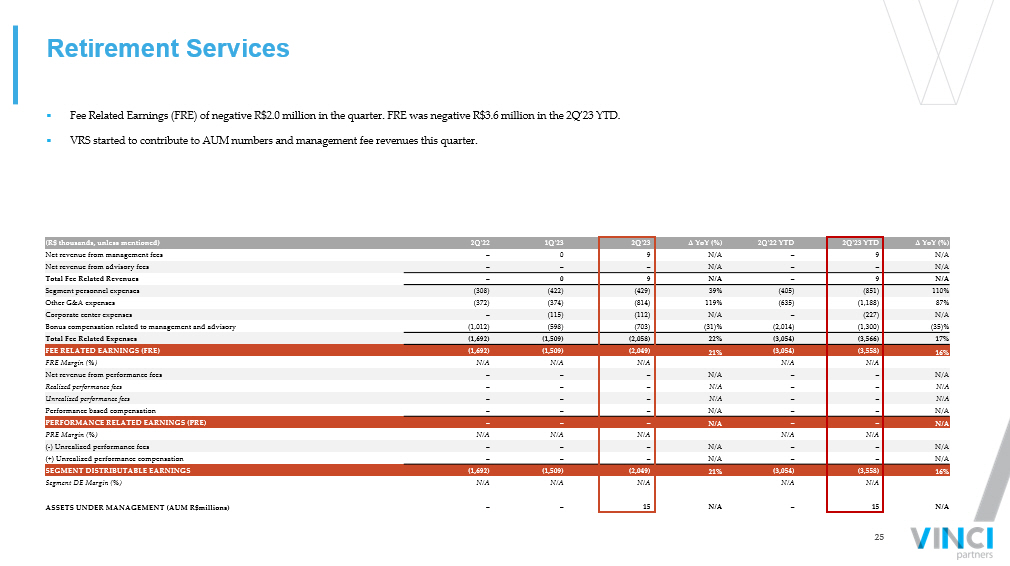
25 (R$ thousands, unless mentioned) 2Q'22 1Q'23 2Q'23 ∆ YoY (%) 2Q'22 YTD 2Q'23 YTD ∆ YoY (%) Net revenue from management fees – 0 9 N/A – 9 N/A Net revenue from advisory fees – – – N/A – – N/A Total Fee Related Revenues – 0 9 N/A – 9 N/A Segment personnel expenses (308) (422) (429) 39% (405) (851) 110% Other G&A expenses (372) (374) (814) 119% (635) (1,188) 87% Corporate center expenses – (115) (112) N/A – (227) N/A Bonus compensation related to management and advisory (1,012) (598) (703) (31)% (2,014) (1,300) (35)% Total Fee Related Expenses (1,692) (1,509) (2,058) 22% (3,054) (3,566) 17% FEE RELATED EARNINGS (FRE) (1,692) (1,509) (2,049) 21% (3,054) (3,558) 16% FRE Margin (%) N/A N/A N/A N/A N/A Net revenue from performance fees – – – N/A – – N/A Realized performance fees – – – N/A – – N/A Unrealized performance fees – – – N/A – – N/A Performance based compensation – – – N/A – – N/A PERFORMANCE RELATED EARNINGS (PRE) – – – N/A – – N/A PRE Margin (%) N/A N/A N/A N/A N/A ( - ) Unrealized performance fees – – – N/A – – N/A (+) Unrealized performance compensation – – – N/A – – N/A SEGMENT DISTRIBUTABLE EARNINGS (1,692) (1,509) (2,049) 21% (3,054) (3,558) 16% Segment DE Margin (%) N/A N/A N/A N/A N/A ASSETS UNDER MANAGEMENT (AUM R$millions) – – 15 N/A – 15 N/A Retirement Services ▪ Fee Related Earnings (FRE) of negative R$2.0 million in the quarter. FRE was negative R$3.6 million in the 2Q’23 YTD. ▪ VRS started to contribute to AUM numbers and management fee revenues this quarter.

Supplement Details
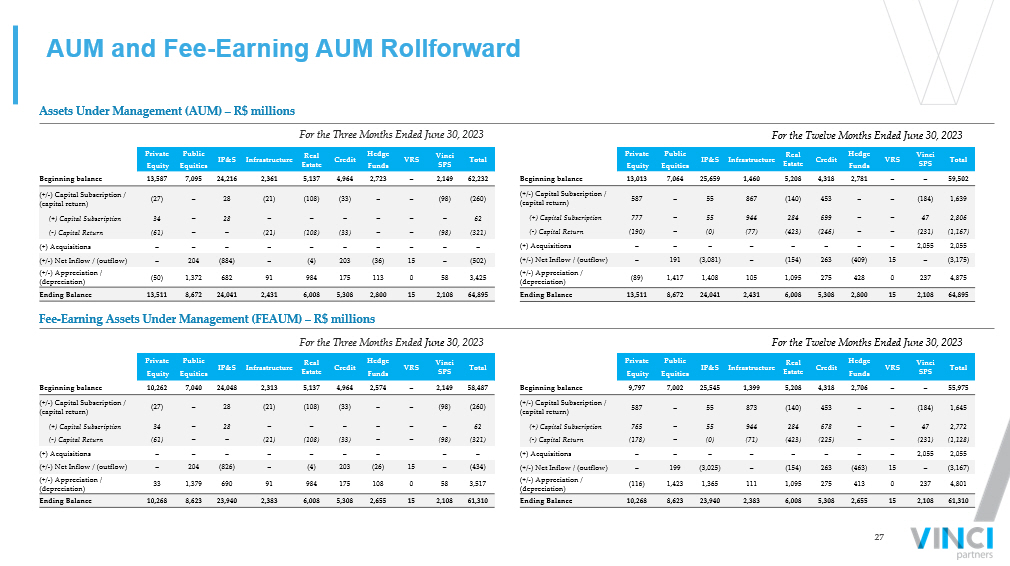
27 AUM and Fee - Earning AUM Rollforward Assets Under Management (AUM) – R$ millions Fee - Earning Assets Under Management (FEAUM) – R$ millions For the Three Months Ended June 30, 2023 For the Three Months Ended June 30 , 2023 For the Twelve Months Ended June 30, 2023 For the Twelve Months Ended June 30, 2023 Private Public IP&S Infrastructure Real Estate Credit Hedge VRS Vinci SPS Total Equity Equities Funds Beginning balance 13,587 7,095 24,216 2,361 5,137 4,964 2,723 – 2,149 62,232 (+/ - ) Capital Subscription / (capital return) (27) – 28 (21) (108) (33) – – (98) (260) (+) Capital Subscription 34 – 28 – – – – – – 62 ( - ) Capital Return (61) – – (21) (108) (33) – – (98) (321) (+) Acquisitions – – – – – – – – – – (+/ - ) Net Inflow / (outflow) – 204 (884) – (4) 203 (36) 15 – (502) (+/ - ) Appreciation / (depreciation) (50) 1,372 682 91 984 175 113 0 58 3,425 Ending Balance 13,511 8,672 24,041 2,431 6,008 5,308 2,800 15 2,108 64,895 Private Public IP&S Infrastructure Real Estate Credit Hedge VRS Vinci SPS Total Equity Equities Funds Beginning balance 13,013 7,064 25,659 1,460 5,208 4,318 2,781 – – 59,502 (+/ - ) Capital Subscription / (capital return) 587 – 55 867 (140) 453 – – (184) 1,639 (+) Capital Subscription 777 – 55 944 284 699 – – 47 2,806 ( - ) Capital Return (190) – (0) (77) (423) (246) – – (231) (1,167) (+) Acquisitions – – – – – – – – 2,055 2,055 (+/ - ) Net Inflow / (outflow) – 191 (3,081) – (154) 263 (409) 15 – (3,175) (+/ - ) Appreciation / (depreciation) (89) 1,417 1,408 105 1,095 275 428 0 237 4,875 Ending Balance 13,511 8,672 24,041 2,431 6,008 5,308 2,800 15 2,108 64,895 Private Public IP&S Infrastructure Real Estate Credit Hedge VRS Vinci SPS Total Equity Equities Funds Beginning balance 10,262 7,040 24,048 2,313 5,137 4,964 2,574 – 2,149 58,487 (+/ - ) Capital Subscription / (capital return) (27) – 28 (21) (108) (33) – – (98) (260) (+) Capital Subscription 34 – 28 – – – – – – 62 ( - ) Capital Return (61) – – (21) (108) (33) – – (98) (321) (+) Acquisitions – – – – – – – – – (+/ - ) Net Inflow / (outflow) – 204 (826) – (4) 203 (26) 15 – (434) (+/ - ) Appreciation / (depreciation) 33 1,379 690 91 984 175 108 0 58 3,517 Ending Balance 10,268 8,623 23,940 2,383 6,008 5,308 2,655 15 2,108 61,310 Private Public IP&S Infrastructure Real Estate Credit Hedge VRS Vinci SPS Total Equity Equities Funds Beginning balance 9,797 7,002 25,545 1,399 5,208 4,318 2,706 – – 55,975 (+/ - ) Capital Subscription / (capital return) 587 – 55 873 (140) 453 – – (184) 1,645 (+) Capital Subscription 765 – 55 944 284 678 – – 47 2,772 ( - ) Capital Return (178) – (0) (71) (423) (225) – – (231) (1,128) (+) Acquisitions – – – – – – – – 2,055 2,055 (+/ - ) Net Inflow / (outflow) – 199 (3,025) – (154) 263 (463) 15 – (3,167) (+/ - ) Appreciation / (depreciation) (116) 1,423 1,365 111 1,095 275 413 0 237 4,801 Ending Balance 10,268 8,623 23,940 2,383 6,008 5,308 2,655 15 2,108 61,310
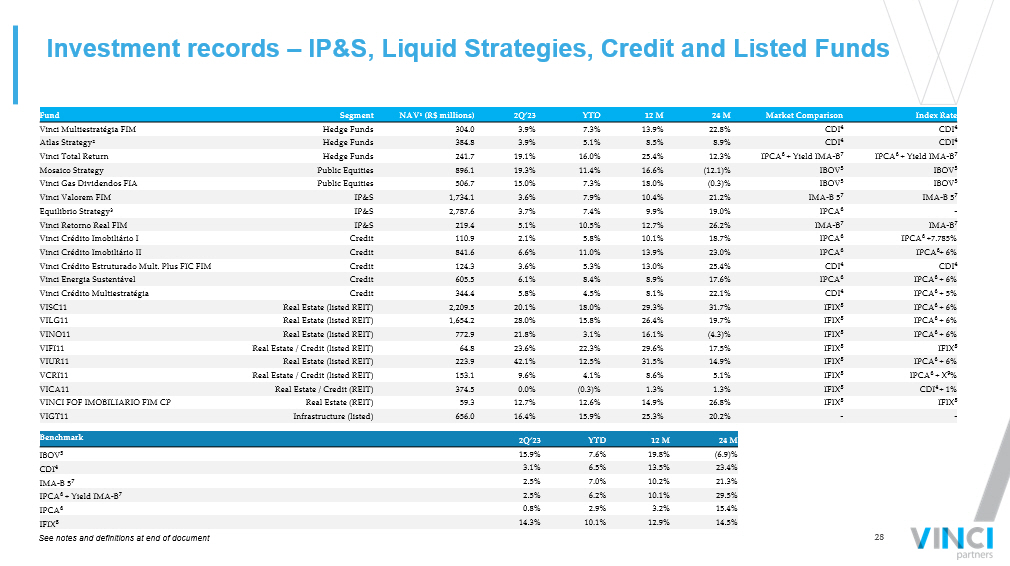
28 Fund Segment NAV¹ (R$ millions) 2Q’23 YTD 12 M 24 M Market Comparison Index Rate Vinci Multiestratégia FIM Hedge Funds 304.0 3.9% 7.3% 13.9% 22.8% CDI 4 CDI 4 Atlas Strategy² Hedge Funds 384.8 3.9% 5.1% 8.5% 8.9% CDI 4 CDI 4 Vinci Total Return Hedge Funds 241.7 19.1% 16.0% 25.4% 12.3% IPCA 6 + Yield IMA - B 7 IPCA 6 + Yield IMA - B 7 Mosaico Strategy Public Equities 896.1 19.3% 11.4% 16.6% (12.1)% IBOV 5 IBOV 5 Vinci Gas Dividendos FIA Public Equities 506.7 15.0% 7.3% 18.0% (0.3)% IBOV 5 IBOV 5 Vinci Valorem FIM IP&S 1,734.1 3.6% 7.9% 10.4% 21.2% IMA - B 5 7 IMA - B 5 7 Equilibrio Strategy³ IP&S 2,787.6 3.7% 7.4% 9.9% 19.0% IPCA 6 - Vinci Retorno Real FIM IP&S 219.4 5.1% 10.5% 12.7% 26.2% IMA - B 7 IMA - B 7 Vinci Crédito Imobiliário I Credit 110.9 2.1% 5.8% 10.1% 18.7% IPCA 6 IPCA 6 +7.785% Vinci Crédito Imobiliário II Credit 841.6 6.6% 11.0% 13.9% 23.0% IPCA 6 IPCA 6 + 6% Vinci Crédito Estruturado Mult. Plus FIC FIM Credit 124.3 3.6% 5.3% 13.0% 25.4% CDI 4 CDI 4 Vinci Energia Sustentável Credit 605.5 6.1% 8.4% 8.9% 17.6% IPCA 6 IPCA 6 + 6% Vinci Crédito Multiestratégia Credit 344.4 5.8% 4.5% 8.1% 22.1% CDI 4 IPCA 6 + 5% VISC11 Real Estate (listed REIT) 2,209.5 20.1% 18.0% 29.3% 31.7% IFIX 8 IPCA 6 + 6% VILG11 Real Estate (listed REIT) 1,654.2 28.0% 15.8% 26.4% 19.7% IFIX 8 IPCA 6 + 6% VINO11 Real Estate (listed REIT) 772.9 21.8% 3.1% 16.1% (4.3)% IFIX 8 IPCA 6 + 6% VIFI11 Real Estate / Credit (listed REIT) 64.8 23.6% 22.3% 29.6% 17.5% IFIX 8 IFIX 8 VIUR11 Real Estate (listed REIT) 223.9 42.1% 12.5% 31.5% 14.9% IFIX 8 IPCA 6 + 6% VCRI11 Real Estate / Credit (listed REIT) 153.1 9.6% 4.1% 8.6% 5.1% IFIX 8 IPCA 6 + X 9 % VICA11 Real Estate / Credit (REIT) 374.5 0.0% (0.3)% 1.3% 1.3% IFIX 8 CDI 4 + 1% VINCI FOF IMOBILIARIO FIM CP Real Estate (REIT) 59.3 12.7% 12.6% 14.9% 26.8% IFIX 8 IFIX 8 VIGT11 Infrastructure (listed) 656.0 16.4% 15.9% 25.3% 20.2% - - Investment records – IP&S, Liquid Strategies, Credit and Listed Funds Benchmark 2Q’23 YTD 12 M 24 M IBOV 5 15.9% 7.6% 19.8% (6.9)% CDI 4 3.1% 6.5% 13.5% 23.4% IMA - B 5 7 2.5% 7.0% 10.2% 21.3% IPCA 6 + Yield IMA - B 7 2.5% 6.2% 10.1% 29.5% IPCA 6 0.8% 2.9% 3.2% 15.4% IFIX 8 14.3% 10.1% 12.9% 14.5% See notes and definitions at end of document
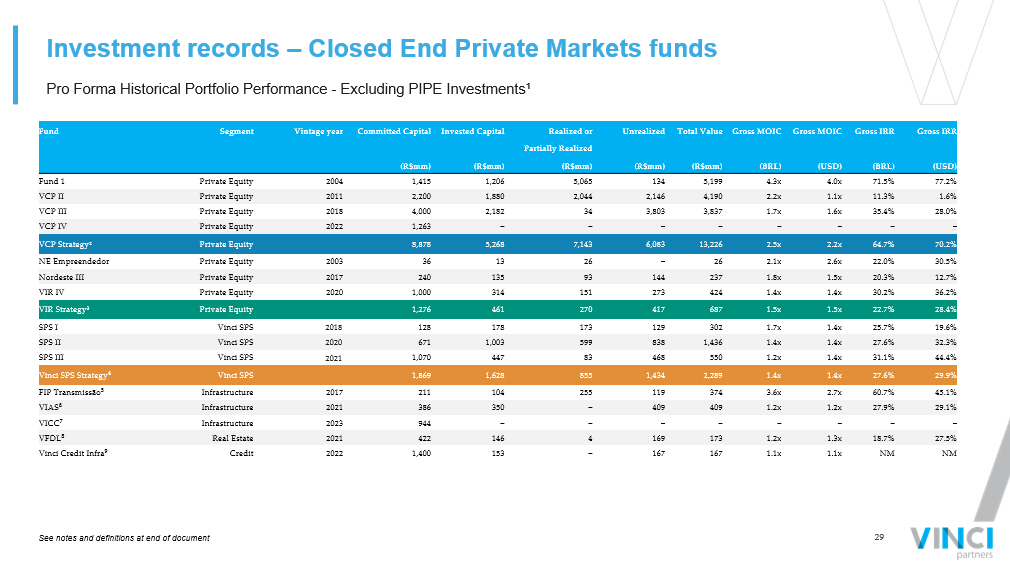
29 Fund Segment Vintage year Committed Capital Invested Capital Realized or Unrealized Total Value Gross MOIC Gross MOIC Gross IRR Gross IRR Partially Realized (R$mm) (R$mm) (R$mm) (R$mm) (R$mm) (BRL) (USD) (BRL) (USD) Fund 1 Private Equity 2004 1,415 1,206 5,065 134 5,199 4.3x 4.0x 71.5% 77.2% VCP II Private Equity 2011 2,200 1,880 2,044 2,146 4,190 2.2x 1.1x 11.3% 1.6% VCP III Private Equity 2018 4,000 2,182 34 3,803 3,837 1.7x 1.6x 35.4% 28.0% VCP IV Private Equity 2022 1,263 – – – – – – – – VCP Strategy² Private Equity 8,878 5,268 7,143 6,083 13,226 2.5x 2.2x 64.7% 70.2% NE Empreendedor Private Equity 2003 36 13 26 – 26 2.1x 2.6x 22.0% 30.5% Nordeste III Private Equity 2017 240 135 93 144 237 1.8x 1.5x 20.3% 12.7% VIR IV Private Equity 2020 1,000 314 151 273 424 1.4x 1.4x 30.2% 36.2% VIR Strategy³ Private Equity 1,276 461 270 417 687 1.5x 1.5x 22.7% 28.4% SPS I Vinci SPS 2018 128 178 173 129 302 1.7x 1.4x 25.7% 19.6% SPS II Vinci SPS 2020 671 1,003 599 838 1,436 1.4x 1.4x 27.6% 32.3% SPS III Vinci SPS 2021 1,070 447 83 468 550 1.2x 1.4x 31.1% 44.4% Vinci SPS Strategy 4 Vinci SPS 1,869 1,628 855 1,434 2,289 1.4x 1.4x 27.6% 29.9% FIP Transmissão 5 Infrastructure 2017 211 104 255 119 374 3.6x 2.7x 60.7% 45.1% VIAS 6 Infrastructure 2021 386 350 – 409 409 1.2x 1.2x 27.9% 29.1% VICC 7 Infrastructure 2023 944 – – – – – – – – VFDL 8 Real Estate 2021 422 146 4 169 173 1.2x 1.3x 18.7% 27.5% Vinci Credit Infra 9 Credit 2022 1,400 153 – 167 167 1.1x 1.1x NM NM Pro Forma Historical Portfolio Performance - Excluding PIPE Investments¹ Investment records – Closed End Private Markets funds See notes and definitions at end of document
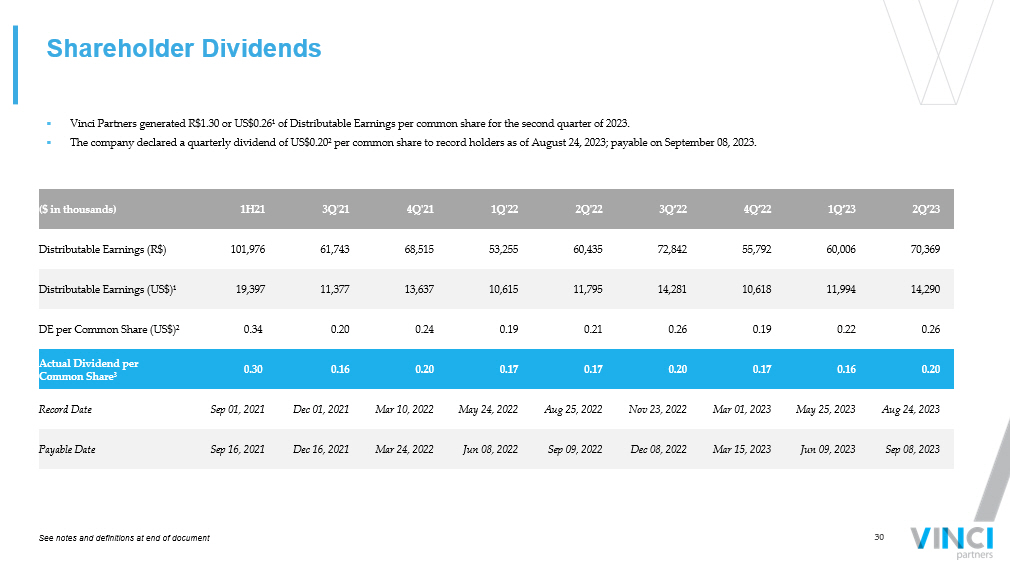
30 Shareholder Dividends ($ in thousands) 1H21 3Q ' 21 4Q'21 1Q'22 2Q'22 3Q’22 4Q’22 1Q’23 2Q’23 Distributable Earnings (R$) 101,976 61,743 68,515 53,255 60,435 72,842 55,792 60,006 70,369 Distributable Earnings (US$)¹ 19,397 11,377 13,637 10,615 11,795 14,281 10,618 11,994 14,290 DE per Common Share (US$)² 0.34 0.20 0.24 0.19 0.21 0.26 0.19 0.22 0.26 Actual Dividend per Common Share³ 0.30 0.16 0.20 0.17 0.17 0.20 0.17 0.16 0.20 Record Date Sep 01, 2021 Dec 01, 2021 Mar 10, 2022 May 24, 2022 Aug 25, 2022 Nov 23, 2022 Mar 01, 2023 May 25, 2023 Aug 24, 2023 Payable Date Sep 16, 2021 Dec 16, 2021 Mar 24, 2022 Jun 08, 2022 Sep 09, 2022 Dec 08, 2022 Mar 15, 2023 Jun 09, 2023 Sep 08, 2023 ▪ Vinci Partners generated R$1.30 or US$0.26¹ of Distributable Earnings per common share for the second quarter of 2023. ▪ The company declared a quarterly dividend of US$0.20² per common share to record holders as of August 24, 2023; payable on Se pte mber 08 , 2023. See notes and definitions at end of document
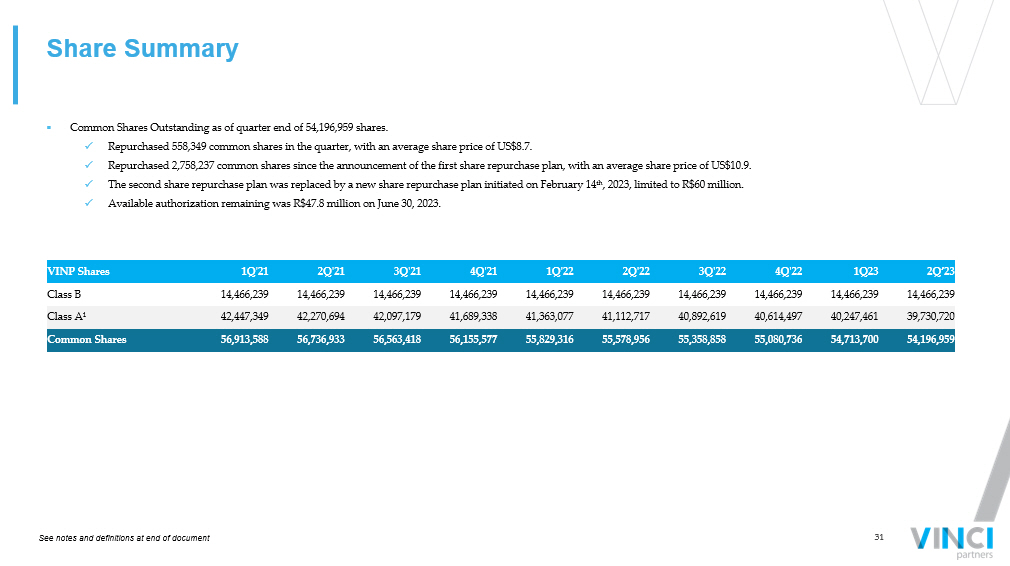
31 Share Summary ▪ Common Shares Outstanding as of quarter end of 54,196,959 shares. x Repurchased 558,349 common shares in the quarter, with an average share price of US$8.7. x Repurchased 2,758,237 common shares since the announcement of the first share repurchase plan, with an average share price of US $10.9. x The second share repurchase plan was replaced by a new share repurchase plan initiated on February 14 th , 2023, limited to R$60 million. x Available authorization remaining was R$47.8 million on June 30, 2023. VINP Shares 1Q ' 21 2Q ' 21 3Q ' 21 4Q'21 1Q'22 2Q'22 3Q'22 4Q'22 1Q23 2Q’23 Class B 14,466,239 14,466,239 14,466,239 14,466,239 14,466,239 14,466,239 14,466,239 14,466,239 14,466,239 14,466,239 Class A¹ 42,447,349 42,270,694 42,097,179 41,689,338 41,363,077 41,112,717 40,892,619 40,614,497 40,247,461 39,730,720 Common Shares 56,913,588 56,736,933 56,563,418 56,155,577 55,829,316 55,578,956 55,358,858 55,080,736 54,713,700 54,196,959 See notes and definitions at end of document
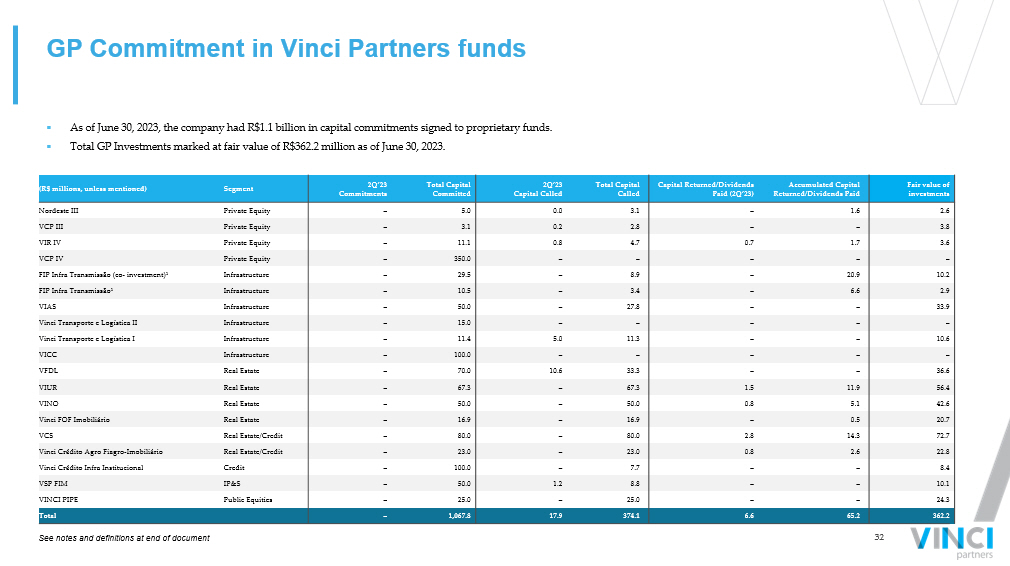
32 (R$ millions, unless mentioned) Segment 2Q’23 Commitments Total Capital Committed 2Q’23 Capital Called Total Capital Called Capital Returned/Dividends Paid (2Q’23) Accumulated Capital Returned/Dividends Paid Fair value of investments Nordeste III Private Equity – 5.0 0.0 3.1 – 1.6 2.6 VCP III Private Equity – 3.1 0.2 2.8 – – 3.8 VIR IV Private Equity – 11.1 0.8 4.7 0.7 1.7 3.6 VCP IV Private Equity – 350.0 – – – – – FIP Infra Transmissão (co - investment)¹ Infrastructure – 29.5 – 8.9 – 20.9 10.2 FIP Infra Transmissão¹ Infrastructure – 10.5 – 3.4 – 6.6 2.9 VIAS Infrastructure – 50.0 – 27.8 – – 33.9 Vinci Transporte e Logística II Infrastructure – 15.0 – – – – – Vinci Transporte e Logística I Infrastructure – 11.4 5.0 11.3 – – 10.6 VICC Infrastructure – 100.0 – – – – – VFDL Real Estate – 70.0 10.6 33.3 – – 36.6 VIUR Real Estate – 67.3 – 67.3 1.5 11.9 56.4 VINO Real Estate – 50.0 – 50.0 0.8 5.1 42.6 Vinci FOF Imobiliário Real Estate – 16.9 – 16.9 – 0.5 20.7 VCS Real Estate/Credit – 80.0 – 80.0 2.8 14.3 72.7 Vinci Crédito Agro Fiagro - Imobiliário Real Estate/Credit – 23.0 – 23.0 0.8 2.6 22.8 Vinci Crédito Infra Institucional Credit – 100.0 – 7.7 – – 8.4 VSP FIM IP&S – 50.0 1.2 8.8 – – 10.1 VINCI PIPE Public Equities – 25.0 – 25.0 – – 24.3 Total – 1,067.8 17.9 374.1 6.6 65.2 362.2 GP Commitment in Vinci Partners funds ▪ As of June 30, 2023, the company had R$1.1 billion in capital commitments signed to proprietary funds. ▪ Total GP Investments marked at fair value of R$362.2 million as of June 30, 2023. See notes and definitions at end of document

33 28% 21% 18% 10% 9% 6% 5% 3% Private Equity IP&S Public Equities Credit Real Estate Hedge Funds Infrastructure Vinci SPS PERFORMANCE FEE ELIGIBLE AUM (PEAUM) Strategy/Fund AUM R$mm Index type Index Rate Status Offshore Vehicles 3,692 Preferred Return w/ Catch - Up² USD + 8% Within investment period Onshore Vehicles 3,314 Preferred Return w/ Catch - Up² IPCA 5 + 8% Within investment period Nordeste III 228 Preferred Return w/ Catch - Up² IPCA 5 + 8.5% Currently generating performance Teman Pier 140 Preferred Return w/ Catch - Up² IPCA 5 + 5% Within investment period Others 3,196 Not expected to pay performance Total Private Equity 10,570 Vinci Valorem 1,912 Hurdle³ IMAB 5 6 Currently generating performance Separate Mandates 1,586 Hurdle³ IBOV 7 + alpha Currently generating performance International¹ 1,239 Currently generating performance Commingled Funds 655 Hurdle³ IBOV 7 + alpha Currently generating performance VSP 210 Preferred Return w/ Catch - Up² IPCA 5 + 8% Currently generating performance Others 2,341 Currently generating performance Total IP&S 7,944 SWF 4,517 Hurdle³ FTSE 8 Currently generating performance Mosaico Strategy 952 Hurdle³ IBOV 7 Currently generating performance Vinci Gas Dividendos 507 Hurdle³ IBOV 7 Currently generating performance Others 723 Currently generating performance Total Public Equities 6,699 Listed REITs 2,669 Hurdle³ IPCA 5 + 6% Currently generating performance VFDL 436 Preferred Return 4 IPCA 5 + 6% Within investment period FOF Strategy 99 Hurdle³ IFIX 9 Currently generating performance Others 234 Currently generating performance Total Real Estate 3,438 VCI II 842 Preferred Return 4 IPCA 5 + 6% Within investment period VES 606 Preferred Return 4 IPCA 5 + 6% Within investment period VCM FIM 367 Preferred Return 4 IPCA 5 + 5% Within investment period Energia FIM 397 Hurdle³ CDI 10 Currently generating performance VCS 108 Hurdle³ IPCA 5 + 5% Within investment period VCI I 111 Not expected to pay performance FOF Strategy 26 Hurdle³ IFIX 9 Currently generating performance VCE 390 Hurdle³ CDI 10 Currently generating performance Others 969 Currently generating performance Total Credit 3,815 Atlas Strategy 445 Hurdle³ CDI 10 Currently generating performance Vinci Multiestratégia 304 Hurdle³ CDI 10 Currently generating performance Vinci Total Return 443 Hurdle³ IPCA 5 + Yield IMAB 11 Currently generating performance Others 1,275 Currently generating performance Total Hedge Funds 2,466 VIAS 424 Preferred Return 4 IPCA 5 + 6% Within investment period Transportation and Logistics strategy 151 Preferred Return 4 IPCA 5 + 6% Within investment period FIP Infra Transmissão 58 Preferred Return 4 IPCA 5 + 8% Currently generating performance VICC 928 Preferred Return 4 IPCA 5 Within investment period Others 156 Not expected to pay performance Total Infrastructure 1,716 Special Situations 1,135 Preferred Return 4 CDI 10 Within investment period Total Vinci SPS 1,135 PEAUM TOTAL 37,783 Significant exposure to performance fee - eligible AUM ▪ Total Performance fee eligible AUM (PEAUM) of R$37.8 billion. ▪ Hurdle rate funds charge performance based on the fund’s return over its benchmark, generally with a high - watermark clause, except for the SWF mandate in Public Equities. ▪ Within our Private Market strategies, R$12 billion in AUM comes from “preferred return” funds with carried interest, that are still in investment period. PEAUM R$38 bn See notes and definitions at end of document

Reconciliations and Disclosures

35 (R$ thousands, unless mentioned) 2Q'22 1Q'23 2Q'23 ∆ YoY(%) 2Q'22 YTD 2Q'23 YTD ∆ YoY (%) REVENUES Net revenue from management fees 89,271 95,877 92,769 4% 176,500 188,646 7% Net revenue from performance fees 3,839 1,963 10,765 180% 7,011 12,728 82% Realized performance fees 3,839 1,963 10,765 180% 6,375 12,728 100% Unrealized performance fees – – – N/A 636 – N/A Net revenue from advisory 6,659 4,468 14,050 111% 10,333 18,518 79% Total net revenues from services rendered 99,769 102,308 117,584 18% 193,844 219,892 13% EXPENSES Bonus related to management and advisory (17,267) (18,062) (21,049) 22% (34,539) (39,111) 13% Performance based compensation (1,427) (733) (5,368) 276% (2,459) (6,101) 148% Realized (1,427) (733) (5,368) 276% (2,234) (6,101) 173% Unrealized – – – N/A (225) – N/A Total compensation and benefits (18,694) (18,795) (26,417) 41% (36,997) (45,212) 22% Segment personnel expenses (6,233) (7,164) (7,577) 22% (12,782) (14,741) 15% Other general and administrative expenses (4,178) (3,458) (5,036) 21% (8,681) (8,494) (2)% Corporate center expenses (21,350) (22,606) (22,410) 5% (40,111) (45,016) 12% Total expenses (50,455) (52,023) (61,439) 22% (98,571) (113,462) 15% Operating profit 49,314 50,285 56,145 14% 95,273 106,430 12% OTHER ITEMS GP Investment income (7,211) (20,200) 34,651 N/A (11,380) 14,451 N/A Realized gain from GP investment income 4,926 5,881 4,179 (15)% 6,971 10,060 44% Unrealized gain from GP investment income (12,137) (26,081) 30,472 N/A (18,351) 4,391 N/A Financial income 21,193 20,089 30,183 42% 45,901 50,272 10% Realized gain from financial income 20,001 20,089 30,183 51% 44,997 50,272 12% Unrealized gain from financial income 1,192 – – N/A 904 – N/A Leasing expenses (2,400) (2,631) (2,517) 5% (4,872) (5,148) 6% Other items¹ 644 151 (11,573) N/A (492) (11,422) 2,222% Share Based Plan (2,468) (2,107) (3,493) 42% (3,204) (5,600) 75% Non - operational expenses² (962) – – N/A (6,071) – N/A Total Other Items 8,796 (4,698) 47,251 437% 19,882 42,553 114% Profit before income taxes 58,109 45,587 103,396 78% 115,154 148,983 29% ( - ) Income taxes ³ (11,711) (12,881) (11,844) 1% (23,450) (24,725) 5% NET INCOME 46,398 32,706 91,552 97% 91,704 124,258 35% (+) Non - operational expenses² including income tax related to realized expense 635 – – N/A 5,072 – N/A ( - ) Contingent consideration adjustment related to acquisitions 4 – (2,674) 4,804 – 2,130 ADJUSTED NET INCOME 47,033 30,032 96,356 105% 96,775 126,388 31% Financials - Income Statement (Unaudited) See notes and definitions at end of document
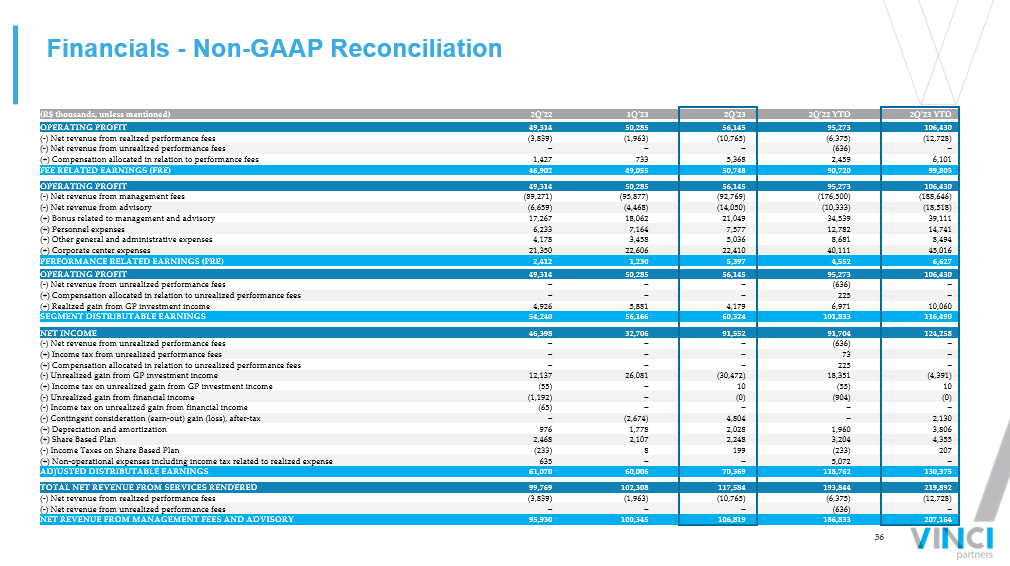
36 (R$ thousands, unless mentioned) 2Q'22 1Q'23 2Q'23 2Q'22 YTD 2Q'23 YTD OPERATING PROFIT 49,314 50,285 56,145 95,273 106,430 ( - ) Net revenue from realized performance fees (3,839) (1,963) (10,765) (6,375) (12,728) ( - ) Net revenue from unrealized performance fees – – – (636) – (+) Compensation allocated in relation to performance fees 1,427 733 5,368 2,459 6,101 FEE RELATED EARNINGS (FRE) 46,902 49,055 50,748 90,720 99,803 OPERATING PROFIT 49,314 50,285 56,145 95,273 106,430 ( - ) Net revenue from management fees (89,271) (95,877) (92,769) (176,500) (188,646) ( - ) Net revenue from advisory (6,659) (4,468) (14,050) (10,333) (18,518) (+) Bonus related to management and advisory 17,267 18,062 21,049 34,539 39,111 (+) Personnel expenses 6,233 7,164 7,577 12,782 14,741 (+) Other general and administrative expenses 4,178 3,458 5,036 8,681 8,494 (+) Corporate center expenses 21,350 22,606 22,410 40,111 45,016 PERFORMANCE RELATED EARNINGS (PRE) 2,412 1,230 5,397 4,552 6,627 OPERATING PROFIT 49,314 50,285 56,145 95,273 106,430 ( - ) Net revenue from unrealized performance fees – – – (636) – (+) Compensation allocated in relation to unrealized performance fees – – – 225 – (+) Realized gain from GP investment income 4,926 5,881 4,179 6,971 10,060 SEGMENT DISTRIBUTABLE EARNINGS 54,240 56,166 60,324 101,833 116,490 NET INCOME 46,398 32,706 91,552 91,704 124,258 ( - ) Net revenue from unrealized performance fees – – – (636) – (+) Income tax from unrealized performance fees – – – 73 – (+) Compensation allocated in relation to unrealized performance fees – – – 225 – ( - ) Unrealized gain from GP investment income 12,137 26,081 (30,472) 18,351 (4,391) (+) Income tax on unrealized gain from GP investment income (55) – 10 (55) 10 ( - ) Unrealized gain from financial income (1,192) – (0) (904) (0) ( - ) Income tax on unrealized gain from financial income (65) – – – – ( - ) Contingent consideration (earn - out) gain (loss), after - tax – (2,674) 4,804 – 2,130 (+) Depreciation and amortization 976 1,778 2,028 1,960 3,806 (+) Share Based Plan 2,468 2,107 2,248 3,204 4,355 ( - ) Income Taxes on Share Based Plan (233) 8 199 (233) 207 (+) Non - operational expenses including income tax related to realized expense 635 – – 5,072 – ADJUSTED DISTRIBUTABLE EARNINGS 61,070 60,006 70,369 118,762 130,375 TOTAL NET REVENUE FROM SERVICES RENDERED 99,769 102,308 117,584 193,844 219,892 ( - ) Net revenue from realized performance fees (3,839) (1,963) (10,765) (6,375) (12,728) ( - ) Net revenue from unrealized performance fees – – – (636) – NET REVENUE FROM MANAGEMENT FEES AND ADVISORY 95,930 100,345 106,819 186,833 207,164 Financials - Non - GAAP Reconciliation
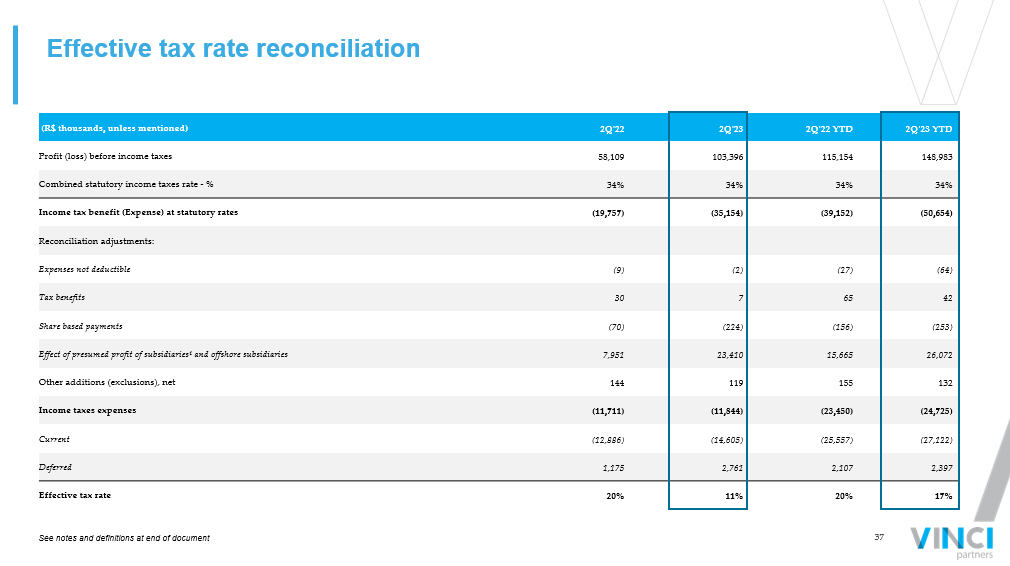
37 Effective tax rate reconciliation See notes and definitions at end of document (R$ thousands, unless mentioned) 2Q'22 2Q'23 2Q'22 YTD 2Q'23 YTD Profit (loss) before income taxes 58,109 103,396 115,154 148,983 Combined statutory income taxes rate - % 34% 34% 34% 34% Income tax benefit (Expense) at statutory rates (19,757) (35,154) (39,152) (50,654) Reconciliation adjustments: Expenses not deductible (9) (2) (27) (64) Tax benefits 30 7 65 42 Share based payments (70) (224) (156) (253) Effect of presumed profit of subsidiaries¹ and offshore subsidiaries 7,951 23,410 15,665 26,072 Other additions (exclusions), net 144 119 155 132 Income taxes expenses (11,711) (11,844) (23,450) (24,725) Current (12,886) (14,605) (25,557) (27,122) Deferred 1,175 2,761 2,107 2,397 Effective tax rate 20% 11% 20% 17%
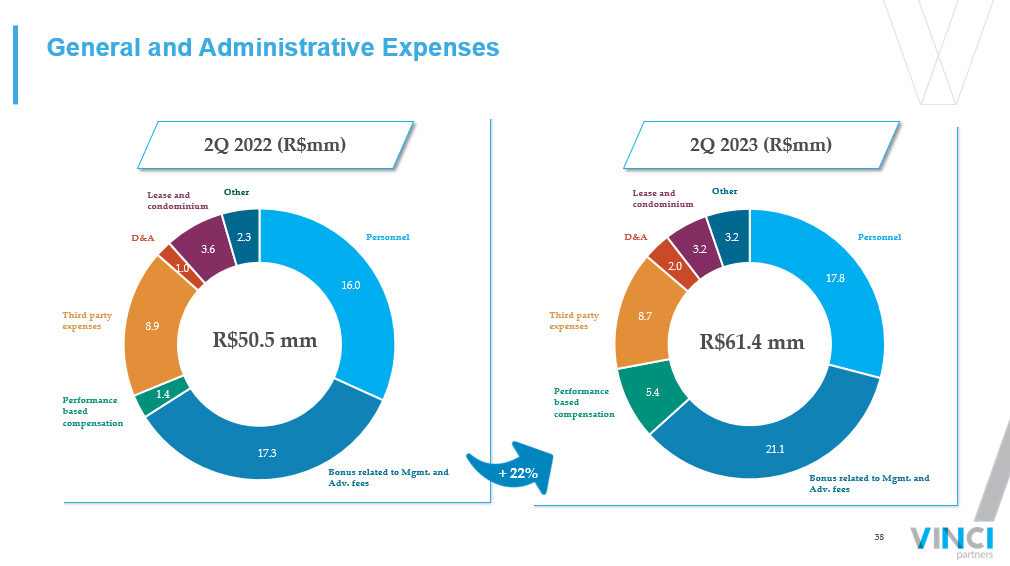
38 17.8 21.1 5.4 8.7 2.0 3.2 3.2 16.0 17.3 1.4 8.9 1.0 3.6 2.3 General and Administrative Expenses 2Q 2022 (R$mm) 2Q 2023 (R$mm) Lease and condominium Other Personnel Bonus related to Mgmt. and Adv. fees Performance based compensation Third party expenses D&A R$50.5 mm Personnel Bonus related to Mgmt. and Adv. fees Performance based compensation Third party expenses D&A Lease and condominium Other R$61.4 mm + 22%
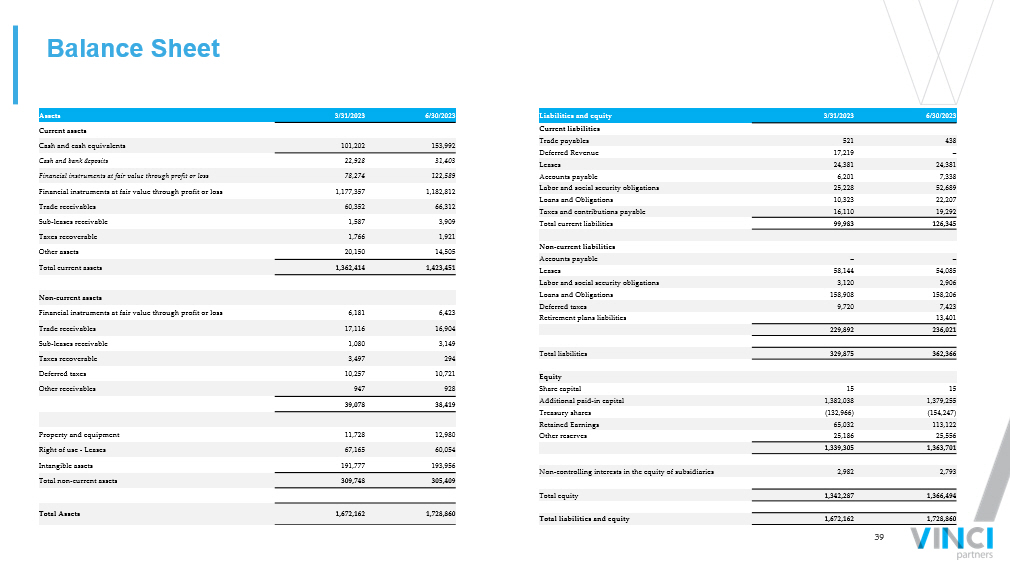
39 Liabilities and equity 3/31/2023 6/30/2023 Current liabilities Trade payables 521 438 Deferred Revenue 17,219 – Leases 24,381 24,381 Accounts payable 6,201 7,338 Labor and social security obligations 25,228 52,689 Loans and Obligations 10,323 22,207 Taxes and contributions payable 16,110 19,292 Total current liabilities 99,983 126,345 Non - current liabilities Accounts payable – – Leases 58,144 54,085 Labor and social security obligations 3,120 2,906 Loans and Obligations 158,908 158,206 Deferred taxes 9,720 7,423 Retirement plans liabilities 13,401 229,892 236,021 Total liabilities 329,875 362,366 Equity Share capital 15 15 Additional paid - in capital 1,382,038 1,379,255 Treasury shares (132,966) (154,247) Retained Earnings 65,032 113,122 Other reserves 25,186 25,556 1,339,305 1,363,701 Non - controlling interests in the equity of subsidiaries 2,982 2,793 Total equity 1,342,287 1,366,494 Total liabilities and equity 1,672,162 1,728,860 Balance Sheet Assets 3/31/2023 6/30/2023 Current assets Cash and cash equivalents 101,202 153,992 Cash and bank deposits 22,928 31,403 Financial instruments at fair value through profit or loss 78,274 122,589 Financial instruments at fair value through profit or loss 1,177,357 1,182,812 Trade receivables 60,352 66,312 Sub - leases receivable 1,587 3,909 Taxes recoverable 1,766 1,921 Other assets 20,150 14,505 Total current assets 1,362,414 1,423,451 Non - current assets Financial instruments at fair value through profit or loss 6,181 6,423 Trade receivables 17,116 16,904 Sub - leases receivable 1,080 3,149 Taxes recoverable 3,497 294 Deferred taxes 10,257 10,721 Other receivables 947 928 39,078 38,419 Property and equipment 11,728 12,980 Right of use - Leases 67,165 60,054 Intangible assets 191,777 193,956 Total non - current assets 309,748 305,409 Total Assets 1,672,162 1,728,860
40 Notes and Definitions ▪ Notes to page 5 (1) AUM is calculated as consolidated with double counting, due to funds from one segment investing in other segments and it ´ s eliminated on consolidation and excluding double counting from co - managed funds between our segments. (2) FRE per share is calculated considering the number of outstanding shares at the end of the current quarter. Year - to - date val ues are calculated as the sum of the last two quarters. (3) Adjusted Distributable Earnings per share is calculated as Distributable Earnings excluding non - operational expenses, consid ering the number of outstanding shares at the end of each quarter. Year - to - date values are calculated as the sum of the last two quarters. (4) LTM Dividend Yield is calculated considering 0.73 dividend/share for LTM and US$9.89/share as of August 08 th ,2023. ▪ Notes to page 7 (1) FRE per share is calculated considering the number of outstanding shares at the end of the current quarter. Year - to - date val ues are calculated as the sum of the last two quarters. (2) Other financial expenses include the interest related to Vinci SPS’ acquisition. (3) Non - operational expenses are comprised of expenses related to professional services rendered in connection with acquisitions and our international corporate organization. (4) DE per share is calculated considering the number of outstanding shares at the end of the current quarter. Year - to - date valu es are calculated as the sum of the last two quarters. ▪ Notes to page 9 (1) Long - term AUM includes funds with lockups for at least five years to quasi - perpetual capital commitments. ▪ Notes to page 10 (1) Long term products include funds with former lockups superior to five years. (2) Private markets strategies include Private Equity, Real Estate, Credit, Infrastructure and Vinci SPS. ▪ Notes to page 11 (1) Accrued performance fees for the VCP offshore are as of 1Q’23. This occurs due to the 60 days timeline of the quarterly m ark up to be disclosed by the fund’s administrator. ▪ Notes to page 14 (1) FRE per share is calculated considering the number of outstanding shares at the end of the current quarter. Year - to - date val ues are calculated as the sum of the last two quarters. ▪ Notes to page 15 (1) PRE per share is calculated considering the number of outstanding shares at the end of the current quarter. Year - to - date val ues are calculated as the sum of the last two quarters.
41 Notes and Definitions (cont’d.) ▪ Notes to page 16 (1) GP investment income comes from proprietary investments made by Vinci Partners in its own Private Markets’ funds and othe r c losed - end funds across Liquid Strategies and IP&S segments with long - term lockups. (2) Financial income is income generated through investments made with our cash and cash equivalents in cash and bank deposit s, certificate of deposits and proprietary investments in Vinci Partners’ Liquid Funds, including funds from Public Equities, Hedge Funds, Real Estate and Credit. ▪ Notes to page 17 (1) Adjusted Distributable Earnings is calculated as Distributable Earnings excluding non - operational expenses. (2) Adjusted DE per share is calculated considering the number of outstanding shares at the end of the current quarter. Year - to - date values are calculated as the sum of the last two quarters. ▪ Notes to page 18 (1) Cash and cash equivalents include certificate of deposits and federal bonds. Certificate of deposits are issued by Banco Bra desco (credit rating AAA evaluated by Fitch Ratings) with interest rates variable from 99.5% to 101% of CDI (interbank deposit rate). The certificates are readily convertible to known amounts of cas h a nd which are subject to an insignificant risk of changes in value. (2) Liquid funds’ value are calculated as investment at fair value as of June 30, 2023, in liquid funds from Vinci Partners’ pub lic equities, hedge funds, credit segments and listed REITs. It also comprises the cash and certificate of deposits and federal bonds from Vinci Monalisa FIM. For more detail, see 2Q’23 Financia l S tatements filed within the SEC on August 10, 2023. (3) GP Fund Investments include Vinci Partners’ GP investments in private market funds and other closed - end funds across Liquid Strategies and IP&S segments with long - term lockups, calculated at fair value as of June 30, 2023. For more detail, please see slide 32 and the Financial Statements filed within the SEC on Aug ust 10, 2023. (4) Debt obligations include commercial notes and consideration payable. For more detail, see 2Q’23 Financial Statements file d w ithin the SEC on August 10, 2023. (5) Net Cash and Investments per share were calculated considering the number of outstanding shares at the end of each quarte r. ▪ Notes to page 28 (1) NAV is the net asset value of each fund. For listed vehicles, the NAV represents the Market valuation of the fund. (2) Atlas strategy includes the funds Atlas FIC FIM and Atlas Institucional FIC FIM. (3) Equilibrio Strategy incudes the IP&S Family of pension plans. (4) CDI is an average of interbank overnight rates in Brazil (daily average for the period). (5) Brazil stock market most relevant index. (6) IPCA is a broad consumer price index measured by the IBGE. (7) IMAB is composed by government bonds indexed to IPCA. IMAB 5 also includes government bonds indexed to IPCA with up to 5 Yea rs in duration. (8) IFIX is an index composed by listed REITs in the Brazilian stock Market.
42 Notes and Definitions (cont’d.) (9) If IMAB 5 Average is: i. less or equal to 2%, X=3% per year; ii. between 2% - 4%, X= Average IMAB 5+1% per year; iii. Between 4% - 5%, X=5% per year; IV. greater or equal to 5%, X= IMAB 5 Average ▪ Notes to page 29 (1) Track record information is presented throughout this presentation on a pro forma basis and in local currency, excluding PIP E investments, a strategy that will be discontinued in VCP III. (2) Total commitments for VCP III include R$1.3 billion in co - investments. Track record presented for the VCP strategy as of 1Q’ 23, due to fund’s administrator timeline to disclose the quarterly markup of the fund. (3) Track record for VIR strategy is presented as of 1Q’23, due to fund’s administrator timeline to disclose the quarterly ma rku p of the fund. (4) Track record for Vinci SPS strategy is presented as of 2Q’23. (5) Track record for FIP Infra is presented as of 1Q’23. (6) Track record for VIAS is presented as of 1Q’23. (7) Track record for VICC is presented as of 1Q’23. (8) Track record for VFDL is presented as of 2Q’23. (9) Track record for Vinci Credit Infra is presented as of 2Q’23. ▪ Notes to page 30 (1) US$ Distributable Earnings was calculated considering the exchange rate from USD to BRL of 4.9245, as of August 08, 2023, wh en dividends were approved by our Board of Directors. (2) Per Share calculations are based on end of period Participating Common Shares. (3) Actual dividends per common share are calculated considering the share count as of the applicable record date. ▪ Notes to page 31 (1) As of June 30, 2023, Public Float was comprised of 12,809,281 Class A common shares. ▪ Notes to page 32 (1) The remaining capital committed in FIP Infra Transmissão and FIP Infra Transmissão co - investment will not be called by the f und, which is already in divestment period. ▪ Notes to page 33 (1) International mandates have several different benchmarks across its vehicles. (2) The preferred return w/ catch - up rule applies to funds for which the vehicle must pay back its limited partners 100% of the invested capital corrected by the preferred return rate so it can charge performance fees. Once the preferred return rate is achieved, due to the catch - up clause, performance fees are charged over the absolute return of the fund instead of the excess return over the preferred rate.
43 Notes and Definitions (cont’d.) (3) Hurdle Rate is the minimum return the fund must achieve before it can charge performance fees. In most cases, funds with hur dle rate also are under a high - water mark clause . (4) Funds with preferred return must return 100% of invested capital corrected by the preferred return rate to its limited pa rtn ers in order to charge performance fees. (5) IPCA is a broad consumer price index measured by the IBGE. (6) IMAB 5 is composed by government bonds indexed to IPCA with up to 5 years in duration. (7) IBOV is the Brazilian stock market's most relevant index; (8) FTSE is London's stock market most relevant index. (9) IFIX is an index composed by listed REITs in the Brazilian stock exchange. (10) The CDI rate is a result of the average interbank overnight rates in Brazil (daily average for the period). (11) IMAB is composed by government bonds indexed to IPCA (inflation rate) plus a fixed interest rate. ▪ Notes to page 35 (1) Other items comprise the income/(loss) generated by contingent consideration adjustment and financial expenses related to ac quisitions. (2) Non - operational expenses are comprised of expenses related to professional services rendered in connection with acquisitions and our international corporate organization. (3) Income taxes are comprised of taxes calculated over our corporate income tax and social contribution taxes. We are taxed on an actual taxable profit regime, while part of our subsidiaries are taxed based on deemed profit. (4) Contingent consideration adjustment (after - tax) related to Vinci SPS’ acquisition, reflects the change in the earn out’s fai r value to be paid in 2027. On June 30, 2023, Vinci revaluated the fair value of the obligation based on the economic conditions at the date, resulting in an increase of the contingent consideration fair va lue. The variation was recognized as a loss in the financial result. ▪ Notes to page 37 (1) Brazilian tax law establishes that companies that generate gross revenues of up to R$ 78,000.00 in the prior fiscal year may calculate income taxes as a percentage of gross revenue, using the presumed profit income tax regime. The Entity's subsidiaries adopted this tax regime and the effect of the presumed profit of su bsidiaries represents the difference between the taxation based on this method and the amount that would be due based on the statutory rate applied to the taxable profit of the subsidiaries.
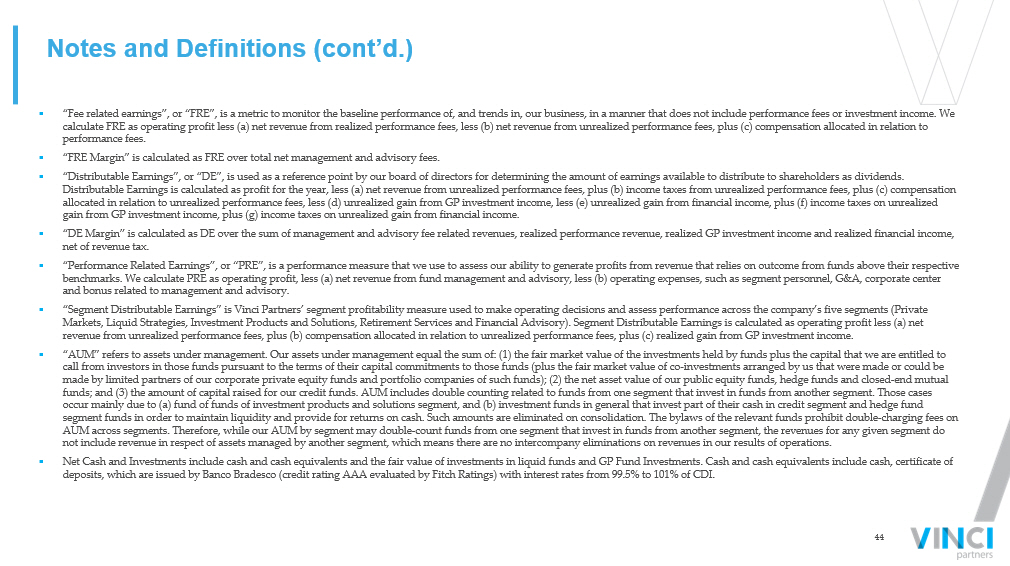
44 Notes and Definitions (cont’d.) ▪ “Fee related earnings”, or “FRE”, is a metric to monitor the baseline performance of, and trends in, our business, in a manne r t hat does not include performance fees or investment income. We calculate FRE as operating profit less (a) net revenue from realized performance fees, less (b) net revenue from unrealized p erf ormance fees, plus (c) compensation allocated in relation to performance fees. ▪ “FRE Margin” is calculated as FRE over total net management and advisory fees. ▪ “Distributable Earnings”, or “DE”, is used as a reference point by our board of directors for determining the amount of earni ngs available to distribute to shareholders as dividends. Distributable Earnings is calculated as profit for the year, less (a) net revenue from unrealized performance fees, plus (b) inc ome taxes from unrealized performance fees, plus (c) compensation allocated in relation to unrealized performance fees, less (d) unrealized gain from GP investment income, less (e) unrealized ga in from financial income, plus (f) income taxes on unrealized gain from GP investment income, plus (g) income taxes on unrealized gain from financial income. ▪ “DE Margin” is calculated as DE over the sum of management and advisory fee related revenues, realized performance revenue, r eal ized GP investment income and realized financial income, net of revenue tax. ▪ “Performance Related Earnings”, or “PRE”, is a performance measure that we use to assess our ability to generate profits from re venue that relies on outcome from funds above their respective benchmarks. We calculate PRE as operating profit, less (a) net revenue from fund management and advisory, less (b) operating exp enses, such as segment personnel, G&A, corporate center and bonus related to management and advisory. ▪ “Segment Distributable Earnings” is Vinci Partners’ segment profitability measure used to make operating decisions and assess pe rformance across the company’s five segments (Private Markets, Liquid Strategies, Investment Products and Solutions, Retirement Services and Financial Advisory). Segment Distribut abl e Earnings is calculated as operating profit less (a) net revenue from unrealized performance fees, plus (b) compensation allocated in relation to unrealized performance fees, plus (c ) r ealized gain from GP investment income. ▪ “AUM” refers to assets under management. Our assets under management equal the sum of: (1) the fair market value of the inves tme nts held by funds plus the capital that we are entitled to call from investors in those funds pursuant to the terms of their capital commitments to those funds (plus the fair market va lue of co - investments arranged by us that were made or could be made by limited partners of our corporate private equity funds and portfolio companies of such funds); (2) the net asset valu e o f our public equity funds, hedge funds and closed - end mutual funds; and (3) the amount of capital raised for our credit funds. AUM includes double counting related to funds from one segm ent that invest in funds from another segment. Those cases occur mainly due to (a) fund of funds of investment products and solutions segment, and (b) investment funds in general that inv est part of their cash in credit segment and hedge fund segment funds in order to maintain liquidity and provide for returns on cash. Such amounts are eliminated on consolidation. T he bylaws of the relevant funds prohibit double - charging fees on AUM across segments. Therefore, while our AUM by segment may double - count funds from one segment that invest in funds from anoth er segment, the revenues for any given segment do not include revenue in respect of assets managed by another segment, which means there are no intercompany eliminations on re ven ues in our results of operations. ▪ Net Cash and Investments include cash and cash equivalents and the fair value of investments in liquid funds and GP Fund Inve stm ents. Cash and cash equivalents include cash, certificate of deposits, which are issued by Banco Bradesco (credit rating AAA evaluated by Fitch Ratings) with interest rates from 99.5% to 10 1% of CDI.
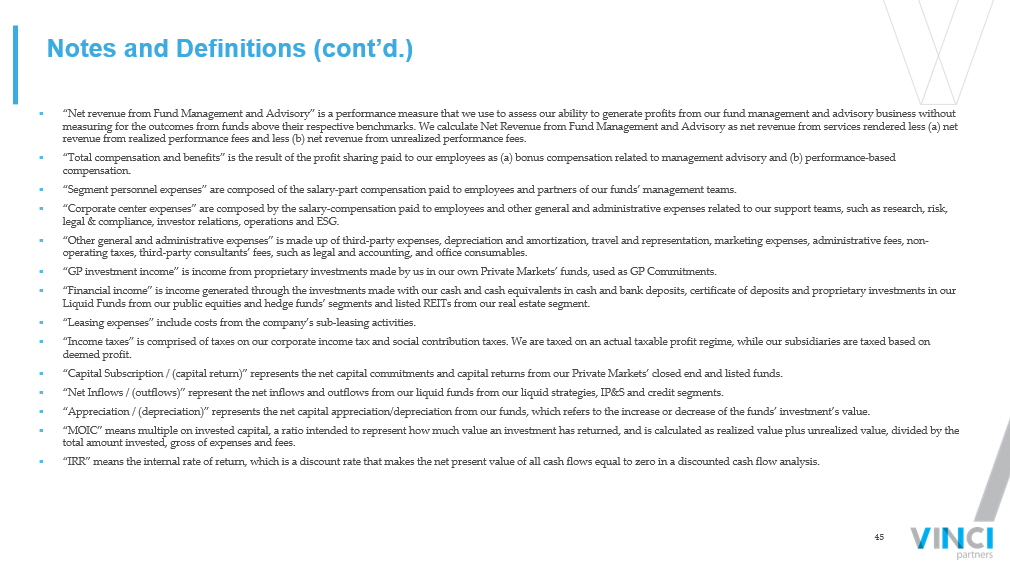
45 Notes and Definitions (cont’d.) ▪ “Net revenue from Fund Management and Advisory” is a performance measure that we use to assess our ability to generate profit s f rom our fund management and advisory business without measuring for the outcomes from funds above their respective benchmarks. We calculate Net Revenue from Fund Management and Ad vis ory as net revenue from services rendered less (a) net revenue from realized performance fees and less (b) net revenue from unrealized performance fees. ▪ “Total compensation and benefits” is the result of the profit sharing paid to our employees as (a) bonus compensation related to management advisory and (b) performance - based compensation. ▪ “Segment personnel expenses” are composed of the salary - part compensation paid to employees and partners of our funds’ managemen t teams. ▪ “Corporate center expenses” are composed by the salary - compensation paid to employees and other general and administrative expen ses related to our support teams, such as research, risk, legal & compliance, investor relations, operations and ESG. ▪ “Other general and administrative expenses” is made up of third - party expenses, depreciation and amortization, travel and repres entation, marketing expenses, administrative fees, non - operating taxes, third - party consultants’ fees, such as legal and accounting, and office consumables. ▪ “GP investment income” is income from proprietary investments made by us in our own Private Markets’ funds, used as GP Commit men ts. ▪ “Financial income” is income generated through the investments made with our cash and cash equivalents in cash and bank depos its , certificate of deposits and proprietary investments in our Liquid Funds from our public equities and hedge funds’ segments and listed REITs from our real estate segment. ▪ “Leasing expenses” include costs from the company’s sub - leasing activities. ▪ “Income taxes” is comprised of taxes on our corporate income tax and social contribution taxes. We are taxed on an actual tax abl e profit regime, while our subsidiaries are taxed based on deemed profit. ▪ “Capital Subscription / (capital return)” represents the net capital commitments and capital returns from our Private Markets ’ c losed end and listed funds. ▪ “Net Inflows / (outflows)” represent the net inflows and outflows from our liquid funds from our liquid strategies, IP&S and cre dit segments. ▪ “Appreciation / (depreciation)” represents the net capital appreciation/depreciation from our funds, which refers to the incr eas e or decrease of the funds’ investment’s value. ▪ “MOIC” means multiple on invested capital, a ratio intended to represent how much value an investment has returned, and is ca lcu lated as realized value plus unrealized value, divided by the total amount invested, gross of expenses and fees. ▪ “IRR” means the internal rate of return, which is a discount rate that makes the net present value of all cash flows equal to ze ro in a discounted cash flow analysis.
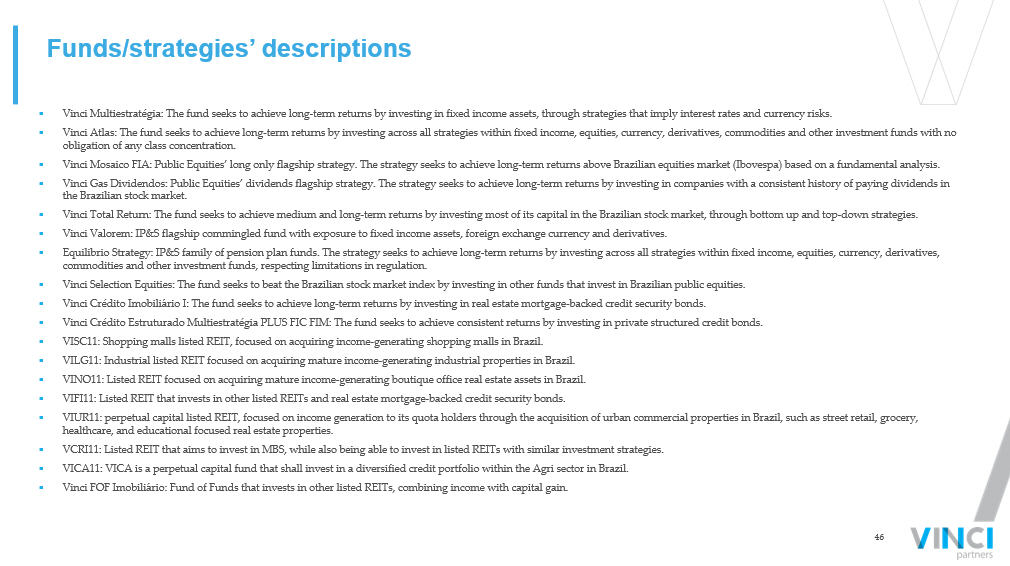
46 Funds/strategies’ descriptions ▪ Vinci Multiestratégia: The fund seeks to achieve long - term returns by investing in fixed income assets, through strategies that imply interest rates and currency risks. ▪ Vinci Atlas: The fund seeks to achieve long - term returns by investing across all strategies within fixed income, equities, curre ncy, derivatives, commodities and other investment funds with no obligation of any class concentration. ▪ Vinci Mosaico FIA: Public Equities’ long only flagship strategy. The strategy seeks to achieve long - term returns above Brazilian equities market (Ibovespa) based on a fundamental analysis. ▪ Vinci Gas Dividendos: Public Equities’ dividends flagship strategy. The strategy seeks to achieve long - term returns by investing in companies with a consistent history of paying dividends in the Brazilian stock market. ▪ Vinci Total Return: The fund seeks to achieve medium and long - term returns by investing most of its capital in the Brazilian sto ck market, through bottom up and top - down strategies. ▪ Vinci Valorem: IP&S flagship commingled fund with exposure to fixed income assets, foreign exchange currency and derivatives. ▪ Equilibrio Strategy: IP&S family of pension plan funds. The strategy seeks to achieve long - term returns by investing across all strategies within fixed income, equities, currency, derivatives, commodities and other investment funds, respecting limitations in regulation. ▪ Vinci Selection Equities: The fund seeks to beat the Brazilian stock market index by investing in other funds that invest in Bra zilian public equities. ▪ Vinci Crédito Imobiliário I: The fund seeks to achieve long - term returns by investing in real estate mortgage - backed credit secu rity bonds. ▪ Vinci Crédito Estruturado Multiestratégia PLUS FIC FIM: The fund seeks to achieve consistent returns by investing in private str uctured credit bonds. ▪ VISC11: Shopping malls listed REIT, focused on acquiring income - generating shopping malls in Brazil. ▪ VILG11: Industrial listed REIT focused on acquiring mature income - generating industrial properties in Brazil. ▪ VINO11: Listed REIT focused on acquiring mature income - generating boutique office real estate assets in Brazil. ▪ VIFI11: Listed REIT that invests in other listed REITs and real estate mortgage - backed credit security bonds. ▪ VIUR11: perpetual capital listed REIT, focused on income generation to its quota holders through the acquisition of urban com mer cial properties in Brazil, such as street retail, grocery, healthcare, and educational focused real estate properties. ▪ VCRI11: Listed REIT that aims to invest in MBS, while also being able to invest in listed REITs with similar investment strat egi es. ▪ VICA11: VICA is a perpetual capital fund that shall invest in a diversified credit portfolio within the Agri sector in Brazil . ▪ Vinci FOF Imobiliário: Fund of Funds that invests in other listed REITs, combining income with capital gain.

Rio de Janeiro 55 21 2159 6000 Av. Bartolomeu Mitre, 336 Leblon - 22431 - 002 São Paulo 55 11 3572 3700 Av. Brigadeiro Faria Lima, 2.277 14 o andar Jardim Paulistano - 01452 - 000 Recife 55 81 3204 6811 Av. República do Líbano, 251 - Sala 301 Torre A - Pina - 51110 - 160 Nova York 1 646 559 8000 780 Third Avenue, 25 th Floor - 10017 New York
Exhibit 99.2

2Q23 Earnings
Release
August 10th,
2023
ir.vincipartners.com
IR
|
Vinci Partners Reports Second Quarter 2023 Results
Alessandro Horta, Chief Executive Officer, stated,
“Our second quarter 2023 results resonate the growth seen across the platform through the last twelve months. AUM reached R$65 billion,
up 9% year-over-year, and our Adjusted Distributable Earningsi
totaled R$70 million in the quarter, or R$1.30 per share, an increase of 18% in our cash earnings per share year-over-year. As we enter
a new easing cycle for interest rates, momentum is appealing for all our strategies. Vinci is very well positioned to take the most out
of the market opportunity and we could not be more excited about the future ahead.”
Dividend
Vinci Partners has declared a quarterly dividend
of US$0.20 per share to record holders of common stock at the close of business on August 24, 2023. This dividend will be paid on September
08, 2023.
Second Quarter 2023 Highlights
About Vinci Partners
Vinci Partners is a leading alternative
investment platform in Brazil, established in 2009.
Vinci Partners’ business
segments include Private Markets (Private Equity, Real Estate, Infrastructure, Special Situations and Credit), Liquid Strategies (Public
Equities and Hedge Funds), Investment products and Solutions, Financial Advisory and Retirement Services. As of June 30, 2023, the firm
had R$65 billion of assets under management.
Webcast and Earnings Conference Call
Vinci Partners will host a conference
call at 5:00pm EST on Thursday, August 10, 2023, to announce its second quarter 2023 results.
To access the webcast please visit
the Events & Presentations’ section of the Company's website at:
https://ir.vincipartners.com/news-and-events/events-and-presentations.
For those unable to listen to
the live broadcast, there will be a webcast replay on the same section of the website.
To access the conference call
through dial in, please register at 2Q23 VINP Earnings Dial In to obtain the conference number
and access code.
 Investor Contact
ShareholderRelations@vincipartners.com
NY: +1 (646) 559-8040
RJ: +55 (21) 2159-6240
 USA Media Contact
Joele Frank, Wilkinson Brimmer Katcher
Nick Lamplough / Kate Thompson / Katie Villany
+1 (212) 355-4449
Brazil Media Contact
Danthi Comunicações
Carla Azevedo (carla@danthicomunicacoes.com.br)+55
(21) 3114-0779
Segment Earnings
| (R$ thousands, unless mentioned) |
2Q'22 |
1Q'23 |
2Q'23 |
∆ YoY (%) |
2Q'22 YTD |
2Q'23 YTD |
∆ YoY (%) |
| Net revenue from management fees |
89,271 |
95,877 |
92,769 |
4% |
176,500 |
188,646 |
7% |
| Net revenue from advisory fees |
6,659 |
4,468 |
14,050 |
111% |
10,333 |
18,518 |
79% |
| Total Fee Related Revenues |
95,930 |
100,345 |
106,819 |
11% |
186,833 |
207,164 |
11% |
| Segment personnel expenses |
(6,233) |
(7,164) |
(7,577) |
22% |
(12,782) |
(14,741) |
15% |
| Other G&A expenses |
(4,178) |
(3,458) |
(5,036) |
21% |
(8,681) |
(8,494) |
(2)% |
| Corporate center expenses |
(21,350) |
(22,606) |
(22,410) |
5% |
(40,111) |
(45,016) |
12% |
| Bonus compensation related to management and advisory |
(17,267) |
(18,062) |
(21,049) |
22% |
(34,539) |
(39,111) |
13% |
| Total Fee Related Expenses |
(49,028) |
(51,290) |
(56,071) |
14% |
(96,113) |
(107,361) |
12% |
| FEE RELATED EARNINGS (FRE)i |
46,902 |
49,055 |
50,748 |
8% |
90,720 |
99,803 |
10% |
| FRE Margin (%) |
48.9% |
48.9% |
47.5% |
|
48.6% |
48.2% |
|
| FRE per shareii (R$/share) |
0.84 |
0.90 |
0.94 |
11% |
1.63 |
1.83 |
13% |
| Net revenue from performance fees |
3,839 |
1,963 |
10,765 |
180% |
7,011 |
12,728 |
82% |
| Performance based compensation |
(1,427) |
(733) |
(5,368) |
276% |
(2,459) |
(6,101) |
148% |
| PERFORMANCE RELATED EARNINGS (PRE) |
2,412 |
1,230 |
5,397 |
124% |
4,552 |
6,627 |
46% |
| PRE Margin (%) |
62.8% |
62.7% |
50.1% |
|
64.9% |
52.1% |
|
| (-) Unrealized performance fees |
– |
– |
– |
N/A |
(636) |
– |
N/A |
| (+) Unrealized performance compensation |
– |
– |
– |
N/A |
225 |
– |
N/A |
| (+) Realized GP investment income |
4,926 |
5,881 |
4,179 |
(15)% |
6,971 |
10,060 |
44% |
| SEGMENT DISTRIBUTABLE EARNINGS |
54,240 |
56,166 |
60,324 |
11% |
101,833 |
116,490 |
14% |
| Segment DE Margin (%) |
51.8% |
51.9% |
49.5% |
|
50.9% |
50.7% |
|
| (+) Depreciation and amortization |
976 |
1,778 |
2,028 |
108% |
1,960 |
3,806 |
94% |
| (+) Realized financial income |
20,001 |
20,089 |
30,183 |
51% |
44,997 |
50,272 |
12% |
| (-) Leasing expenses |
(2,400) |
(2,631) |
(2,517) |
5% |
(4,872) |
(5,148) |
6% |
| (-) Other financial expensesiii |
644 |
(3,900) |
(5,540) |
N/A |
(492) |
(9,440) |
1,819% |
| (-) Non-operational expenses |
(962) |
– |
– |
N/A |
(6,071) |
– |
N/A |
| (-) Income taxes (excluding related to unrealized fees and income) |
(12,064) |
(11,496) |
(14,109) |
17% |
(23,665) |
(25,605) |
8% |
| DISTRIBUTABLE EARNINGS (DE)iv |
60,435 |
60,006 |
70,369 |
16% |
113,690 |
130,375 |
15% |
| DE Margin (%) |
48.5% |
46.8% |
46.3% |
|
46.4% |
46.5% |
|
| DE per share (R$/share) |
1.09 |
1.10 |
1.30 |
19% |
2.04 |
2.40 |
17% |
| (+) Non-operational expensesv (including Income Tax effect) |
635 |
– |
– |
N/A |
5,072 |
– |
N/A |
| ADJUSTED DISTRIBUTABLE EARNINGS |
61,070 |
60,006 |
70,369 |
15% |
118,762 |
130,375 |
10% |
| Adjusted DE Margin (%) |
49.0% |
46.8% |
46.3% |
|
48.4% |
46.5% |
|
| Adjusted DE per share (R$/share) vi |
1.10 |
1.10 |
1.30 |
18% |
2.13 |
2.40 |
12% |
Total Fee-Related Revenuesvii
of R$106.8 million for the quarter ended June 30, 2023, compared to R$95.9 million for the quarter ended June 30, 2022, an increase of
11% year-over year. This increase was attributed to a combination of organic and inorganic growth across Private Markets strategies over
the last twelve months, as well as stronger advisory fees in the quarter. Fee-related revenues were R$207.2 million for the six months
ended June 30, 2023, up 11% when compared to the six months ended June 30, 2022. This growth was driven by higher levels of both management
and advisory fees.
Fee Related Earnings (“FRE”)
of R$50.7 million (R$0.94/share) for the quarter ended June 30, 2023, up 8% year-over-year on an absolute basis and 11%-year-over-year
on an FRE per share basis when compared the quarter ended June 30, 2022. The platform continues to see FRE expansion on a year-over-year
basis driven by the growth across Private Markets and a higher contribution from advisory fees in the quarter. FRE of R$99.8 million (R$1.83/share)
for the six months ended June 30, 2023, up 10% when compared to the six months ended June 30, 2022, on an absolute basis and 13% on an
FRE per share basis. This increase is mainly attributed to the expansion of the Private Markets segment and revenues booked in the Financial
Advisory segment in the second quarter.
FRE Marginviii was 47.5% for
the quarter ended June 30, 2023, a decrease of 1.4 percentage point when compared to the quarter ended June 30, 2022.
Performance Related Earnings (“PRE”)ix
of R$5.4 million for the quarter ended June 30, 2023, compared to R$2.4 million for the quarter ended June 30, 2022, up 124% year-over-year,
driven by more favorable market conditions during the 2Q’23. PRE was R$6.6 million for the six months ended June 30, 2023, an increase
of 46% when compared to the six months ended June 30, 2022.
Segment Distributable Earningsx
of R$60.3 million for the quarter ended June 30, 2023, compared to R$54.2 million for the quarter ended June 30, 2022, up 11% year-over-year.
Segment Distributable Earnings were R$116.5 million for the six months ended June 30, 2023, up 14% year-over-year, when compared to the
six months ended June 30, 2022.
Adjusted Distributable Earnings (“DE”)
of R$70.4 million (R$1.30/share) for the quarter ended June 30, 2023, compared to R$61.1 million for the quarter ended June 30, 2022,
up 15% year-over-year on an absolute basis and 18% year-over-year on an Adjusted DE per share basis, boosted by a greater contribution
from financial income, advisory and performance fees. Adjusted DE was R$130.4 million (R$2.40/share) for the six months ended June 30,
2023, up 10% when compared to the six months ended June 30, 2022, on an absolute basis and 12% on an Adjusted DE per share basis.
Adjusted DE Marginxi was 46.3%
for the quarter ended June 30, 2023, a 2.7 percentage point decrease compared to 49.0% for the quarter ended June 30, 2022. For the six
months ended June 30, 2023, Adjusted DE Margin reached 46.5%, a decrease of 1.9 percentage points.
Segment Highlights
Private Market Strategies
| (R$ thousands, unless mentioned) |
2Q'22 |
1Q'23 |
2Q'23 |
∆ YoY (%) |
2Q'22 YTD |
2Q'23 YTD |
∆ YoY (%) |
| Net revenue from management fees |
47,654 |
58,432 |
57,842 |
21% |
94,413 |
116,274 |
23% |
| Net revenue from advisory fees |
275 |
275 |
275 |
– |
741 |
549 |
(26)% |
| Total Fee Related Revenues |
47,929 |
58,706 |
58,117 |
21% |
95,154 |
116,823 |
23% |
| Segment personnel expenses |
(2,923) |
(3,509) |
(3,719) |
27% |
(5,659) |
(7,228) |
28% |
| Other G&A expenses |
(2,411) |
(1,438) |
(2,540) |
5% |
(5,166) |
(3,978) |
(23)% |
| Corporate center expenses |
(10,827) |
(13,018) |
(13,205) |
22% |
(20,381) |
(26,223) |
29% |
| Bonus compensation related to management and advisory |
(7,426) |
(9,111) |
(8,817) |
19% |
(14,733) |
(17,928) |
22% |
| Total Fee Related Expenses |
(23,587) |
(27,076) |
(28,281) |
20% |
(45,939) |
(55,357) |
21% |
| FEE RELATED EARNINGS (FRE) |
24,342 |
31,630 |
29,836 |
23% |
49,215 |
61,466 |
25% |
| FRE Margin (%) |
50.8% |
53.9% |
51.3% |
|
51.7% |
52.6% |
|
| Net revenue from performance fees |
1,719 |
7 |
2,528 |
47% |
2,359 |
2,535 |
7% |
| Realized performance fees |
1,719 |
7 |
2,528 |
47% |
1,723 |
2,535 |
47% |
| Unrealized performance fees |
– |
– |
– |
N/A |
636 |
– |
N/A |
| Performance based compensation |
(609) |
(3) |
(1,118) |
84% |
(835) |
(1,121) |
34% |
| PERFORMANCE RELATED EARNINGS (PRE) |
1,110 |
5 |
1,410 |
27% |
1,524 |
1,414 |
(7)% |
| PRE Margin (%) |
64.6% |
64.6% |
55.8% |
|
64.6% |
55.8% |
|
| (-) Unrealized performance fees |
– |
– |
– |
N/A |
(636) |
– |
N/A |
| (+) Unrealized performance compensation |
– |
– |
– |
N/A |
225 |
– |
N/A |
| (+) Realized GP investment income |
4,926 |
5,881 |
4,179 |
(15)% |
6,971 |
10,060 |
44% |
| SEGMENT DISTRIBUTABLE EARNINGS |
30,377 |
37,516 |
35,425 |
17% |
57,299 |
72,940 |
27% |
| Segment DE Margin (%) |
55.7% |
58.1% |
56.9% |
|
56.1% |
57.5% |
|
| |
|
|
|
|
|
|
|
| ASSETS UNDER MANAGEMENT (AUM R$ millions) |
23,998 |
28,198 |
29,367 |
22% |
23,998 |
29,367 |
22% |
| FEE EARNING ASSETS UNDER MANAGEMENT (FEAUM R$ millions) |
20,722 |
24,825 |
26,076 |
26% |
20,722 |
26,076 |
26% |
| AVERAGE MANAGEMENT FEE RATE (%) |
0.90% |
0.87% |
0.85% |
|
0.91% |
0.86% |
|
Fee related earnings (FRE) of R$29.8 million
for the quarter ended June 30, 2023, up 23% year-over-year, a combination of strong fundraising efforts over the last twelve months and
the acquisition of Vinci SPS. In the 1Q’23, management fees received a boost from retroactive fees coming from commitments signed
for VCP IV, which did not occur in the 2Q’23. This effect was partially offset by the commitments signed for VICC that started to
contribute to management fees in the 2Q’23. FRE was R$61.5 million for the six months ended June 30, 2023, an increase of 25% when
compared to the six months ended June 30, 2022.
Segment Distributable Earnings of R$35.4
million for the quarter ended June 30, 2023, up 17% when compared to the quarter ended June 30, 2022. Segment DE was R$72.9 million over
the six months ended June 30, 2023, up 27% when compared to the six months ended June 30, 2022, boosted by growth in FRE.
AUM of R$29.4 billion at the end of the
second quarter, an increase of 22% year-over-year, driven by strong fundraising across Private Equity, Credit, Infrastructure and the
acquisition of Vinci SPS.
Investment Products and Solutions
| (R$ thousands, unless mentioned) |
2Q'22 |
1Q'23 |
2Q'23 |
∆ YoY (%) |
2Q'22 YTD |
2Q'23 YTD |
∆ YoY (%) |
| Net revenue from management fees |
21,407 |
19,152 |
17,426 |
(19)% |
41,304 |
36,579 |
(11)% |
| Net revenue from advisory fees |
7 |
7 |
8 |
11% |
14 |
15 |
9% |
| Total Fee Related Revenues |
21,414 |
19,160 |
17,434 |
(19)% |
41,317 |
36,594 |
(11)% |
| Segment personnel expenses |
(1,078) |
(1,154) |
(1,575) |
46% |
(2,905) |
(2,729) |
(6)% |
| Other G&A expenses |
(450) |
(862) |
(580) |
29% |
(1,050) |
(1,442) |
37% |
| Corporate center expenses |
(4,864) |
(4,267) |
(3,978) |
(18)% |
(8,929) |
(8,245) |
(8)% |
| Bonus compensation related to management and advisory |
(3,557) |
(3,859) |
(3,551) |
(0)% |
(7,712) |
(7,410) |
(4)% |
| Total Fee Related Expenses |
(9,948) |
(10,142) |
(9,684) |
(3)% |
(20,596) |
(19,827) |
(4)% |
| FEE RELATED EARNINGS (FRE) |
11,466 |
9,017 |
7,750 |
(32)% |
20,721 |
16,767 |
(19)% |
| FRE Margin (%) |
53.5% |
47.1% |
44.4% |
|
50.2% |
45.8% |
|
| Net revenue from performance fees |
820 |
790 |
1,490 |
82% |
1,028 |
2,279 |
122% |
| Realized performance fees |
820 |
790 |
1,490 |
82% |
1,028 |
2,279 |
122% |
| Unrealized performance fees |
– |
– |
– |
N/A |
– |
– |
N/A |
| Performance based compensation |
(360) |
(316) |
(745) |
107% |
(444) |
(1,061) |
139% |
| PERFORMANCE RELATED EARNINGS (PRE) |
460 |
474 |
745 |
62% |
584 |
1,219 |
109% |
| PRE Margin (%) |
56.1% |
60.0% |
50.0% |
|
56.8% |
53.5% |
|
| (-) Unrealized performance fees |
– |
– |
– |
N/A |
– |
– |
N/A |
| (+) Unrealized performance compensation |
– |
– |
– |
N/A |
– |
– |
N/A |
| SEGMENT DISTRIBUTABLE EARNINGS |
11,926 |
9,491 |
8,495 |
(29)% |
21,305 |
17,986 |
(16)% |
| Segment DE Margin (%) |
53.6% |
47.6% |
44.9% |
|
50.3% |
46.3% |
|
| |
|
|
|
|
|
|
|
| ASSETS UNDER MANAGEMENT (AUM R$ millions) |
25,659 |
24,216 |
24,041 |
(6)% |
25,659 |
24,041 |
(6)% |
| FEE EARNING ASSETS UNDER MANAGEMENT (FEAUM R$ millions) |
25,545 |
24,050 |
23,940 |
(6)% |
25,545 |
23,940 |
(6)% |
| AVERAGE MANAGEMENT FEE RATE (%) |
0.38% |
0.35% |
0.32% |
|
0.38% |
0.33% |
|
Fee related earnings (FRE) of R$7.8 million
for the quarter ended June 30, 2023, down 32% year-over-year, a consequence of the shift in fundraising mix within the IP&S segment.
Even though AUM remained stable year-over-year, the segment has been fundraising more significantly across the Separate Mandates strategy,
which carries lower fees, contributing to the decrease in the average management fee rate. FRE was R$16.8 million over the six months
ended June 30, 2023, a decrease of 19% when compared to the six months ended June 30, 2022.
Performance related earnings (PRE) of R$0.7
million for the quarter ended June 30, 2023, up 62% year-over-year. PRE over the six months ended June 30, 2023, was R$1.2 million, an
increase of 109% when compared to the six months ended June 30, 2022.
Segment Distributable Earnings of R$8.5
million for the quarter ended June 30, 2023, down 29% year-over-year. Segment DE was R$18.0 million over the six months ended June 30,
2023, a decrease of 16% when compared to the six months ended June 30, 2022, that posted higher contribution from FRE.
AUM of R$24.0 billion, down 6% year-over-year.
Liquid Strategies
| (R$ thousands, unless mentioned) |
2Q'22 |
1Q'23 |
2Q'23 |
∆ YoY (%) |
2Q'22 YTD |
2Q'23 YTD |
∆ YoY (%) |
| Net revenue from management fees |
20,210 |
18,293 |
17,492 |
(13)% |
40,783 |
35,784 |
(12)% |
| Net revenue from advisory fees |
– |
– |
– |
N/A |
– |
– |
N/A |
| Total Fee Related Revenues |
20,210 |
18,293 |
17,492 |
(13)% |
40,783 |
35,784 |
(12)% |
| Segment personnel expenses |
(1,394) |
(1,608) |
(1,328) |
(5)% |
(2,778) |
(2,936) |
6% |
| Other G&A expenses |
(780) |
(710) |
(861) |
10% |
(1,456) |
(1,571) |
8% |
| Corporate center expenses |
(4,592) |
(4,075) |
(3,993) |
(13)% |
(8,795) |
(8,069) |
(8)% |
| Bonus compensation related to management and advisory |
(3,922) |
(3,471) |
(3,244) |
(17)% |
(7,871) |
(6,714) |
(15)% |
| Total Fee Related Expenses |
(10,688) |
(9,864) |
(9,426) |
(12)% |
(20,900) |
(19,290) |
(8)% |
| FEE RELATED EARNINGS (FRE) |
9,522 |
8,429 |
8,066 |
(15)% |
19,883 |
16,494 |
(17)% |
| FRE Margin (%) |
47.1% |
46.1% |
46.1% |
|
48.8% |
46.1% |
|
| Net revenue from performance fees |
1,300 |
1,166 |
6,747 |
419% |
3,625 |
7,913 |
118% |
| Realized performance fees |
1,300 |
1,166 |
6,747 |
419% |
3,625 |
7,913 |
118% |
| Unrealized performance fees |
– |
– |
– |
N/A |
– |
– |
N/A |
| Performance based compensation |
(459) |
(415) |
(3,505) |
664% |
(1,181) |
(3,920) |
232% |
| PERFORMANCE RELATED EARNINGS (PRE) |
841 |
752 |
3,242 |
285% |
2,444 |
3,994 |
63% |
| PRE Margin (%) |
64.7% |
64.5% |
48.0% |
|
67.4% |
50.5% |
|
| (-) Unrealized performance fees |
– |
– |
– |
N/A |
– |
– |
N/A |
| (+) Unrealized performance compensation |
– |
– |
– |
N/A |
– |
– |
N/A |
| SEGMENT DISTRIBUTABLE EARNINGS |
10,363 |
9,180 |
11,308 |
9% |
22,327 |
20,488 |
(8)% |
| Segment DE Margin (%) |
48.2% |
47.2% |
46.7% |
|
50.3% |
46.9% |
|
| |
|
|
|
|
|
|
|
| ASSETS UNDER MANAGEMENT (AUM R$ millions) |
9,845 |
9,818 |
11,472 |
17% |
9,845 |
11,472 |
17% |
| FEE EARNING ASSETS UNDER MANAGEMENT (FEAUM R$ millions) |
9,708 |
9,614 |
11,278 |
16% |
9,708 |
11,278 |
16% |
| AVERAGE MANAGEMENT FEE RATE (%) |
0.78% |
0.78% |
0.70% |
|
0.76% |
0.74% |
|
Fee related earnings (FRE) of R$8.1 million
for the quarter ended June 30, 2023, down 15% year-over-year. This decrease can be attributed to a shift in the fee mix, as the macroeconomic
landscape has been conductive to the expansion of Exclusive Mandates strategy, which carries lower fees. FRE was R$16.5 million over the
six months ended June 30, 2023, a decrease of 17% when compared to the six months ended June 30, 2022.
Performance related earnings (PRE) of R$3.2
million for the quarter ended June 30, 2023, up 285% year-over-year. PRE was R$4.0 million over the six months ended June 30, 2023, an
increase of 63% when compared to the six months ended June 30, 2022.
Segment Distributable Earnings of R$11.3
million for the quarter ended June 30, 2023, up 9% year-over-year, following higher contributions from performance fees. Segment DE was
R$20.5 million over the six months ended June 30, 2023, a decrease of 8% when compared to the six months ended June 30, 2022, as consequence
of reduction in contributions from FRE.
AUM was R$11.5 billion at the end of the
second quarter, up 17% year-over-year. This growth was driven by favorable mark-to-market effects, which were concentrated in the latter
part of the quarter. As a result, revenues are expected to benefit from the increased AUM throughout the next quarter.
Financial Advisory
| (R$ thousands, unless mentioned) |
2Q'22 |
1Q'23 |
2Q'23 |
∆ YoY (%) |
2Q'22 YTD |
2Q'23 YTD |
∆ YoY (%) |
| Net revenue from management fees |
– |
– |
– |
N/A |
– |
– |
N/A |
| Net revenue from advisory fees |
6,378 |
4,186 |
13,768 |
116% |
9,578 |
17,954 |
87% |
| Total Fee Related Revenues |
6,378 |
4,186 |
13,768 |
116% |
9,578 |
17,954 |
87% |
| Segment personnel expenses |
(530) |
(471) |
(525) |
(1)% |
(1,035) |
(996) |
(4)% |
| Other G&A expenses |
(165) |
(74) |
(241) |
46% |
(374) |
(315) |
(16)% |
| Corporate center expenses |
(1,067) |
(1,130) |
(1,120) |
5% |
(2,006) |
(2,251) |
12% |
| Bonus compensation related to management and advisory |
(1,350) |
(1,023) |
(4,735) |
251% |
(2,208) |
(5,758) |
161% |
| Total Fee Related Expenses |
(3,112) |
(2,698) |
(6,622) |
113% |
(5,623) |
(9,320) |
66% |
| FEE RELATED EARNINGS (FRE) |
3,265 |
1,487 |
7,146 |
119% |
3,956 |
8,634 |
118% |
| FRE Margin (%) |
51.2% |
35.5% |
51.9% |
|
41.3% |
48.1% |
|
| SEGMENT DISTRIBUTABLE EARNINGS |
3,265 |
1,487 |
7,146 |
119% |
3,956 |
8,634 |
118% |
| Segment DE Margin (%) |
51.2% |
35.5% |
51.9% |
|
41.3% |
48.1% |
|
Fee related earnings (FRE) of R$7.1 million
for the quarter ended June 30, 2023, up 119% year-over-year. FRE was R$8.6 million over the six months ended June 30, 2023, an increase
of 118% when compared to the six months ended June 30, 2022.
Segment Distributable Earnings over the
six months ended June 30, 2023, were R$8.6 million, an increase of 118% year-over-year when compared to the six months ended June 30,
2022.
Retirement Services
| (R$ thousands, unless mentioned)/ |
2Q'22 |
1Q'23 |
2Q'23 |
∆ YoY (%) |
2Q'22 YTD |
2Q'23 YTD |
∆ YoY (%) |
| Net revenue from management fees |
– |
0 |
9 |
N/A |
– |
9 |
N/A |
| Net revenue from advisory fees |
– |
– |
– |
N/A |
– |
– |
N/A |
| Total Fee Related Revenues |
– |
0 |
9 |
N/A |
– |
9 |
N/A |
| Segment personnel expenses |
(308) |
(422) |
(429) |
39% |
(405) |
(851) |
110% |
| Other G&A expenses |
(372) |
(374) |
(814) |
119% |
(635) |
(1,188) |
87% |
| Corporate center expenses |
– |
(115) |
(112) |
N/A |
– |
(227) |
N/A |
| Bonus compensation related to management and advisory |
(1,012) |
(598) |
(703) |
(31)% |
(2,014) |
(1,300) |
(35)% |
| Total Fee Related Expenses |
(1,692) |
(1,509) |
(2,058) |
22% |
(3,054) |
(3,566) |
17% |
| FEE RELATED EARNINGS (FRE) |
(1,692) |
(1,509) |
(2,049) |
21% |
(3,054) |
(3,558) |
16% |
| FRE Margin (%) |
N/A |
N/A |
N/A |
|
N/A |
N/A |
|
| Net revenue from performance fees |
– |
– |
– |
N/A |
– |
– |
N/A |
| Realized performance fees |
– |
– |
– |
N/A |
– |
– |
N/A |
| Unrealized performance fees |
– |
– |
– |
N/A |
– |
– |
N/A |
| Performance based compensation |
– |
– |
– |
N/A |
– |
– |
N/A |
| PERFORMANCE RELATED EARNINGS (PRE) |
– |
– |
– |
N/A |
– |
– |
N/A |
| PRE Margin (%) |
N/A |
N/A |
N/A |
|
N/A |
N/A |
|
| (-) Unrealized performance fees |
– |
– |
– |
N/A |
– |
– |
N/A |
| (+) Unrealized performance compensation |
– |
– |
– |
N/A |
– |
– |
N/A |
| SEGMENT DISTRIBUTABLE EARNINGS |
(1,692) |
(1,509) |
(2,049) |
21% |
(3,054) |
(3,558) |
16% |
| Segment DE Margin (%) |
N/A |
N/A |
N/A |
|
N/A |
N/A |
|
| |
|
|
|
|
|
|
|
| ASSETS UNDER MANAGEMENT (AUM R$millions) |
– |
– |
15 |
N/A |
– |
15 |
N/A |
Fee Related Earnings (FRE) of negative R$2.0
million for the quarter ended June 30, 2023. FRE was negative R$3.6 million to the six months ended June 30, 2023.
VRS started to contribute to AUM numbers and management fee revenues
this quarter.
Income Statement
| (R$ thousands, unless mentioned) |
2Q'22 |
1Q'23 |
2Q'23 |
∆ YoY (%) |
2Q'22 YTD |
2Q'23 YTD |
∆ YoY (%) |
| REVENUES |
|
|
|
|
|
|
|
| Net revenue from management fees |
89,271 |
95,877 |
92,769 |
4% |
176,500 |
188,646 |
7% |
| Net revenue from performance fees |
3,839 |
1,963 |
10,765 |
180% |
7,011 |
12,728 |
82% |
| Realized performance fees |
3,839 |
1,963 |
10,765 |
180% |
6,375 |
12,728 |
100% |
| Unrealized performance fees |
– |
– |
– |
N/A |
636 |
– |
N/A |
| Net revenue from advisory |
6,659 |
4,468 |
14,050 |
111% |
10,333 |
18,518 |
79% |
| Total net revenues from services rendered |
99,769 |
102,308 |
117,584 |
18% |
193,844 |
219,892 |
13% |
| EXPENSES |
|
|
|
|
|
|
|
| Bonus related to management and advisory |
(17,267) |
(18,062) |
(21,049) |
22% |
(34,539) |
(39,111) |
13% |
| Performance based compensation |
(1,427) |
(733) |
(5,368) |
276% |
(2,459) |
(6,101) |
148% |
| Realized |
(1,427) |
(733) |
(5,368) |
276% |
(2,234) |
(6,101) |
173% |
| Unrealized |
– |
– |
– |
N/A |
(225) |
– |
N/A |
| Total compensation and benefitsxii |
(18,694) |
(18,795) |
(26,417) |
41% |
(36,997) |
(45,212) |
22% |
| Segment personnel expenses |
(6,233) |
(7,164) |
(7,577) |
22% |
(12,782) |
(14,741) |
15% |
| Other general and administrative expenses |
(4,178) |
(3,458) |
(5,036) |
21% |
(8,681) |
(8,494) |
(2)% |
| Corporate center expenses |
(21,350) |
(22,606) |
(22,410) |
5% |
(40,111) |
(45,016) |
12% |
| Total expenses |
(50,455) |
(52,023) |
(61,439) |
22% |
(98,571) |
(113,462) |
15% |
| Operating profit |
49,314 |
50,285 |
56,145 |
14% |
95,273 |
106,430 |
12% |
| OTHER ITEMS |
|
|
|
|
|
|
|
| GP Investment income |
(7,211) |
(20,200) |
34,651 |
N/A |
(11,380) |
14,451 |
N/A |
| Realized gain from GP investment income |
4,926 |
5,881 |
4,179 |
(15)% |
6,971 |
10,060 |
44% |
| Unrealized gain from GP investment income |
(12,137) |
(26,081) |
30,472 |
N/A |
(18,351) |
4,391 |
N/A |
| Financial income |
21,193 |
20,089 |
30,183 |
42% |
45,901 |
50,272 |
10% |
| Realized gain from financial income |
20,001 |
20,089 |
30,183 |
51% |
44,997 |
50,272 |
12% |
| Unrealized gain from financial income |
1,192 |
– |
– |
N/A |
904 |
– |
N/A |
| Leasing expenses |
(2,400) |
(2,631) |
(2,517) |
5% |
(4,872) |
(5,148) |
6% |
| Other itemsxiii |
644 |
151 |
(11,573) |
N/A |
(492) |
(11,422) |
2,222% |
| Share Based Plan |
(2,468) |
(2,107) |
(3,493) |
42% |
(3,204) |
(5,600) |
75% |
| Non-operational expenses |
(962) |
– |
– |
N/A |
(6,071) |
– |
N/A |
| Total Other Items |
8,796 |
(4,698) |
47,251 |
437% |
19,882 |
42,553 |
114% |
| Profit before income taxes |
58,109 |
45,587 |
103,396 |
78% |
115,154 |
148,983 |
29% |
| (-) Income taxes |
(11,711) |
(12,881) |
(11,844) |
1% |
(23,450) |
(24,725) |
5% |
| NET INCOME |
46,398 |
32,706 |
91,552 |
97% |
91,704 |
124,258 |
35% |
| (+) Non-operational expenses including income tax related to realized expense |
635 |
– |
– |
N/A |
5,072 |
– |
N/A |
| (-) Contingent consideration adjustment related to acquisitionsxiv |
– |
(2,674) |
4,804 |
|
– |
2,130 |
|
| ADJUSTED NET INCOME |
47,033 |
30,032 |
96,356 |
105% |
96,775 |
126,388 |
31% |
Total net revenues from services rendered
of R$117.6 million for the quarter ended June 30, 2023, up 18% year-over-year, driven by a combination of organic and inorganic expansion
of Private Markets segment, higher performance and advisory fees. Net revenues for the six months ended June 30, 2023, were R$219.9 million,
representing a 13% increase when compared to the six months ended June 30, 2022.
| · | Management fee revenues of R$92.8 million for
the quarter ended June 30, 2023, up 4% year-over-year, a result from the fundraising cycle across Private Markets funds and the acquisition
of Vinci SPS. |
| · | Performance fee revenues of R$10.8 million for
the quarter ended June 30, 2023, compared to R$3.8 million for the quarter ended June 30, 2022, an increase of 180% year-over-year. The
local market experienced favorable conditions during the 2Q’23, driving the performance of our funds with exposure to liquid assets.
Performance fee revenues of R$12.7 for the six months ended June 30, 2023, an increase of 100% when compared to the six |
months ended June 30, 2022.
| · | Advisory fee revenues of R$14.1 million for the
quarter ended June 30, 2023, compared to R$6.7 million for the quarter ended June 30, 2022, an increase of 111% year-over-year, a result
of revenues booked in the Financial Advisory segment in the 2Q’23. Advisory revenues for the six months ended June 30, 2023, were
R$18.5 million, up 79% when compared to the six months ended June 30, 2022. |
Total expenses for the quarter ended June
30, 2023, of R$61.4 million, compared to R$50.5 million for the quarter ended June 30, 2022, an increase of 22% year-over-year. Disregarding
bonus compensation, total expenses totaled R$35.0 million, up 10% year-over-year. This increase was primarily driven by the incorporation
of Vinci SPS, as our internal efforts to control costs effectively mitigated the inflationary pressure on fixed expenses. Total expenses
for the six months ended June 30, 2023, were R$113.5 million, up 15% when compared to the six months ended June 30, 2022.
| · | Bonus related to management and advisory fees
of R$21.0 million for the quarter ended June 30, 2023, compared to R$17.3 million for the quarter ended June 30, 2022, an increase of
22% year-over-year. Bonus related to management and advisory was R$39.1 million for the six months ended June 30, 2023, up 13% year-over-year,
when compared to the six months ended June 30, 2022. |
| · | Performance based compensation of R$5.4 million
for the quarter ended June 30, 2023, compared to R$1.4 million for the quarter ended June 30, 2022, an increase of 276% year-over-year.
Performance based compensation for the six months ended June 30, 2023, was R$6.1 million, an increase of 148% when compared to the six
months ended June 30, 2022. |
| · | Segment personnel expensesxv of R$7.6
million for the quarter ended June 30, 2023, compared to R$6.2 million for the quarter ended June 30, 2022, an increase of 22% year-over-year,
primarily driven by the incorporation of Vinci SPS. Segment personnel expenses for the six months ended June 30, 2023, was R$14.7 million,
up 15% when compared to the six months ended June 30, 2022. |
| · | Corporate center expensesxvi of R$22.4
million for the quarter ended June 30, 2023, compared to R$21.4 million for the quarter ended June 30, 2022, an increase of 5% year-over-year.
Corporate center expenses for the six months ended June 30, 2023, were R$45.0 million, up 12% year-over-year, when compared to the six
months ended June 30, 2022. |
| · | Other general and administrative expensesxvii
of R$5.0 million for the quarter ended June 30, 2023, compared to R$4.2 million for the quarter ended June 30, 2022, an increase of 21%
year-over-year. Other G&A expenses for the six months ended June 30, 2023, were R$8.5 million, down 2% when compared to the six months
ended June 30, 2022. |
Operating Profit of R$56.1 million for the
quarter ended June 30, 2023, compared to R$49.3 million for the quarter ended June 30, 2022, an increase of 14% year-over-year. Operating
profit for the six months ended June 30, 2023, was R$106.4 million, up 12% when compared to the six months ended June 30, 2022.
GP Investment incomexviii,
a result of the company’s GP investments in its proprietary private market funds, was R$34.7 million for the quarter ended June
30, 2023, compared to negative R$7.2 million for the quarter ended June 30, 2022,
following the strong mark-to-market appreciation
in local REITs during the current quarter. GP Investment income for the six months ended June 30, 2023, was R$14.5 million compared to
negative R$11.4 million for the six months ended June 30, 2022.
Financial Incomexix of R$30.2
million for the quarter ended June 30, 2023, up 42% when compared to R$21.2 million for the quarter ended June 30, 2022, a result of financial
gains from the company’s cash position, primarily allocated to funds exposed to federal fixed-income bonds. Financial income for
the six months ended June 30, 2023, was R$50.3 million, up 10% when compared to the six months ended June 30, 2022.
Leasing Expensesxx of R$2.5
million for the quarter ended June 30, 2023, compared to R$2.4 million for the quarter ended June 30, 2022, up 5% year-over-year.
Other Items of negative R$11.6 million for
the quarter ended June 30, 2023. Other items comprise the income/(loss) generated by contingent consideration adjustment and financial
expenses related to acquisitions.
Share Based Plan expensesxxi
of R$3.5 million for the quarter ended June 30, 2023. In the six months ended June 30, 2023, share based plan expenses accounted for R$5.6
million.
Profit before income taxes of R$103.4 million
for the quarter ended June 30, 2023, compared to R$58.1 million for the quarter ended June 30, 2022, an increase of 78% year-over-year.
Profit before income taxes for the six months ended June 30, 2023, was R$149.0 million, an increase of 29% when compared to the six months
ended June 30, 2022.
Income Taxesxxii of R$11.8
million for the quarter ended June 30, 2023, which represented an effective tax rate for the quarter of 11%, compared to R$11.7 million
for the quarter ended June 30, 2022, which represented an effective tax rate of 20%, representing a decrease of 8.7 percentage points
year-over-year, a consequence of our strong financial result this quarter, backed by the mark-to-market appreciation effect across our
balance sheet’s position in Listed REITs and financial gains from our liquid’s portfolio.
Contingent consideration adjustment related
to acquisitions, after tax, of R$4.8 million for the quarter ended June 30, 2023. Contingent consideration adjustment related to Vinci
SPS’ acquisition reflects the change in earn out’s fair value to be paid in 2027.
Adjusted Net Income of R$96.4 million for
the quarter ended June 30, 2023, compared to R$47.0 million for the quarter ended June 30, 2022, an increase of 105% year-over-year. Adjusted
Net Income was R$126.4 million for the six months ended June 30, 2023, up 31% when compared to the six months ended June 30, 2022.
Supplement Details
Assets Under Management (AUM)xxiii Rollforward –
R$ millions
For the Three Months Ended
June 30, 2023
| |
Private
Equity |
Public
Equities |
IP&S |
Infrastructure |
Real Estate |
Credit |
Hedge
Funds |
VRS |
Vinci SPS |
Total |
| Beginning balance |
13,587 |
7,095 |
24,216 |
2,361 |
5,137 |
4,964 |
2,723 |
– |
2,149 |
62,232 |
| (+/-) Capital Subscription / (capital return) |
(27) |
– |
28 |
(21) |
(108) |
(33) |
– |
– |
(98) |
(260) |
| (+) Capital Subscription |
34 |
– |
28 |
– |
– |
– |
– |
– |
– |
62 |
| (-) Capital Return |
(61) |
– |
– |
(21) |
(108) |
(33) |
– |
– |
(98) |
(321) |
| (+) Acquisitions |
– |
– |
– |
– |
– |
– |
– |
– |
– |
– |
| (+/-) Net Inflow / (outflow) |
– |
204 |
(884) |
– |
(4) |
203 |
(36) |
15 |
– |
(502) |
| (+/-) Appreciation / (depreciation) |
(50) |
1,372 |
682 |
91 |
984 |
175 |
113 |
0 |
58 |
3,425 |
| Ending Balance |
13,511 |
8,672 |
24,041 |
2,431 |
6,008 |
5,308 |
2,800 |
15 |
2,108 |
64,895 |
For the Twelve months
Ended June 30, 2023
| |
Private
Equity |
Public
Equities |
IP&S |
Infrastructure |
Real
Estate |
Credit |
Hedge
Funds |
VRS |
Vinci SPS |
Total |
| Beginning balance |
13,013 |
7,064 |
25,659 |
1,460 |
5,208 |
4,318 |
2,781 |
– |
– |
59,502 |
| (+/-) Capital Subscription / (capital return) |
587 |
– |
55 |
867 |
(140) |
453 |
– |
– |
(184) |
1,639 |
| (+) Capital Subscription |
777 |
– |
55 |
944 |
284 |
699 |
– |
– |
47 |
2,806 |
| (-) Capital Return |
(190) |
– |
(0) |
(77) |
(423) |
(246) |
– |
– |
(231) |
(1,167) |
| (+) Acquisitions |
– |
– |
– |
– |
– |
– |
– |
– |
2,055 |
2,055 |
| (+/-) Net Inflow / (outflow) |
– |
191 |
(3,081) |
– |
(154) |
263 |
(409) |
15 |
– |
(3,175) |
| (+/-) Appreciation / (depreciation) |
(89) |
1,417 |
1,408 |
105 |
1,095 |
275 |
428 |
0 |
237 |
4,875 |
| Ending Balance |
13,511 |
8,672 |
24,041 |
2,431 |
6,008 |
5,308 |
2,800 |
15 |
2,108 |
64,895 |
Fee Earning Assets Under Management (FEAUM) Rollforward – R$ millions
For the Three Months Ended
June 30, 2023
| |
Private
Equity |
Public
Equities |
IP&S |
Infrastructure |
Real Estate |
Credit |
Hedge
Funds |
VRS |
Vinci SPS |
Total |
| Beginning balance |
10,262 |
7,040 |
24,048 |
2,313 |
5,137 |
4,964 |
2,574 |
– |
2,149 |
58,487 |
| (+/-) Capital Subscription / (capital return) |
(27) |
– |
28 |
(21) |
(108) |
(33) |
– |
– |
(98) |
(260) |
| (+) Capital Subscription |
34 |
– |
28 |
– |
– |
– |
– |
– |
– |
62 |
| (-) Capital Return |
(61) |
– |
– |
(21) |
(108) |
(33) |
– |
– |
(98) |
(321) |
| (+) Acquisitions |
– |
– |
– |
– |
– |
– |
– |
|
– |
– |
| (+/-) Net Inflow / (outflow) |
– |
204 |
(826) |
– |
(4) |
203 |
(26) |
15 |
– |
(434) |
| (+/-) Appreciation / (depreciation) |
33 |
1,379 |
690 |
91 |
984 |
175 |
108 |
0 |
58 |
3,517 |
| Ending Balance |
10,268 |
8,623 |
23,940 |
2,383 |
6,008 |
5,308 |
2,655 |
15 |
2,108 |
61,310 |
For the Twelve months
Ended June 30, 2023
| |
Private
Equity |
Public
Equities |
IP&S |
Infrastructure |
Real
Estate |
Credit |
Hedge
Funds |
VRS |
Vinci SPS |
Total |
| Beginning balance |
9,797 |
7,002 |
25,545 |
1,399 |
5,208 |
4,318 |
2,706 |
– |
– |
55,975 |
| (+/-) Capital Subscription / (capital return) |
587 |
– |
55 |
873 |
(140) |
453 |
– |
– |
(184) |
1,645 |
| (+) Capital Subscription |
765 |
– |
55 |
944 |
284 |
678 |
– |
– |
47 |
2,772 |
| (-) Capital Return |
(178) |
– |
(0) |
(71) |
(423) |
(225) |
– |
– |
(231) |
(1,128) |
| (+) Acquisitions |
– |
– |
– |
– |
– |
– |
– |
– |
2,055 |
2,055 |
| (+/-) Net Inflow / (outflow) |
– |
199 |
(3,025) |
– |
(154) |
263 |
(463) |
15 |
– |
(3,167) |
| (+/-) Appreciation / (depreciation) |
(116) |
1,423 |
1,365 |
111 |
1,095 |
275 |
413 |
0 |
237 |
4,801 |
| Ending Balance |
10,268 |
8,623 |
23,940 |
2,383 |
6,008 |
5,308 |
2,655 |
15 |
2,108 |
61,310 |
Accrued Performance Fees – Private Market Funds
| (R$ mm) |
1Q’23 |
Unrealized Performance Fees |
Realized Distributions |
2Q’23 |
| Private Equity |
137.5 |
26.2 |
- |
163.7 |
| Infrastructure |
17.6 |
(0.7) |
- |
16.9 |
| Real Estate |
0.1 |
(0.1) |
- |
- |
| Total |
155.2 |
25.4 |
- |
180.6 |
Vinci Partners recognizes the performance revenue
according to IFRS 15. Unrealized performance fees are recognized only when is highly probable that the revenue will not be reversed in
the Income Statement.
The fund FIP Infra Transmissão in Infrastructure
had R$15.5 million as of the end of the second quarter of 2023 booked as unrealized performance fees in the company´s balance sheet.
Accrued performance fees shown for Private Equity
funds of R$163.7 million and for others Infrastructure funds of R$1.4 million as of the end of the second quarter of 2023 have not been
booked as unrealized performance fees in the company´s balance sheet.
Investment Records – IP&S, Liquid Strategies, Credit and Listed
REIT
| Fund |
Segment |
NAVxxiv
(R$ millions)
|
2Q23 |
YTD |
12 M |
24 M |
Market Comparison |
Index Rate |
| Vinci Multiestratégia FIM |
Hedge Funds |
304.0 |
3.9% |
7.3% |
13.9% |
22.8% |
CDIxxv |
CDI |
| Atlas Strategyxxvi |
Hedge Funds |
384.8 |
3.9% |
5.1% |
8.5% |
8.9% |
CDI |
CDI |
| Vinci Total Return |
Hedge Funds |
241.7 |
19.1% |
16.0% |
25.4% |
12.3% |
IPCAxxvii+ Yield IMA-Bxxviii |
IPCA + Yield IMA-B |
| Mosaico Strategyxxix |
Public Equities |
896.1 |
19.3% |
11.4% |
16.6% |
(12.1)% |
IBOVxxx |
IBOV |
| Vinci Gas Dividendos FIA |
Public Equities |
506.7 |
15.0% |
7.3% |
18.0% |
(0.3)% |
IBOV |
IBOV |
| Vinci Valorem FIM |
IP&S |
1,734.1 |
3.6% |
7.9% |
10.4% |
21.2% |
IMA-B 5 |
IMA-B 5 |
| Equilibrio Strategyxxxi |
IP&S |
2,787.6 |
3.7% |
7.4% |
9.9% |
19.0% |
IPCA |
- |
| Vinci Retorno Real FIM |
IP&S |
219.4 |
5.1% |
10.5% |
12.7% |
26.2% |
IMA-B |
IMA-B |
| Vinci Crédito Imobiliário I |
Credit |
110.9 |
2.1% |
5.8% |
10.1% |
18.7% |
IPCA |
IPCA + 7.785% |
| Vinci Crédito Imobiliário II |
Credit |
841.6 |
6.6% |
11.0% |
13.9% |
23.0% |
IPCA |
IPCA + 6% |
| Vinci Crédito Estruturado Multiestrategia Plus FIC FIM |
Credit |
124.3 |
3.6% |
5.3% |
13.0% |
25.4% |
CDI |
CDI |
| Vinci Energia Sustentável |
Credit |
605.5 |
6.1% |
8.4% |
8.9% |
17.6% |
IPCA |
IPCA + 6% |
| Vinci Crédito Multiestratégia |
Credit |
344.4 |
5.8% |
4.5% |
8.1% |
22.1% |
CDI |
IPCA + 5% |
| VISC11 |
Real Estate (listed REIT) |
2,209.5 |
20.1% |
18.0% |
29.3% |
31.7% |
IFIXxxxii |
IPCA + 6% |
| VILG11 |
Real Estate (listed REIT) |
1,654.2 |
28.0% |
15.8% |
26.4% |
19.7% |
IFIX |
IPCA + 6% |
| VINO11 |
Real Estate (listed REIT) |
772.9 |
21.8% |
3.1% |
16.1% |
(4.3)% |
IFIX |
IPCA + 6% |
| VIFI11 |
Real Estate / Credit (listed REIT) |
64.8 |
23.6% |
22.3% |
29.6% |
17.5% |
IFIX |
IFIX |
| VIUR11 |
Real Estate (listed REIT) |
223.9 |
42.1% |
12.5% |
31.5% |
14.9% |
IFIX |
IPCA + 6% |
| VCRI11 |
Real Estate / Credit (listed REIT) |
153.1 |
9.6% |
4.1% |
8.6% |
5.1% |
IFIX |
IPCA + Xxxxiii% |
| VICA11 |
Real Estate / Credit (REIT) |
374.5 |
0.0% |
(0.3)% |
1.3% |
1.3% |
IFIX |
CDI + 1% |
| VINCI FOF IMOBILIARIO FIM CP |
Real Estate (REIT) |
59.3 |
12.7% |
12.6% |
14.9% |
26.8% |
IFIX |
IFIX |
| VIGT11 |
Infrastructure (listed) |
656.0 |
16.4% |
15.9% |
25.3% |
20.2% |
- |
- |
| Benchmark |
2Q23 |
YTD |
12 M |
24 M |
| IBOV |
15.9% |
7.6% |
19.8% |
(6.9)% |
| CDI |
3.1% |
6.5% |
13.5% |
23.4% |
| IMA-B 5 |
2.5% |
7.0% |
10.2% |
21.3% |
| IPCA + Yield IMA-B |
2.5% |
6.2% |
10.1% |
29.5% |
| IPCA |
0.8% |
2.9% |
3.2% |
15.4% |
| IFIX |
14.3% |
10.1% |
12.9% |
14.5% |
Investment Records – Closed End Private Markets fundsxxxiv
| Fund |
Segment
|
Vintage year |
Committed Capital
(R$mm) |
Invested Capital
(R$mm) |
Realized or Partially
Realized
(R$mm) |
Unrealized
(R$mm) |
Total
Value
(R$mm) |
Gross MOICxxxv
(BRL) |
Gross
MOIC
(USD) |
Gross
IRRxxxvi
(BRL) |
Gross IRR
(USD) |
| Fund 1 |
Private Equity |
2004 |
1,415 |
1,206 |
5,065 |
134 |
5,199 |
4.3x |
4.0x |
71.5% |
77.2% |
| VCP II |
Private Equity |
2011 |
2,200 |
1,880 |
2,044 |
2,146 |
4,190 |
2.2x |
1.1x |
11.3% |
1.6% |
| VCP III |
Private Equity |
2018 |
4,000 |
2,182 |
34 |
3,803 |
3,837 |
1.7x |
1.6x |
35.4% |
28.0% |
| VCP IV |
Private Equity |
2022 |
1,263 |
– |
– |
– |
– |
– |
– |
– |
– |
| VCP Strategyxxxvii |
Private Equity |
|
8,878 |
5,268 |
7,143 |
6,083 |
13,226 |
2.5x |
2.2x |
64.7% |
70.2% |
| NE Empreendedor |
Private Equity |
2003 |
36 |
13 |
26 |
– |
26 |
2.1x |
2.6x |
22.0% |
30.5% |
| Nordeste III |
Private Equity |
2017 |
240 |
135 |
93 |
144 |
237 |
1.8x |
1.5x |
20.3% |
12.7% |
| VIR IV |
Private Equity |
2020 |
1,000 |
314 |
151 |
273 |
424 |
1.4x |
1.4x |
30.2% |
36.2% |
| VIR Strategyxxxviii |
Private Equity |
|
1,276 |
461 |
270 |
417 |
687 |
1.5x |
1.5x |
22.7% |
28.4% |
| SPS I |
Vinci SPS |
2018 |
128 |
178 |
173 |
129 |
302 |
1.7x |
1.4x |
25.7% |
19.6% |
| SPS II |
Vinci SPS |
2020 |
671 |
1,003 |
599 |
838 |
1,436 |
1.4x |
1.4x |
27.6% |
32.3% |
| SPS III |
Vinci SPS |
2021 |
1,070 |
447 |
83 |
468 |
550 |
1.2x |
1.4x |
31.1% |
44.4% |
| SPS Strategyxxxix |
Vinci SPS |
|
1,869 |
1,628 |
855 |
1,434 |
2,289 |
1.4x |
1.4x |
27.6% |
29.9% |
| FIP Transmissãoxl |
Infrastructure |
2017 |
211 |
104 |
255 |
119 |
374 |
3.6x |
2.7x |
60.7% |
45.1% |
| VIASxli |
Infrastructure |
2021 |
386 |
350 |
– |
409 |
409 |
1.2x |
1.2x |
27.9% |
29.1% |
| VICCxlii |
Infrastructure |
2023 |
944 |
– |
– |
– |
– |
– |
– |
– |
– |
| VFDLxliii |
Real Estate |
2021 |
422 |
146 |
4 |
169 |
173 |
1.2x |
1.3x |
18.7% |
27.5% |
| Vinci Credit Infraxliv |
Credit |
2022 |
1,400 |
153 |
– |
167 |
167 |
1.1x |
1.1x |
NM |
NM |
Shareholder Dividends
| ($ in thousands) |
1H21 |
3Q'21 |
4Q'21 |
1Q’22 |
2Q’22 |
3Q'22 |
4Q’22 |
1Q’23 |
2Q'23 |
| Distributable Earnings (R$) |
101,976 |
61,743 |
68,515 |
53,255 |
60,435 |
72,842 |
55,792 |
60,006 |
70,369 |
| Distributable Earnings (US$)xlv |
19,397 |
11,377 |
13,637 |
10,615 |
11,795 |
14,281 |
10,618 |
11,994 |
14,290 |
| DE per Common Share (US$)xlvi |
0.34 |
0.20 |
0.24 |
0.19 |
0.21 |
0.26 |
0.19 |
0.22 |
0.26 |
| Actual Dividend per Common Sharexlvii |
0.30 |
0.16 |
0.20 |
0.17 |
0.17 |
0.20 |
0.17 |
0.16 |
0.20 |
| Record Date |
Sep 01, 2021 |
Dec 01, 2021 |
Mar 10, 2022 |
May 24, 2022 |
Aug 25, 2022 |
Nov 23, 2022 |
Mar 01, 2023 |
May 25, 2023 |
Aug 24, 2023 |
| Payable Date |
Sep 16, 2021 |
Dec 16, 2021 |
Mar 24, 2022 |
Jun 08, 2022 |
Sep 09,2022 |
Dec 08, 2022 |
Mar 15, 2023 |
Jun 09, 2023 |
Sep 08, 2023 |
Vinci Partners generated R$1.30 or US$0.26 of Distributable
Earnings per common share for the second quarter of 2023. The company declared a quarterly dividend of US$0.20 per common share to record
holders as of August 24, 2023; payable on September 08, 2023.
Share Summary
| VINP Shares |
1Q'21 |
2Q'21 |
3Q'21 |
4Q'21 |
1Q’22 |
2Q'22 |
3Q'22 |
4Q'22 |
1Q'23 |
2Q'23 |
| Class B |
14,466,239 |
14,466,239 |
14,466,239 |
14,466,239 |
14,466,239 |
14,466,239 |
14,466,239 |
14,466,239 |
14,466,239 |
14,466,239 |
| Class Axlviii |
42,447,349 |
42,270,694 |
42,097,179 |
41,689,338 |
41,363,077 |
41,112,717 |
40,892,619 |
40,614,497 |
40,247,461 |
39,730,720 |
| Common Shares Outstanding |
56,913,588 |
56,736,933 |
56,563,418 |
56,155,577 |
55,829,316 |
55,578,956 |
55,358,858 |
55,080,736 |
54,713,700 |
54,196,959 |
Common Shares Outstanding as of quarter end of
54,196,959 shares.
| · | Repurchased 558,349 common shares in the quarter,
with an average share price of US$8.7. |
| · | Repurchased 2,758,237 common shares since the
announcement of the first share repurchase plan, with an average share price of US$10.9. |
| · | The second share repurchase plan was replaced
by a new share repurchase plan initiated on February 14th, 2023, limited to R$60 million. |
| · | Available authorization remaining was R$47.8 million
on June 30, 2023. |
GP Commitment in Vinci Partners funds
|
(R$ millions,
unless mentioned)
Fund |
Segment |
2Q23
Commitments |
Total
Capital Committed |
2Q23 Capital Called |
Total Capital Called |
Capital Returned/
Dividends Paid (2Q23) |
Accumulated Capital Returned/
Dividends
Paid |
Fair value
of
investments |
| Nordeste III |
Private Equity |
– |
5.0 |
0.0 |
3.1 |
– |
1.6 |
2.6 |
| VCP III |
Private Equity |
– |
3.1 |
0.2 |
2.8 |
– |
– |
3.8 |
| VIR IV |
Private Equity |
– |
11.1 |
0.8 |
4.7 |
0.7 |
1.7 |
3.6 |
| VCP IV |
Private Equity |
– |
350.0 |
– |
– |
– |
– |
– |
| FIP Infra Transmissão (co- investment)l |
Infrastructure |
– |
29.5 |
– |
8.9 |
– |
20.9 |
10.2 |
| FIP
Infra Transmissãoli |
Infrastructure |
– |
10.5 |
– |
3.4 |
– |
6.6 |
2.9 |
| VIAS |
Infrastructure |
– |
50.0 |
– |
27.8 |
– |
– |
33.9 |
| Vinci Transporte e Logística II |
Infrastructure |
– |
15.0 |
– |
– |
– |
– |
– |
| Vinci Transporte e Logística I |
Infrastructure |
– |
11.4 |
5.0 |
11.3 |
– |
– |
10.6 |
| VICC |
Infrastructure |
– |
100.0 |
– |
– |
– |
– |
– |
| VFDL |
Real Estate |
– |
70.0 |
10.6 |
33.3 |
– |
– |
36.6 |
| VIUR |
Real Estate |
– |
67.3 |
– |
67.3 |
1.5 |
11.9 |
56.4 |
| VINO |
Real Estate |
– |
50.0 |
– |
50.0 |
0.8 |
5.1 |
42.6 |
| Vinci FOF Imobiliário |
Real Estate |
– |
16.9 |
– |
16.9 |
– |
0.5 |
20.7 |
| VCS (VCRI) |
Real Estate / Credit |
– |
80.0 |
– |
80.0 |
2.8 |
14.3 |
72.7 |
| Vinci Crédito Agro Fiagro-Imobiliário |
Real Estate / Credit |
– |
23.0 |
– |
23.0 |
0.8 |
2.6 |
22.8 |
| Vinci Crédito Infra Institucional |
Credit |
– |
100.0 |
– |
7.7 |
– |
– |
8.4 |
| VSP FIM |
IP&S |
– |
50.0 |
1.2 |
8.8 |
– |
– |
10.1 |
| Vinci PIPE FIA |
Public Equities |
– |
25.0 |
– |
25.0 |
– |
– |
24.3 |
| Total |
|
– |
1,067.8 |
17.9 |
374.1 |
6.6 |
65.2 |
362.2 |


Reconciliation and Disclosures
Non-GAAP Reconciliation
| (R$ thousands, unless mentioned) |
2Q'22 |
1Q'23 |
2Q'23 |
2Q'22 YTD |
2Q'23 YTD |
| |
|
|
|
|
|
| OPERATING PROFIT |
49,314 |
50,285 |
56,145 |
95,273 |
106,430 |
| (-) Net revenue from realized performance fees |
(3,839) |
(1,963) |
(10,765) |
(6,375) |
(12,728) |
| (-) Net revenue from unrealized performance fees |
– |
– |
– |
(636) |
– |
| (+) Compensation allocated in relation to performance fees |
1,427 |
733 |
5,368 |
2,459 |
6,101 |
| FEE RELATED EARNINGS (FRE) |
46,902 |
49,055 |
50,748 |
90,720 |
99,803 |
| |
|
|
|
|
|
| OPERATING PROFIT |
49,314 |
50,285 |
56,145 |
95,273 |
106,430 |
| (-) Net revenue from management fees |
(89,271) |
(95,877) |
(92,769) |
(176,500) |
(188,646) |
| (-) Net revenue from advisory |
(6,659) |
(4,468) |
(14,050) |
(10,333) |
(18,518) |
| (+) Bonus related to management and advisory |
17,267 |
18,062 |
21,049 |
34,539 |
39,111 |
| (+) Personnel expenses |
6,233 |
7,164 |
7,577 |
12,782 |
14,741 |
| (+) Other general and administrative expenses |
4,178 |
3,458 |
5,036 |
8,681 |
8,494 |
| (+) Corporate center expenses |
21,350 |
22,606 |
22,410 |
40,111 |
45,016 |
| PERFORMANCE RELATED EARNINGS (PRE) |
2,412 |
1,230 |
5,397 |
4,552 |
6,627 |
| |
|
|
|
|
|
| OPERATING PROFIT |
49,314 |
50,285 |
56,145 |
95,273 |
106,430 |
| (-) Net revenue from unrealized performance fees |
– |
– |
– |
(636) |
– |
| (+) Compensation allocated in relation to unrealized performance fees |
– |
– |
– |
225 |
– |
| (+) Realized gain from GP investment income |
4,926 |
5,881 |
4,179 |
6,971 |
10,060 |
| SEGMENT DISTRIBUTABLE EARNINGS |
54,240 |
56,166 |
60,324 |
101,833 |
116,490 |
| |
|
|
|
|
|
| NET INCOME |
46,398 |
32,706 |
91,552 |
91,704 |
124,258 |
| (-) Net revenue from unrealized performance fees |
– |
– |
– |
(636) |
– |
| (+) Income tax from unrealized performance fees |
– |
– |
– |
73 |
– |
| (+) Compensation allocated in relation to unrealized performance fees |
– |
– |
– |
225 |
– |
| (-) Unrealized gain from GP investment income |
12,137 |
26,081 |
(30,472) |
18,351 |
(4,391) |
| (+) Income tax on unrealized gain from GP investment income |
(55) |
– |
10 |
(55) |
10 |
| (-) Unrealized gain from financial income |
(1,192) |
– |
(0) |
(904) |
(0) |
| (+) Income tax on unrealized gain from financial income |
(65) |
– |
– |
– |
– |
| (-) Contingent consideration (earn-out) gain (loss), after-tax |
– |
(2,674) |
4,804 |
– |
2,130 |
| (+) Depreciation and amortization³ |
976 |
1,778 |
2,028 |
1,960 |
3,806 |
| (+) Share Based Plan |
2,468 |
2,107 |
2,248 |
3,204 |
4,355 |
| (-) Income Taxes on Share Based Plan |
(233) |
8 |
199 |
(233) |
207 |
| (+) Non-operational expenses including income tax related to realized expense |
635 |
– |
– |
5,072 |
– |
| ADJUSTED DISTRIBUTABLE EARNINGS |
61,070 |
60,006 |
70,369 |
118,762 |
130,375 |
| |
|
|
|
|
|
| TOTAL NET REVENUE FROM SERVICES RENDERED |
99,769 |
102,308 |
117,584 |
193,844 |
219,892 |
| (-) Net revenue from realized performance fees |
(3,839) |
(1,963) |
(10,765) |
(6,375) |
(12,728) |
| (-) Net revenue from unrealized performance fees |
– |
– |
– |
(636) |
– |
| NET REVENUE FROM MANAGEMENT FEES AND ADVISORY |
95,930 |
100,345 |
106,819 |
186,833 |
207,164 |
Effective Tax Rate Reconciliation
| (R$ thousands, unless mentioned) |
2Q'22 |
2Q'23 |
2Q'22 YTD |
2Q'23 YTD |
|
| Profit (loss) before income taxes |
58,109 |
103,396 |
115,154 |
148,983 |
|
| Combined statutory income taxes rate - % |
34% |
34% |
34% |
34% |
|
| Income tax benefit (Expense) at statutory rates |
(19,757) |
(35,154) |
(39,152) |
(50,654) |
|
| Reconciliation adjustments: |
|
|
|
|
|
| Expenses not deductible |
(9) |
(2) |
(27) |
(64) |
|
| Tax benefits |
30 |
7 |
65 |
42 |
|
| Share based payments |
(70) |
(224) |
(156) |
(253) |
|
| Effect of presumed profit of subsidiaries¹ and offshore subsidiarieslii |
7,951 |
23,410 |
15,665 |
26,072 |
|
| Other additions (exclusions), net |
144 |
119 |
155 |
132 |
|
| Income taxes expenses |
(11,711) |
(11,844) |
(23,450) |
(24,725) |
|
| Current |
(12,886) |
(14,605) |
(25,557) |
(27,122) |
|
| Deferred |
1,175 |
2,761 |
2,107 |
2,397 |
|
| Effective tax rate |
20% |
11% |
20% |
17% |
|
Balance Sheet Results
| Assets |
3/31/2023 |
6/30/2023 |
| Current assets |
|
|
| Cash and cash equivalents |
101,202 |
153,992 |
| Cash and bank deposits |
22,928 |
31,403 |
| Financial instruments at fair value through profit or loss |
78,274 |
122,589 |
| Financial instruments at fair value through profit or loss |
1,177,357 |
1,182,812 |
| Trade receivables |
60,352 |
66,312 |
| Sub-leases receivable |
1,587 |
3,909 |
| Taxes recoverable |
1,766 |
1,921 |
| Other assets |
20,150 |
14,505 |
| Total current assets |
1,362,414 |
1,423,451 |
| |
|
|
| Non-current assets |
|
|
| Financial instruments at fair value through profit or loss |
6,181 |
6,423 |
| Trade receivables |
17,116 |
16,904 |
| Sub-leases receivable |
1,080 |
3,149 |
| Taxes recoverable |
3,497 |
294 |
| Deferred taxes |
10,257 |
10,721 |
| Other receivables |
947 |
928 |
| |
39,078 |
38,419 |
| |
|
|
| Property and equipment |
11,728 |
12,980 |
| Right of use - Leases |
67,165 |
60,054 |
| Intangible assets |
191,777 |
193,956 |
| Total non-current assets |
309,748 |
305,409 |
| |
|
|
| TOTAL |
1,672,162 |
1,728,860 |
| Liabilities and equity |
3/31/2023 |
6/30/2023 |
| Current liabilities |
|
|
| Trade payables |
521 |
438 |
| Deferred Revenue |
17,219 |
– |
| Leases |
24,381 |
24,381 |
| Accounts payable |
6,201 |
7,338 |
| Labor and social security obligations |
25,228 |
52,689 |
| Loans and Obligations |
10,323 |
22,207 |
| Taxes and contributions payable |
16,110 |
19,292 |
| Total current liabilities |
99,983 |
126,345 |
| |
|
|
| Non-current liabilities |
|
|
| Accounts payable |
– |
– |
| Leases |
58,144 |
54,085 |
| Labor and social security obligations |
3,120 |
2,906 |
| Loans and Obligations |
158,908 |
158,206 |
| Deferred taxes |
9,720 |
7,423 |
| Retirement plans liabilities |
|
13,401 |
| |
229,892 |
236,021 |
| |
|
|
| Total liabilities |
329,875 |
362,366 |
| |
|
|
| Equity |
|
|
| Share capital |
15 |
15 |
| Additional paid-in capital |
1,382,038 |
1,379,255 |
| Treasury shares |
(132,966) |
(154,247) |
| Retained Earnings |
65,032 |
113,122 |
| Other reserves |
25,186 |
25,556 |
| |
1,339,305 |
1,363,701 |
| |
|
|
| Non-controlling interests in the equity of subsidiaries |
2,982 |
2,793 |
| |
|
|
| Total equity |
1,342,287 |
1,366,494 |
| |
|
|
| Total liabilities and equity |
1,672,162 |
1,728,860 |
Forward-Looking Statements
This earnings release contains forward-looking
statements that can be identified by the use of words such as “anticipate,” “believe,” “could,” “expect,”
“should,” “plan,” “intend,” “estimate” and “potential,” among others. By their
nature, forward-looking statements are necessarily subject to a high degree of uncertainty and involve known and unknown risks, uncertainties,
assumptions and other factors because they relate to events and depend on circumstances that will occur in the future whether or not outside
of our control. Such factors may cause actual results, performance or developments to differ materially from those expressed or implied
by such forward-looking statements and there can be no assurance that such forward-looking statements will prove to be correct. The forward-looking
statements included herein speak only as at the date of this press release and we do not undertake any obligation to update these forward-looking
statements. Past performance does not guarantee or predict future performance. Moreover, neither we nor our affiliates, officers, employees
and agents undertake any obligation to review, update or confirm expectations or estimates or to release any revisions to any forward-looking
statements to reflect events that occur or circumstances that arise in relation to the content of this press release. Further information
on these and other factors that could affect our financial results is included in filings we have made and will make with the U.S. Securities
and Exchange Commission from time to time.
i
Adjusted Distributable Earnings is calculated as Distributable Earnings less non-operational expenses.
ii
Fee related earnings, or FRE, is a metric to monitor the baseline performance of, and trends in, our business, in a manner that does not
include performance fees or investment income. We calculate FRE as operating profit less (a) net revenue from realized performance fees,
less (b) net revenue from unrealized performance fees, plus (c) compensation allocated in relation to performance fees.
iii
FRE per share is calculated considering the number of outstanding shares at the end of the current quarter. Year-to-date values are calculated
as the sum of the last two quarters.
iv
Other financial expenses include the interest related to Vinci SPS’ acquisition.
v
Distributable Earnings is used as a reference point by our board of directors for determining the amount of earnings available to distribute
to shareholders as dividends. Distributable Earnings is calculated as profit for the year, less (a) net revenue from unrealized performance
fees, plus (b) income taxes from unrealized performance fees, plus (c) compensation allocated in relation to unrealized performance fees,
less (d) unrealized gain from GP investment income, less (e) unrealized gain from financial income, plus (f) income taxes on unrealized
gain from GP investment income, plus (g) income taxes on unrealized gain from financial income.
vi
Non-operational expenses are composed by expenses related to professional services to matters related to acquisitions and our international
corporate organization.
vii
Adjusted DE per share is calculated considering the number of outstanding shares at the end of the current quarter. Year-to-date values
are calculated as the sum of the last two quarters.
viii Net revenue from Fund Management
and Advisory is a performance measure that we use to assess our ability to generate profits from our fund management and advisory business
without measuring for the outcomes from funds above their respective benchmarks. We calculate Net Revenue from Fund Management and Advisory
as net revenue from services rendered less (a) net revenue from realized performance fees and less (b) net revenue from unrealized performance
fees.
ix
FRE Margin is calculated as FRE over total net management and advisory fees.
x
“Performance Related Earnings”, or “PRE”, is a performance measure that we use to assess our ability to generate
profits from revenue that relies on outcome from funds above their respective benchmarks. We calculate PRE as operating profit, less (a)
net revenue from fund management and advisory, less (b) operating expenses, such as segment personnel, G&A, corporate center and bonus
related to management and advisory.
xi
Segment Distributable Earnings is Vinci Partners’ segment profitability measure used to make operating decisions and assess performance
across the company’s five segments (Private Markets, Liquid Strategies, Investment Products and Solutions, Retirement Services and
Financial Advisory). Segment Distributable Earnings is calculated as operating profit less (a) net revenue from unrealized performance
fees, plus (b) compensation allocated in relation to unrealized performance fees, plus (c) realized gain from GP investment income.
xii
Adjusted DE Margin is calculated as adjusted DE over the sum of management and advisory fee related revenues, realized performance revenue,
realized GP investment income and realized financial income, net of revenue tax.
xiii
“Total compensation and benefits” are the result of the profit sharing paid to our employees as (a) bonus compensation related
to management advisory and (b) performance-based compensation.
xiv
“Other Items” comprise the income/(loss) generated by contingent consideration adjustment and financial expenses related to
acquisitions.
xv
“Contingent consideration adjustment related to acquisitions”, after-tax, reflects the change in the earn out’s fair
value to be paid in 2027. On June 30, 2023, Vinci revaluated the fair value of the obligation based on the economic conditions at the
date, resulting in an increase of the contingent consideration fair value. The variation was recognized as a loss in the financial result.
xvi
“Segment personnel expenses” are composed of the salary-part compensation paid to employees and partners of our funds’
management teams.
xvii
“Corporate center expenses” are composed by the salary-compensation paid to employees and partners of our support teams and
other expenses, such as research, risk, legal & compliance, investor relations, operations and ESG.
xviii
“Other general and administrative expenses” is made up of third-party expenses, depreciation and amortization, travel and
representation, marketing expenses, administrative fees, non-operating taxes, third-party consultants’ fees, such as legal and accounting,
and office consumables.
xix “GP investment income”
is income from proprietary investments made by us in our own Private Markets’ funds, used as GP Commitments.
xx “Financial income” is
income generated through the investments made with our cash and cash equivalents in cash and bank deposits, certificate of deposits and
proprietary investments in our Liquid Funds from our public equities and hedge funds’ segments and listed REITs from our real estate
segment.
xxi
“Leasing expenses” include costs from the company’s sub-leasing activities.
xxii
“Share Based Plan” is the composition of two benefit programs: SOP (Stok Option Plan) and RSU (Restricted Stock Units). In
Stock Option Plan the company concedes to an employee the option to buy stock in the company with stated fixed price. The Restricted Stock
Units concedes company shares to an employee through a vesting plan in which RSUs are assigned a fair market value.
xxiii
Income taxes is comprised of taxes on our corporate income tax and social contribution taxes. We are taxed on an actual taxable profit
regime, while part of our subsidiaries is taxed based on deemed profit.
xxiv
AUM” refers to assets under management. Our assets under management equal the sum of: (1) the fair market value of the investments
held by funds plus the capital that we are entitled to call from investors in those funds pursuant to the terms of their capital commitments
to those funds (plus the fair market value of co-investments arranged by us that were made or could be made by limited partners of our
corporate private equity funds and portfolio companies of such funds); (2) the net asset value of our public equity funds, hedge funds
and closed-end mutual funds; and (3) the amount of capital raised for our credit funds. AUM includes double counting related to funds
from one segment that invest in funds from another segment. Those cases occur mainly due to (a) fund of funds of investment products and
solutions segment, and (b) investment funds in general that invest part of their cash in credit segment and hedge fund segment funds to
maintain liquidity and provide for returns on cash. Such amounts are eliminated on consolidation. The bylaws of the relevant funds prohibit
double-charging fees on AUM across segments. Therefore, while our AUM by segment may double-count funds from one segment that invest in
funds from another segment, the revenues for any given segment do not include revenue in respect of assets managed by another segment,
which means there are no intercompany eliminations on revenues in our results of operations.
xxv
NAV is the net asset value of each fund. For listed vehicles, the NAV represents the Market valuation of the fund.
xxvi
CDI is an average of interbank overnight rates in Brazil (daily average for the period).
xxvii
Atlas strategy comprises Atlas FIC FIM and Atlas Institucional FIC FIM.
xxviii
IPCA is a broad consumer price index measured by the IBGE.
xxix IMAB
is composed by government bonds indexed to IPCA. IMAB 5 also comprises government bonds indexed to IPCA but only the one´s
with up to 5 Years duration.
xxx
Mosaico strategy comprises Vinci Mosaico FIA, Vinci Mosaico Institucional FIA and Vinci Mosaico Advisory FIA.
xxxi
IBOV is the Brazilian stock market most relevant index.
xxxii
Equilibrio Strategy comprises IP&S Family of pension plans.
xxxiii
IFIX is an index composed by listed REITs in the brazilian stock exchange.
xxxiv
If IMAB 5 Average is: a) less or equal to 2%, X=3% per year; b) between 2%-4%, X= Average IMAB 5+1% per year; c) Between 4%-5%, X=5% per
year; d) greater or equal to 5%, X= IMAB 5 Average.
xxxv Track
record information is presented throughout this release on a pro forma basis and in local currency, excluding PIPE investments, a
strategy that will be discontinued in VCP III.
xxxvi
“MOIC” means multiple on invested capital, a ratio intended to represent how much value an investment has returned,
and is calculated as realized value plus unrealized value, divided by the total amount invested, gross of expenses and fees.
xxxvii
“IRR” means the internal rate of return, which is a discount rate that makes the net present value of all cash flows equal
to zero in a discounted cash flow analysis.
xxxviii
Total commitments for VCP III include R$1.3 billion in co-investments. Track record presented for the VCP strategy as of 1Q’23,
due to fund’s administrator timeline to disclose the quarterly markup of the fund.
xxxix
Track record for VIR strategy is presented as of 1Q’23, due to fund’s administrator timeline to disclose the quarterly markup
of the fund.
xl
Track record for Vinci SPS strategy is presented as of 2Q’23.
xli
Track record for FIP Infra is presented as of 1Q’23.
xlii
Track record for VIAS is presented as of 1Q’23.
xliii
Track record for VICC is presented as of 1Q’23.
xliv
Track record for VFDL is presented as of 2Q’23.
xlv
Track record for Vinci Credit Infra is presented as of 2Q’23.
xlvi
US$ Distributable Earnings was calculated considering the exchange rate from USD to BRL of 4.9245 as of August 08, 2023, when dividends
were approved by our Board of Directors.
xlvii
Per Share calculations are based on end of period Participating Common Shares.
xlviii
Actual dividends per common share are calculated considering the share count as of the applicable record date.
xlix
As of June 30, 2023, Public Float was comprised of 12,809,281 Class A common shares.
l
The remaining capital committed in FIP Infra Transmissão co-investment will not be called by the fund, which is already in divestment
period.
liThe
remaining capital committed in FIP Infra Transmissão will not be called by the fund, which is already in divestment
period.
lii
Brazilian tax law establishes that companies that generate gross revenues of up to R$ 78,000.00 in the prior fiscal year
may calculate income taxes as a percentage of gross revenue, using the presumed profit income tax regime. The Entity's subsidiaries adopted
this tax regime and the effect of the presumed profit of subsidiaries represents the difference between the taxation based on this method
and the amount that would be due based on the statutory rate applied to the taxable profit of the subsidiaries.

RIO DE JANEIRO
55 21 2159 6000
Av. Bartolomeu Mitre,
336
Leblon - 22431-002
SÃO PAULO
55 11 3572 3700
Av. Brigadeiro Faria
Lima, 2.277 – 14º andar
Jardim Paulistano -
01452-000
55 11 3230 2541 | Vinci
SPS
Rua Iguatemi, 448 –
CJ 601
Itaim Bibi - 01451-010
55 16 2101 4641 | Ribeirão
Preto
Av. Presidente Vargas,
2.121 – Sala 106
Jardim América
- 14020-260
RECIFE
55 81 3204 6811
Av. República
do Líbano, 251 - Sala 301 - Torre A
Pina - 51110-160
NEW YORK
1 646 559 8000
780 Third Avenue, 25th
Floor
10017
RIO DE JANEIRO
55 21 2159 6000
Av. Bartolomeu Mitre,
336
Leblon - 22431-002
SÃO PAULO
55 11 3572 3700
Av. Brigadeiro Faria
Lima, 2.277 – 14º andar
Jardim Paulistano
- 01452-000
55 11 3230 2541 |
Vinci SPS
Rua Iguatemi, 448
– CJ 601
Itaim Bibi - 01451-010
55 16 2101 4641 |
Ribeirão Preto
Av. Presidente Vargas,
2.121 – Sala 106
Jardim América
- 14020-260
RECIFE
55 81 3204 6811
Av. República
do Líbano, 251 - Sala 301 - Torre A
Pina - 51110-160
NOVA YORK
1 646 559 8000
780 Third Avenue,
25th Floor
10017
|
Exhibit 99.3
Vinci Partners Investments Ltd.
Interim Consolidated Financial Statements as of June 30, 2023
Vinci Partners Investments Ltd.
Consolidated balance sheet
All amounts in thousands of reais
| Assets |
|
Note |
|
06/30/2023 |
|
12/31/2022 |
|
| |
|
|
|
|
|
|
|
| Current assets |
|
|
|
|
|
|
|
| Cash and cash equivalents |
|
5(d) |
|
153,992 |
|
136,581 |
|
| Cash and bank deposits |
|
5(d) |
|
31,403 |
|
30,108 |
|
| Financial instruments at fair value through profit or loss |
|
5(d) |
|
122,589 |
|
106,473 |
|
| Financial instruments at fair value through profit or loss |
|
5(c) |
|
1,182,812 |
|
1,243,764 |
|
| Accounts receivable |
|
5(a) |
|
66,312 |
|
57,675 |
|
| Sub-leases receivable |
|
10 |
|
3,909 |
|
1,500 |
|
| Taxes recoverable |
|
|
|
1,921 |
|
1,555 |
|
| Other assets |
|
6 |
|
14,505 |
|
16,481 |
|
| Total current assets |
|
|
|
1,423,451 |
|
1,457,556 |
|
| |
|
|
|
|
|
|
|
| Non-current assets |
|
|
|
|
|
|
|
| Financial instruments at fair value through profit or loss |
|
5(c) |
|
6,423 |
|
5,985 |
|
| Accounts receivable |
|
5(a) |
|
16,904 |
|
17,298 |
|
| Sub-leases receivable |
|
10 |
|
3,149 |
|
1,343 |
|
| Taxes recoverable |
|
|
|
294 |
|
3,141 |
|
| Deferred taxes |
|
20 |
|
10,721 |
|
9,241 |
|
| Other assets |
|
6 |
|
928 |
|
1,065 |
|
| |
|
|
|
38,419 |
|
38,073 |
|
| |
|
|
|
|
|
|
|
| Property and equipment |
|
8 |
|
12,980 |
|
11,951 |
|
| Right of use - Leases |
|
10 |
|
60,054 |
|
70,136 |
|
| Intangible assets |
|
9 |
|
193,956 |
|
189,238 |
|
| Total non-current assets |
|
|
|
305,409 |
|
309,398 |
|
| |
|
|
|
|
|
|
|
| Total assets |
|
|
|
1,728,860 |
|
1,766,954 |
|
The accompanying notes are an integral part of these interim consolidated
financial statements.
Vinci Partners Investments Ltd.
Consolidated balance sheet
All amounts in thousands of reais
| Liabilities and equity |
|
Note |
|
06/30/2023 |
|
12/31/2022 |
|
| |
|
|
|
|
|
|
|
| Current liabilities |
|
|
|
|
|
|
|
| Trade payables |
|
|
|
438 |
|
1,247 |
|
| Leases |
|
10 and 5(e) |
|
24,381 |
|
24,147 |
|
| Accounts payable |
|
11 |
|
7,338 |
|
7,328 |
|
| Labor and social security obligations |
|
12 |
|
52,689 |
|
87,732 |
|
| Loans and obligations |
|
14 |
|
22,207 |
|
13,168 |
|
| Taxes and contributions payable |
|
13 |
|
19,292 |
|
22,291 |
|
| Total current liabilities |
|
|
|
126,345 |
|
155,913 |
|
| |
|
|
|
|
|
|
|
| Non-current liabilities |
|
|
|
|
|
|
|
| Leases |
|
10 and 5(e) |
|
54,085 |
|
62,064 |
|
| Labor and social security obligations |
|
12 |
|
2,906 |
|
2,968 |
|
| Loans and obligations |
|
14 |
|
158,206 |
|
162,122 |
|
| Deferred taxes |
|
19 |
|
7,423 |
|
8,340 |
|
| Retirement plans liabilities |
|
15 |
|
13,401 |
|
- |
|
| Total non-current liabilities |
|
|
|
236,021 |
|
235,494 |
|
| |
|
|
|
|
|
|
|
| Total liabilities |
|
|
|
362,366 |
|
391,407 |
|
| |
|
|
|
|
|
|
|
| Equity |
|
16 |
|
|
|
|
|
| Share capital |
|
|
|
15 |
|
15 |
|
| Additional paid-in capital |
|
|
|
1,379,255 |
|
1,382,038 |
|
| Treasury shares |
|
16(f) |
|
(154,247) |
|
(114,978) |
|
| Retained earnings |
|
|
|
113,122 |
|
81,310 |
|
| Other reserves |
|
|
|
25,556 |
|
24,149 |
|
| |
|
|
|
1,363,701 |
|
1,372,534 |
|
| |
|
|
|
|
|
|
|
| Non-controlling interests in the equity of subsidiaries |
|
7(b) |
|
2,793 |
|
3,013 |
|
| |
|
|
|
|
|
|
|
| Total equity |
|
|
|
1,366,494 |
|
1,375,547 |
|
| |
|
|
|
|
|
|
|
| Total liabilities and equity |
|
|
|
1,728,860 |
|
1,766,954 |
|
The accompanying notes are an integral part of these interim consolidated
financial statements.
Vinci Partners Investments Ltd.
Consolidated balance sheet
All amounts in thousands of reais
| |
|
|
Six months ended June 30 |
|
Three months ended June 30 |
| Statements of Income |
Note |
|
2023 |
|
2022 |
|
2023 |
|
2022 |
| |
|
|
|
|
|
|
|
|
|
| |
|
|
|
|
|
|
|
|
|
| Net revenue from services rendered |
17 |
|
219,892 |
|
193,844 |
|
117,584 |
|
99,769 |
| |
|
|
|
|
|
|
|
|
|
| General and administrative expenses |
18 |
|
(119,062) |
|
(107,847) |
|
(64,932) |
|
(53,886) |
| |
|
|
|
|
|
|
|
|
|
| Operating profit |
|
|
100,830 |
|
85,997 |
|
52,652 |
|
45,883 |
| |
|
|
|
|
|
|
|
|
|
| Finance income |
19 |
|
69,354 |
|
37,679 |
|
65,101 |
|
14,687 |
| Finance expenses |
19 |
|
(21,201) |
|
(8,522) |
|
(14,357) |
|
(2,461) |
| |
|
|
|
|
|
|
|
|
|
| Finance profit/(loss), net |
|
|
48,153 |
|
29,157 |
|
50,744 |
|
12,226 |
| |
|
|
|
|
|
|
|
|
|
| Profit before income taxes |
|
|
148,983 |
|
115,154 |
|
103,396 |
|
58,109 |
| |
|
|
|
|
|
|
|
|
|
| Income taxes |
20 |
|
(24,725) |
|
(23,450) |
|
(11,844) |
|
(11,711) |
| |
|
|
|
|
|
|
|
|
|
| Profit for the period |
|
|
124,258 |
|
91,704 |
|
91,552 |
|
46,398 |
| |
|
|
|
|
|
|
|
|
|
| Attributable to the shareholders of the parent company |
|
|
124,478 |
|
91,709 |
|
91,741 |
|
46,400 |
| Attributable to non-controlling interests |
|
|
(220) |
|
(5) |
|
(189) |
|
(2) |
| |
|
|
|
|
|
|
|
|
|
| Basic earnings per share in Brazilian Reais |
|
|
2.20 |
|
1.62 |
|
1.62 |
|
0.82 |
| Diluted earnings per share in Brazilian Reais |
|
|
2.17 |
|
1.61 |
|
1.60 |
|
0.81 |
The accompanying notes are an integral part of these interim consolidated
financial statements.
Vinci Partners Investments Ltd.
Consolidated balance sheet
All amounts in thousands of reais
| |
|
Six months ended June 30 |
|
Three months ended June 30 |
| |
|
2023 |
|
2022 |
|
2023 |
|
2022 |
| |
|
|
|
|
|
|
|
|
| Profit for the period |
|
124,258 |
|
91,704 |
|
91,552 |
|
46,398 |
| |
|
|
|
|
|
|
|
|
| Other comprehensive income |
|
|
|
|
|
|
|
|
| Items that may be reclassified to profit or loss: |
|
|
|
|
|
|
|
|
| Foreign exchange variance of investees |
|
|
|
|
|
|
|
|
| Vinci Capital Partners GP Limited |
|
(9) |
|
(11) |
|
(6) |
|
27 |
| Vinci USA LLC |
|
(2,502) |
|
(844) |
|
(1,633) |
|
1,242 |
| Vinci Capital Partners III GP Limited |
|
(65) |
|
4 |
|
(43) |
|
33 |
| GGN GP LLC |
|
(8) |
|
(8) |
|
(5) |
|
11 |
| VICC Infra GP LLC |
|
(12) |
|
16 |
|
(8) |
|
16 |
| Vinci Capital Partners IV GP LLC |
|
(160) |
|
- |
|
(112) |
|
- |
| |
|
|
|
|
|
|
|
|
| Total comprehensive income for the period |
|
121,502 |
|
90,861 |
|
89,745 |
|
47,727 |
| |
|
|
|
|
|
|
|
|
| Attributable to: |
|
|
|
|
|
|
|
|
| Shareholders of the parent company |
|
121,722 |
|
90,866 |
|
89,934 |
|
47,729 |
| Non-controlling interests |
|
(220) |
|
(5) |
|
(189) |
|
(2) |
| |
|
|
|
|
|
|
|
|
| |
|
121,502 |
|
90,861 |
|
89,745 |
|
47,727 |
The accompanying notes are an integral part of these interim consolidated
financial statements.
Vinci Partners Investments Ltd.
Consolidated balance sheet
All amounts in thousands of reais
| |
Share |
|
Additional |
|
Retained |
|
Other |
|
Treasury |
|
|
|
Non-controlling |
|
Total |
|
| |
capital |
|
paid-in capital |
|
earnings |
|
reserves |
|
shares |
|
Total |
|
interests |
|
equity |
|
| |
|
|
|
|
|
|
|
|
|
|
|
|
|
|
|
|
| |
|
|
|
|
|
|
|
|
|
|
|
|
|
|
|
|
| At January 01, 2022 |
15 |
|
1,382,038 |
|
70,183 |
|
15,182 |
|
(52,585) |
|
1,414,833 |
|
43 |
|
1,414,876 |
|
| |
|
|
|
|
|
|
|
|
|
|
|
|
|
|
|
|
| Profit for the period |
- |
|
- |
|
91,709 |
|
- |
|
- |
|
91,709 |
|
(5) |
|
91,704 |
|
| Other comprehensive income: |
|
|
|
|
|
|
|
|
|
|
|
|
|
|
|
|
| Foreign exchange variation of investee located abroad |
- |
|
- |
|
- |
|
(843) |
|
- |
|
(843) |
|
(2) |
|
(845) |
|
| Share based payments |
- |
|
- |
|
- |
|
2,728 |
|
- |
|
2,728 |
|
- |
|
2,728 |
|
| Treasury shares bought |
- |
|
- |
|
- |
|
- |
|
(35,840) |
|
(35,840) |
|
- |
|
(35,840) |
|
| Allocation of profit: |
|
|
|
|
|
|
|
|
|
|
|
|
|
|
|
|
| Dividends |
- |
|
- |
|
(103,665) |
|
- |
|
- |
|
(103,665) |
|
- |
|
(103,665) |
|
| |
|
|
|
|
|
|
|
|
|
|
|
|
|
|
|
|
| |
|
|
|
|
|
|
|
|
|
|
|
|
|
|
|
|
| At June 30, 2022 |
15 |
|
1,382,038 |
|
58,227 |
|
17,067 |
|
(88,425) |
|
1,368,922 |
|
36 |
|
1,368,958 |
|
| |
|
|
|
|
|
|
|
|
|
|
|
|
|
|
|
|
| |
|
|
|
|
|
|
|
|
|
|
|
|
|
|
|
|
| At January 01, 2023 |
15 |
|
1,382,038 |
|
81,310 |
|
24,149 |
|
(114,978) |
|
1,372,534 |
|
3,013 |
|
1,375,547 |
|
| |
|
|
|
|
|
|
|
|
|
|
|
|
|
|
|
|
| Profit for the period |
- |
|
- |
|
124,478 |
|
- |
|
- |
|
124,478 |
|
(220) |
|
124,258 |
|
| Other comprehensive income: |
|
|
|
|
|
|
|
|
|
|
|
|
|
|
|
|
| Foreign exchange variation of investee located abroad |
- |
|
- |
|
- |
|
(2,756) |
|
- |
|
(2,756) |
|
- |
|
(2,756) |
|
| Share based payments |
- |
|
(2,783) |
|
- |
|
4,163 |
|
2,783 |
|
4,163 |
|
- |
|
4,163 |
|
| Treasury shares bought |
- |
|
- |
|
- |
|
- |
|
(42,052) |
|
(42,052) |
|
- |
|
(42,052) |
|
| Allocation of profit: |
|
|
|
|
|
|
|
|
|
|
|
|
|
|
|
|
| Dividends |
- |
|
- |
|
(92,666) |
|
- |
|
- |
|
(92,666) |
|
- |
|
(92,666) |
|
| |
|
|
|
|
|
|
|
|
|
|
|
|
|
|
|
|
| |
|
|
|
|
|
|
|
|
|
|
|
|
|
|
|
|
| At June 30, 2023 |
15 |
|
1,379,255 |
|
113,122 |
|
25,556 |
|
(154,247) |
|
1,363,701 |
|
2,793 |
|
1,366,494 |
|
| |
|
|
|
|
|
|
|
|
|
|
|
|
|
|
|
|
The accompanying notes are an integral part of these interim consolidated
financial statements.
Vinci Partners Investments Ltd.
Consolidated balance sheet
All amounts in thousands of reais
| |
Notes |
Six months ended June 30 |
|
| |
|
2023 |
|
2022 |
|
| Cash flows from operating activities |
|
|
|
|
|
| |
|
|
|
|
|
| Profit before taxation |
17 |
148,983 |
|
115,154 |
|
| Adjustments to reconcile net income to cash flows from operations: |
|
|
|
|
|
| Depreciation and amortization |
|
8,997 |
|
7,258 |
|
| Investment income of financial instruments at fair value through profit or loss |
|
(49,079) |
|
(31,941) |
|
| Interest expense on loans and obligations |
18 |
7,838 |
|
- |
|
| Interest on contingent consideration |
18 |
3,227 |
|
- |
|
| Share based payments |
17 |
5,600 |
|
2,728 |
|
| Financial result on lease agreements |
18 |
4,888 |
|
4,661 |
|
| |
|
130,454 |
|
97,860 |
|
| Changes in assets and liabilities |
|
|
|
|
|
| |
|
|
|
|
|
| Accounts receivables |
|
(8,243) |
|
(1,682) |
|
| Taxes recoverable |
|
2,481 |
|
(1,324) |
|
| Other assets |
|
2,117 |
|
(6,028) |
|
| Trade payables |
|
(810) |
|
(518) |
|
| Accounts payable |
|
1,137 |
|
43 |
|
| Labor and social security obligations |
|
(36,541) |
|
(61,988) |
|
| Taxes and contributions payable |
|
(575) |
|
(1,571) |
|
| Contributions for retirements plans |
|
13,226 |
|
- |
|
| |
|
(27,208) |
|
(73,068) |
|
| |
|
|
|
|
|
| Cash generated from operations |
|
103,246 |
|
24,792 |
|
| Income tax paid |
|
(29,426) |
|
(29,603) |
|
| Net cash inflow (outflow) from operating activities |
|
73,820 |
|
(4,811) |
|
|
|
|
|
|
|
| Cash flows from investing activities |
|
|
|
|
|
| Purchases of property and equipment and additions to intangible assets |
|
(9,829) |
|
(1,160) |
|
| Purchase of financial instruments at fair value through profit or loss |
|
(56,061) |
|
(69,856) |
|
| Sales of financial instruments at fair value through profit or loss |
|
165,829 |
|
186,643 |
|
| |
|
|
|
|
|
| Net cash inflow from investing activities |
|
99,939 |
|
115,627 |
|
| |
|
|
|
|
|
| Cash flows from financing activities |
|
|
|
|
|
| Interest payments of loans and obligations |
|
(5,943) |
|
- |
|
| Treasury shares acquisition paid |
|
(42,540) |
|
(37,062) |
|
| Lease payments, net of sublease received |
|
(11,938) |
|
(11,358) |
|
| Dividends paid |
|
(91,502) |
|
(104,153) |
|
| Net cash (outflow) from financing activities |
|
(151,923) |
|
(152,573) |
|
| |
|
|
|
|
|
| Net increase (decrease) in cash and cash equivalents |
|
21,836 |
|
(41,757) |
|
| |
|
|
|
|
|
| Cash and cash equivalents at the beginning of the period |
5(d) |
136,581 |
|
102,569 |
|
| |
|
|
|
|
|
| Foreign exchange variation of cash and cash equivalents in subsidiaries abroad |
|
(4,425) |
|
(3,032) |
|
| |
|
|
|
|
|
| Cash and cash equivalents at the end of the period (Note 5d) |
5(d) |
153,992 |
|
57,780 |
|
| |
|
|
|
|
|
|
|
Non-cash financing activities
Dividends declared and not yet paid until June 30, 2023 and 2022 were
R$ 3,791 and R$ 4,363 (Note 11), respectively.
The accompanying notes are an integral part of these interim consolidated
financial statements.
Vinci Partners Investments Ltd.
Consolidated balance sheet
All amounts in thousands of reais
Vinci Partners Investments Ltd. Is an exempted
company incorporated in the Cayman Islands (referred to herein as “Entity”, “Group” or “Vinci”). The
Group started its activities in September 2009. Its objective is to hold investments in the capital of other companies as partner (shareholder).
The investees are specialized in rendering alternative investment management, asset allocation and financial advisory services.
The registered office of the Entity is at Harneys
Fiduciary (Cayman) Limited, 4th Floor, Harbour Place, 103 South Church Street, P.O. Box 10240, Grand Cayman KY1-1002, Cayman
Islands.
| 2 | Summary of significant accounting policies |
| 2.1 | Basis of preparation and presentation |
The unaudited interim condensed consolidated financial
statements (herein referred to “interim consolidated financial statements”) have been prepared in accordance with IAS 34 Interim
Financial Reporting as issued by the International Accounting Standards Board (“IASB”).
The unaudited interim condensed consolidated financial
statements do not include all the information and disclosures required in the annual financial statements and should be read in conjunction
with the Group’s annual consolidated financial statements as of December 31, 2022.
The accounting policies adopted are consistent
with those of the previous financial year and corresponding interim reporting period.
The unaudited interim condensed consolidated financial
statements are presented in Brazilian reais (“R$”), and all amounts disclosed in the financial statements and notes have been
rounded off to the nearest thousand currency units unless otherwise stated.
The issuance of these financial statements was
authorized by the Entity's management on August 10, 2023.
| (a) | Interim consolidated financial statements |
Vinci operates as an asset management firm. The
Group focuses on private markets, liquid strategies, financial advisory, investment products and solutions, and retirement services, which
comprise the main activity of the Group.
The Group controls an entity where the Group is
exposed to, or has rights to, variable returns from its involvement with the entity and has the ability to affect those returns through
its power to direct the activities of the entity.
Also, the Entity holds interest in subsidiaries
whose main purpose and activities are providing services that relate to the Entity’s activities. Therefore, the Entity consolidates
these subsidiaries.
Ownership interest in subsidiaries on June 30, 2023 and December 31,
2022 are as follows:
Vinci Partners Investments Ltd.
Consolidated balance sheet
All amounts in thousands of reais
| |
Interest - % |
| |
|
|
|
| |
06/30/2023 |
|
12/31/2022 |
| |
|
|
|
| Subsidiaries |
|
|
|
| Vinci Partners Investimentos Ltda. |
100 |
|
100 |
| Vinci Assessoria financeira Ltda. (1) |
100 |
|
100 |
| Vinci Equities Gestora de Recursos Ltda. (1) |
100 |
|
100 |
| Vinci Gestora de Recursos Ltda. (1) |
100 |
|
100 |
| Vinci Capital Gestora de Recursos Ltda. (1) |
100 |
|
100 |
| Vinci Soluções de Investimentos Ltda. (2) |
100 |
|
100 |
| Vinci Real Estate Gestora de Recursos Ltda. (1) |
100 |
|
100 |
| Vinci Capital Partners GP Limited. |
100 |
|
100 |
| Vinci Partners USA LLC |
100 |
|
100 |
| Vinci GGN Gestão de Recursos Ltda. (1) |
100 |
|
100 |
| Vinci Infraestrutura Gestora de Recursos Ltda. |
100 |
|
100 |
| Vinci Capital Partners GP III Limited. |
100 |
|
100 |
| GGN GP LLC |
100 |
|
100 |
| Amalfi Empreendimentos e Participações S.A. |
- |
|
100 |
| Vinci APM Ltda. (1) |
100 |
|
100 |
| Vinci Monalisa FIM Crédito Privado IE (3) |
100 |
|
100 |
| Vinci Asset Allocation Ltda. |
75 |
|
75 |
| VICC Infra GP LLC |
100 |
|
100 |
| Vinci Capital Partners IV GP LLC |
100 |
|
100 |
| Vinci Holding Securitária Ltda. |
85 |
|
85 |
| Vinci Vida e Previdência S.A. (4) |
85 |
|
85 |
| SPS Capital Gestão de Recursos Ltda. (5) |
100 |
|
100 |
| VICC Infra GP (Lux), S.A.R.L. |
100 |
|
- |
| (1) | Minority interest represents less than 0.001%. |
| (3) | Under the terms of IFRS 10, the Entity does not consolidate
its investment in Vinci Monalisa FIM Crédito Privado IE and measures at fair value through profit or loss in accordance with IFRS
9. |
| (4) | Vinci has an indirect interest at Vinci Vida e Previdência
of 85% through its subsidiary Vinci Holding Securitária Ltda., which holds 100% of ownership interest at Vinci Vida e Previdência. |
| (5) | On 16 August 2022, Vinci Soluções de Investimentos Ltda. acquired 90% of the issued share capital of SPS Capital Gestão
de Recursos Ltda. The acquisition gives to Vinci Soluções de Investimentos the right of 100% on the economic interest of
SPS Gestão de Recursos Ltda. |
Subsidiaries are all entities (including structured
entities) over which the Group has control. Subsidiaries are fully consolidated from the date on which control is transferred to the Group.
They are deconsolidated from the date that control ceases.
Inter-company transactions, balances and unrealized
gains on transactions between Group companies are eliminated. Unrealized losses are also eliminated unless the transaction provides evidence
of an impairment of the transferred asset. Accounting policies of subsidiaries have been changed where necessary to ensure consistency
with the policies adopted by the Group.
Non-controlling interests in the results and equity
of subsidiaries are shown separately in the consolidated statement of profit or loss, consolidated statement of comprehensive income,
consolidated statement of changes in equity and consolidated balance sheet respectively.
Vinci Partners Investments Ltd.
Consolidated balance sheet
All amounts in thousands of reais
The Group treats transactions with non-controlling
interests that do not result in a loss of control as transactions with equity owners of the Group. A change in ownership interest results
in an adjustment between the carrying amounts of the controlling and non-controlling interests to reflect their relative interests in
the subsidiary. Any difference between the amount of the adjustment to non-controlling interests and any consideration paid or received
is recognized in another reserve within equity attributable to owners of Entity.
When the Group ceases to consolidate an investment
or account for it under equity method because of a loss of control, joint control or significant influence, any retained interest in the
entity is remeasured to its fair value, with the change in carrying amount recognized in profit or loss. This fair value becomes the initial
carrying amount for the purposes of subsequently accounting for the retained interest as an associate, joint venture or financial asset.
In addition, any amounts previously recognized in other comprehensive income in respect of that entity are accounted for as if the group
had directly disposed of the related assets or liabilities. This may mean that amounts previously recognized in other comprehensive income
are reclassified to profit or loss.
During January 2021, the members of the Board
of Directors of Vinci Partners Investments Ltd were appointed. Under the supervision of the Board of Directors, the CEO is responsible
for the decision-making process related to executive themes, resources allocation and strategic decisions of Vinci.
The strategic decisions of the Group comprise
five distinct business segments: (i) Private market strategies, (ii) Liquid strategies, (iii) Investment products and solutions; (iv)
Financial advisory and (v) Vinci retirement services (Note 20).
Strategies were sorted out within business segments
following technical and strategic similarities among funds’ attributes, such as management and performance fee structures, liquidity
constraints, targeted returns and investor profile.
| 3 | Accounting estimates and judgments |
The Entity makes estimates and assumptions concerning
the future, based on historical experience and other factors, including expectations of future events. The resulting accounting estimates
will, by definition, seldom equal the related actual results. The main estimations and assumptions made by the Entity is included as follow:
| • | Allowance of expected credit losses of accounts receivable. |
| • | Provision for profit sharing. |
| • | Consolidation of subsidiaries. |
| • | Fair value measurement of financial assets. |
| • | Provision for contingent liabilities. |
| • | Impairment for goodwill and other intangible assets. |
| • | Fair value measurement of contingent consideration. |
| • | Fair value of share-based payments. |
| 4 | Financial risk management |
The main risks related to the financial instruments
are credit risk, market risk, and liquidity risk, as defined below. The management of such risks involves various levels in the Entity
and comprehends a number of policies and strategies. The Group's risk management focuses on the unpredictability of financial markets
and seeks to mitigate potential adverse impacts on the Group's financial performance.
| 4.1 | Financial risk factors |
This note explains the Group's exposure to financial
risks and how these risks could affect the Group's future financial performance. Current year profit and loss information has been included
where relevant to add further context.
Vinci Partners Investments Ltd.
Consolidated balance sheet
All amounts in thousands of reais
The Group's risk management is predominantly controlled
by a risk assessment department under process and controls approved by the management. The management provides written process and controls
for overall risk management, as well as policies covering specific areas, such as foreign exchange risk, interest rate risk, credit risk,
use of derivative financial instruments and non-derivative financial instruments, and investment of excess liquidity.
Credit risk arises from cash and cash equivalents,
contractual cash flows of debt investments carried at amortized cost, at fair value through profit or loss (FVTPL), and deposits with
banks and financial institutions, as well as credit exposures to wholesale and retail customers, including outstanding receivables.
(i) Risk management
Vinci's treasury manages credit risk on a group
basis. As of June 30, 2023, and 2022 the expected credit losses are considered immaterial due to the short maturities of the deposits
and the credit quality of the main counterparty, which have a credit rating AAA evaluated by Fitch Ratings. The Entity has not suffered
any losses from cash and cash equivalent since inception. Vinci's treasury review expected credit losses on a regular basis.
(ii) Impairment of financial assets
The Group has the following types of financial
assets that are subject to the expected credit loss model:
| • | Debt investments carried at amortized cost. |
While cash and cash equivalents are also subject
to the impairment requirements of IFRS 9, the expected impairment loss was immaterial.
At the reporting date, the carrying amount value
of the Group’s financial assets and liabilities exposed to US Dollars were as follows:
| Balance sheet |
|
06/30/2023 |
|
12/31/2022 |
| |
|
|
|
|
| Cash and cash equivalents |
|
31,318 |
|
30,087 |
| Accounts receivable |
|
7,668 |
|
13,823 |
| Other receivables |
|
1,867 |
|
1,618 |
| Current assets |
|
40,853 |
|
45,528 |
| |
|
|
|
|
| Leases, property and equipment |
|
2,846 |
|
3,596 |
| Non-current assets |
|
2,846 |
|
3,596 |
| |
|
|
|
|
| Trade payables |
|
1,476 |
|
1,657 |
| Labor and social security obligations |
|
1,607 |
|
7,295 |
| Current liabilities |
|
3,083 |
|
8,952 |
| |
|
|
|
|
| Payables to related parties |
|
- |
|
608 |
| Other payables |
|
241 |
|
- |
| Lease |
|
1,385 |
|
1,973 |
| Non-current liabilities |
|
1,626 |
|
2,581 |
| |
|
|
|
|
| Net Equity |
|
38,990 |
|
37,591 |
Vinci Partners Investments Ltd.
Consolidated balance sheet
All amounts in thousands of reais
The aggregate net foreign exchange gains/losses recognized in profit
or loss were:
| |
|
Six months ended June 30 |
|
Three months ended June 30 |
| Net foreign exchange result for the period |
|
2023 |
2022 |
|
2023 |
2022 |
| |
|
|
|
|
|
|
| Financial revenue |
|
- |
2,086 |
|
- |
444 |
| Financial expense |
|
(775) |
(2,986) |
|
(620) |
- |
| |
|
|
|
|
|
|
| Net foreign exchange result, net |
|
(775) |
(900) |
|
(620) |
444 |
The Group operates internationally and is exposed
to foreign exchange risk, exclusively the US dollar.
Foreign exchange risk arises from future commercial
transactions and recognized assets and liabilities denominated in a currency that is not the functional currency of the Group.
(ii) Interest rate risk
The Group's profit or loss is sensitive to higher/lower
interest income from cash equivalents and fixed income funds as a result of changes in interest rates.
(iii) Price risk
The Group's exposure to investment securities
price risk arises from investments held by the group and classified in the balance sheet at fair value through profit or loss (note 5).
To manage its price risk arising from investments
in investment securities, the Group diversifies its portfolio. Diversification of the portfolio is done in accordance with the limits
set by the Group.
The majority of the Group's financial investments
that are exposed to significant price risk are the private equity investments and investments held by Monalisa FIM. Note 5(d) demonstrates
the sensitivity analyses of impact for the assets held by the Group.
Prudent liquidity risk management implies maintaining
sufficient cash and marketable securities and the availability of funding through an adequate amount of committed credit facilities to
meet obligations when due and to close out market positions. At the end of the reporting period the Group held bank deposits and certificates
of deposits of R$ 153,992 (12/31/2022 – R$ 136,581) that are expected to readily generate cash inflows for managing liquidity risk.
Net debt reconciliation
This section sets out an analysis of net debt
and the movements in net debt for each of the years presented.
| |
06/30/2023 |
12/31/2022 |
| Cash and cash equivalents |
153,992 |
136,581 |
| Financial instruments at fair value through profit or loss (i) |
1,182,812 |
1,243,764 |
| Trade payables |
(438) |
(1,247) |
| Labor and social security obligations |
(55,595) |
(90,700) |
| Accounts payable |
(7,336) |
(7,328) |
Vinci Partners Investments Ltd.
Consolidated balance sheet
All amounts in thousands of reais
| Lease liabilities |
(78,466) |
(86,211) |
| Commercial Notes |
(82,875) |
(83,212) |
| Consideration payable |
(45,812) |
(43,579) |
| Contingent consideration |
(51,725) |
(48,499) |
| Retirement plans liabilities |
(13,401) |
- |
| Net debt |
1,001,156 |
1,019,569 |
| (i) | Comprised of liquid and illiquid investments. Liquid investments are current assets that are traded in
an active market. Illiquid investments are comprised of assets that trade infrequently. |
| |
Financial liabilities |
Other assets |
| |
Payables |
Loans and obligations |
Retirement plans |
Lease liabilities |
Cash and cash equivalents |
Financial instruments at fair value through profit or loss |
| Net debt as at |
|
|
|
|
|
|
| December 31, 2021 |
(117,807) |
- |
- |
(85,544) |
102,569 |
1,372,926 |
| |
|
|
|
|
|
|
| Cash flow and dividends provision |
18,532 |
- |
- |
24,440 |
26,599 |
(215,046) |
| |
|
|
|
|
|
|
| Fair value adjustment |
- |
- |
- |
- |
7,413 |
85,884 |
|
Addition and finance expenses accrual
|
- |
(175,290) |
- |
(25,197) |
- |
- |
|
Foreign exchange adjustments
|
- |
- |
- |
- |
- |
- |
| Other changes (i) |
- |
- |
- |
90 |
- |
- |
| December 31, 2022 |
(99,275) |
(175,290) |
- |
(86,211) |
136,581 |
1,243,764 |
| |
|
|
|
|
|
|
| Cash flow and dividends provision |
35,906 |
- |
(13,226) |
12,765 |
12,100 |
(119,370) |
| |
|
|
|
|
|
|
| Fair value adjustment |
- |
- |
(175) |
- |
5,311 |
58,418 |
|
Addition and finance expenses accrual
|
- |
(5,122) |
- |
(5,148) |
- |
- |
|
Foreign exchange adjustments
|
- |
- |
- |
- |
- |
- |
| Other changes (i) |
- |
- |
- |
128 |
- |
- |
| June 30, 2023 |
(63,369) |
(180,412) |
(13,401) |
(78,466) |
153,992 |
1,182,812 |
(i) Other changes include non-cash movements, including Cumulative
Translation Adjustments (“CTA”) which will be presented as in other comprehensive income statements.
Maturities of financial liabilities
Except for the retirement plans liabilities, the
tables below analyze the Group's financial liabilities into relevant maturity groupings based on their contractual maturities for significant
financial liabilities.
Contractual maturities of
financial liabilities
at June 30, 2023 |
Less than 1 year |
Between 1 and 3 years |
Over 3 years |
Total |
Carrying amount |
| |
|
|
|
|
|
| Trade payables |
(438) |
- |
- |
(438) |
(438) |
Vinci Partners Investments Ltd.
Consolidated balance sheet
All amounts in thousands of reais
| Labor and social security obligations |
(52,689) |
(2,906) |
- |
(55,595) |
(55,595) |
| Lease liabilities |
(24,381) |
(39,382) |
(39,303) |
(103,066) |
(78,466) |
| Accounts payable |
(7,336) |
- |
- |
(7,336) |
(7,336) |
| Loans and financing |
(20,876) |
(104,761) |
(94,116) |
(219,753) |
(180,412) |
| Total |
(105,720) |
(147,049) |
(133,419) |
(386,188) |
(322,247) |
Contractual maturities of
financial liabilities
at December 31, 2022 |
Less than 1 year |
Between 1 and 3 years |
Over 3 years |
Total |
Carrying amount |
| |
|
|
|
|
|
| Trade payables |
(1,247) |
- |
- |
(1,247) |
(1,247) |
| Labor and social security obligations |
(87,732) |
(2,968) |
- |
(90,700) |
(90,700) |
| Lease liabilities |
(24,147) |
(45,878) |
(43,356) |
(113,381) |
(86,211) |
| Accounts payable |
(7,328) |
- |
- |
(7,328) |
(7,328) |
| Loans and financing |
(20,876) |
(104,761) |
(90,890) |
(216,527) |
(175,290) |
| Total |
(141,330) |
(153,607) |
(134,246) |
(429,183) |
(360,776) |
The Group monitors and evaluates the market risk
related to its financial investments portfolio periodically to assess its volatility, through changes that can significantly impact its
financial results. Considering a period of one day and the historical results over the past year, the following Value at Risk (VAR) parameters
were used:
| ● | 0.24% (or R$ 3.0 million) of the financial investment portfolio for a confidence interval of 95% on June
30, 2023 (0.18% or R$ 2.4 million on December 31, 2022). |
| ● | 0.41% (or R$ 5.2 million) of the financial investment portfolio for a confidence interval of 99% on June
30, 2023 (0.30% or R$ 3.95 million on December 31, 2022). |
Additionally, the Group evaluated the financial
investment portfolio on June 30, 2023 and December 31, 2022, through stress scenarios according to the main risk factors related to its
investments, as presented in the table below:
| |
|
|
Financial Impact (**) |
| Risk Factor |
Variation in |
Stress Scenario (*) |
06/30/2023 |
12/31/2022 |
| Current inflation |
Inflation index |
-100bps |
11.9 |
1.6 |
| Exchange traded real estate funds |
Share prices |
-10% |
(17.8) |
(17.9) |
| Brazilian stock prices |
Share prices |
-10% |
(7.0) |
(5.8) |
| Fixed-rate offshore rates |
US yield curve |
-100bps |
(2.1) |
(1.8) |
| Foreign exchange rate |
Foreign exchange rates |
10% (***) |
5.4 |
4.1 |
| Domestic base overnight rate |
Domestic base overnight rate |
-100bps |
(5.8) |
(6.9) |
(*) bps - basis point (1bps = 0,01%)
(**) In millions of Brazilian reais
(***) Brazilian reais devaluation against US Dollars
An equal change in the opposite direction of the stress scenario would
have affected the financial investment portfolio by a similar amount, on the basis that all other variables remain constant.
Vinci Partners Investments Ltd.
Consolidated balance sheet
All amounts in thousands of reais
This note provides information about the group's
financial instruments, including:
- an overview of all financial instruments held
by the Group
- specific information about each type of financial
instrument
- accounting policies
- information about determining the fair value
of the instruments, including judgements and estimation uncertainty involved.
The Group classifies its financial assets in the
following measurement categories:
| ● | those measured at fair value or through profit or loss, and |
| ● | those measured at amortized cost. |
The classification depends on the entity's business
model for managing the financial assets and the contractual terms of the cash flows.
For assets measured at fair value, gains and losses
will be recorded in profit or loss.
Recognition and derecognition
Regular way purchases and sales of financial assets
are recognized on trade date, being the date on which the group commits to purchase or sell the asset. Financial assets are derecognized
when the rights to receive cash flows from the financial assets have expired or have been transferred and the group has transferred substantially
all the risks and rewards of ownership.
Measurement
At initial recognition, the group measures a financial
asset at its fair value plus, in the case of a financial asset not at fair value through profit or loss (FVPL), transaction costs that
are directly attributable to the acquisition of the financial asset. Transaction costs of financial assets carried at FVPL are expensed
in profit or loss.
The Group holds the following financial instruments:
| Financial assets |
|
Section |
|
06/30/2023 |
|
12/31/2022 |
| |
|
|
|
|
|
|
| Accounts receivable |
|
(a) |
|
83,216 |
|
74,973 |
| Other financial assets at amortized cost |
|
(b) |
|
5,296 |
|
6,356 |
| Cash and cash equivalents |
|
(d) |
|
153,992 |
|
136,581 |
| Financial assets at fair value through profit or loss (FVPL) |
|
(c) |
|
1,189,235 |
|
1,249,749 |
| |
|
|
|
1,431,739 |
|
1,467,659 |
| |
|
|
|
|
|
|
| Financial liabilities |
|
|
|
|
|
|
| |
|
|
|
|
|
|
| Liabilities at amortized cost |
|
(e) |
|
63,369 |
|
99,275 |
| Lease liabilities |
|
(e) |
|
78,466 |
|
86,211 |
| Loans and financing |
|
(e) |
|
180,413 |
|
175,290 |
| |
|
|
|
322,248 |
|
360,776 |
The Group's exposure to risks associated with
the financial instruments is discussed in Note 4. The maximum exposure to credit risk at the end of the reporting period is the carrying
amount of each class of financial assets mentioned above.
Vinci Partners Investments Ltd.
Consolidated balance sheet
All amounts in thousands of reais
| Current assets |
|
|
06/30/2023 |
|
12/31/2022 |
| Accounts receivable from contracts with customers |
|
|
66,478 |
|
57,841 |
| Loss allowance |
|
|
(166) |
|
(166) |
| |
|
|
|
|
|
| Non-current assets |
|
|
|
|
|
| Accounts receivable from contracts with customers |
|
|
16,904 |
|
17,298 |
| |
|
|
83,216 |
|
74,973 |
Accounts receivables are recognized initially
at the amount of consideration that is unconditional and are not submitted to any financial components. They are subsequently measured
at amortized cost, less loss allowance.
Current accounts receivable are amounts due from
customers for services performed in the ordinary course of business. They are generally due for settlement within 30 days and are therefore
classified as current in its entirety. Due to the short-term nature of the current receivables, their carrying amount is considered to
be the same as their fair value.
Non-current accounts receivable are unrealized
performance fees that management, with accumulated experience, estimate that it is highly probable that a significant reversal will not
occur.
The Entity use a provision matrix to calculate
expected credit losses and the exposure to credit risk from receivables are reviewed on a regular basis. Accounts receivable allowance
for expected credit losses are presented in general and administrative expense.
The loss allowances for accounts receivable as
of June 30, 2023 and December 31, 2022 reconcile to the opening loss allowances as follows:
|
|
|
06/30/2023 |
|
12/31/2022 |
| Opening loss allowance on January 1 |
|
|
(166) |
|
(170) |
| Increase in accounts receivable allowance recognized in profit or loss |
|
|
- |
|
4 |
| Closing loss allowance on June 30 / December 31 |
|
|
(166) |
|
(166) |
Accounts receivables are written off when there
is no reasonable expectation of recovery. Indicators that there is no reasonable expectation of recovery include, among others, the failure
of a debtor to engage in a repayment plan with the group, and a failure to make contractual payments. The Entity has not written any amount
of accounts receivable during 2023 and 2022. Subsequent recoveries of amounts previously written off are credited against the same line
item.
| b) | Other financial assets at amortized cost |
Financial assets at amortized cost refer to the
following debt instruments:
Vinci Partners Investments Ltd.
Consolidated balance sheet
All amounts in thousands of reais
| Employees loans (Note 6 (i)) |
|
|
|
5,296 |
|
6,356 |
These amounts generally arise from transactions
outside the usual operating activities of the group. Interest may be charged at commercial rates and collateral is not normally obtained.
All the financial assets at amortized cost are
denominated in Brazilian currency units. As a result, there is no exposure to foreign currency risk. There is also no exposure to price
risk as the investments will be held to maturity.
See note 6 for more details.
| c) | Financial assets at fair value through profit or loss |
The group classifies the following financial assets
at fair value through profit or loss (FVPL):
Financial assets measured at FVPL include the following categories:
| |
06/30/2023 |
|
12/31/2022 |
| |
|
|
|
| Current assets |
1,182,812 |
|
1,243,764 |
| Mutual funds |
1,182,812 |
|
1,243,764 |
| |
|
|
|
| Non-current assets |
6,423 |
|
5,985 |
| Private markets funds |
6,423 |
|
5,985 |
The following tables demonstrate the funds invested included in each
category mentioned above.
| Mutual funds |
|
|
|
|
| |
|
06/30/2023 |
|
12/31/2022 |
| |
|
|
|
|
| Vinci Monalisa FIM Crédito Privado IE (2) |
|
1,111,273 |
|
1,057,547 |
| Vinci Multiestratégia FIM |
|
30,086 |
|
165,339 |
| Vinci International Master Portfolio SPC - Reflation SP |
|
11,957 |
|
12,824 |
| Vinci Asset Allocation FIC FI RF DI (1) |
|
5,321 |
|
- |
| Vinci Vida e Previdencia Equilibrio FIC FIM (1) |
|
6,713 |
|
- |
| Vinci Optimum FIC FIM CP (1) |
|
1,367 |
|
- |
| Vinci Reservas Técnicas FI RF DI |
|
2,072 |
|
- |
| FI Vinci Renda Fixa CP |
|
14,023 |
|
8,054 |
| |
|
1,182,812 |
|
1,243,764 |
| Private markets |
|
|
|
|
| |
|
06/30/2023 |
|
12/31/2022 |
| |
|
|
|
|
| Vinci Capital Partners III Feeder FIP Multiestratégia |
|
3,805 |
|
3,351 |
| Nordeste III FIP Multiestratégia |
|
2,618 |
|
2,634 |
| Total Private markets funds |
|
6,423 |
|
5,985 |
(1) These funds refer to the financial
products as part of the Company's retirement plans services. See Note 15 for further information.
(2) Vinci Monalisa FIM Crédito
Privado IE (“Vinci Monalisa”) is a mutual fund incorporated in Brazil and wholly owned by the Company. Vinci Monalisa’s
balances are the following:
Vinci Partners Investments Ltd.
Consolidated balance sheet
All amounts in thousands of reais
| |
|
06/30/2023 |
|
12/31/2022 |
| Net Asset Value |
|
1,111,273 |
|
1,057,547 |
| Real estate funds |
|
231,118 |
|
220,617 |
| Mutual funds |
|
795,664 |
|
743,479 |
| Private equity funds |
|
77,950 |
|
70,367 |
| Other assets/liabilities |
|
6,541 |
|
23,084 |
The Vinci Monalisa’s portfolio is comprised
of liquid and illiquid investee funds with different redemption criteria. Over 84% of its investments are liquid and may be redeemed and
16% are non-redeemable investments. The following tables demonstrate the funds invested by Vinci Monalisa:
Mutual funds
Vinci Monalisa holds investments in several mutual
funds to seek profitability through investments in various classes of financial assets such as fixed income assets, Brazilian government
bonds, public equities, derivatives financial instruments, investment funds and other short-term liquid securities. As of June 30, 2023,
and December 31, 2022, Vinci Monalisa holds R$ 795,664 and R$ 743,479 of investments in mutual funds, respectively, which are distributed
in the following classification:
| |
|
06/30/2023 |
|
12/31/2022 |
| Mutual Funds’ classification |
|
|
|
|
| Interest and foreign exchange (a) |
|
80.18% |
|
72.79% |
| Unrestricted investments (b) |
|
5.20% |
|
11.83% |
| Foreign investments (c) |
|
5.60% |
|
6.20% |
| Macro (d) |
|
3.10% |
|
3.16% |
| Specific strategy (e) |
|
5.92% |
|
6.02% |
| |
|
100.00% |
|
100.00% |
| (a) | Funds that seek long-term returns via investments in fixed-income assets, admitting strategies that imply interest risk, price index
risk and foreign currency risk. |
| (b) | Funds without commitment to concentration in any specific strategy. |
| (c) | Funds that invest in financial assets abroad in a portion greater than 40% of their net asset values. |
| (d) | Funds that operate in various asset classes (fixed income, variable income, foreign exchange, etc.), with investment strategies based
on medium and long-term macroeconomic scenarios. |
| (e) | Funds that adopt an investment strategy that involves specific
risks, such as commodities, futures of index, etc. |
| Real Estate funds |
|
|
|
|
|
|
| |
|
|
|
06/30/2023 |
|
12/31/2022 |
| |
|
|
|
|
|
|
| Vinci Credit Securities FII (i) |
|
|
|
72,718 |
|
75,720 |
| Vinci Imóveis Urbanos FII (ii) |
|
|
|
56,444 |
|
53,346 |
| Vinci Offices FII (iii) |
|
|
|
42,592 |
|
43,163 |
| Other real estate funds (iv) |
|
|
|
59,364 |
|
48,388 |
| |
|
|
|
231,118 |
|
220,617 |
(i) The fund invests in real
estate receivable certificates, bonds and other real estate assets;
(ii) The fund’s investment
strategy is to acquire properties in the retail, general markets, health and education sectors located in large urban centers that, in
the Manager's view, generate long-term value;
(iii) The fund invests in
controlling corporate buildings, mostly leased, which, in the Manager's view, generate value for the properties.
(iv) Comprised of funds that
allocate their capital in diversified portfolios of shares of real estate funds, real estate receivable certificates, bonds, securities
and other real estate assets.
| Private markets funds |
|
|
|
|
|
| |
|
|
06/30/2023 |
|
12/31/2022 |
| |
|
|
|
|
|
Vinci Partners Investments Ltd.
Consolidated balance sheet
All amounts in thousands of reais
| Vinci Impacto Ret IV FIP Multiestratégia |
|
|
3,580 |
|
2,925 |
| Vinci Infra Coinvestimento I FIP - Infraestrutura (i) |
|
|
10,187 |
|
10,924 |
| Vinci Infra Água e Saneamento Strategy FIP - Infraestrutura |
|
|
33,904 |
|
33,946 |
| Other funds |
|
|
30,279 |
|
22,572 |
| Total private markets funds |
|
|
77,950 |
|
70,367 |
(i) Fund focused on the acquisition of shares,
share bonuses subscriptions, debentures convertible or not into shares, or other securities issued by publicly-held, publicly-traded or
private corporations that develop new projects of infrastructure in the development sector and operations of electric power transmission
lines, participating in the decision-making process of the investee, with effective influence. As of June 30, 2023 and December 31, 2022,
the fund held investment in Água Vermelha Transmissora de Energia S.A.
During the period, the following gains/(losses) were recognized in
profit or loss:
| |
|
Six months ended June 30 |
|
Three months ended June 30 |
| |
|
2023 |
2022 |
|
2023 |
2022 |
| Fair value gains on investments at FVPL recognized in finance income |
|
64,723 |
34,521 |
|
64,834 |
13,982 |
| d) | Cash and cash equivalents |
| Current assets |
|
|
|
06/30/2023 |
|
12/31/2022 |
| Cash and bank deposits |
|
|
|
31,403 |
|
30,108 |
| Certificate of deposit (i) |
|
|
|
122,589 |
|
106,473 |
| |
|
|
|
153,992 |
|
136,581 |
For the purpose of presentation in the statement
of cash flows, cash and cash equivalents includes cash on hand, bank deposits held at financial institutions, other short-term, highly
liquid investments with original maturities of three months or less that are readily convertible to known amounts of cash and which are
subject to an insignificant risk of changes in value.
(i) Comprises certificates of deposits issued
by Banco Bradesco (credit rating AAA evaluated by Fitch Ratings) with an interest rate of 101% of CDI (interbank deposit rate). The certificates
are readily convertible to known amounts of cash and which are subject to an insignificant risk of changes in value.
| |
|
06/30/2023 |
|
12/31/2022 |
| |
|
|
|
|
| Current |
|
107,053 |
|
133,622 |
| Trade payables |
|
438 |
|
1,247 |
| Labor and social security obligations (Note 12) |
|
52,689 |
|
87,732 |
| Loans and obligations (Note 14) |
|
22,207 |
|
13,168 |
| Lease liabilities |
|
24,381 |
|
24,147 |
| Accounts payable (Note 11) |
|
7,338 |
|
7,328 |
| |
|
|
|
|
| Non-current |
|
215,197 |
|
227,154 |
| Lease liabilities |
|
54,085 |
|
62,064 |
| Labor and social security obligations (Note 12) |
|
2,906 |
|
2,968 |
| Loans and obligations (Note 14) |
|
158,206 |
|
162,122 |
| |
|
|
|
|
| |
|
322,250 |
|
360,776 |
(a)
Fair value hierarchy
Vinci Partners Investments Ltd.
Consolidated balance sheet
All amounts in thousands of reais
This section explains the judgments and estimates
made in determining the fair values of the financial instruments that are recognized and measured at fair value through profit or loss
in the financial statements. To provide an indication about the reliability of the inputs used in determining fair value, the group has
classified its financial instruments into the three levels prescribed under the accounting standards. An explanation of each level follows
underneath the table.
| |
|
On June 30, 2023 |
| Recurring fair value measurements |
|
Level 1 |
|
Level 2 |
|
Level 3 |
|
Total |
| Financial Assets |
|
|
|
|
|
|
|
|
| Certificate of deposits |
|
- |
|
122,589 |
|
- |
|
122,589 |
| Mutual funds |
|
- |
|
1,182,812 |
|
- |
|
1,182,812 |
| Private equity funds |
|
- |
|
- |
|
6,423 |
|
6,423 |
| Total Financial Assets |
|
- |
|
1,305,401 |
|
6,423 |
|
1,311,824 |
| |
|
On December 31, 2022 |
| Recurring fair value measurements |
|
Level 1 |
|
Level 2 |
|
Level 3 |
|
Total |
| Financial Assets |
|
|
|
|
|
|
|
|
| Certificate of deposits |
|
- |
|
106,473 |
|
- |
|
106,473 |
| Mutual funds |
|
- |
|
1,243,764 |
|
- |
|
1,243,764 |
| Private equity funds |
|
- |
|
- |
|
5,985 |
|
5,985 |
| Total Financial Assets |
|
- |
|
1,350,237 |
|
5,985 |
|
1,356,222 |
| |
|
|
|
|
|
|
|
|
Level 1: The fair value of financial instruments traded in active markets
(such as publicly traded real estate funds) is based on quoted market prices at the end of the reporting period. The quoted market price
used for financial assets held by the group is the current bid price. These instruments are included in level 1.
Level 2: The fair value of financial instruments that are not traded
in an active market is determined using valuation techniques which maximize the use of observable market data and rely as little as possible
on entity-specific estimates. If all significant inputs required to fair value an instrument are observable, the instrument is included
in level 2.
Vinci Monalisa is a financial instrument classified as level 2. Its
portfolio is comprised of items that could be classified as level 1, level 2 and level 3, in the amount of R$ 129,162, R$ 795,664 and
R$ 179,906, respectively (2022: R$ 172,228, R$ 743,479 and R$ 111,623, respectively).
Level 3: If one or more of the significant inputs is not based on observable
market data, the instrument is included in level 3. This is the case for unlisted equity securities.
(b)
Valuation techniques used to determine fair values
Specific valuation techniques used to value financial instruments include:
- the use of quoted market prices
- for level 3 financial instruments – discounted cash flow analysis.
All non-listed assets fair value estimates are included in level 2,
except for private equity funds, where the fair values have been determined based on fair value appraisals for fund's investments, performed
by the fund's management (Vinci Capital and Vinci Infra) or a third party hired by the Fund’s Administrator. The most part of the
level 3 financial
Vinci Partners Investments Ltd.
Consolidated balance sheet
All amounts in thousands of reais
instruments evaluation uses discount cash flows techniques to evaluate
the fair value of the Fund's investments. The appraisals performed by a third party are reviewed by Vinci or its subsidiaries (fund's
management).
(c) Fair value measurements using significant
unobservable inputs (level 3)
The following table presents the changes in level 3 items for the period/year
ended June 30, 2023 and December 31, 2022:
| |
|
Fair Value |
| Opening balance January 1, 2022 |
|
8,593 |
| Capital deployment |
|
1,229 |
| Sales and distributions (a) |
|
(4,008) |
| Gain recognized in finance income |
|
171 |
| Closing balance December 31, 2022 |
|
5,985 |
| Capital deployment |
|
442 |
| Sales and distributions |
|
(32) |
| Gain recognized in finance income |
|
28 |
| Closing balance June 30, 2023 |
|
6,423 |
(a) In 2022, Vinci Infra Transmissão FIP – Infraestrutura
was transferred to Vinci Monalisa.
Vinci Partners Investments Ltd.
Consolidated balance sheet
All amounts in thousands of reais
| |
|
|
06/30/2023 |
|
12/31/2022 |
| |
|
|
|
|
|
| Employees loans (i) |
|
|
5,296 |
|
6,356 |
| Sundry advances |
|
|
127 |
|
192 |
| Advances to projects in progress (ii) |
|
|
7,534 |
|
9,774 |
| Other prepayments |
|
|
1,515 |
|
155 |
| Related parties receivables (iii) |
|
|
160 |
|
253 |
| Guarantee deposits (iv) |
|
|
485 |
|
523 |
| Others |
|
|
316 |
|
293 |
| |
|
|
|
|
|
| |
|
|
15,433 |
|
17,546 |
| |
|
|
|
|
|
| Current |
|
|
14,505 |
|
16,481 |
| Non-current |
|
|
928 |
|
1,065 |
| |
|
|
|
|
|
| |
|
|
15,433 |
|
17,546 |
| (i) | Refers to amounts receivable from employees. |
| (ii) | Refers to costs incurred by projects related to funds administered by Vinci, that are initially paid by
the Group and subsequently reimbursed. |
| (iii) | Refers to an intercompany transaction. See Note 19 for more details. |
| (iv) | Refers to the security deposit of a lease. |
Vinci Partners Investments Ltd.
Consolidated balance sheet
All amounts in thousands of reais
| (i) | Summary of acquisition |
On 16 August 2022, Vinci Soluções
de Investimentos Ltda., a wholly owned subsidiary of Vinci, acquired 90% of the issued share capital of SPS Capital Gestão de Recursos
Ltda (“SPS”), a leading independent alternative asset manager focused on the Special Situations segment in Brazil. The total
purchase consideration was 184,432, including a contingent consideration (earn-out).
Contingent Consideration (Earn-out)
In the event that certain pre-determined fundraising and incremental
management fee is achieved for the years ended until December 31, 2026, an additional consideration in VINP’s Class A common shares
through an earnout structure will be paid in 2027, up to a maximum number of 1.7 million shares.
| (b) | Non-controlling interests (NCI) |
Set out below is summarized financial information for each subsidiary
that has non-controlling interests that are material to the group. The amounts disclosed for each subsidiary are before inter-company
eliminations.
| |
|
Vinci Asset Allocation |
|
Vinci Holding Securitária |
|
Total |
| |
|
06/30/2023 |
|
12/31/2022 |
|
06/30/2023 |
|
12/31/2022 |
|
06/30/2023 |
|
12/31/2022 |
| Summarized Balance Sheet |
|
|
|
|
|
|
|
|
|
|
|
|
| |
|
|
|
|
|
|
|
|
|
|
|
|
| Current assets |
|
108 |
|
- |
|
25,278 |
|
18,322 |
|
25,386 |
|
18,322 |
| Current liabilities |
|
(285) |
|
(1) |
|
(102) |
|
(601) |
|
(387) |
|
(602) |
| Current net assets |
|
(177) |
|
(1) |
|
25,176 |
|
17,721 |
|
24,999 |
|
17,720 |
| |
|
|
|
|
|
|
|
|
|
|
|
|
| Non-current assets |
|
601 |
|
601 |
|
9,149 |
|
3,345 |
|
9,750 |
|
3,946 |
| Non-current liabilities |
|
(1,200) |
|
(732) |
|
(14,409) |
|
(759) |
|
(15,609) |
|
(1,491) |
| Non-current net assets |
|
(599) |
|
(131) |
|
(5,260) |
|
2,586 |
|
(5,859) |
|
2,455 |
| |
|
|
|
|
|
|
|
|
|
|
|
|
| Net assets |
|
(776) |
|
(132) |
|
19,916 |
|
20,307 |
|
19,140 |
|
20,175 |
| |
|
|
|
|
|
|
|
|
|
|
|
|
| Accumulated NCI |
|
(194) |
|
(33) |
|
2,987 |
|
3,046 |
|
2,793 |
|
3,013 |
Vinci Partners Investments Ltd.
Consolidated balance sheet
All amounts in thousands of reais
| Summarized statement |
|
Vinci Asset Allocation |
|
Vinci Holding Securitária |
|
Vinci Int'l
Real Estate |
Total |
| of comprehensive income |
|
06/30/2023 |
|
06/30/2022 |
|
06/30/2023 |
|
06/30/2022 |
|
06/30/2023 |
|
06/30/2022 |
| |
|
|
|
|
|
|
|
|
|
|
|
|
| Revenue |
|
7 |
|
- |
|
1 |
|
90 |
|
8 |
|
90 |
| |
|
|
|
|
|
|
|
|
|
|
|
|
| Profit for the period |
|
(645) |
|
(20) |
|
(391) |
|
1 |
|
(1,036) |
|
(19) |
| |
|
|
|
|
|
|
|
|
|
|
|
|
| Other comprehensive income |
|
- |
|
- |
|
- |
|
- |
|
- |
|
- |
| |
|
|
|
|
|
|
|
|
|
|
|
|
| Total comprehensive income |
|
(645) |
|
(20) |
|
(391) |
|
1 |
|
(1,036) |
|
(19) |
| |
|
|
|
|
|
|
|
|
|
|
|
|
| Profit/(loss) allocated to NCI |
|
(161) |
|
(5) |
|
(59) |
|
- |
|
(220) |
|
(5) |
Vinci Partners Investments Ltd.
Consolidated balance sheet
All amounts in thousands of reais
| |
|
|
|
|
|
|
|
|
|
|
|
06/30/2023 |
|
| |
|
Furnitureand fittingsstuffs |
|
Improvements in propertiesof thirdparties |
|
Computersand peripherals -improvements |
|
Equipamentsand tools |
|
Work of arts and others |
|
Total |
|
| |
| |
| |
|
|
|
|
|
|
|
|
|
|
|
|
|
| Cost |
|
|
|
|
|
|
|
|
|
|
|
|
|
| At January 1, 2023 |
|
11,782 |
|
47,824 |
|
7,113 |
|
10,241 |
|
873 |
|
77,833 |
|
| Acquisitions |
|
539 |
|
483 |
|
245 |
|
269 |
|
1,392 |
|
2,928 |
|
| Foreign Exchange variations of property and equipment abroad |
|
- |
|
(1,519) |
|
- |
|
(436) |
|
- |
|
(1,955) |
|
| |
|
|
|
|
|
|
|
|
|
|
|
|
|
| At June 30, 2023 |
|
12,321 |
|
46,788 |
|
7,358 |
|
10,074 |
|
2,265 |
|
78,806 |
|
| |
|
|
|
|
|
|
|
|
|
|
|
|
|
| Accumulated depreciationAt January 1, 2023 |
|
(8,473) |
|
(42,188) |
|
(5,707) |
|
(9,514) |
|
- |
|
(65,882) |
|
| Depreciation |
|
(394) |
|
(1,151) |
|
(230) |
|
(105) |
|
- |
|
(1,880) |
|
| Foreign Exchange variations of property and equipment abroad |
|
- |
|
1,514 |
|
- |
|
422 |
|
- |
|
1,936 |
|
| |
|
|
|
|
|
|
|
|
|
|
|
|
|
| At June 30, 2023 |
|
(8,867) |
|
(41,825) |
|
(5,937) |
|
(9,197) |
|
- |
|
(65,826) |
|
| |
|
|
|
|
|
|
|
|
|
|
|
|
|
| Net book value |
|
|
|
|
|
|
|
|
|
|
|
|
|
| At January 1, 2023 |
|
3,309 |
|
5,636 |
|
1,406 |
|
727 |
|
873 |
|
11,951 |
|
| |
|
|
|
|
|
|
|
|
|
|
|
|
|
| At June 30, 2023 |
|
3,454 |
|
4,963 |
|
1,421 |
|
877 |
|
2,265 |
|
12,980 |
|
| |
|
|
|
|
|
|
|
|
|
|
|
|
|
| Annual depreciation rate - % |
|
10 |
|
From 10 to 20 |
|
20 |
|
10 |
|
|
|
|
|
Extension options in office leases have not been included in the lease
liability, because the Group could replace the assets without significant cost or business disruption.
Vinci Partners Investments Ltd.
Consolidated balance sheet
All amounts in thousands of reais
| |
|
|
|
|
|
|
|
|
|
|
|
06/30/2022 |
|
| |
|
Furniture and fittings stuffs |
|
Improvements in properties of
third parties |
|
Computers and peripherals
-improvements |
|
Equipaments and tools |
|
Work of arts and others |
|
Total |
|
| |
|
|
|
|
|
|
|
|
|
|
|
|
|
| Cost |
|
|
|
|
|
|
|
|
|
|
|
|
|
| At January 1, 2022 |
|
11,620 |
|
49,024 |
|
6,379 |
|
10,532 |
|
789 |
|
78,344 |
|
| Aquisitions |
|
98 |
|
135 |
|
298 |
|
51 |
|
- |
|
582 |
|
| Foreign Exchange variations of property and equipment abroad |
|
- |
|
(1,306) |
|
- |
|
(374) |
|
- |
|
(1,680) |
|
| |
|
|
|
|
|
|
|
|
|
|
|
|
|
| At June 30, 2022 |
|
11,718 |
|
47,853 |
|
6,677 |
|
10,209 |
|
789 |
|
77,246 |
|
| |
|
|
|
|
|
|
|
|
|
|
|
|
|
| Accumulated depreciation At January 1, 2022 |
|
(7,644) |
|
(41,389) |
|
(5,323) |
|
(9,694) |
|
- |
|
(64,050) |
|
| Depreciation |
|
(423) |
|
(1,079) |
|
(157) |
|
(98) |
|
- |
|
(1,757) |
|
| Foreign Exchange variations of property and equipment abroad |
|
- |
|
1,290 |
|
- |
|
358 |
|
- |
|
1,648 |
|
| |
|
|
|
|
|
|
|
|
|
|
|
|
|
| At June 30, 2022 |
|
(8,067) |
|
(41,178) |
|
(5,480) |
|
(9,434) |
|
- |
|
(64,159) |
|
| |
|
|
|
|
|
|
|
|
|
|
|
|
|
| Net book value |
|
|
|
|
|
|
|
|
|
|
|
|
|
| At January 1, 2022 |
|
3,976 |
|
7,635 |
|
1,056 |
|
838 |
|
789 |
|
14,294 |
|
| |
|
|
|
|
|
|
|
|
|
|
|
|
|
| At June 30, 2022 |
|
3,651 |
|
6,675 |
|
1,197 |
|
775 |
|
789 |
|
13,087 |
|
| |
|
|
|
|
|
|
|
|
|
|
|
|
|
| Annual depreciation rate - % |
|
10 |
|
From 10 to 20 |
|
20 |
|
10 |
|
|
|
|
|
Vinci Partners Investments Ltd.
Consolidated balance sheet
All amounts in thousands of reais
Intangible assets include expenditures with the
development of the software and the goodwill generated by the acquisition of SPS. The software development comprises mainly products for
Risk System and Portfolio Allocation, whose purpose is to evaluate the risk of the funds and to allocate the clients' portfolio and systems
and applications which are being developed to support retirement services applications.
The Entity assesses at each reporting date whether
there is an indication that an intangible asset may be impaired. If any indication exists, the Entity estimates the asset's recoverable
amount. There were no indications of impairment of intangible assets for the period ended June 30, 2023 and December 31, 2022.
| | |
| |
| |
| |
06/30/2023 |
| | |
Software development | |
Placement Agent (a) | |
Goodwill (b) | |
Management Contracts (c) | |
Total |
| | |
| |
| |
| |
| |
|
| Cost | |
| |
| |
| |
| |
|
| At January 1, 2023 | |
| 28,250 | | |
| 1,359 | | |
| 162,290 | | |
| 22,049 | | |
| 213,948 | |
| Purchases | |
| 6,822 | | |
| 65 | | |
| - | | |
| - | | |
| 6,887 | |
| Foreign exchange variation of intangible assets abroad | |
| (636 | ) | |
| (108 | ) | |
| - | | |
| - | | |
| (744 | ) |
| | |
| | | |
| | | |
| | | |
| | | |
| | |
| At June 30, 2023 | |
| 34,436 | | |
| 1,316 | | |
| 162,290 | | |
| 22,049 | | |
| 220,091 | |
| | |
| | | |
| | | |
| | | |
| | | |
| | |
| Accumulated amortization | |
| | | |
| | | |
| | | |
| | | |
| | |
| At January 1, 2023 | |
| (23,629 | ) | |
| (65 | ) | |
| - | | |
| (1,016 | ) | |
| (24,710 | ) |
| Amortization | |
| (447 | ) | |
| (76 | ) | |
| - | | |
| (1,524 | ) | |
| (2,047 | ) |
| Foreign exchange variation of intangible assets abroad | |
| 613 | | |
| 9 | | |
| - | | |
| - | | |
| 622 | |
| | |
| | | |
| | | |
| | | |
| | | |
| | |
| At June 30, 2023 | |
| (23,463 | ) | |
| (132 | ) | |
| - | | |
| (2,540 | ) | |
| (26,135 | ) |
| | |
| | | |
| | | |
| | | |
| | | |
| | |
| | |
| | | |
| | | |
| | | |
| | | |
| | |
| At January 1, 2023 | |
| 4,621 | | |
| 1,294 | | |
| 162,290 | | |
| 21,033 | | |
| 189,238 | |
| | |
| | | |
| | | |
| | | |
| | | |
| | |
| At June 30, 2023 | |
| 10,973 | | |
| 1,184 | | |
| 162,290 | | |
| 19,509 | | |
| 193,956 | |
| | |
| | | |
| | | |
| | | |
| | | |
| | |
| Amortization rate (per year) - % | |
| 20 | % | |
| (a) | | |
| (b) | | |
| (c) | | |
| | |
| | |
| | | |
| | | |
| | | |
| | | |
| | |
(a) Refers to amounts capitalized relating to
agreements with investments placement agents relating to funds raised from foreign investor in offshore funds. These amounts are amortized
based on the estimated duration of the related funds. In case of an early liquidation of the funds, the amortization period is adjusted,
or if there is an indication
Vinci Partners Investments Ltd.
Consolidated balance sheet
All amounts in thousands of reais
of impairment, an impairment evaluation is performed
and recognized, if necessary.
(b) Goodwill has an indefinite useful life and
are not subject to amortization. Goodwill is tested annually for impairment, or more frequently if events or changes in circumstances
indicate that they might be impaired. At December 31, 2022, goodwill was tested and any provision for impairment losses was identified
by Vinci.
(c) Refers to the purchase and price allocated
to Fund’s Management Contracts as a result of SPS acquisition. These amounts are amortized based on the duration of the related
funds.
Other assets than Goodwill are tested for impairment
whenever events or changes in circumstances indicate that the carrying amount may not be recoverable. An impairment loss is recognized
for the amount by which the asset’s carrying amount exceeds its recoverable amount. The recoverable amount is the higher of an asset’s
fair value less costs of disposal and value in use. For the purposes of assessing impairment, assets are grouped at the lowest levels
for which there are separately identifiable cash inflows which are largely independent of the cash inflows from other assets or groups
of assets (cash-generating units).
| | |
06/30/2022 |
| | |
Software development | |
Placement Agent (*) | |
Total |
| | |
| |
| |
|
| Cost | |
| |
| |
|
| At January 1, 2022 | |
| 24,790 | | |
| - | | |
| 24,790 | |
| Purchases | |
| 391 | | |
| 187 | | |
| 578 | |
| Foreign exchange variation of intangible assets abroad | |
| (357 | ) | |
| 9 | | |
| (348 | ) |
| | |
| | | |
| | | |
| | |
| At June 30, 2022 | |
| 24,824 | | |
| 196 | | |
| 25,020 | |
| | |
| | | |
| | | |
| | |
| Accumulated amortization | |
| | | |
| | | |
| | |
| At January 1, 2022 | |
| (23,633 | ) | |
| - | | |
| (23,633 | ) |
| Annual amortization | |
| (320 | ) | |
| - | | |
| (320 | ) |
| Foreign exchange variation of intangible assets abroad | |
| 533 | | |
| - | | |
| 533 | |
| | |
| | | |
| | | |
| | |
| At June 30, 2022 | |
| (23,420 | ) | |
| - | | |
| (23,420 | ) |
| | |
| | | |
| | | |
| | |
| | |
| | | |
| | | |
| | |
| At January 1, 2022 | |
| 1,157 | | |
| - | | |
| 1,157 | |
| | |
| | | |
| | | |
| | |
Vinci Partners Investments Ltd.
Consolidated balance sheet
All amounts in thousands of reais
| At June 30, 2022 | |
| 1,404 | | |
| 196 | | |
| 1,600 | |
| | |
| | | |
| | | |
| | |
| Amortization rate (per year) - % | |
| 20 | % | |
| (*) | | |
| | |
| | |
| | | |
| | | |
| | |
| | |
| | | |
| | | |
| | |
Vinci Partners Investments Ltd.
Consolidated balance sheet
All amounts in thousands of reais
This note provides information for leases where
the Group is a lessee. The notes also provide the information of subleases agreements where the Group is a lessor, once part of the assets
leased by the Group is subleased to third parties.
| (i) | Amount recognized in the balance sheet |
The balance sheet shows the following amounts relating to leases:
| |
|
06/30/2023 |
|
12/31/2022 |
| Sub-lease receivable |
|
|
|
|
| Rio de Janeiro Office - BM 336 |
|
7,058 |
|
2,843 |
| Total |
|
7,058 |
|
2,843 |
| |
|
|
|
|
| Current |
|
3,909 |
|
1,500 |
| Non-current |
|
3,149 |
|
1,343 |
| Total |
|
7,058 |
|
2,843 |
| |
|
|
|
|
| Right of use assets |
|
|
|
|
| Rio de Janeiro Office - BM 336 |
|
48,147 |
|
55,758 |
| São Paulo Office – JRA |
|
10,731 |
|
12,682 |
| NY Office - third Avenue |
|
1,176 |
|
1,696 |
| Total |
|
60,054 |
|
70,136 |
| |
|
|
|
|
| Lease liabilities |
|
|
|
|
| Rio de Janeiro Office - BM 336 |
|
(64,650) |
|
(70,538) |
| São Paulo Office – JRA |
|
(12,431) |
|
(13,701) |
| NY Office - third Avenue |
|
(1,385) |
|
(1,972) |
| Total |
|
(78,466) |
|
(86,211) |
| |
|
|
|
|
| Current |
|
(24,381) |
|
(24,147) |
| Non-current |
|
(54,085) |
|
(62,064) |
| Total |
|
(78,466) |
|
(86,211) |
Reductions to the right-of-use assets until June 30, 2023 were R$ 4,782
(additions of R$ 15,838 during 2022 financial year).
Vinci Partners Investments Ltd.
Consolidated balance sheet
All amounts in thousands of reais
| (ii) | Amount recorded in the statement of profit or loss |
The statement of profit or loss shows the following amounts relating
to leases:
| |
|
Six months ended June 30 |
|
Three months ended June 30 |
| |
|
2023 |
2022 |
|
2023 |
2022 |
| |
|
|
|
|
|
|
| Right of use assets depreciation |
|
(5,191) |
(5,298) |
|
(2,414) |
(2,738) |
| Financial expense |
|
(5,148) |
(4,872) |
|
(2,517) |
(2,400) |
| |
|
(10,339) |
(10,170) |
|
(4,931) |
(5,138) |
The total cash outflow for leases until June 30,
2023 was R$ 12,765 (R$ 12,154 until June 30, 2022).
The Group’s leasing activities and how these
are accounted for are disclosed in the Group’s annual consolidated financial statements as of December 31, 2022.
|
06/30/2023 |
|
12/31/2022 |
| |
|
|
|
| Dividends payable (i) |
3,791 |
|
4,363 |
| Treasury shares acquisition (ii) |
2,083 |
|
839 |
| Rent payable – prior month expense |
1,394 |
|
2,056 |
| Other payables |
70 |
|
70 |
| |
|
|
|
| |
7,338 |
|
7,328 |
| |
|
|
|
| Current |
7,338 |
|
7,328 |
| Non-current |
- |
|
- |
| (i) | On December 31, 2020, the partners approved a distribution of dividends for the results of the current
month. On January 25, 2023, the amount of R$ 572 was paid, remaining outstanding the amount of R$ 3,791. |
| (ii) | As informed in Note 14(f), on May 6, 2021, Vinci started its share repurchase program. The shares repurchased
were totally settled up to the second working day after the acquisition. |
Vinci Partners Investments Ltd.
Consolidated balance sheet
All amounts in thousands of reais
| 12 | Labor and social security obligations |
| |
|
|
|
|
| |
|
06/30/2023 |
|
12/31/2022 |
| |
|
|
|
|
| Profit sharing |
|
44,233 |
|
80,840 |
| Labor provisions |
|
11,362 |
|
9,860 |
| |
|
|
|
|
| |
|
55,595 |
|
90,700 |
| |
|
|
|
|
| Current |
|
52,689 |
|
87,732 |
| Non-current |
|
2,906 |
|
2,968 |
Except for the profit sharing related to the unrealized
performance fees, the accrual for profits sharing payable on December 31, 2022 was paid in January 2023. Profit sharing is calculated
based on the performance review of each employee plus the area performance, in accordance with an Entity policy. Vinci Management estimated
the profit sharing as of June 30, 2022 based on the management and advisory net revenue recognized and the realized performance fee up
to June 30, 2023.
Since the second quarter of 2022 labor provisions
are being impacted by provisions and social charges related to Restricted Share Units Plan (RSUs). The non-current amount comprises the
provisions and social charges for the RSUs which the vesting dates are over than 1 year. Please see note 23 for more detail.
| 13 | Taxes and contributions payable |
| |
|
06/30/2023 |
|
12/31/2022 |
| |
|
|
|
|
| Income tax |
|
10,919 |
|
13,746 |
| Social contribution |
|
3,753 |
|
4,847 |
Social Contribution on
revenues (COFINS) |
|
2,510 |
|
2,128 |
| Social Integration Program (PIS) |
|
542 |
|
460 |
| Service tax (ISS) on billing |
|
1,439 |
|
856 |
Withholding Income Tax (IRRF)
deducted from third parties |
|
83 |
|
143 |
| Others |
|
46 |
|
111 |
| |
|
|
|
|
| |
|
19,292 |
|
22,291 |
Vinci Partners Investments Ltd.
Consolidated balance sheet
All amounts in thousands of reais
|
|
06/30/2023 |
|
12/31/2022 |
| |
|
|
|
|
| Commercial Notes (i) |
|
82,876 |
|
83,212 |
| Consideration payable (ii) |
|
45,812 |
|
43,579 |
| Contingent consideration (iii) |
|
51,725 |
|
48,499 |
| |
|
|
|
|
| |
|
180,413 |
|
175,290 |
| |
|
|
|
|
| Current |
|
22,207 |
|
13,168 |
| Non-current |
|
158,206 |
|
162,122 |
On August 15, 2022, Vinci Soluções
de Investimentos Ltda,. a subsidiary of Vinci, issued 80,000 commercial notes in the total amount of R$ 80,000 (R$ 1,000.00 reais for
each commercial note). The commercial notes will be subject to public distribution 90 days after the issuing date. The main characteristics
of the financial instrument are indicated below:
Term and expiration date: 5 (five) years, ending
on August 15, 2027.
Interest rate: 100% of the daily rates of interbank
deposits (“DI”) plus a spread of 2.15% on annually basis.
Amortization: On semi-annually basis, beginning
on February 15, 2023.
Commercial Notes comprises a financial liability
evaluated at amortized cost. Interest expense is calculated using the effective interest method and is recognized in profit or loss as
part of financial expense.
Accordingly, to the terms of the agreement, the
Group is committed to be compliant with financial covenants, on an annual basis and beginning on December 31, 2022. The entity was in
compliance with the covenants as of December 31, 2022.
The following table presents the changes in the
Commercial Notes up the period ended June 30, 2023 and December 31, 2022:
| Face value of the notes issued |
80,000 |
| (-) Transaction costs |
(974) |
| Interest expense |
4,186 |
| Closing balance December 31, 2022 |
83,212 |
| Interest expense |
5,606 |
| Interest paid |
(5,942) |
| Closing balance June 30, 2023 |
82,876 |
| |
|
| Current |
22,207 |
| Non-current |
60,669 |
Vinci Partners Investments Ltd.
Consolidated balance sheet
All amounts in thousands of reais
| (ii) | Consideration payable |
Accordingly, to Note 7(a), Vinci acquired SPS Capital Gestão
de Recursos Ltda on August 16, 2022. As part of the deal, Vinci assumed a financial obligation to be paid in the second anniversary of
the closing date. The amount as of June 30, 2023 and December 31, 2022 is R$ 45,812 and R$ 43,579, respectively.
Consideration payable is financial liability evaluated
at amortized cost. Interest expense is calculated using the effective interest method and is recognized in profit or loss as part of financial
expense.
| (iii) | Contingent consideration |
Vinci shall pay an additional consideration in VINP’s Class A
shares through an earnout structure to be paid in 2027, up to a maximum number of 1.7 million shares, subject to the achievement of certain
fundraising and incremental management fee revenue targets. The amount reflects the fair value of the obligation, based on the terms of
the purchase agreement and how the current economic environment is likely to impact it, accordingly to Vinci’s best estimative.
Changes in fair value of the contingent consideration that qualify as measurement period adjustments are adjusted retrospectively, with
corresponding adjustments against goodwill.
On June 30, 2023, Vinci revaluated the fair value of the obligation
based on the economic conditions at the date, resulting in an increase of the contingent consideration fair value. The variation was recognized
as an expense in the financial result in the amount of R$ 3,227 for the six-month period ended June 30, 2023.
| 15 | Retirement plans liabilities |
During the second quarter of 2023 Vinci starts its retirement services
operations. As of June 30, 2023, active plans are principally accumulation of financial resources through products PGBL (Free Benefit
Generator Plan) and VGBL (Free Benefit Generator Life) structured in the form of variable contribution, for the purpose of granting participants
with returns based on the accumulated capital in the form of monthly withdraws for a certain term or temporary monthly withdraws.
In this respect, such financial products represent investment contracts
that have the legal form of retirement plans, but which do not transfer insurance risk to the Group. Therefore, contributions received
from participants are accounted for as liabilities and balance consists of the balance of the participant in the linked Specially Constituted
Investment Fund (“FIE”) at the reporting date (Note 5). On June 30, 2023 the Retirement plan liabilities are 13,401.
Vinci Partners Investments Ltd.
Consolidated balance sheet
All amounts in thousands of reais
The capital comprises 42,447,349 Class A shares
and 14,466,239 Class B shares with a par value of US$ 0.00005 each.
The Class A common shares have been approved for
listing on the Nasdaq Global Select Market, or Nasdaq, under the symbol "VINP." Vinci has two classes of common shares: Class
A common shares and our Class B common shares.
Class B common shares carry rights that are identical
to the Class A common shares, except that (1) holders of Class B common shares are entitled to 10 votes per share, whereas holders of
our Class A common shares are entitled to one vote per share; (2) holders of Class B common shares have certain conversion rights; (3)
holders of Class B common shares are entitled to preemptive rights in the event that additional Class A common shares are issued in order
to maintain their proportional ownership interest; and (4) Class B common shares shall not be listed on any stock exchange and will not
be publicly traded.
Transactions costs comprises the expenses incurred
by the Entity in connection with the IPO.
Retained earnings comprises the net profit generated
by the Entity which were not distributed to their shareholders or approved to be distributed by the Entity management.
Comprises the exchange variation in investments
made on investees which have a functional currency other than Brazilian Reais, the Entity functional currency. When a foreign operation
is sold, the associated exchange differences are reclassified to profit or loss, as part of the gain or loss on sale.
On February 10, 2023, Vinci declared a quarterly
dividend distribution of US$ 0.17 per common share to shareholders as of February 28, 2023, totalizing US$ 9,328 (R$ 49,015), paid on
March 9, 2023.
On May 11, 2023, Vinci declared a quarterly dividend
distribution of US$ 0.16 per common share to shareholders as of May 25, 2023, totalizing US$ 8,729 (R$ 43,651), paid on June 9, 2023.
Once dividends are declared and approved by the
board of directors, they will be paid on proportional basis to the owners of the common shares.
When shares recognized as equity are repurchased,
the amount of the consideration paid, which includes directly attributable costs, is recognized as a deduction from equity. Repurchased
shares are classified as treasury shares and are presented in the treasury share reserve. When treasury shares are sold or reissued subsequently,
the amount received is recognized as an increase in equity and the resulting surplus or deficit on the transaction is presented within
the additional paid-in capital.
Vinci Partners Investments Ltd.
Consolidated balance sheet
All amounts in thousands of reais
On May 6, 2021, the Company announced the adoption
of its share repurchase program in an aggregate amount of up to R$ 85 million (the “Repurchase Program”). The Repurchase Program
may be executed in compliance with Rule 10b-18 under the Exchange Act. The program shall be permitted to commence after the date it is
publicly disclosed and does not have a specified expiration date. Buybacks shall be made from time-to-time in the open market and negotiated
purchases. The specific prices, numbers of shares and timing of purchase transactions shall be determined by the Company from time to
time in its sole discretion.
On September 14, 2021, the Company intended to
benefit from the affirmative defense provided by Rule 10b5-1 promulgated by the Securities and Exchange Commission under the Securities
Exchange Act of 1934. The Repurchase Program previously approved comply with the requirements of Rule 10b5-1 and will be carried out exclusively
by J.P. Morgan Securities LLC (“JPMS”). JPMS acts as agent on behalf of Vinci and in accordance with the following terms:
| ● | The program is permitted to commence on October 1, 2021
and does not have a specified expiration date. |
| ● | Buybacks shall be made in compliance with Rule 10b5-1(c)(1)
under the Exchange Act; |
| ● | The Repurchase Program respects the total amount of up
to R$85 million, as previously approved. |
On June 16, 2022, the Company announced a share
buyback plan and a share repurchase plan to buy back up to R$60.0 million of the Company's outstanding Class A common shares across both
plans. These plans are approved to replace the share repurchase plans approved by our board of directors on May 6, 2021 and September
15, 2021, which expired on May 31st, 2022. The plans commenced immediately and will not have specified expiration date (other than when
the R$60.0 million buyback limit is reached).
Under the share buyback plan, buybacks may be
made from time-to-time in open market and negotiated purchases, effective immediately, in compliance with SEC Rule 10b-18. The specific
prices, numbers of shares and timing of purchase transactions will be determined by the Company from time to time in its sole discretion.
Additionally, repurchases will be carried out by the agent of the Company from time-to-time in open market and negotiated purchases, in
compliance with SEC Rule 10b5-1.
On February 14, 2023, the Company announced a
new share buyback plan and a share repurchase plan to buy back up to R$60.0 million of the Company's outstanding Class A common shares
across both plans. The new buyback and repurchase plans will commence on the expiration date of the legacy plans and will not have specified
expiration dates (other than when the R$60.0 million buyback limit is reached).
During the first semester of 2023, 925,385 Class
A common shares were repurchased, in the amount of R$ 42,052. As detailed in Note 24, 57,413 shares were vested as part of the Restricted
Shares Unit Plan. In June 2023 the Company holds 2,716,629 Class A common shares in treasury.
Vinci Partners Investments Ltd.
Consolidated balance sheet
All amounts in thousands of reais
(g) Basic and diluted earnings
per share
| |
|
Six months ended June 30 |
|
Three months ended June 30 |
| a) Basic earning per share |
|
2023 |
|
2022 |
|
2023 |
|
2022 |
| From continuing operations attributable to the ordinary equity holders of the Entity |
|
2.20 |
|
1.62 |
|
1.62 |
|
0.82 |
| Total basic earning per share attributable to the ordinary equity holders of the Entity |
|
2.20 |
|
1.62 |
|
1.62 |
|
0.82 |
| |
|
Six months ended June 30 |
|
Three months ended June 30 |
| b) Diluted earning per share |
|
2023 |
|
2022 |
|
2023 |
|
2022 |
| From continuing operations attributable to the ordinary equity holders of the Entity |
|
2.17 |
|
1.61 |
|
1.60 |
|
0.81 |
| Total basic earning per share attributable to the ordinary equity holders of the Entity |
|
2.17 |
|
1.61 |
|
1.60 |
|
0.81 |
| c) Reconciliations of earnings used in calculating earnings per share/quota |
|
|
|
|
| |
|
Six months ended June 30 |
|
Three months ended June 30 |
| Basic earnings per share: |
|
2023 |
|
2022 |
|
2023 |
|
2022 |
| Profit attributable to the ordinary equity holders of the Entity used in calculating basic earnings per share: |
|
|
|
|
|
|
|
|
| From continuing operations |
|
124,478 |
|
91,709 |
|
91,741 |
|
46,400 |
| |
|
124,478 |
|
91,709 |
|
91,741 |
|
46,400 |
| |
|
|
|
|
|
|
|
|
| |
|
Six months ended June 30 |
|
Three months ended June 30 |
| Diluted earnings per share: |
|
2023 |
|
2022 |
|
2023 |
|
2022 |
| Profit from continuing operations attributable to the ordinary equity holders of the Entity |
|
|
|
|
|
|
|
|
| Used in calculating basic earnings per share |
|
124,478 |
|
91,709 |
|
91,741 |
|
46,400 |
| Used in calculating diluted earnings per share |
|
124,478 |
|
91,709 |
|
91,741 |
|
46,400 |
| d) Weighted average number of shares used as the denominator |
|
| |
|
Six months ended June 30 |
Three months ended June 30 |
| |
|
Number 06/30/2023 |
|
Number 06/30/2022 |
|
Number 06/30/2023 |
|
Number 06/30/2022 |
|
| Weighted average number of ordinary shares used as the denominator in calculating basic earnings per share: |
|
56,547,310 |
|
56,605,337 |
|
56,720,981 |
|
56,798,319 |
|
| Adjustments for calculation of diluted earnings per share: |
|
683,476 |
|
- |
|
683,476 |
|
- |
|
| Weighted average number of ordinary shares and potential ordinary shares used as the denominator in calculating diluted earnings per share |
|
57,230,786 |
|
56,605,337 |
|
57,404,407 |
|
56,798,319 |
|
Vinci Partners Investments Ltd.
Consolidated balance sheet
All amounts in thousands of reais
| 17 | Revenue from services rendered |
| |
|
Six months ended June 30 |
|
Three months ended June 30 |
| |
|
2023 |
|
2022 |
|
2023 |
|
2022 |
| |
|
|
|
|
|
|
|
|
| Gross revenue from fund management |
|
201,509 |
|
188,348 |
|
99,018 |
|
95,353 |
| Gross revenue from performance fees |
|
13,529 |
|
7,411 |
|
11,454 |
|
4,080 |
| Gross revenue from advisory |
|
20,187 |
|
11,311 |
|
15,296 |
|
7,289 |
| |
|
|
|
|
|
|
|
|
| Gross revenue from services rendered |
|
235,225 |
|
207,070 |
|
125,768 |
|
106,722 |
| |
|
|
|
|
|
|
|
|
| In Brazil |
|
188,312 |
|
159,733 |
|
101,278 |
|
83,109 |
| Abroad |
|
46,913 |
|
47,337 |
|
24,490 |
|
23,613 |
| |
|
|
|
|
|
|
|
|
| Taxes and contributions |
|
|
|
|
|
|
|
|
| COFINS |
|
(8,404) |
|
(7,175) |
|
(4,360) |
|
(3,773) |
| PIS |
|
(1,823) |
|
(1,557) |
|
(946) |
|
(819) |
| ISS |
|
(5,106) |
|
(4,494) |
|
(2,878) |
|
(2,361) |
| |
|
|
|
|
|
|
|
|
| Net revenue from services rendered |
|
219,892 |
|
193,844 |
|
117,584 |
|
99,769 |
| |
|
|
|
|
|
|
|
|
| Net revenue from fund management |
|
188,646 |
|
176,500 |
|
92,769 |
|
89,271 |
| Net revenue from performance fees |
|
12,728 |
|
7.011 |
|
10,765 |
|
3,839 |
| Net revenue from advisory |
|
18,518 |
|
10,333 |
|
14,050 |
|
6,659 |
Vinci Partners Investments Ltd.
Consolidated balance sheet
All amounts in thousands of reais
| 18 | General and administrative expenses |
| |
|
Six months ended June 30 |
|
Three months ended June 30 |
| |
|
2023 |
|
2022 |
|
2023 |
|
2022 |
| |
|
|
|
|
|
|
|
|
| Personnel (a) |
|
(35,526) |
|
(31,213) |
|
(17,849) |
|
(16,031) |
| Share-based payments (b) |
|
(5,600) |
|
(3,204) |
|
(3,493) |
|
(2,468) |
| Profit-sharing (a) |
|
(45,212) |
|
(36,998) |
|
(26,417) |
|
(18,695) |
| |
|
(86,338) |
|
(71,415) |
|
(47,759) |
|
(37,194) |
| Third party expenses (c) |
|
(15,303) |
|
(22,435) |
|
(8,719) |
|
(8,907) |
| Right of use depreciation (d) |
|
(5,191) |
|
(5,298) |
|
(2,414) |
|
(2,738) |
| Depreciation and amortization (e) |
|
(3,806) |
|
(1,960) |
|
(2,028) |
|
(976) |
| Travel and representations |
|
(1,784) |
|
(1,812) |
|
(919) |
|
(1,295) |
| Condominium expenses |
|
(1,770) |
|
(1,248) |
|
(785) |
|
(838) |
| Other operating expenses (f) |
|
(4,870) |
|
(3,679) |
|
(2,308) |
|
(1,938) |
| |
|
|
|
|
|
|
|
|
| |
|
(119,062) |
|
(107,847) |
|
(64,932) |
|
(53,886) |
| (a) | Personnel and profit-sharing |
According to the profit-sharing program and based
on Law 10,101 of December 19, 2000 and on objectives established at the beginning of each year, management estimated the payment of profit
sharing in the amount of R$ 45,212 (R$ 36,998 on June 30, 2022) for the period ended June 30, 2023.
See Note 22 for more details.
Third party expenses are composed for accounting,
advisory, information technology, marketing, and other contracted services.
| (d) | Right of use depreciation |
See Note 10 for more details.
| (e) | Depreciation and amortization |
The amount is mainly comprised by property and equipment depreciation
and intangible amortization.
| (f) | Other operating expenses |
The amount is mainly comprised by office expenses,
including energy, cleaning, maintenance and conservation, among others several expenses.
Vinci Partners Investments Ltd.
Consolidated balance sheet
All amounts in thousands of reais
| |
Six months ended June 30 |
|
Three months ended June 30 |
| |
2023 |
|
2022 |
|
2023 |
|
2022 |
| |
|
|
|
|
|
|
|
| Investment income (i) |
64,834 |
|
35,075 |
|
64,834 |
|
13,982 |
| Foreign currency variation income |
- |
|
2,086 |
|
- |
|
444 |
| Financial revenue on sublease agreements |
260 |
|
211 |
|
184 |
|
101 |
| Contingent consideration variation |
4,051 |
|
- |
|
- |
|
- |
| Other finance income |
209 |
|
307 |
|
83 |
|
160 |
| |
|
|
|
|
|
|
|
| Finance income |
69,354 |
|
37,679 |
|
65,101 |
|
14,687 |
| |
|
|
|
|
|
|
|
| Financial expense on lease agreements |
(5,148) |
|
(4,872) |
|
(2,517) |
|
(2,400) |
| Interest expense on loans and financing |
(7,838) |
|
- |
|
(3,904) |
|
- |
| Bank fees |
(51) |
|
(102) |
|
(38) |
|
(56) |
| Investment losses (i) |
(111) |
|
(554) |
|
- |
|
- |
| Fines on taxes |
- |
|
(4) |
|
- |
|
(1) |
| Foreign currency variation expense |
(775) |
|
(2,986) |
|
(620) |
|
- |
| Contingent consideration variation |
(7,278) |
|
- |
|
(7,278) |
|
- |
| Finance costs |
(21,201) |
|
(8,522) |
|
(14,357) |
|
(2,461) |
| |
|
|
|
|
|
|
|
| Finance profit/(loss), net |
48,153 |
|
29,157 |
|
50,744 |
|
12,226 |
| |
|
|
|
|
|
|
|
| (i) | Investment income and losses comprises the fair value changes on the financial instruments at fair value through profit or loss. Segregated
investment income result is demonstrated below. |
| |
|
Six months ended June 30 |
|
Three months ended June 30 |
| |
|
2023 |
|
2022 |
|
2023 |
|
2022 |
| Mutual funds and fixed income investments (a) |
|
64,803 |
|
35,232 |
|
64,803 |
|
14,334 |
| Private equity funds |
|
31 |
|
(157) |
|
31 |
|
(352) |
| |
|
64,834 |
|
35,075 |
|
64,834 |
|
13,982 |
| |
|
|
|
|
|
|
|
|
| Mutual funds |
|
(108) |
|
(550) |
|
- |
|
- |
| Private equity funds |
|
(3) |
|
(4) |
|
- |
|
- |
| |
|
(111) |
|
(554) |
|
- |
|
- |
| (a) | Vinci Monalisa corresponds to most part of the Group’s investment income. |
| (ii) | Interest expense on loans and financing comprises the financial result on the Commercial notes and contingent consideration related
to SPS acquisition. Please see note 14 for more detail. |
Vinci Partners Investments Ltd.
Consolidated balance sheet
All amounts in thousands of reais
| 20 | Income tax and social contribution |
As an exempted company incorporated in the Cayman
Islands, Vinci Partners Ltd is subject to Cayman Islands laws, which currently levy no taxes on individuals or corporations based upon
profits, income, gains or appreciation and there is no taxation in the nature of inheritance tax or estate duty or withholding tax applicable
to us.
Vinci Partners Ltd subsidiaries, except for Vinci
Partners Ltda, Vinci Capital Gestora Ltda, Vinci Soluções de Investimentos Ltda and Vinci Vida e Previdência S.A.,
are taxed based on the deemed profit.
Vinci has tax losses and negative basis resulting
from previous years and deferred income tax and social contribution credits are recognized since there is expectation of future tax results
for these companies. The tax credit arising from the tax loss and negative basis under the taxable profit regime on June 30, 2023 is R$
5,411 (R$ 4,912 on December 31, 2022).
No foreign subsidiaries presented net income for
taxation of income and social contribution taxes until June 30, 2023 and 2022.
The income tax and social contribution charge
on the results for the year can be summarized as follows:
| |
|
Six months ended June 30 |
|
Three months ended June 30 |
| |
|
2023 |
|
2022 |
|
2023 |
|
2022 |
| |
|
|
|
|
|
|
|
|
| Current income tax |
|
(19,926) |
|
(18,810) |
|
(10,716) |
|
(9,516) |
| Current social contribution |
|
(7,196) |
|
(6,747) |
|
(3,889) |
|
(3,370) |
| |
|
|
|
|
|
|
|
|
| |
|
(27,122) |
|
(25,557) |
|
(14,605) |
|
(12,886) |
| |
|
|
|
|
|
|
|
|
| Deferred income tax |
|
1,902 |
|
1,611 |
|
2,129 |
|
926 |
| Deferred social contribution |
|
495 |
|
496 |
|
632 |
|
249 |
| |
|
|
|
|
|
|
|
|
| |
|
2,397 |
|
2,107 |
|
2,761 |
|
1,175 |
| |
|
|
|
|
|
|
|
|
| |
|
(24,725) |
|
(23,450) |
|
(11,844) |
|
(11,711) |
Vinci Partners Investments Ltd.
Consolidated balance sheet
All amounts in thousands of reais
Deferred tax balances
| |
|
06/30/2023 |
|
12/31/2022 |
| Deferred tax assets |
|
|
|
|
| Tax losses |
|
5,606 |
|
4,912 |
| Leases |
|
1,521 |
|
1,805 |
| RSU |
|
1,421 |
|
1,628 |
| Interest expense on obligation for acquisition |
|
1,309 |
|
550 |
| Amortization on management Contracts |
|
864 |
|
346 |
| Total |
|
10,721 |
|
9,241 |
| Deferred tax liabilities |
|
|
|
|
| Financial revenue |
|
(982) |
|
(973) |
| Estimated revenue |
|
(1,690) |
|
(1,690) |
| Leases |
|
(220) |
|
(49) |
| Contingent consideration |
|
(3,653) |
|
(4,750) |
| Total Income Tax |
|
(6,545) |
|
(7,462) |
| |
|
|
|
|
| Estimated revenue |
|
(878) |
|
(878) |
| Total (Taxes and contribution) |
|
(878) |
|
(878) |
| |
|
|
|
|
| Total deferred tax liabilities |
|
(7,423) |
|
(8,340) |
Vinci Partners Investments Ltd.
Consolidated balance sheet
All amounts in thousands of reais
| Movements |
|
Tax losses |
|
Leases |
|
RSU |
|
Other (*) |
|
Total |
| Deferred tax assets |
|
|
|
|
|
|
|
|
|
|
| As at December 31, 2021 |
|
2,494 |
|
2,476 |
|
- |
|
- |
|
4,970 |
| to profit and loss |
|
2,418 |
|
(671) |
|
1,628 |
|
896 |
|
4,271 |
| As at December 31, 2022 |
|
4,912 |
|
1,805 |
|
1,628 |
|
896 |
|
9,241 |
| to profit and loss |
|
694 |
|
(284) |
|
(207) |
|
1,277 |
|
1,480 |
| As at June 30, 2023 |
|
5,606 |
|
1,521 |
|
1,421 |
|
2,173 |
|
10,721 |
(*) Comprises deferred taxes related to interest
expense on obligation for ownership acquisition and amortization on management Contracts
| Movements |
|
Financial Revenue |
|
Estimated Revenue |
|
Leases |
|
Contingent consideration |
|
Total |
| Deferred tax liabilities |
|
|
|
|
|
|
|
|
|
|
| As at December 31, 2021 |
|
(1,815) |
|
(3,201) |
|
- |
|
- |
|
(5,016) |
| to profit and loss |
|
842 |
|
633 |
|
(49) |
|
(4,750) |
|
(3,324) |
| As at December 31, 2022 |
|
(973) |
|
(2,568) |
|
(49) |
|
(4,750) |
|
(8,340) |
| to profit and loss |
|
(9) |
|
- |
|
(171) |
|
1,097 |
|
917 |
| As at June 30, 2023 |
|
(982) |
|
(2,568) |
|
(220) |
|
(3,653) |
|
(7,423) |
Vinci Partners Investments Ltd.
Consolidated balance sheet
All amounts in thousands of reais
| |
Six months ended June 30 |
Three months ended June 30 |
| |
2023 |
2022 |
2023 |
2022 |
| |
|
|
|
|
| Profit (loss) before income taxes |
| 148,983 | |
| 115,154 | |
| 103,396 | |
| 58,109 | |
| Combined statutory income taxes rate - % |
| 34% | |
| 34% | |
| 34% | |
| 34% | |
| Income tax benefit (expense) at statutory rates |
| (50,654 | ) |
| (39,152 | ) |
| (35,154 | ) |
| (19,757 | ) |
| Reconciliation adjustments: |
| | |
| | |
| | |
| | |
| Expenses not deductible |
| (64 | ) |
| (27 | ) |
| (2 | ) |
| (9 | ) |
| Tax benefits |
| 42 | |
| 65 | |
| 7 | |
| 30 | |
| Share based payments |
| (253 | ) |
| (156 | ) |
| (224 | ) |
| (70 | ) |
| Effect of presumed profit of subsidiaries (i) and offshore subsidiaries |
| 26,072 | |
| 15,665 | |
| 23,410 | |
| 7,951 | |
| |
| | |
| | |
| | |
| | |
| Other additions (exclusions), net |
| 132 | |
| 155 | |
| 119 | |
| 144 | |
| |
| | |
| | |
| | |
| | |
| Income taxes expenses |
| | |
| | |
| | |
| | |
| Current |
| (27,122 | ) |
| (25,557 | ) |
| (14,605 | ) |
| (12,886 | ) |
| Deferred |
| 2,397 | |
| 2,107 | |
| 2,761 | |
| 1,175 | |
| |
| (24,725 | ) |
| (23,450 | ) |
| (11,844 | ) |
| (11,711 | ) |
| |
| | |
| | |
| | |
| | |
| Effective rate |
| 17% | |
| 20% | |
| 11% | |
| 20% | |
| |
| | |
| | |
| | |
| | |
| (i) | Brazilian tax law establishes that companies that generate gross revenues of up to R$ 78,000 in the
prior fiscal year may calculate income taxes as a percentage of gross revenue, using the presumed profit income tax regime. The Entity's
subsidiaries adopted this tax regime and the effect of the presumed profit of subsidiaries represents the difference between the taxation
based on this method and the amount that would be due based on the statutory rate applied to the taxable profit of the subsidiaries. |
| (a) | Key management remuneration |
The total remuneration (salaries and benefits)
of key management personnel, including the Executive Committee, amounted to R$ 1,725 (June 30, 2022 - R$ 1,455).
In accordance with Vinci internal policy, the
key management is entitled to receive a profit-sharing compensation for the current year, which was paid in January 2023, after the Management
approval. As informed in Note 12, Vinci accrued a provision for profit sharing for the Group as of December 31, 2022.
Vinci Partners Investments Ltd.
Consolidated balance sheet
All amounts in thousands of reais
| (b) | Receivables from related parties |
The Entity receivables from related parties as of June 30, 2023 and
December 31, 2022, as shown in the table below:
| |
06/30/2023 |
|
12/31/2022 |
|
| Vinci Infra Investimentos V2I S.A. |
88 |
|
79 |
|
| Cagliari Participações S.A. |
4 |
|
4 |
|
| Accadia Participações AS |
- |
|
91 |
|
| Norcia Participações SA |
68 |
|
56 |
|
| Laguna Participações S.A. |
- |
|
11 |
|
| VFDL 4 Empreendimentos Imobiliários LTDA |
- |
|
3 |
|
| Vias Participações I S.A. |
- |
|
1 |
|
| Verona Participações Societarias S.A. |
- |
|
8 |
|
| |
160 |
|
253 |
|
As presented in Note 6(i), Vinci may advance payments to its employees.
The Entity's reportable segments are those business
units which provide different services and are separately managed since each business demands different market strategies.
The main information used by management for assessment
of the performance of each segment is the profit by segment for the analysis of the return of these investments.
The information on assets and liabilities by segment
is not disclosed in these financial statements because it is not used by management when managing segments. Management does not make an
analysis by geographical areas for the management of the Entity's business.
Segments are independently managed, with professionals
specifically skilled allocated in each segment.
The Entity's operations are segmented according
to the organization and management model approved by management, and they are divided as follows:
Private Market Strategies
Comprises the investments in illiquid funds, as
described below:
The private equity segment has a generalist
and control-oriented approach, focusing on growth and turnaround. The primary strategy is value creation pursuing transformation of invested
companies, with changes in the growth of revenue, productivity, profitability and management profile, using a proprietary methodology
("Value from the Core").
Another strategy of the segment is
focused on sectors resilient to different investment cycles and minority holdings in small and medium enterprises with business models
that exhibit high growth potential and clear, mensurable ESG (Environmental, Social and Governance) goals.
Vinci Partners Investments Ltd.
Consolidated balance sheet
All amounts in thousands of reais
The Real Estate Investment Funds segment
are focused on shopping centers, logistics, offices, urban real estate and funds of funds, and seek to achieve differentiated returns
through an active management of a diversified and quality portfolio. The segment’s objective is also the development of real estate
properties, following up to five key steps: origination of opportunities, analysis, execution, monitoring and asset sale.
The infrastructure segment has exposure
to real assets through equity and debt instruments, with active in the following sub-segments: power, oil & gas, transportation &
logistic and water & sewage. The strategy invests across two sub-strategies: sector-focused funds and structured credit. The fund’s
investments are periodically monitored, including the evolution of ESG metrics, financial and operational metrics.
This credit segment is focused on
fundamental credit analysis, consistency, and long-term value creation to investors. The area dynamic approach is to tactically allocate
capital between assets classes and adapt to different cycles. It is also sourcing of credit instruments with resilient structures and
sound collateral packages. The credit strategy invests include for core sub-strategies: infrastructure debt, real estate debt, structured
credit and exclusive mandates, following four key steps: origination, analysis, structuring and monitoring.
| (v) | Special situations (SPS) |
This Special situation segment is
focused in complex situations in which financial and human capital are employed to generate superior returns, maintaining adequate risk
levels and preserving the interests of all parties involved.
Liquid Strategies
This segment seeks return through operations in
public markets, as trading bonds, public stocks and derivatives, among other assets. It is comprised by the investments in liquid funds,
as described below:
The hedge fund segment manages funds
through Brazilian and international financial instruments such as stock, credit, interest, foreign exchange and commodities. Monitoring
and risk control are based on different techniques such as: use of options for high conviction trades, monitoring liquidity conditions
for each position, VaR monitoring, scenarios simulations (including stress test), stop loss rules on individual positions and on the portfolio
level.
The public equities segment manages
long-term positions based on fundamental analysis of Brazilian publicly traded companies. The mains strategy is through absolute return,
dividends, and small caps.
Vinci Partners Investments Ltd.
Consolidated balance sheet
All amounts in thousands of reais
Investment products and solutions
Investment products and solutions segments offer
financial products on an open platform basis providing portfolio and management services considering medium/long term risk allocation.
The strategy aims to provide an advanced investment strategy with alpha generation according to the clients’ targets. The strategy
is divided in four sub-strategies: separate exclusive mandates, commingled funds, international allocation and pension plans.
Financial advisory services
The financial advisory services objective is including
high value-added to financial and strategic advisory services to entrepreneurs, corporate senior management teams and boards of directors,
focusing primarily on IPO advisory and M&A transactions for Brazilian middle-market companies. The financial advisory services team
serves as trusted advisors to clients targeting local and/or product expertise in the Brazilian marketplace.
Vinci retirement services
The retirement services focus on planning and building long-term investment
portfolios that assist investors to achieve their retirement goals. The retirement services segment started its operations during the
first semester of 2023.
Vinci Partners Investments Ltd.
Consolidated balance sheet
All amounts in thousands of reais
| |
|
Six-month period ended 06/30/2023 |
| |
Private Market Strategies |
Liquid Strategies |
Investment Products and solutions |
Financial Advisory |
Vinci Retirement Services |
Corporate Center |
Total |
| In Brazil |
90,981 |
42,997 |
36,860 |
17,465 |
9 |
- |
188,312 |
| Abroad |
35,291 |
3,530 |
5,987 |
2,105 |
- |
- |
46,913 |
| Gross revenue from services rendered |
126,272 |
46,527 |
42,847 |
19,570 |
9 |
- |
235,225 |
| Fund Advisory fee |
600 |
- |
17 |
19,570 |
- |
- |
20,187 |
| Fund Management fee |
122,987 |
38,246 |
40,267 |
- |
9 |
- |
201,509 |
| Fund Performance fee |
2,685 |
8,281 |
2,563 |
- |
- |
- |
13,529 |
| Taxes and contributions |
(6,915) |
(2,830) |
(3,972) |
(1,616) |
- |
- |
(15,333) |
| Net revenue from services rendered |
119,357 |
43,697 |
38,875 |
17,954 |
9 |
- |
219,892 |
| (-) General and administrative expenses |
(22,037) |
(12,717) |
(11,031) |
(6,480) |
(3,308) |
(57,889) |
(113,462) |
| Share-based payments |
(437) |
(108) |
155 |
- |
- |
(5,210) |
(5,600) |
| Operating profit |
96,883 |
30,872 |
27,999 |
11,474 |
(3,299) |
(63,099) |
100,830 |
| Finance income |
|
|
|
|
|
|
69,354 |
| Finance cost |
|
|
|
|
|
|
(21,201) |
| Finance result, net |
|
|
|
|
|
|
48,153 |
| Profit before income taxes |
|
|
|
|
|
|
148,983 |
| Income taxes |
|
|
|
|
|
|
(24,725) |
| Profit for the period |
|
|
|
|
|
|
124,258 |
|
|
|
|
|
|
|
|
Vinci Partners Investments Ltd.
Consolidated balance sheet
All amounts in thousands of reais
| |
|
Three-month period ended 06/30/2023 |
| |
Private Market Strategies |
Liquid Strategies |
Investment Products and solutions |
Financial Advisory |
Vinci Retirement Services |
Corporate Center |
Total |
| In Brazil |
46,175 |
23,882 |
18,329 |
12,883 |
9 |
- |
101,278 |
| Abroad |
17,907 |
1,899 |
2,579 |
2,105 |
- |
- |
24,490 |
| Gross revenue from services rendered |
64,082 |
25,781 |
20,908 |
14,988 |
9 |
- |
125,768 |
| Fund Advisory fee |
300 |
- |
8 |
14,988 |
- |
- |
15,296 |
| Fund Management fee |
61,104 |
18,690 |
19,215 |
- |
9 |
- |
99,018 |
| Fund Performance fee |
2,678 |
7,091 |
1,685 |
- |
- |
- |
11,454 |
| Taxes and contributions |
(3,438) |
(1,543) |
(1,983) |
(1,220) |
- |
- |
(8,184) |
| Net revenue from services rendered |
60,644 |
24,238 |
18,925 |
13,768 |
9 |
- |
117,584 |
| (-) General and administrative expenses |
(12,430) |
(7,717) |
(5,506) |
(5,187) |
(1,914) |
(28,685) |
(61,439) |
| Share-based payments |
(173) |
(36) |
(29) |
- |
- |
(3,255) |
(3,493) |
| Operating profit |
48,041 |
16,485 |
13,390 |
8,581 |
(1,905) |
(31,940) |
52,652 |
| Finance income |
|
|
|
|
|
|
65,101 |
| Finance cost |
|
|
|
|
|
|
(14,357) |
| Finance result, net |
|
|
|
|
|
|
50,744 |
| Profit before income taxes |
|
|
|
|
|
|
103,396 |
| Income taxes |
|
|
|
|
|
|
(11,844) |
| Profit for the period |
|
|
|
|
|
|
91,552 |
Vinci Partners Investments Ltd.
Consolidated balance sheet
All amounts in thousands of reais
| |
|
Six-month period ended 06/30/2022 |
| |
Private Market Strategies |
Liquid Strategies |
Investment Products and solutions |
Financial Advisory |
Vinci Retirement Services |
Corporate Center |
Total |
| In Brazil |
66,727 |
43,810 |
38,711 |
10,485 |
- |
- |
159,733 |
| Abroad |
36,132 |
3,423 |
7,782 |
- |
- |
- |
47,337 |
| Gross revenue from services rendered |
102,859 |
47,233 |
46,493 |
10,485 |
- |
- |
207,070 |
| Fund Advisory fee |
810 |
- |
16 |
10,485 |
- |
- |
11,311 |
| Fund Management fee |
99,551 |
43,495 |
45,302 |
- |
- |
- |
188,348 |
| Fund Performance fee |
2,498 |
3,738 |
1,175 |
- |
- |
- |
7,411 |
| Taxes and contributions |
(5,345) |
(2,825) |
(4,149) |
(907) |
- |
- |
(13,226) |
| Net revenue from services rendered |
97,514 |
44,408 |
42,344 |
9,578 |
- |
- |
193,844 |
| (-) General and administrative expenses |
(20,401) |
(10,699) |
(9,562) |
(3,027) |
(3,054) |
(57,900) |
(104,643) |
| Share-based payments |
(602) |
(121) |
(217) |
- |
- |
(2,264) |
(3,204) |
| Operating profit |
76,511 |
33,588 |
32,565 |
6,551 |
(3,054) |
(60,164) |
85,997 |
| Finance income |
|
|
|
|
|
|
37,679 |
| Finance cost |
|
|
|
|
|
|
(8,522) |
| Finance result, net |
|
|
|
|
|
|
29,157 |
| Profit before income taxes |
|
|
|
|
|
|
115,154 |
| Income taxes |
|
|
|
|
|
|
(23,450) |
| Profit for the period |
|
|
|
|
|
|
91,704 |
Vinci Partners Investments Ltd.
Consolidated balance sheet
All amounts in thousands of reais
| |
|
Three-month period ended 06/30/2022 |
| |
Private Market Strategies |
Liquid Strategies |
Investment Products and solutions |
Financial Advisory |
Vinci Retirement Services |
Corporate Center |
Total |
| In Brazil |
34,313 |
21,346 |
20,469 |
6,981 |
- |
- |
83,109 |
| Abroad |
18,071 |
1,580 |
3,962 |
- |
- |
- |
23,613 |
| Gross revenue from services rendered |
52,384 |
22,926 |
24,431 |
6,981 |
- |
- |
106,722 |
| Fund Advisory fee |
300 |
- |
8 |
6,981 |
- |
- |
7,289 |
| Fund Management fee |
50,264 |
21,599 |
23,490 |
- |
- |
- |
95,353 |
| Fund Performance fee |
1,820 |
1,327 |
933 |
- |
- |
- |
4,080 |
| Taxes and contributions |
(2,737) |
(1,413) |
(2,199) |
(604) |
- |
- |
(6,953) |
| Net revenue from services rendered |
49,647 |
21,513 |
22,232 |
6,377 |
- |
- |
99,769 |
| (-) General and administrative expenses |
(10,262) |
(5,238) |
(3,763) |
(1,739) |
(3,054) |
(27,362) |
(51,418) |
| Share-based payments |
(270) |
(55) |
(98) |
- |
- |
(2,045) |
(2,468) |
| Operating profit |
39,115 |
16,220 |
18,371 |
4,638 |
(3,054) |
(29,407) |
45,883 |
| Finance income |
|
|
|
|
|
|
14,687 |
| Finance cost |
|
|
|
|
|
|
(2,461) |
| Finance result, net |
|
|
|
|
|
|
12,226 |
| Profit before income taxes |
|
|
|
|
|
|
58,109 |
| Income taxes |
|
|
|
|
|
|
(11,711) |
| Profit for the period |
|
|
|
|
|
|
46,398 |
Vinci Partners Investments Ltd.
Consolidated balance sheet
All amounts in thousands of reais
As of June 30, 2023, and December 31, 2022, the Entity
is not aware of disputes classified as probable chance of loss.
Find below the disputes classified as possible chance of
loss segregated into labor, tax and civil.
| |
06/30/2023 |
|
12/31/2022 |
|
| |
|
|
|
|
| Tax |
19,871 |
|
20,452 |
|
| Labor |
780 |
|
1,967 |
|
| Total |
20,651 |
|
22,419 |
|
Tax Claims
Vinci Gestora de Recursos Ltda. is
a party to a tax administrative proceeding in course arising from the payment of social security contributions (employer's portion and
Work Accident Insurance (SAT)) in 2011, charged on amounts paid by virtue of quota of profits and results, totaling R$ 2,048.
Vinci Equities Gestora de Recursos
Ltda. has one proceeding related to the requirement of ISS (excise tax) under rendered services to investment funds located abroad in
the amount of R$ 235. Supported by the opinion of its legal advisors, management classified these proceedings as having a possible risk
of loss and did not record a provision for contingencies related to these proceedings.
On March 21, 2018, the Brazilian federal
revenue opened a tax assessment against Vinci Equities for the collection of open debts of IRPJ, CSLL, PIS and COFINS in the amount of
R$ 17,588 for the calendar year of 2013.
The Entity provides benefits to its
employees through a share-based incentive. The following item refers to the outstanding plan on June 30, 2023.
Stock Options
May, 2021
On May 6, 2021, the Entity launched
a Stock Option Plan (“SOP” or “Plan”) in order to grant stock options to certain key employees (“Participants”)
to incentivize and reward such individuals. These awards are scheduled to vest over a three-year period and the holders of vested options
are entitled to purchase shares at the market price of the shares at grant date. This right may be subject to certain conditions to be
imposed by the Entity and aims at aligning the interests of the Entity's shareholders with those of the Participants. Each option will
entitle the Participant to acquire 1 Class A common shares issued by the Company. The key terms and conditions related to the grants under
the SOP are as follows:
| # Tranche |
Period in months when options will become potentially suitable for exercise (“Grace Period”) |
Limit per tranche |
| (percentage of the number of options granted) |
(quantity of the number of options granted) |
| 1st tranche |
12 |
20% |
332,498 |
| 2nd tranche |
24 |
20% |
332,498 |
| 3rd tranche |
36 |
60% |
997,485 |
Vinci Partners Investments Ltd.
Consolidated balance sheet
All amounts in thousands of reais
The fair value of each stock option
granted was estimated at the grant date based on the Black-Scholes-Merton pricing model.
| Dividend yield (%) |
5 |
| Expected volatility (%) |
35 |
| Risk-free rate of return (%) |
0.40 |
| Vesting period of options (years) |
3 |
| Strike price |
US$ 18.00 |
| Spot price |
US$ 11.22 |
| Pricing model |
Black-Scholes-Merton |
The initial date of Grace Period for
the options granted will be February 1st, 2021, the Company’s Initial Public Offer settlement day. The Participant will have the
right to exercise their vested options from the third anniversary of the date of execution of the program up to 1 year, after which the
referred options will be automatically forfeited, in full, regardless of prior notice or notification, and without the right to any indemnity.
No Participant will have any of the rights and privileges of the Company's shareholders until the options are duly exercised and the shares
under the options are acquired by the Participant.
The issue or purchase price of the
shares to be subscribed or purchased by the Participants (“Exercise Price”) will be US$18.00. The Exercise Price will be reduced
by the amount in dollars per share distributed to its shareholders from the date of execution of this Plan, whether as dividends, interest
on equity, redemption, capital reduction or other events defined by the Board of Directors.
The maximum number of shares available
for the exercise of options under this plan is limited to 5% of the total share capital of the Company at any time, on a fully diluted
basis, taking into account also the options granted under this Plan.
As of June 30, 2023, there are stock
options outstanding with respect to 1,482,753 Class A common shares.
The total expense recognized for the
programs for the six-month period ended June 30, 2023 was R$ 460 (June 30, 2022 was R$ 1,338).
February, 2023
In February 2023, the Board of Directors
approved a second Stock Option Plan, which aims to grant up to 1,150,000 options, each entitling the beneficiary to purchase one Class
A common share. Such options have an exercise price per share equal to US$9.96; provided that, unless otherwise provided for in an option
agreement, this exercise price will be reduced by the amount per share distributed to our shareholders from the date of the grant of the
option, whether as dividends, interest on capital, redemption, capital reduction or others. Options will become eligible to be exercised
in May 2026. During the second quarter of 2023 the Entity and its subsidiaries issued stock option in connection to the related Plan.
As of June 30, 2023, there are stock
options outstanding with respect to 1,116,884 Class A common shares.
The total expense recognized for the
programs for the period ended June 30, 2023 was R$ 494.
Restricted Share Unit (RSU)
| a) | Restricted Shares Units Plan |
On April 04, 2022, the Entity announced
its Restricted Share Unit Award Plan (“Plan”). The purpose of this Plan is to provide the opportunity for officers and employees
of Vinci and its Subsidiaries, as elected by the Executive Compensation Committee, to receive restricted Shares (“RSU”). Shares
representing up to 1.65% of the total amount of the capital stock of the Company, which equals, on this date, approximately 950.000 shares.
Under the Plan, stocks are awarded
to the recipient upon their grant date. Subject to the terms of the Plan, each RSU shall grant the
Vinci Partners Investments Ltd.
Consolidated balance sheet
All amounts in thousands of reais
beneficiary the right to receive one
(1) share, subject to the satisfaction of the conditions for acquisition of the shares. The RSUs awarded to the beneficiary shall be vested
in different tranches, as long as the service condition is fulfilled and verified. The vesting dates may vary from 1 to 6 years after
the granted date, accordingly to the dates defined in each Restricted Share Unit Award Agreement.
If an eligible participant
ceases its relationship with the Group, within the vesting period, the rights will be forfeited, except in limited
circumstances.
| b) | Fair value of shares granted |
Estimating fair value for share-based
payment transactions requires determination of the most appropriate valuation model and underlying assumptions, which depends on the terms
and conditions of the grant and the information available at the grant date.
The Company uses certain assumptions
to determine the RSUs fair value at the granted date, including the following:
| • | Market value of the shares at the granted date. |
| • | Estimative of dividend yield and the US interest rate for the
years comprised from the granted date until the vesting dates. |
These estimates also require
determination of the most appropriate inputs to the valuation models including assumptions regarding the expected life of a
share-based payment.
| c) | Outstanding shares granted and valuation inputs |
During the second quarter of 2023
57,413 RSUs were vested, remaining outstanding 690,557 RSUs as of June 30, 2023. Total compensation expense of the plans for the six-month
period ended June 30,2023 was R$ 4,645, including R$ 806 of social charges provisions (R$ 1,865 for the six-month period ended June 30,
2022, including R$ 476 of social charges).
According to the Repurchase Program
(Note 16(f)), from July 01, 2023 to July 27, 2023, 205,612 Class A common shares were repurchased by the Entity, in the amount of R$ 9,860.
Vinci Partners Investments (NASDAQ:VINP)
Gráfica de Acción Histórica
De Abr 2024 a May 2024

Vinci Partners Investments (NASDAQ:VINP)
Gráfica de Acción Histórica
De May 2023 a May 2024
