0001534254
false
0001534254
2023-08-07
2023-08-07
iso4217:USD
xbrli:shares
iso4217:USD
xbrli:shares
UNITED STATES
SECURITIES AND EXCHANGE COMMISSION
WASHINGTON, D.C. 20549
FORM 8-K
CURRENT REPORT
Pursuant to Section 13 or 15(d) of the
Securities Exchange Act of 1934
Date of Report (Date of earliest event
reported): August 9, 2023 (August 7, 2023)
CĪON
Investment Corporation
(Exact Name of Registrant as Specified
in Charter)
| Maryland |
|
000-54755 |
|
45-3058280 |
| (State
or Other Jurisdiction of Incorporation) |
|
(Commission
File Number) |
|
(I.R.S.
Employer Identification No.) |
| |
100 Park Avenue, 25th Floor
New York, New York 10017 |
|
| |
(Address of Principal Executive Offices) |
|
| |
(212)
418-4700 |
|
| |
(Registrant’s
telephone number, including area code) |
|
| |
Not
applicable |
|
| |
(Former
name or former address, if changed since last report) |
|
Check the appropriate box below if the
Form 8-K filing is intended to simultaneously satisfy the filing obligation of the registrant under any of the following provisions:
¨
Written communications pursuant to Rule 425 under the Securities Act (17 CFR 230.425)
¨
Soliciting material pursuant to Rule 14a-12 under the Exchange Act (17 CFR 240.14a-12)
¨
Pre-commencement communications pursuant to Rule 14d-2(b) under the Exchange Act (17 CFR 240.14d-2(b))
¨
Pre-commencement communications pursuant to Rule 13e-4(c) under the Exchange Act (17 CFR 240.13e-4(c))
Securities registered
pursuant to Section 12(b) of the Act:
| Title
of each class |
|
Trading
symbol(s) |
|
Name
of each exchange on which registered |
| Common stock, par value $0.001 per share |
|
CION |
|
The New York Stock Exchange |
Indicate by check mark whether the registrant
is an emerging growth company as defined in Rule 405 of the Securities Act of 1933 (§230.405 of this chapter) or Rule 12b-2
of the Securities Exchange Act of 1934 (§240.12b-2 of this chapter).
Emerging growth company ¨
If an emerging growth company, indicate
by check mark if the registrant has elected not to use the extended transition period for complying with any new or revised financial
accounting standards provided pursuant to Section 13(a) of the Exchange Act. ¨
Item 2.02. Results of Operations and Financial
Condition.
Regular
Quarterly and Supplemental Distributions
The
board of directors (the “Board”) of CĪON Investment Corporation (“CION”) has delegated to CION’s executive
officers the authority to determine the amount, record dates, payment dates and other terms of distributions to shareholders, which will
be ratified by the Board on a quarterly basis.
On
August 7, 2023, CION’s co-chief executive officers declared
(i) a regular quarterly cash distribution of $0.34 per share for the third quarter of 2023 payable on
September 15, 2023 to shareholders of record as of September 1, 2023 and (ii) a supplemental cash distribution of
$0.05 per share for both the third and fourth quarters of 2023, payable on October 16, 2023 and January 15, 2024, respectively, to
shareholders of record as of September 29, 2023 and December 29, 2023, respectively. A copy of the press release announcing the
foregoing is attached hereto as Exhibit 99.1 and incorporated by reference herein.
Q2 2023
Financial Results
On August
9, 2023, CION issued a press release announcing its financial results for the second
quarter ended June 30, 2023. A copy of the press release is attached hereto as Exhibit 99.1 and incorporated by
reference herein.
In
connection with its conference call to be held on August 9, 2023 to discuss its financial
results for the second quarter ended June 30, 2023, CION has provided an accompanying slide presentation in
the Investor Resources – Events and Presentations section of its website at www.cionbdc.com. A
copy of the presentation is also attached hereto as Exhibit 99.2 and incorporated by reference herein.
The
information disclosed under this Item 2.02, including Exhibits 99.1 and 99.2 hereto, is being “furnished” and shall not be
deemed “filed” by CION for purposes of Section 18 of the Securities Exchange Act of 1934, as amended (the “Exchange
Act”), or otherwise subject to the liabilities of that section, and shall not be deemed incorporated by reference into any filing
under the Securities Act of 1933, as amended, or the Exchange Act, except as shall be expressly set forth by specific reference in such
filing.
Item 7.01. Regulation
FD Disclosure.
The
information in Item 2.02 of this Current Report on Form 8-K is incorporated by reference into this Item 7.01.
Item 9.01.
Financial Statements and Exhibits.
Pursuant to the requirements of the Securities
Exchange Act of 1934, as amended, the Registrant has duly caused this report to be signed on its behalf by the undersigned hereunto
duly authorized.
| |
|
CĪON Investment Corporation
|
| Date: |
August 9, 2023 |
By: /s/ Michael A. Reisner |
| |
|
Co-Chief Executive Officer |
EXHIBIT LIST
EXHIBIT
NUMBER |
|
DESCRIPTION |
Exhibit 99.1

CION INVESTMENT CORPORATION REPORTS SECOND QUARTER
2023 FINANCIAL RESULTS
Reports Another Solid Quarterly Performance,
Out Earning the Distribution by 26% and Achieving a $0.20 per Share Increase in Net Asset Value
Announces Third Quarter 2023 Base Distribution
of $0.34 per Share
Announces Total Supplemental Distribution of
$0.10 per Share
For Immediate Release
NEW YORK, August 9, 2023 — CION Investment
Corporation (NYSE: CION) (“CION” or the “Company”) today reported financial results for the second quarter ended
June 30, 2023 and filed its Form 10-Q with the U.S. Securities and Exchange Commission.
CION also announced that, on August 7, 2023, its
co-chief executive officers declared (i) a third quarter 2023 regular distribution of $0.34 per share payable on September 15, 2023 to
shareholders of record as of September 1, 2023 and (ii) a supplemental distribution of $0.05 per share for both the third and fourth quarters
of 2023, payable on October 16, 2023 and January 15, 2024, respectively, to shareholders of record as of September 29, 2023 and December
29, 2023, respectively.
SECOND QUARTER AND OTHER HIGHLIGHTS
| • | Net investment income and earnings per share for the quarter ended June 30, 2023 were $0.43 per share
and $0.51 per share, respectively; |
| • | Net asset value per share was $15.31 as of June 30, 2023 compared to $15.11 as of March 31,
2023, an increase of $0.20 per share, or 1.3%. The increase was primarily due to the Company out earning its distribution for the period
and mark-to-market adjustments to the Company’s portfolio; |
| • | As of June 30, 2023, the Company had $986 million of total principal amount of debt outstanding,
of which 71% was comprised of senior secured bank debt and 29% was comprised of unsecured debt. The Company’s net debt-to-equity
ratio was 1.04x as of June 30, 2023 compared to 1.02x as of March 31, 2023; |
| • | As of June 30, 2023, the Company had total investments at fair value of $1,688 million in 112 portfolio
companies across 24 industries. The investment portfolio was comprised of 89.3% senior secured loans, including 87.0% in first lien investments;1 |
| • | During the quarter, the Company funded new investment commitments of $62 million, funded previously unfunded
commitments of $8 million, and had sales and repayments totaling $55 million, resulting in a net increase to the Company's funded portfolio
of $15 million; |
| • | As of June 30, 2023, investments on non-accrual status amounted to 1.7% and 4.8% of the total investment portfolio at fair value
and amortized cost, respectively; |
| • | During the quarter, the Company repurchased 328,628 shares of its common stock under its 10b5-1 trading
plan at an average price of $9.81 per share for a total repurchase amount of $3.2 million. Through June 30, 2023, the Company repurchased
a total of 2,325,622 shares of its common stock under its 10b5-1 trading plan at an average price of $9.57 per share for a total repurchase
amount of $22.3 million and; |
| • | During the quarter, the Company amended its senior secured credit facilities with JPMorgan Chase Bank,
National Association and UBS AG to, among other things, extend the maturity from May 15, 2024 and November 19, 2023, respectively, to
May 15, 2025 and November 19, 2024, respectively. |
DISTRIBUTIONS
| • | For the quarter ended June 30, 2023, the Company paid a regular quarterly distribution totaling $18.6
million, or $0.34 per share. |
Michael A. Reisner, co-Chief Executive Officer
of CION, commented:
“Our quarterly earnings showed continued
strength, with NII of $0.43 per share, which once again outperformed our base distribution of $0.34 per share. Moreover, our NAV grew
by over 1%, or approximately $0.20 per share.
Our portfolio's credit quality is solid, with
many softer credit positions from last quarter related to consumer-facing businesses already restructured. Looking forward, we expect
non-accruals to align more closely with our historical average of below 1% on a pro-forma basis.
Amid recent market uncertainties, our share buyback
program has capitalized on attractive market price discounts to our NAV per share, supported by our strong balance sheet. Recognizing
the significant undervaluation of our shares, we have already repurchased 666,657 shares in 2023, reaffirming our confidence in the company's
future growth and potential.
Given our continued strong financial performance,
we have declared a supplemental distribution of $0.05/share for both Q3 and Q4.”
Looking ahead, CION is confidently positioned
to deliver robust returns to shareholders.”
SELECTED FINANCIAL HIGHLIGHTS
| | |
As of | |
| (in thousands, except per share data) | |
June 30, 2023 | | |
March 31, 2023 | |
| Investment portfolio, at fair value1 | |
$ | 1,687,691 | | |
$ | 1,657,026 | |
| Total debt outstanding2 | |
$ | 985,712 | | |
$ | 1,010,712 | |
| Net assets | |
$ | 836,364 | | |
$ | 830,310 | |
| Net asset value per share | |
$ | 15.31 | | |
$ | 15.11 | |
| Debt-to-equity | |
| 1.18 | x | |
| 1.22 | x |
| Net debt-to-equity | |
| 1.04 | x | |
| 1.02 | x |
| | |
Three Months Ended | |
| (in thousands, except share and per share data) | |
June 30, 2023 | | |
March 31, 2023 | |
| Total investment income | |
$ | 58,496 | | |
$ | 64,975 | |
| Total operating expenses and income tax expense | |
$ | 35,080 | | |
$ | 35,117 | |
| Net investment income after taxes | |
$ | 23,416 | | |
$ | 29,858 | |
| Net realized losses | |
$ | (18,928 | ) | |
$ | (4,525 | ) |
| Net unrealized gains (losses) | |
$ | 23,406 | | |
$ | (56,378 | ) |
| Net increase (decrease) in net assets resulting from operations | |
$ | 27,894 | | |
$ | (31,045 | ) |
| | |
| | | |
| | |
| Net investment income per share | |
$ | 0.43 | | |
$ | 0.54 | |
| Net realized and unrealized gains (losses) per share | |
$ | 0.08 | | |
$ | (1.10 | ) |
| Earnings per share | |
$ | 0.51 | | |
$ | (0.56 | ) |
| | |
| | | |
| | |
| Weighted average shares outstanding | |
| 54,788,740 | | |
| 55,109,482 | |
| Distributions declared per share | |
$ | 0.34 | | |
$ | 0.34 | |
Total investment income for the three months
ended June 30, 2023 and March 31, 2023 was $58.5 million and $65.0 million, respectively. The decrease in investment
income was primarily driven by a decrease in dividend income from certain investments and fees generated from investment activity,
partially offset by an increase in SOFR and LIBOR rates, during the three months ended June 30, 2023 compared to the three
months ended March 31, 2023.
Operating expenses for the three months ended
June 30, 2023 and March 31, 2023 were $35.1 million. During the quarter ended June 30, 2023, the Company incurred higher
interest expense due to an increase in SOFR and LIBOR rates which was offset by lower advisory fees as compared to the quarter ended March 31,
2023.
PORTFOLIO AND INVESTMENT ACTIVITY1
A summary of the Company's investment activity for the three months
ended June 30, 2023 is as follows:
| | |
New Investment
Commitments | | |
Sales and Repayments | |
| Investment Type | |
$ in
Thousands | | |
%
of Total | | |
$ in
Thousands | | |
%
of Total | |
| Senior secured first lien debt | |
$ | 62,779 | | |
| 90 | % | |
$ | 54,498 | | |
| 100 | % |
| Senior secured second lien debt | |
| — | | |
| — | | |
| 5 | | |
| — | |
| Collateralized securities and structured products - equity | |
| — | | |
| — | | |
| 96 | | |
| — | |
| Unsecured debt | |
| 4,200 | | |
| 6 | % | |
| — | | |
| — | |
| Equity | |
| 2,906 | | |
| 4 | % | |
| — | | |
| — | |
| Total | |
$ | 69,885 | | |
| 100 | % | |
$ | 54,599 | | |
| 100 | % |
During the three months ended June 30, 2023,
new investment commitments were made across 4 new and 8 existing portfolio companies. During the same
period, the Company received the full repayment of a loan from one portfolio company. As a result, the number of portfolio companies increased
from 109 as of March 31, 2023 to 112 as of June 30, 2023.
PORTFOLIO SUMMARY1
As of June 30, 2023, the Company’s investments consisted
of the following:
| | |
Investments at Fair Value | |
| Investment Type | |
$ in
Thousands | | |
%
of Total | |
| Senior secured first lien debt | |
$ | 1,468,630 | | |
| 87.0 | % |
| Senior secured second lien debt | |
| 39,544 | | |
| 2.3 | % |
| Collateralized securities and structured products - equity | |
| 1,046 | | |
| 0.1 | % |
| Unsecured debt | |
| 17,301 | | |
| 1.0 | % |
| Equity | |
| 161,170 | | |
| 9.6 | % |
| Total | |
$ | 1,687,691 | | |
| 100.0 | % |
The following table presents certain selected information regarding
the Company’s investments:
| | |
As of | |
| | |
June 30, 2023 | | |
March 31, 2023 | |
| Number of portfolio companies | |
| 112 | | |
| 109 | |
| Percentage of performing loans bearing a floating rate3 | |
| 92.2 | % | |
| 92.8 | % |
| Percentage of performing loans bearing a fixed rate3 | |
| 7.8 | % | |
| 7.2 | % |
| Yield on debt and other income producing investments at amortized cost4 | |
| 12.38 | % | |
| 11.97 | % |
| Yield on performing loans at amortized cost4 | |
| 13.10 | % | |
| 12.90 | % |
| Yield on total investments at amortized cost | |
| 11.45 | % | |
| 11.18 | % |
| Weighted average leverage (net debt/EBITDA)5 | |
| 4.83 | x | |
| 5.11 | x |
| Weighted average interest coverage5 | |
| 2.00 | x | |
| 2.07 | x |
| Median EBITDA6 | |
| $35.0 million | | |
| $35.0 million | |
As of June 30, 2023, investments on non-accrual
status represented 1.7% and 4.8% of the total investment portfolio at fair value and amortized cost, respectively. As of March 31,
2023, investments on non-accrual status represented 3.5% and 6.8% of the total investment portfolio at fair value and amortized cost,
respectively.
LIQUIDITY AND CAPITAL RESOURCES
As of June 30, 2023, the Company had $986
million of total principal amount of debt outstanding, comprised of $700 million of outstanding borrowings under its senior secured credit
facilities and $286 million of unsecured notes and term loans. The combined weighted average interest rate on debt outstanding was 7.9%
for the quarter ended June 30, 2023. As of June 30, 2023, the Company had $112 million in cash and short-term investments and
$125 million available under its financing arrangements.2
EARNING CONFERENCE CALL
CION will host an earnings conference call on
Wednesday, August 9, 2023 at 11:00 am Eastern Time to discuss its financial results for the second quarter ended June 30, 2023. Please
visit the Investor Resources - Events and Presentations section of the Company’s website at www.cionbdc.com for a slide presentation
that complements the earnings conference call.
All interested parties are invited to participate
via telephone or listen via the live webcast, which can be accessed by clicking the following link: CION Investment Corporation Second
Quarter 2023 Financial Results Webcast. Domestic callers can access the conference call by dialing (877) 484-6065. International
callers can access the conference call by dialing +1 (201) 689-8846. All callers are asked to dial in approximately 10 minutes prior
to the call. An archived replay will be available on a webcast link located in the Investor Resources - Events and Presentations section
of CION’s website.
ENDNOTES
| 1) | The discussion of the investment portfolio excludes short-term investments. |
| 2) | Total debt outstanding excludes netting of debt issuance costs of $9.0 million and $8.3 million as of
June 30, 2023 and March 31, 2023, respectively. |
| 3) | The fixed versus floating composition has been calculated as a percentage of performing debt investments
measured on a fair value basis, including income producing preferred stock investments and excludes investments, if any, on non-accrual
status. |
| 4) | Computed based on the (a) annual actual interest rate or yield earned plus amortization of fees and discounts
on the performing debt and other income producing investments as of the reporting date, divided by (b) the total performing debt and other
income producing investments (excluding investments on non-accrual status) at amortized cost. This calculation excludes exit fees that
are receivable upon repayment of the investment. |
| 5) | For a particular portfolio company, the Company calculates the level of contractual indebtedness net of
cash (“net debt”) owed by the portfolio company and compares that amount to measures of cash flow available to service the
net debt. To calculate net debt, the Company includes debt that is both senior and pari passu to the tranche of debt owned by it but excludes
debt that is legally and contractually subordinated in ranking to the debt owned by the Company. The Company believes this calculation
method assists in describing the risk of its portfolio investments, as it takes into consideration contractual rights of repayment of
the tranche of debt owned by the Company relative to other senior and junior creditors of a portfolio company. The Company typically calculates
cash flow available for debt service at a portfolio company by taking EBITDA for the trailing twelve-month period. Weighted average net
debt to EBITDA is weighted based on the fair value of the Company's performing debt investments and excluding investments where net debt
to EBITDA may not be the appropriate measure of credit risk, such as cash collateralized loans and investments that are underwritten and
covenanted based on recurring revenue. |
For a particular portfolio company,
the Company also calculates the level of contractual interest expense owed by the portfolio company and compares that amount to EBITDA
(“interest coverage ratio”). The Company believe this calculation method assists in describing the risk of its portfolio investments,
as it takes into consideration contractual interest obligations of the portfolio company. Weighted average interest coverage is weighted
based on the fair value of the Company's performing debt investments, excluding investments where interest coverage may not be the appropriate
measure of credit risk, such as cash collateralized loans and investments that are underwritten and covenanted based on recurring revenue.
Portfolio company statistics, including
EBITDA, are derived from the financial statements most recently provided to the Company for each portfolio company as of the reported
end date. Statistics of the portfolio companies have not been independently verified by the Company and may reflect a normalized or adjusted
amount.
| 6) | Median EBITDA is calculated based on the portfolio company's EBITDA as of the Company's initial investment. |
CĪON Investment Corporation
Consolidated Balance Sheets
(in thousands, except share and per share amounts)
| | |
June 30, 2023 | | |
March 31, 2023 | |
| | |
(unaudited) | | |
(unaudited) | |
| Assets | |
| Investments, at fair value: | |
| | | |
| | |
| Non-controlled, non-affiliated investments (amortized cost of $1,583,865 and $1,576,870, respectively) | |
$ | 1,510,372 | | |
$ | 1,479,976 | |
| Non-controlled, affiliated investments (amortized cost of $204,248 and $169,539, respectively) | |
| 198,084 | | |
| 162,785 | |
| Controlled investments (amortized cost of $76,900) | |
| 80,006 | | |
| 80,591 | |
| Total investments, at fair value (amortized cost of $1,823,309 and $1,803,609, respectively) | |
| 1,788,462 | | |
| 1,723,352 | |
| Cash | |
| 11,515 | | |
| 96,016 | |
| Interest receivable on investments | |
| 33,200 | | |
| 27,333 | |
| Receivable due on investments sold and repaid | |
| 997 | | |
| 3,239 | |
| Prepaid expenses and other assets | |
| 608 | | |
| 4,552 | |
| Total assets | |
$ | 1,834,782 | | |
$ | 1,854,492 | |
| | |
| | | |
| | |
| Liabilities and Shareholders' Equity | |
| Liabilities | |
| | | |
| | |
| Financing arrangements (net of unamortized debt issuance costs of $8,976 and $8,316, respectively) | |
$ | 976,737 | | |
$ | 1,002,396 | |
| Accounts payable and accrued expenses | |
| 1,344 | | |
| 1,075 | |
| Interest payable | |
| 8,183 | | |
| 7,007 | |
| Accrued management fees | |
| 6,546 | | |
| 6,676 | |
| Accrued subordinated incentive fee on income | |
| 4,967 | | |
| 6,334 | |
| Accrued administrative services expense | |
| 574 | | |
| 694 | |
| Share repurchases payable | |
| 67 | | |
| — | |
| Total liabilities | |
| 998,418 | | |
| 1,024,182 | |
| | |
| | | |
| | |
| Shareholders' Equity | |
| | | |
| | |
| Common stock, $0.001 par value; 500,000,000 shares authorized;
54,645,571 and 54,961,455 shares issued, and 54,632,827 and 54,961,455 shares outstanding, respectively | |
| 55 | | |
| 55 | |
| Capital in excess of par value | |
| 1,037,729 | | |
| 1,040,955 | |
| Accumulated distributable losses | |
| (201,420 | ) | |
| (210,700 | ) |
| Total shareholders' equity | |
| 836,364 | | |
| 830,310 | |
| Total liabilities and shareholders' equity | |
$ | 1,834,782 | | |
$ | 1,854,492 | |
| Net asset value per share of common stock at end of period | |
$ | 15.31 | | |
$ | 15.11 | |
CĪON Investment Corporation
Consolidated Statements of Operations
(in thousands, except share and per share amounts)
| | |
Three Months Ended
June 30, | | |
Six Months Ended
June 30, | | |
Year Ended
December 31, | |
| | |
2023 | | |
2022 | | |
2023 | | |
2022 | | |
2022 | |
| | |
(unaudited) | | |
(unaudited) | | |
(unaudited) | | |
(unaudited) | | |
| |
| Investment income | |
| | | |
| | | |
| | | |
| | | |
| | |
| Non-controlled, non-affiliated investments | |
| | | |
| | | |
| | | |
| | | |
| | |
| Interest income | |
$ | 47,117 | | |
$ | 31,749 | | |
$ | 89,885 | | |
$ | 62,743 | | |
$ | 140,560 | |
| Paid-in-kind interest income | |
| 4,297 | | |
| 4,613 | | |
| 9,128 | | |
| 9,219 | | |
| 22,737 | |
| Fee income | |
| 1,154 | | |
| 2,554 | | |
| 2,297 | | |
| 3,503 | | |
| 9,019 | |
| Dividend income | |
| — | | |
| — | | |
| — | | |
| 46 | | |
| 103 | |
| Non-controlled, affiliated investments | |
| | | |
| | | |
| | | |
| | | |
| | |
| Interest income | |
| 1,734 | | |
| 1,545 | | |
| 4,208 | | |
| 2,568 | | |
| 5,865 | |
| Dividend income | |
| 52 | | |
| 53 | | |
| 3,933 | | |
| 53 | | |
| 79 | |
| Paid-in-kind interest income | |
| 1,751 | | |
| 874 | | |
| 3,482 | | |
| 2,319 | | |
| 6,204 | |
| Fee income | |
| 477 | | |
| 13 | | |
| 2,397 | | |
| 506 | | |
| 525 | |
| Controlled investments | |
| | | |
| | | |
| | | |
| | | |
| | |
| Dividend income | |
| — | | |
| — | | |
| 4,250 | | |
| — | | |
| 1,275 | |
| Interest income | |
| 1,914 | | |
| 1,742 | | |
| 3,891 | | |
| 3,869 | | |
| 6,049 | |
| Paid-in-kind interest income | |
| — | | |
| 409 | | |
| — | | |
| 409 | | |
| 2,482 | |
| Total investment income | |
| 58,496 | | |
| 43,552 | | |
| 123,471 | | |
| 85,235 | | |
| 194,898 | |
| Operating expenses | |
| | | |
| | | |
| | | |
| | | |
| | |
| Management fees | |
| 6,546 | | |
| 6,839 | | |
| 13,222 | | |
| 13,494 | | |
| 27,361 | |
| Administrative services expense | |
| 910 | | |
| 781 | | |
| 1,747 | | |
| 1,501 | | |
| 3,348 | |
| Subordinated incentive fee on income | |
| 4,965 | | |
| 4,091 | | |
| 11,300 | | |
| 8,224 | | |
| 18,710 | |
| General and administrative | |
| 2,074 | | |
| 1,712 | | |
| 4,029 | | |
| 3,934 | | |
| 7,278 | |
| Interest expense | |
| 20,467 | | |
| 10,841 | | |
| 39,776 | | |
| 19,300 | | |
| 49,624 | |
| Total operating expenses | |
| 34,962 | | |
| 24,264 | | |
| 70,074 | | |
| 46,453 | | |
| 106,321 | |
| Net investment income before taxes | |
| 23,534 | | |
| 19,288 | | |
| 53,397 | | |
| 38,782 | | |
| 88,577 | |
| Income tax expense, including excise tax | |
| 118 | | |
| — | | |
| 123 | | |
| 11 | | |
| 372 | |
| Net investment income after taxes | |
| 23,416 | | |
| 19,288 | | |
| 53,274 | | |
| 38,771 | | |
| 88,205 | |
| Realized and unrealized (losses) gains | |
| | | |
| | | |
| | | |
| | | |
| | |
| Net realized (losses) gains on: | |
| | | |
| | | |
| | | |
| | | |
| | |
| Non-controlled, non-affiliated investments | |
| (18,928 | ) | |
| 180 | | |
| (23,453 | ) | |
| 208 | | |
| (11,217 | ) |
| Non-controlled, affiliated investments | |
| — | | |
| — | | |
| — | | |
| (97 | ) | |
| (21,530 | ) |
| Foreign currency | |
| — | | |
| — | | |
| — | | |
| — | | |
| (3 | ) |
| Net realized (losses) gains | |
| (18,928 | ) | |
| 180 | | |
| (23,453 | ) | |
| 111 | | |
| (32,750 | ) |
| Net change in unrealized appreciation (depreciation) on: | |
| | | |
| | | |
| | | |
| | | |
| | |
| Non-controlled, non-affiliated investments | |
| 23,396 | | |
| (17,482 | ) | |
| (17,690 | ) | |
| (24,977 | ) | |
| (19,807 | ) |
| Non-controlled, affiliated investments | |
| 595 | | |
| (1,577 | ) | |
| (9,695 | ) | |
| (5,357 | ) | |
| 13,523 | |
| Controlled investments | |
| (585 | ) | |
| (1,675 | ) | |
| (5,587 | ) | |
| (1,925 | ) | |
| 970 | |
| Net change in unrealized appreciation (depreciation) | |
| 23,406 | | |
| (20,734 | ) | |
| (32,972 | ) | |
| (32,259 | ) | |
| (5,314 | ) |
| Net realized and unrealized gains (losses) | |
| 4,478 | | |
| (20,554 | ) | |
| (56,425 | ) | |
| (32,148 | ) | |
| (38,064 | ) |
| Net increase (decrease) in net assets resulting from operations | |
$ | 27,894 | | |
$ | (1,266 | ) | |
$ | (3,151 | ) | |
$ | 6,623 | | |
$ | 50,141 | |
| Per share information—basic and diluted | |
| | | |
| | | |
| | | |
| | | |
| | |
| Net increase (decrease) in net assets per share resulting from operations | |
$ | 0.51 | | |
$ | (0.02 | ) | |
$ | (0.06 | ) | |
$ | 0.12 | | |
$ | 0.89 | |
| Net investment income per share | |
$ | 0.43 | | |
$ | 0.34 | | |
$ | 0.97 | | |
$ | 0.68 | | |
$ | 1.56 | |
| Weighted average shares of common stock outstanding | |
| 54,788,740 | | |
| 56,958,440 | | |
| 54,948,225 | | |
| 56,958,440 | | |
| 56,556,510 | |
ABOUT CION INVESTMENT CORPORATION
CION Investment Corporation is a leading publicly
listed business development company that had approximately $1.8 billion in total assets as of June 30, 2023. CION seeks to generate
current income and, to a lesser extent, capital appreciation for investors by focusing primarily on senior secured loans to U.S. middle-market
companies. CION is advised by CION Investment Management, LLC, a registered investment adviser and an affiliate of CION. For more information,
please visit www.cionbdc.com.
FORWARD-LOOKING STATEMENTS
This press release may contain forward-looking
statements that involve substantial risks and uncertainties. You can identify these statements by the use of forward-looking terminology
such as “may,” “will,” “should,” “expect,” “anticipate,” “project,”
“target,” “estimate,” “intend,” “continue,” or “believe” or the negatives
thereof or other variations thereon or comparable terminology. You should read statements that contain these words carefully because they
discuss CION’s plans, strategies, prospects and expectations concerning its business, operating results, financial condition and
other similar matters. These statements represent CION’s belief regarding future events that, by their nature, are uncertain and
outside of CION’s control. There are likely to be events in the future, however, that CION is not able to predict accurately or
control. Any forward-looking statement made by CION in this press release speaks only as of the date on which it is made. Factors or events
that could cause CION’s actual results to differ, possibly materially from its expectations, include, but are not limited to, the
risks, uncertainties and other factors CION identifies in the sections entitled “Risk Factors” and “Forward-Looking
Statements” in filings CION makes with the SEC, and it is not possible for CION to predict or identify all of them. CION undertakes
no obligation to update or revise publicly any forward-looking statements, whether as a result of new information, future events or otherwise,
except as required by law.
OTHER INFORMATION
The information in this press release is summary
information only and should be read in conjunction with CION’s Quarterly Report on Form 10-Q, which CION filed with the SEC on
August 9, 2023, as well as CION’s other reports filed with the SEC. A copy of CION’s Quarterly Report on Form 10-Q and CION’s
other reports filed with the SEC can be found on CION’s website at www.cionbdc.com and the SEC’s website at www.sec.gov.
CONTACTS
Media
Susan Armstrong
sarmstrong@cioninvestments.com
Investor Relations
1-800-343-3736
Analysts and Institutional Investors
James Carbonara
Hayden IR
(646)-755-7412
James@haydenir.com
Exhibit 99.2

CION Investment Corporation Second Quarter 2023 Earnings Presentation
Disclosures and Forward - Looking Statements 2 The information contained in this earnings presentation should be viewed in conjunction with the earnings conference call of CION Investment Corporation (NYSE : CION) (“CION” or the “Company”) held on August 9 , 2023 as well as the Company’s Quarterly Report on Form 10 - Q for the quarter ended June 30 , 2023 that was filed with the Securities and Exchange Commission (the “SEC”) on August 9 , 2023 . The information contained herein may not be used, reproduced or distributed to others, in whole or in part, for any other purpose without the prior written consent of the Company . This earnings presentation may contain forward - looking statements that involve substantial risks and uncertainties, including the impact of inflation, rising interest rates, supply - chain disruptions and the risk of recession on the business, future operating results, access to capital and liquidity of the Company and its portfolio companies . You can identify these statements by the use of forward - looking terminology such as “may,” “will,” “should,” “expect,” “anticipate,” “project,” “target,” “estimate,” “intend,” “continue,” or “believe” or the negatives thereof or other variations thereon or comparable terminology, including references to assumptions, forecasts of future results, shareholder diversification, institutional research coverage and availability and access to capital . You should read statements that contain these words carefully because they discuss the Company’s plans, strategies, prospects and expectations concerning its business, operating results, financial condition and other similar matters . These statements represent the Company’s belief regarding future events that, by their nature, are uncertain and outside of the Company’s control, such as the price at which the Company’s shares of common stock will trade on the NYSE . Any forward - looking statement made by the Company in this earnings presentation speaks only as of the date on which the Company makes it . Factors or events that could cause the Company’s actual results to differ, possibly materially from its expectations, include, but are not limited to, the risks, uncertainties and other factors the Company identifies in the sections entitled “Risk Factors” and “Forward - Looking Statements” in filings the Company makes with the SEC, and it is not possible for the Company to predict or identify all of them . The Company undertakes no obligation to update or revise publicly any forward - looking statements, whether as a result of new information, future events or otherwise, except as required by law . This earnings presentation does not constitute a prospectus and should under no circumstances be understood as an offer to sell or the solicitation of an offer to buy the Company’s common stock or any other securities nor will there be any sale of common stock or any other securities referred to in this earnings presentation in any state or jurisdiction in which such offer, solicitation or sale would be unlawful prior to the registration or qualification under the securities laws of such state or jurisdiction . Nothing in these materials should be construed as a recommendation to invest in any securities that may be issued by the Company or as legal, accounting or tax advice . An investment in securities of the type described herein presents certain risks . The Company is managed by CION Investment Management, LLC, an affiliate of the Company . Nothing contained herein shall be relied upon as a promise or representation whether as to past or future performance . The information contained in this earnings presentation is summary information that is intended to be considered in the context of other public announcements that the Company may make, by press release or otherwise, from time to time . The Company undertakes no duty or obligation to publicly update or revise the information contained in this earnings presentation, except as required by law . These materials contain information about the Company, certain of its personnel and affiliates and its historical performance . You should not view information related to past performance of the Company as indicative of its future results, the achievement of which cannot be assured . Past performance does not guarantee future results, which may vary . The value of investments and the income derived from investments will fluctuate and can go down as well as up . A loss of principal may occur .
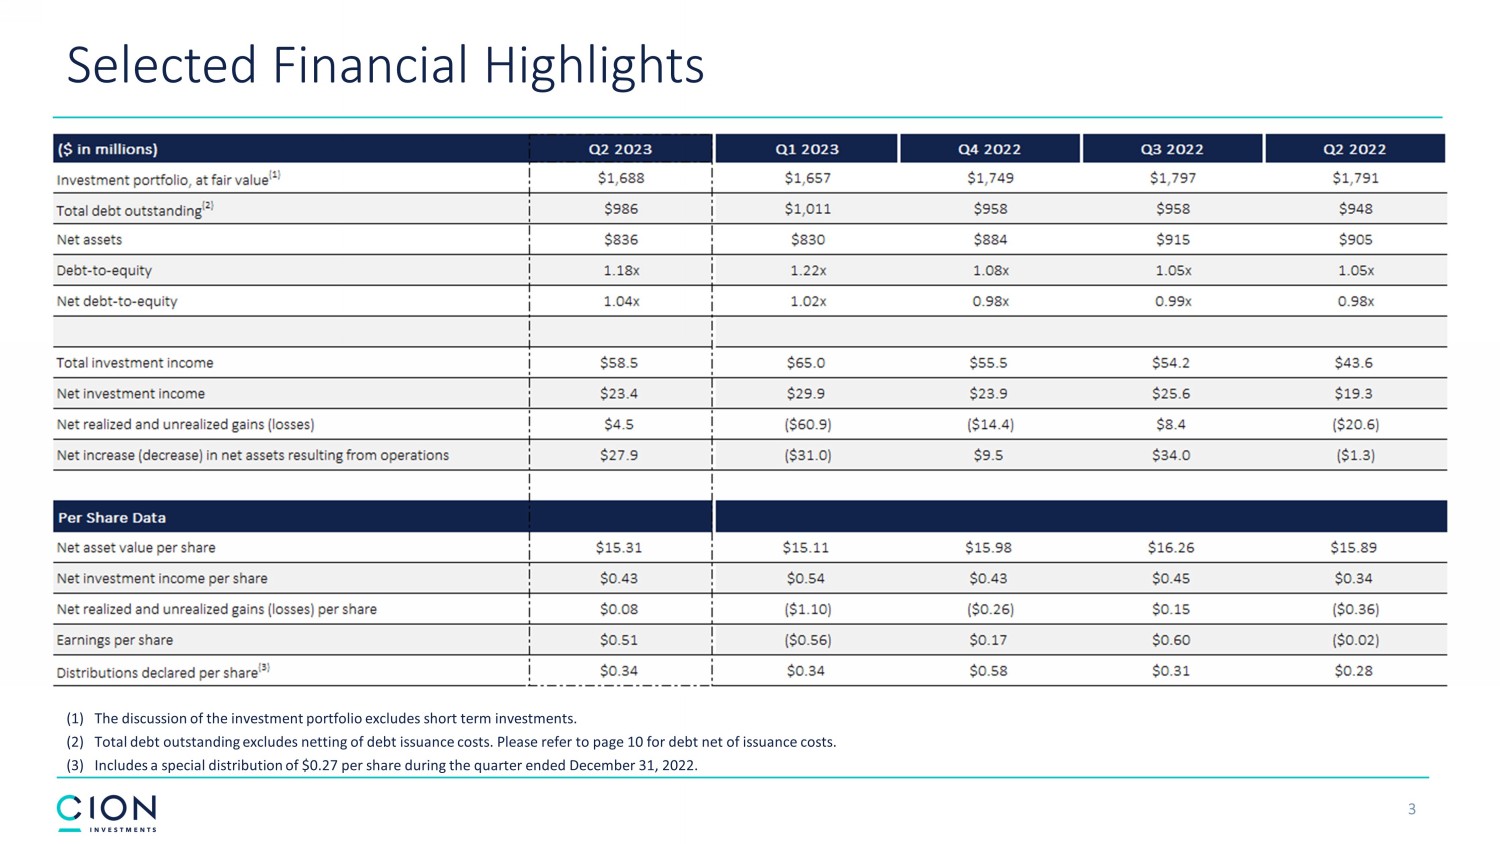
3 Selected Financial Highlights (1) The discussion of the investment portfolio excludes short term investments. (2) Total debt outstanding excludes netting of debt issuance costs. Please refer to page 10 for debt net of issuance costs . (3) Includes a special distribution of $0.27 per share during the quarter ended December 31, 2022.
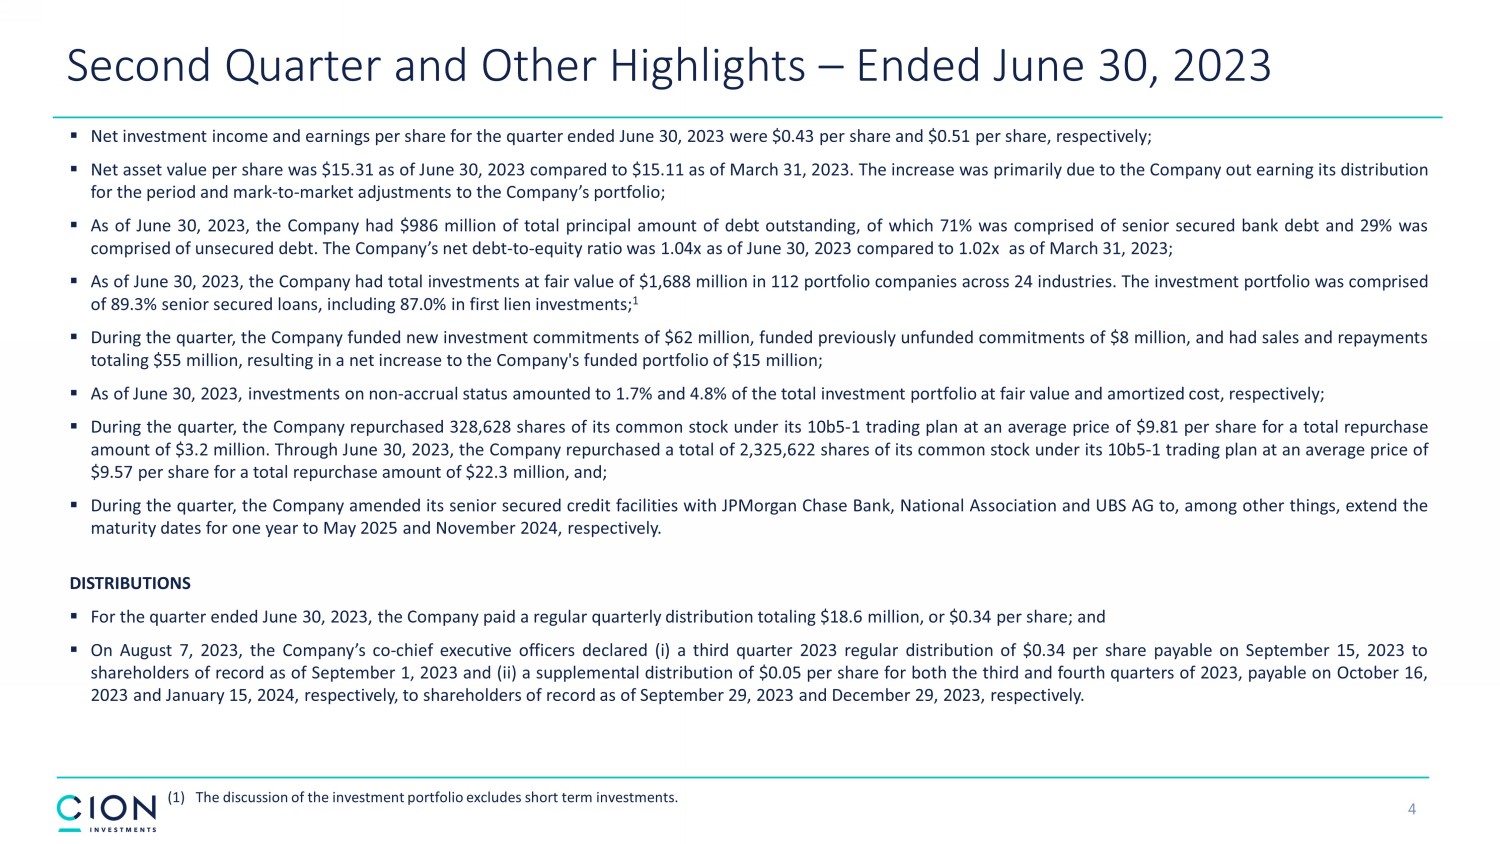
4 (1) The discussion of the investment portfolio excludes short term investments. Second Quarter and Other Highlights – Ended June 30, 2023 ▪ Net investment income and earnings per share for the quarter ended June 30 , 2023 were $ 0 . 43 per share and $ 0 . 51 per share, respectively ; ▪ Net asset value per share was $ 15 . 31 as of June 30 , 2023 compared to $ 15 . 11 as of March 31 , 2023 . The increase was primarily due to the Company out earning its distribution for the period and mark - to - market adjustments to the Company’s portfolio ; ▪ As of June 30 , 2023 , the Company had $ 986 million of total principal amount of debt outstanding, of which 71 % was comprised of senior secured bank debt and 29 % was comprised of unsecured debt . The Company’s net debt - to - equity ratio was 1 . 04 x as of June 30 , 2023 compared to 1 . 02 x as of March 31 , 2023 ; ▪ As of June 30 , 2023 , the Company had total investments at fair value of $ 1 , 688 million in 112 portfolio companies across 24 industries . The investment portfolio was comprised of 89 . 3 % senior secured loans, including 87 . 0 % in first lien investments ; 1 ▪ During the quarter, the Company funded new investment commitments of $ 62 million, funded previously unfunded commitments of $ 8 million, and had sales and repayments totaling $ 55 million, resulting in a net increase to the Company's funded portfolio of $ 15 million ; ▪ As of June 30 , 2023 , investments on non - accrual status amounted to 1 . 7 % and 4 . 8 % of the total investment portfolio at fair value and amortized cost, respectively ; ▪ During the quarter, the Company repurchased 328 , 628 shares of its common stock under its 10 b 5 - 1 trading plan at an average price of $ 9 . 81 per share for a total repurchase amount of $ 3 . 2 million . Through June 30 , 2023 , the Company repurchased a total of 2 , 325 , 622 shares of its common stock under its 10 b 5 - 1 trading plan at an average price of $ 9 . 57 per share for a total repurchase amount of $ 22 . 3 million, and ; ▪ During the quarter, the Company amended its senior secured credit facilities with JPMorgan Chase Bank, National Association and UBS AG to, among other things, extend the maturity dates for one year to May 2025 and November 2024 , respectively . DISTRIBUTIONS ▪ For the quarter ended June 30 , 2023 , the Company paid a regular quarterly distribution totaling $ 18 . 6 million, or $ 0 . 34 per share ; and ▪ On August 7 , 2023 , the Company’s co - chief executive officers declared (i) a third quarter 2023 regular distribution of $ 0 . 34 per share payable on September 15 , 2023 to shareholders of record as of September 1 , 2023 and (ii) a supplemental distribution of $ 0 . 05 per share for both the third and fourth quarters of 2023 , payable on October 16 , 2023 and January 15 , 2024 , respectively, to shareholders of record as of September 29 , 2023 and December 29 , 2023 , respectively .
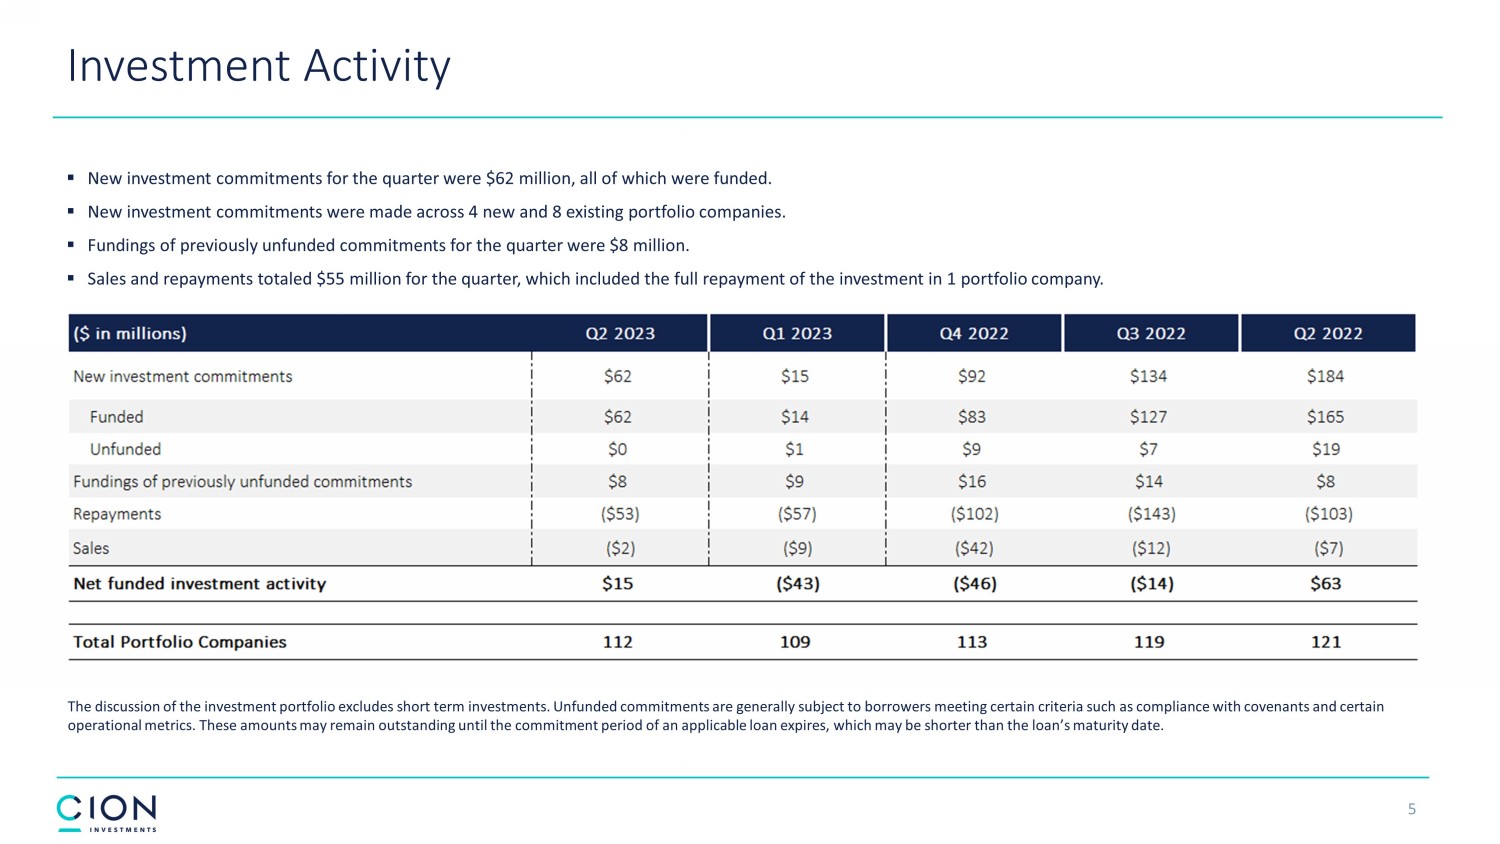
Investment Activity ▪ New investment commitments for the quarter were $62 million, all of which were funded. ▪ New investment commitments were made across 4 new and 8 existing portfolio companies. ▪ Fundings of previously unfunded commitments for the quarter were $8 million. ▪ Sales and repayments totaled $55 million for the quarter, which included the full repayment of the investment in 1 portfolio com pany. The discussion of the investment portfolio excludes short term investments. Unfunded c ommitments are generally subject to borrowers meeting certain criteria such as compliance with covenants and certain operational metrics. These amounts may remain outstanding until the commitment period of an applicable loan expires, which ma y b e shorter than the loan’s maturity date. 5
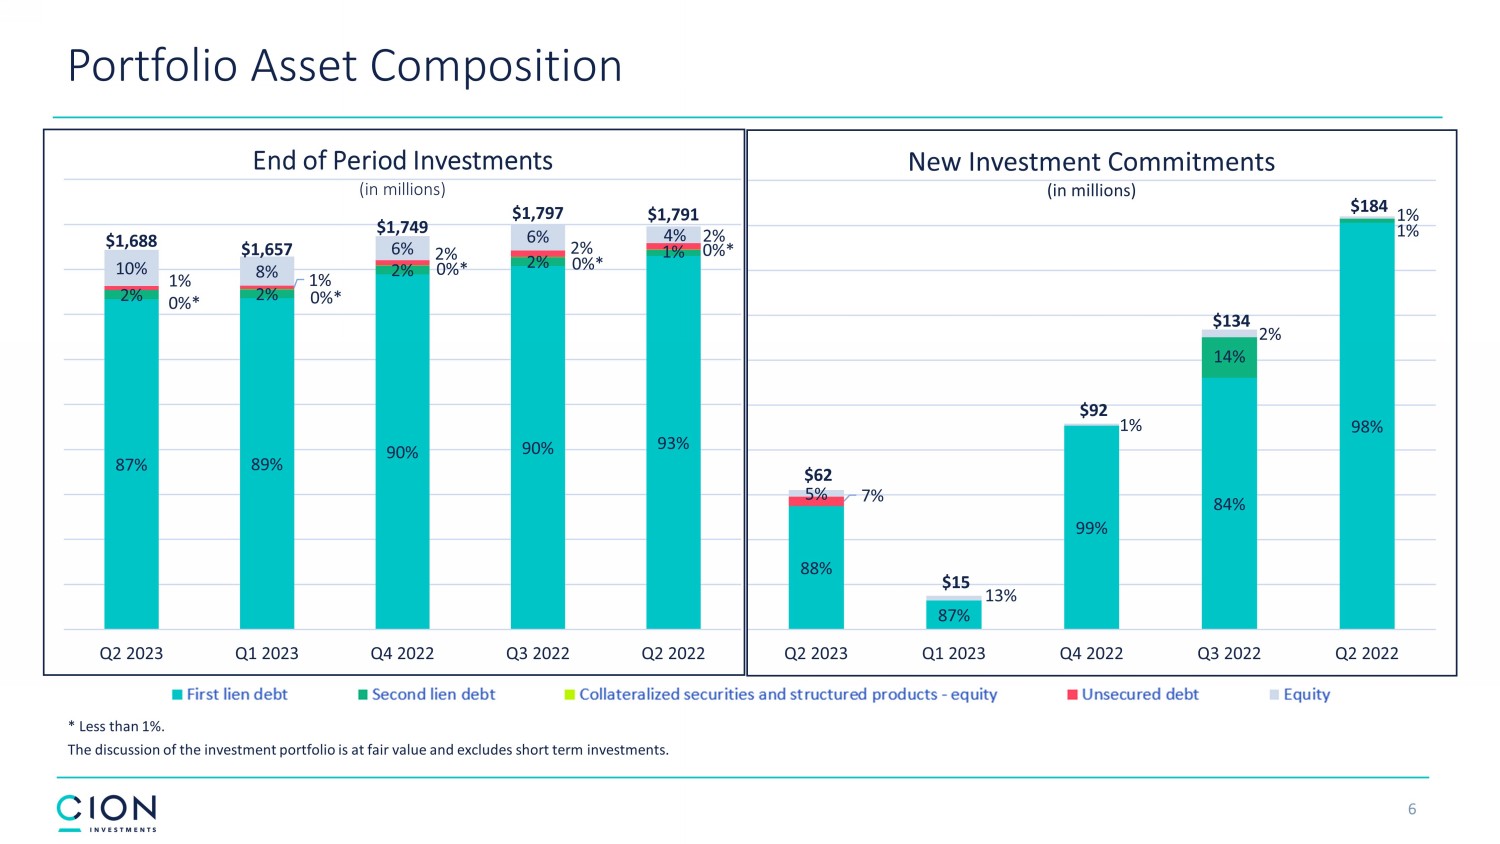
6 Portfolio Asset Composition 87% 89% 90% 90% 93% 2% 2% 2% 2% 1% 0% * 0% * 0% * 0% * 0% * 1% 1% 2% 2% 2% 10% 8% 6% 6% 4% $1,688 $1,657 $1,749 $1,797 $1,791 Q2 2023 Q1 2023 Q4 2022 Q3 2022 Q2 2022 End of Period Investments (in millions) * Less than 1%. The discussion of the investment portfolio is at fair value and excludes short term investments. 88% 87% 99% 84% 98% 14% 1% 7% 5% 13% 1% 2% 1% $62 $15 $92 $134 $184 Q2 2023 Q1 2023 Q4 2022 Q3 2022 Q2 2022 New Investment Commitments (in millions)
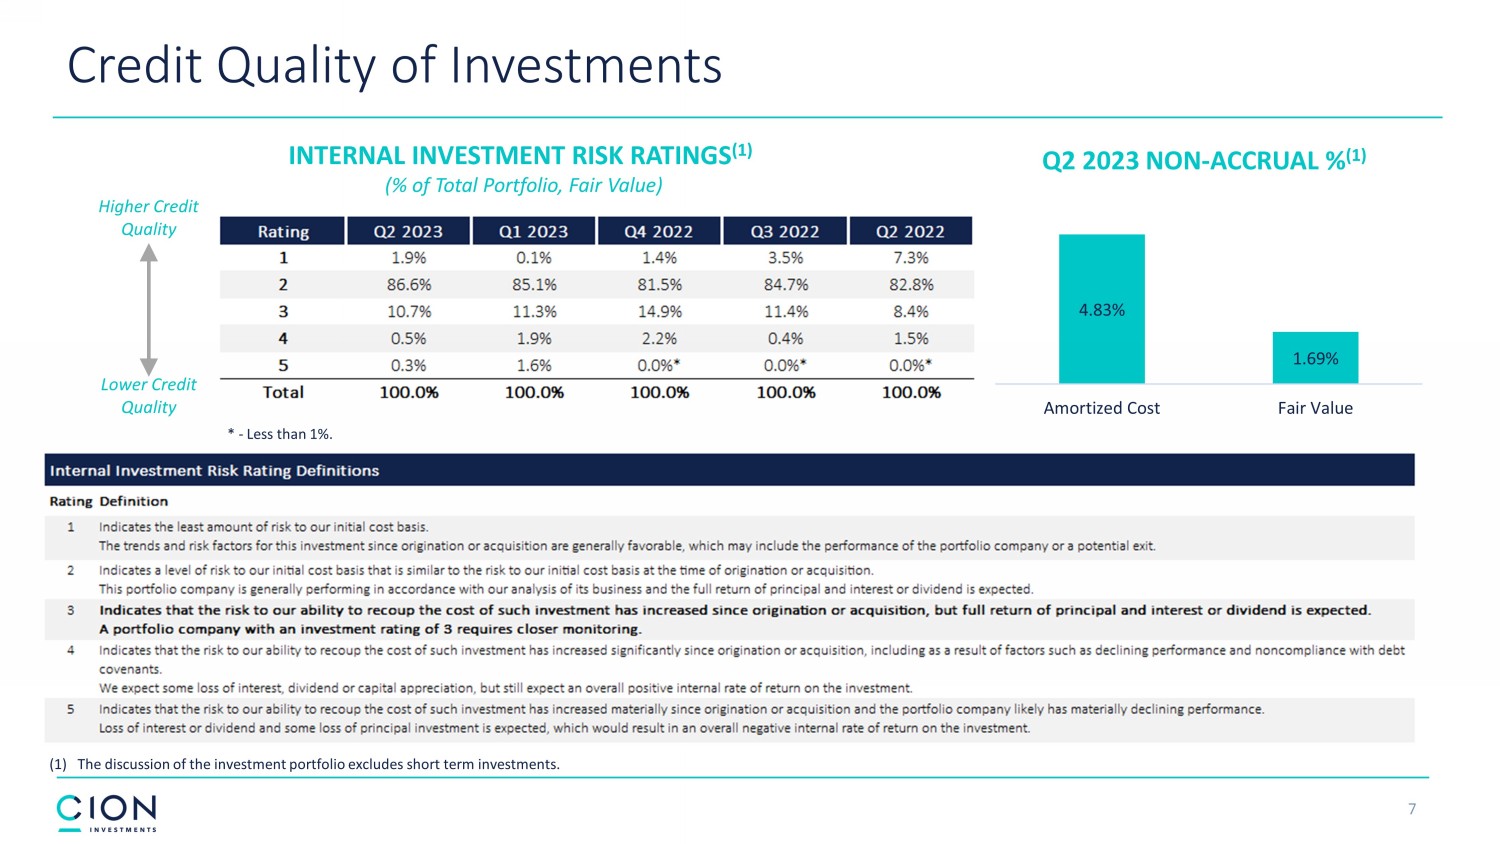
7 INTERNAL INVESTMENT RISK RATINGS (1) (% of Total Portfolio, Fair Value) Q2 2023 NON - ACCRUAL % (1) Higher Credit Quality Lower Credit Quality Credit Quality of Investments 4.83% 1.69% Amortized Cost Fair Value (1) The discussion of the investment portfolio excludes short term investments. * - Less than 1%.
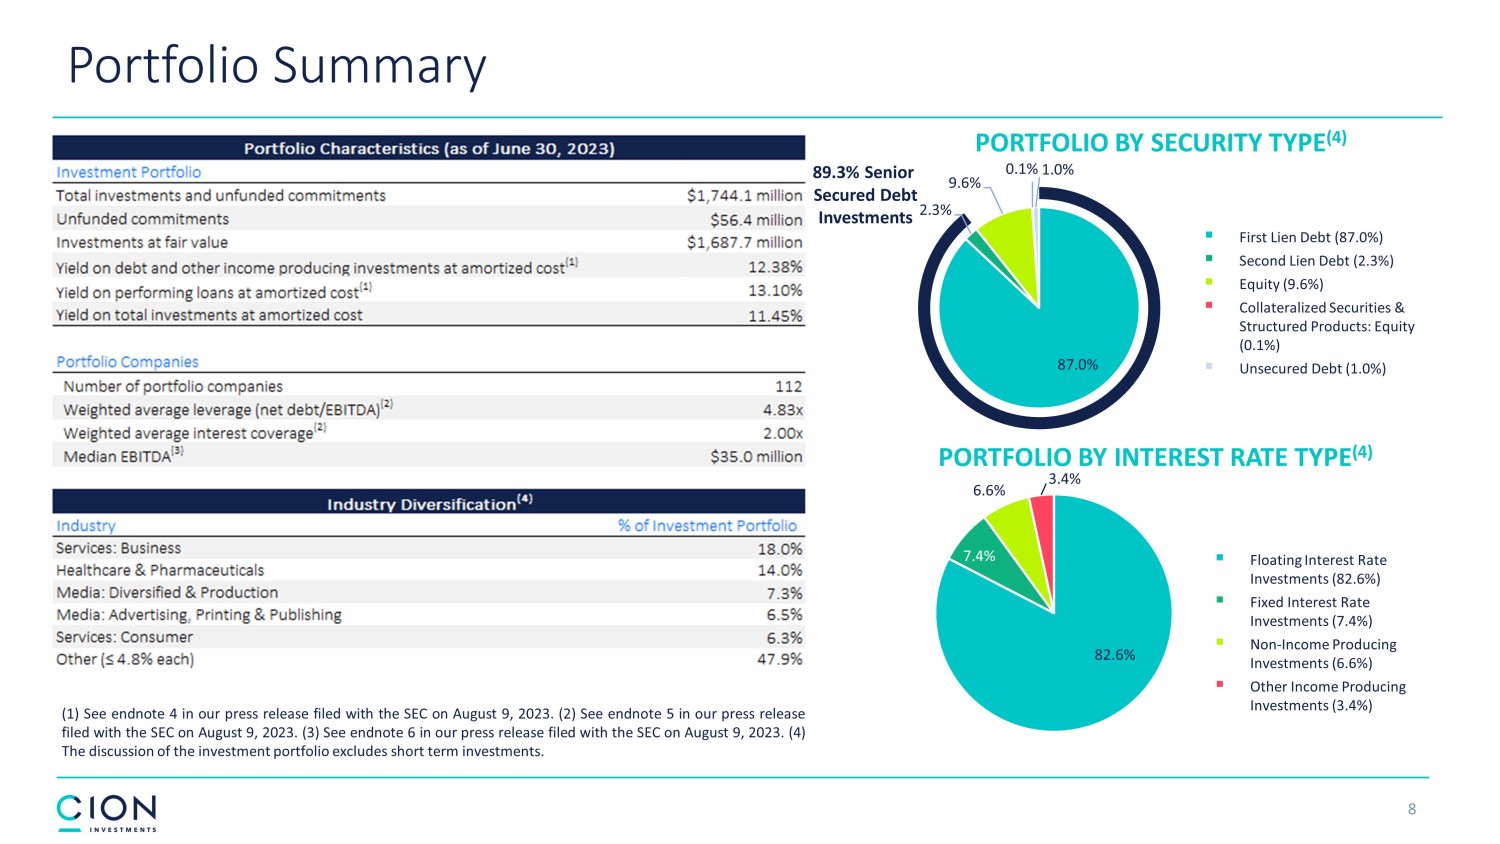
89.3% Senior Secured Debt Investments PORTFOLIO BY SECURITY TYPE (4) PORTFOLIO BY INTEREST RATE TYPE (4) 87.0% 2.3% 9.6% 0.1% 1.0% ▪ First Lien Debt (87.0%) ▪ Second Lien Debt (2.3%) ▪ Equity (9.6%) ▪ Collateralized Securities & Structured Products: Equity (0.1%) ▪ Unsecured Debt (1.0%) ▪ Floating Interest Rate Investments (82.6%) ▪ Fixed Interest Rate Investments (7.4%) ▪ Non - Income Producing Investments (6.6%) ▪ Other Income Producing Investments (3.4%) Portfolio Summary 8 ( 1 ) See endnote 4 in our press release filed with the SEC on August 9 , 2023 . ( 2 ) See endnote 5 in our press release filed with the SEC on August 9 , 2023 . ( 3 ) See endnote 6 in our press release filed with the SEC on August 9 , 2023 . ( 4 ) The discussion of the investment portfolio excludes short term investments . 82.6% 7.4% 6.6% 3.4%
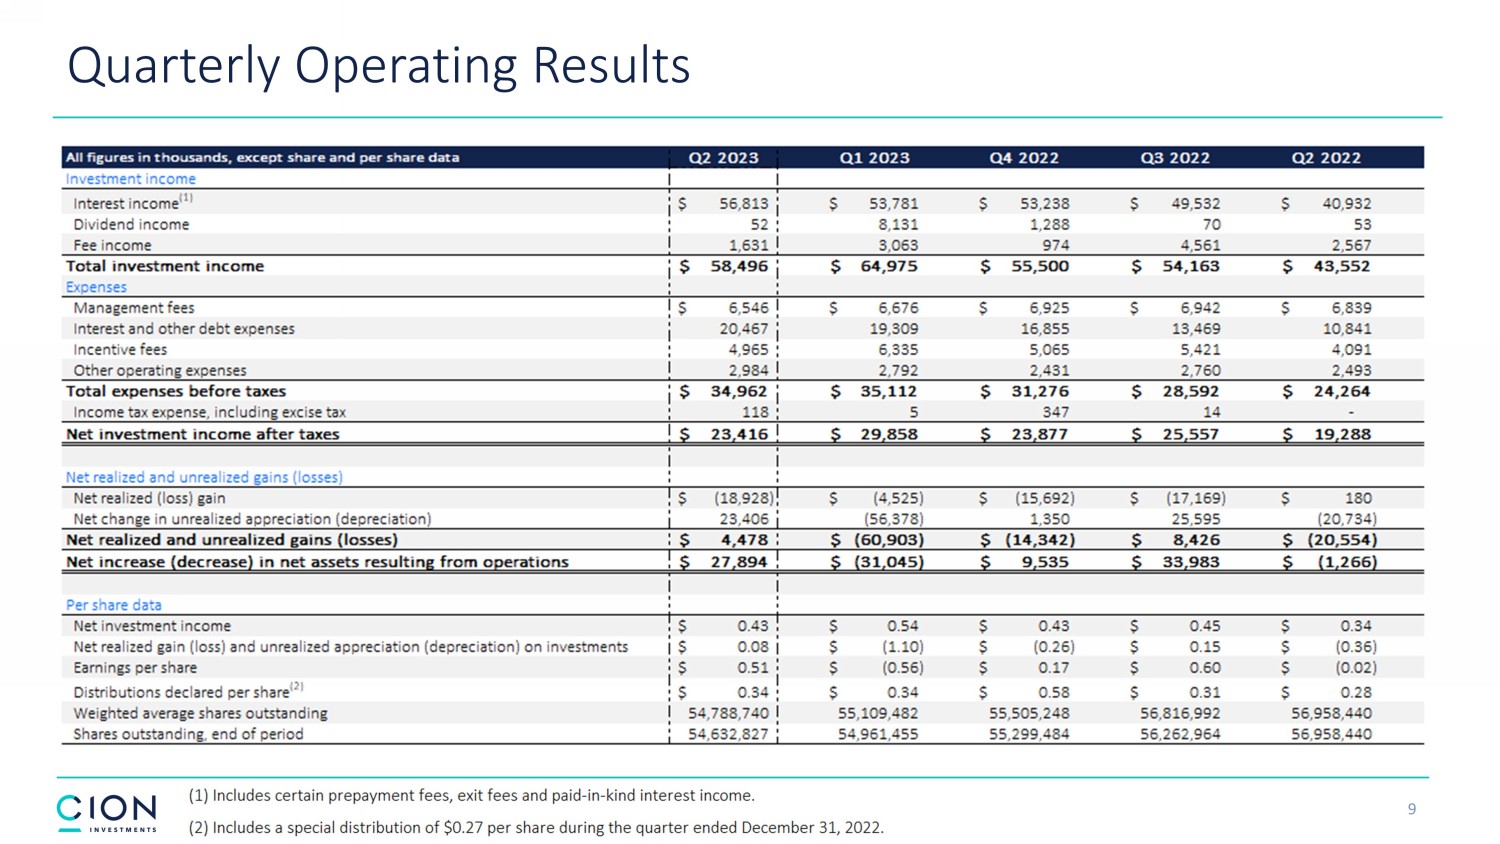
Quarterly Operating Results 9
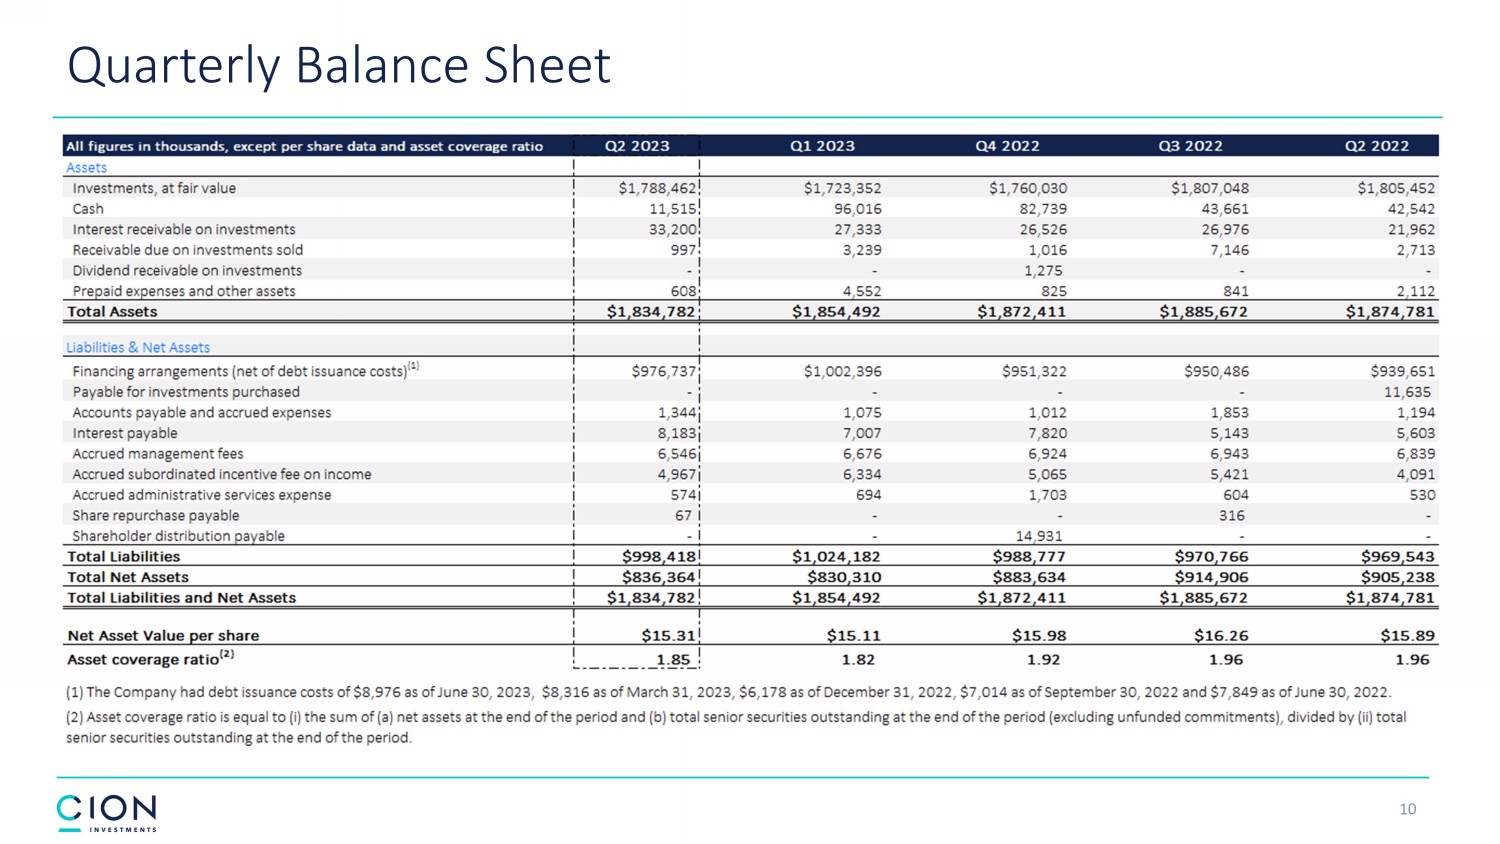
Quarterly Balance Sheet 10
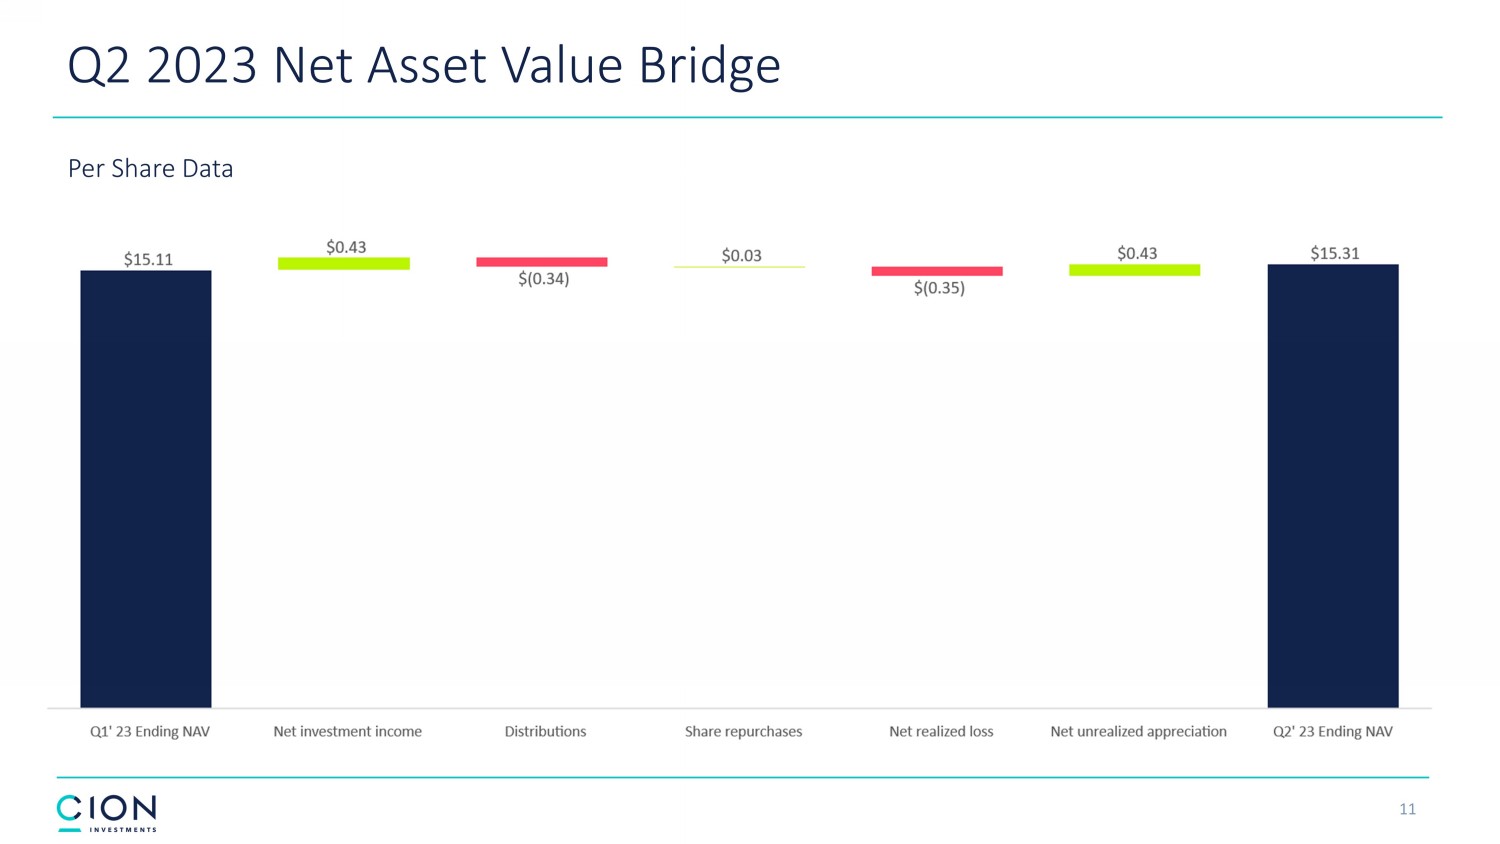
11 Q2 2023 Net Asset Value Bridge Per Share Data
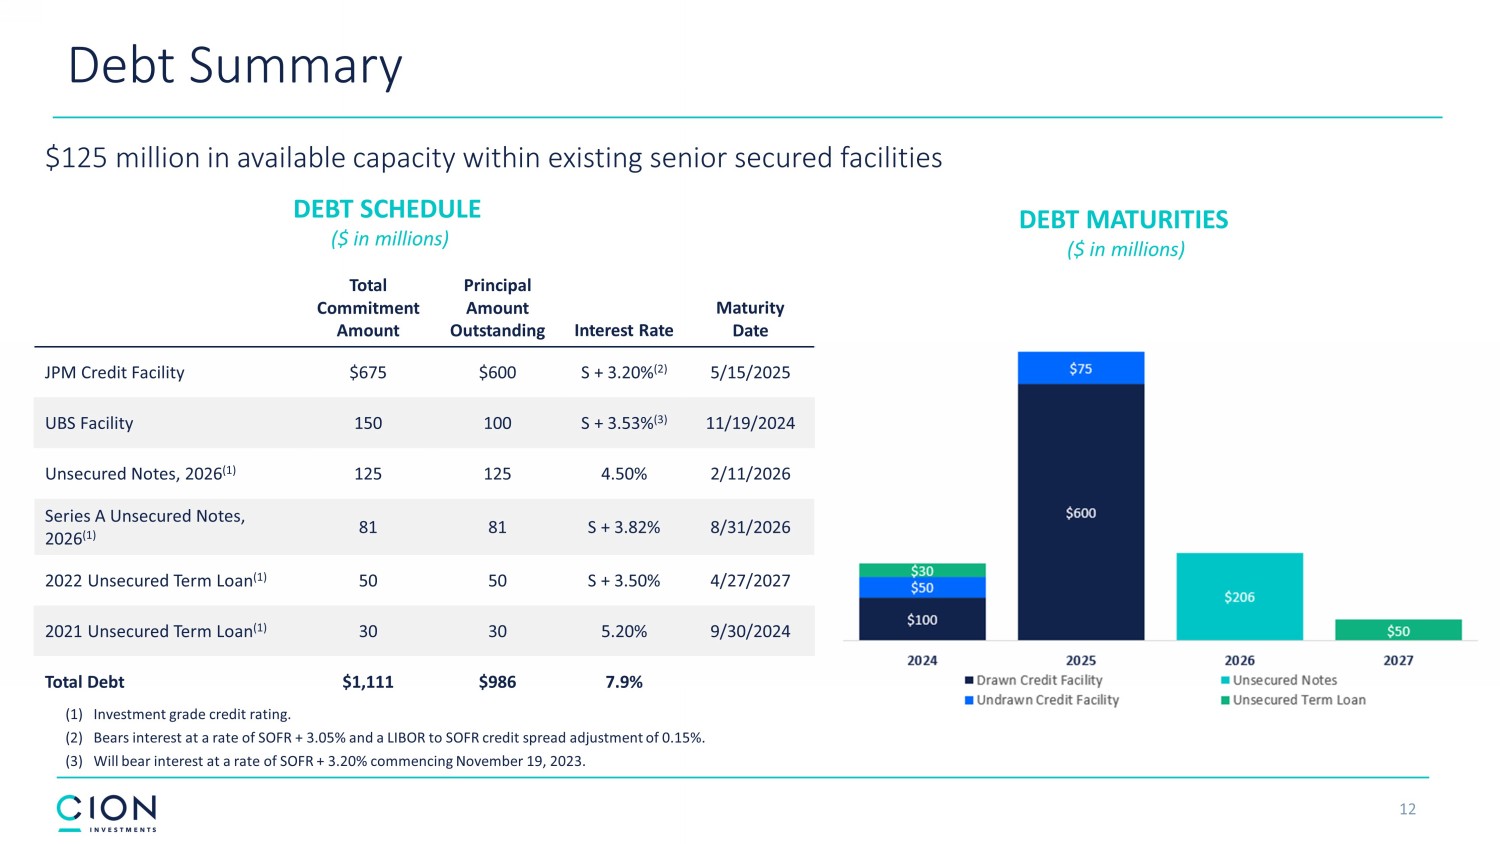
12 Total Commitment Amount Principal Amount Outstanding Interest Rate Maturity Date JPM Credit Facility $675 $600 S + 3.20% (2) 5/15/2025 UBS Facility 150 100 S + 3.53% (3) 11/19/2024 Unsecured Notes, 2026 (1) 125 125 4.50% 2/11/2026 Series A Unsecured Notes, 2026 (1) 81 81 S + 3.82% 8/31/2026 2022 Unsecured Term Loan (1) 50 50 S + 3.50% 4/27/2027 2021 Unsecured Term Loan (1) 30 30 5.20% 9/30/2024 Total Debt $1,111 $986 7.9% Debt Summary DEBT MATURITIES ($ in millions) DEBT SCHEDULE ($ in millions) $125 million in available capacity within existing senior secured facilities (1) Investment grade credit rating. (2) Bears interest at a rate of SOFR + 3.05% and a LIBOR to SOFR credit spread adjustment of 0.15%. (3) Will bear interest at a rate of SOFR + 3.20% commencing November 19, 2023.
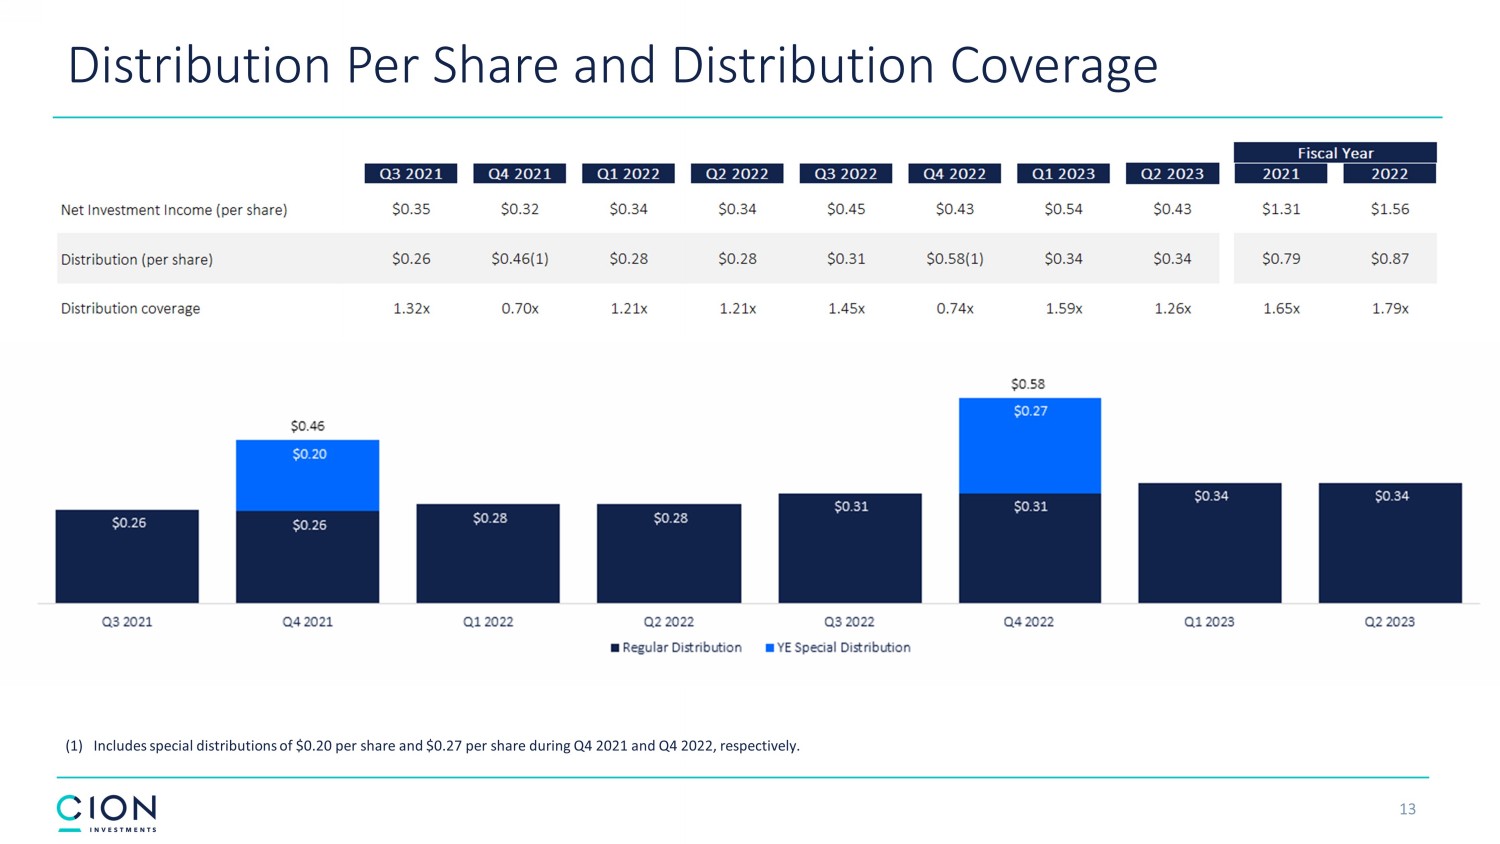
13 Distribution Per Share and Distribution Coverage 1 (1) Includes special distributions of $0.20 per share and $0.27 per share during Q4 2021 and Q4 2022, respectively.

v3.23.2
| X |
- DefinitionBoolean flag that is true when the XBRL content amends previously-filed or accepted submission.
| Name: |
dei_AmendmentFlag |
| Namespace Prefix: |
dei_ |
| Data Type: |
xbrli:booleanItemType |
| Balance Type: |
na |
| Period Type: |
duration |
|
| X |
- DefinitionFor the EDGAR submission types of Form 8-K: the date of the report, the date of the earliest event reported; for the EDGAR submission types of Form N-1A: the filing date; for all other submission types: the end of the reporting or transition period. The format of the date is YYYY-MM-DD.
| Name: |
dei_DocumentPeriodEndDate |
| Namespace Prefix: |
dei_ |
| Data Type: |
xbrli:dateItemType |
| Balance Type: |
na |
| Period Type: |
duration |
|
| X |
- DefinitionThe type of document being provided (such as 10-K, 10-Q, 485BPOS, etc). The document type is limited to the same value as the supporting SEC submission type, or the word 'Other'.
| Name: |
dei_DocumentType |
| Namespace Prefix: |
dei_ |
| Data Type: |
dei:submissionTypeItemType |
| Balance Type: |
na |
| Period Type: |
duration |
|
| X |
- DefinitionAddress Line 1 such as Attn, Building Name, Street Name
| Name: |
dei_EntityAddressAddressLine1 |
| Namespace Prefix: |
dei_ |
| Data Type: |
xbrli:normalizedStringItemType |
| Balance Type: |
na |
| Period Type: |
duration |
|
| X |
- DefinitionAddress Line 2 such as Street or Suite number
| Name: |
dei_EntityAddressAddressLine2 |
| Namespace Prefix: |
dei_ |
| Data Type: |
xbrli:normalizedStringItemType |
| Balance Type: |
na |
| Period Type: |
duration |
|
| X |
- Definition
+ References
+ Details
| Name: |
dei_EntityAddressCityOrTown |
| Namespace Prefix: |
dei_ |
| Data Type: |
xbrli:normalizedStringItemType |
| Balance Type: |
na |
| Period Type: |
duration |
|
| X |
- DefinitionCode for the postal or zip code
| Name: |
dei_EntityAddressPostalZipCode |
| Namespace Prefix: |
dei_ |
| Data Type: |
xbrli:normalizedStringItemType |
| Balance Type: |
na |
| Period Type: |
duration |
|
| X |
- DefinitionName of the state or province.
| Name: |
dei_EntityAddressStateOrProvince |
| Namespace Prefix: |
dei_ |
| Data Type: |
dei:stateOrProvinceItemType |
| Balance Type: |
na |
| Period Type: |
duration |
|
| X |
- DefinitionA unique 10-digit SEC-issued value to identify entities that have filed disclosures with the SEC. It is commonly abbreviated as CIK. Reference 1: http://www.xbrl.org/2003/role/presentationRef
-Publisher SEC
-Name Exchange Act
-Number 240
-Section 12
-Subsection b-2
| Name: |
dei_EntityCentralIndexKey |
| Namespace Prefix: |
dei_ |
| Data Type: |
dei:centralIndexKeyItemType |
| Balance Type: |
na |
| Period Type: |
duration |
|
| X |
- DefinitionIndicate if registrant meets the emerging growth company criteria. Reference 1: http://www.xbrl.org/2003/role/presentationRef
-Publisher SEC
-Name Exchange Act
-Number 240
-Section 12
-Subsection b-2
| Name: |
dei_EntityEmergingGrowthCompany |
| Namespace Prefix: |
dei_ |
| Data Type: |
xbrli:booleanItemType |
| Balance Type: |
na |
| Period Type: |
duration |
|
| X |
- DefinitionCommission file number. The field allows up to 17 characters. The prefix may contain 1-3 digits, the sequence number may contain 1-8 digits, the optional suffix may contain 1-4 characters, and the fields are separated with a hyphen.
| Name: |
dei_EntityFileNumber |
| Namespace Prefix: |
dei_ |
| Data Type: |
dei:fileNumberItemType |
| Balance Type: |
na |
| Period Type: |
duration |
|
| X |
- DefinitionTwo-character EDGAR code representing the state or country of incorporation.
| Name: |
dei_EntityIncorporationStateCountryCode |
| Namespace Prefix: |
dei_ |
| Data Type: |
dei:edgarStateCountryItemType |
| Balance Type: |
na |
| Period Type: |
duration |
|
| X |
- DefinitionThe exact name of the entity filing the report as specified in its charter, which is required by forms filed with the SEC. Reference 1: http://www.xbrl.org/2003/role/presentationRef
-Publisher SEC
-Name Exchange Act
-Number 240
-Section 12
-Subsection b-2
| Name: |
dei_EntityRegistrantName |
| Namespace Prefix: |
dei_ |
| Data Type: |
xbrli:normalizedStringItemType |
| Balance Type: |
na |
| Period Type: |
duration |
|
| X |
- DefinitionThe Tax Identification Number (TIN), also known as an Employer Identification Number (EIN), is a unique 9-digit value assigned by the IRS. Reference 1: http://www.xbrl.org/2003/role/presentationRef
-Publisher SEC
-Name Exchange Act
-Number 240
-Section 12
-Subsection b-2
| Name: |
dei_EntityTaxIdentificationNumber |
| Namespace Prefix: |
dei_ |
| Data Type: |
dei:employerIdItemType |
| Balance Type: |
na |
| Period Type: |
duration |
|
| X |
- DefinitionLocal phone number for entity.
| Name: |
dei_LocalPhoneNumber |
| Namespace Prefix: |
dei_ |
| Data Type: |
xbrli:normalizedStringItemType |
| Balance Type: |
na |
| Period Type: |
duration |
|
| X |
- DefinitionBoolean flag that is true when the Form 8-K filing is intended to satisfy the filing obligation of the registrant as pre-commencement communications pursuant to Rule 13e-4(c) under the Exchange Act. Reference 1: http://www.xbrl.org/2003/role/presentationRef
-Publisher SEC
-Name Exchange Act
-Number 240
-Section 13e
-Subsection 4c
| Name: |
dei_PreCommencementIssuerTenderOffer |
| Namespace Prefix: |
dei_ |
| Data Type: |
xbrli:booleanItemType |
| Balance Type: |
na |
| Period Type: |
duration |
|
| X |
- DefinitionBoolean flag that is true when the Form 8-K filing is intended to satisfy the filing obligation of the registrant as pre-commencement communications pursuant to Rule 14d-2(b) under the Exchange Act. Reference 1: http://www.xbrl.org/2003/role/presentationRef
-Publisher SEC
-Name Exchange Act
-Number 240
-Section 14d
-Subsection 2b
| Name: |
dei_PreCommencementTenderOffer |
| Namespace Prefix: |
dei_ |
| Data Type: |
xbrli:booleanItemType |
| Balance Type: |
na |
| Period Type: |
duration |
|
| X |
- DefinitionTitle of a 12(b) registered security. Reference 1: http://www.xbrl.org/2003/role/presentationRef
-Publisher SEC
-Name Exchange Act
-Number 240
-Section 12
-Subsection b
| Name: |
dei_Security12bTitle |
| Namespace Prefix: |
dei_ |
| Data Type: |
dei:securityTitleItemType |
| Balance Type: |
na |
| Period Type: |
duration |
|
| X |
- DefinitionName of the Exchange on which a security is registered. Reference 1: http://www.xbrl.org/2003/role/presentationRef
-Publisher SEC
-Name Exchange Act
-Number 240
-Section 12
-Subsection d1-1
| Name: |
dei_SecurityExchangeName |
| Namespace Prefix: |
dei_ |
| Data Type: |
dei:edgarExchangeCodeItemType |
| Balance Type: |
na |
| Period Type: |
duration |
|
| X |
- DefinitionBoolean flag that is true when the Form 8-K filing is intended to satisfy the filing obligation of the registrant as soliciting material pursuant to Rule 14a-12 under the Exchange Act. Reference 1: http://www.xbrl.org/2003/role/presentationRef
-Publisher SEC
-Name Exchange Act
-Section 14a
-Number 240
-Subsection 12
| Name: |
dei_SolicitingMaterial |
| Namespace Prefix: |
dei_ |
| Data Type: |
xbrli:booleanItemType |
| Balance Type: |
na |
| Period Type: |
duration |
|
| X |
- DefinitionTrading symbol of an instrument as listed on an exchange.
| Name: |
dei_TradingSymbol |
| Namespace Prefix: |
dei_ |
| Data Type: |
dei:tradingSymbolItemType |
| Balance Type: |
na |
| Period Type: |
duration |
|
| X |
- DefinitionBoolean flag that is true when the Form 8-K filing is intended to satisfy the filing obligation of the registrant as written communications pursuant to Rule 425 under the Securities Act. Reference 1: http://www.xbrl.org/2003/role/presentationRef
-Publisher SEC
-Name Securities Act
-Number 230
-Section 425
| Name: |
dei_WrittenCommunications |
| Namespace Prefix: |
dei_ |
| Data Type: |
xbrli:booleanItemType |
| Balance Type: |
na |
| Period Type: |
duration |
|
CION Investment (NYSE:CION)
Gráfica de Acción Histórica
De Abr 2024 a May 2024

CION Investment (NYSE:CION)
Gráfica de Acción Histórica
De May 2023 a May 2024
