Form 8-K - Current report
10 Mayo 2024 - 3:31PM
Edgar (US Regulatory)
false
0001595527
0001595527
2024-05-10
2024-05-10
0001595527
us-gaap:CommonStockMember
2024-05-10
2024-05-10
0001595527
us-gaap:RightsMember
2024-05-10
2024-05-10
iso4217:USD
xbrli:shares
iso4217:USD
xbrli:shares
UNITED STATES
SECURITIES AND EXCHANGE COMMISSION
Washington,
D.C. 20549
FORM 8-K
CURRENT
REPORT
PURSUANT TO SECTION 13 OR 15(d) OF THE
Securities
Exchange Act of 1934
Date of Report (Date of earliest event
reported): May 10, 2024
American Strategic Investment Co.
(Exact Name of Registrant as Specified in Charter)
Maryland |
|
001-39448 |
|
46-4380248 |
(State or other jurisdiction
of incorporation) |
|
(Commission File Number) |
|
(I.R.S. Employer
Identification No.) |
| |
|
|
|
|
222
Bellevue Ave,
Newport, Rhode Island 02840 |
(Address, including zip code, of Principal
Executive Offices) |
| |
| Registrant’s telephone number, including area code: (212)
415-6500 |
Check the appropriate box below if the Form 8-K
filing is intended to simultaneously satisfy the filing obligation of the registrant under any of the following provisions:
| ¨ | Written
communications pursuant to Rule 425 under the Securities Act (17 CFR 230.425) |
| ¨ | Soliciting
material pursuant to Rule 14a-12 under the Exchange Act (17 CFR 240.14a-12) |
| ¨ | Pre-commencement
communications pursuant to Rule 14d-2(b) under the Exchange Act (17 CFR 240.14d-2(b)) |
| ¨ | Pre-commencement
communications pursuant to Rule 13e-4(c) under the Exchange Act (17 CFR 240.13e-4(c)) |
Securities registered pursuant to Section 12(b)
of the Act:
Title
of each class: |
|
Trading
Symbol(s) |
|
Name
of each exchange on which
registered |
| Class
A common stock, $0.01 par value per share |
|
NYC |
|
New
York Stock Exchange |
| Class
A Preferred Stock Purchase Rights |
|
true |
|
New
York Stock Exchange |
Indicate by check mark whether the registrant
is an emerging growth company as defined in Rule 405 of the Securities Act of 1933 (§230.405 of this chapter) or Rule 12b-2 of the
Securities Exchange Act of 1934 (§240.12b-2 of this chapter).
Emerging growth company ¨
If an emerging growth company, indicate by check
mark if the registrant has elected not to use the extended transition period for complying with any new or revised financial accounting
standards provided pursuant to Section 13(a) of the Exchange Act. ¨
Common
Stock [Member]
Item 7.01 Regulation FD Disclosure.
Investor Presentation
On May 10, 2024 American
Strategic Investment Co. (the “Company”) prepared an investor presentation that officers and other representatives of the
Company intend to present at conferences and meetings. A copy of the investor presentation is furnished as Exhibit 99.1 to this Current
Report on Form 8-K.
The
information contained in this Current Report on Form 8-K, including Exhibit 99.1 furnished herewith, shall not be deemed “filed”
for purposes of Section 18 of the Securities Exchange Act of 1934, as amended (the “Exchange Act”), or otherwise subject to
the liabilities of that Section and shall not be deemed incorporated by reference in any filing under the Securities Act of 1933, as amended,
or the Exchange Act, except as shall be expressly set forth by specific reference in such a filing.
The
statements in this Current Report on Form 8-K, including in the investor presentation furnished as Exhibit 99.1 hereto, that
are not historical facts may be forward-looking statements. These forward-looking statements involve risks and uncertainties that could
cause actual results or events to be materially different. The words “may,” “will,” “seeks,” “anticipates,”
“believes,” “expects,” “estimates,” “projects,” “plans,” “intends,”
“should” and similar expressions are intended to identify forward-looking statements, although not all forward-looking statements
contain these identifying words. These forward-looking statements are subject to a number of risks, uncertainties and other factors, many
of which are outside of the Company’s control, which could cause actual results to differ materially from the results contemplated
by the forward-looking statements. These risks and uncertainties include (a) the anticipated benefits of the Company’s election
to terminate its status as a real estate investment trust, (b) whether the Company will be able to successfully acquire new assets or
businesses, (c) the potential adverse effects of the geopolitical instability due to the ongoing military conflict between Russia and
Ukraine and Israel and Hamas, including related sanctions and other penalties imposed by the U.S. and European Union, and the related
impact on the Company, the Company’s tenants, and the global economy and financial markets, (d) the potential adverse effects of
inflationary conditions and higher interest rate environment, (e) that any potential future acquisition is subject to market conditions
and capital availability and may not be completed on favorable terms, or at all, and (f) the Company may not be able to continue to meet
the New York Stock Exchange's (“NYSE”) continued listing requirements and rules, and the NYSE may delist the Company's common
stock, which could negatively affect the Company, the price of the Company's common stock and the Company's shareholders' ability to sell
the Company's common stock, as well as those risks and uncertainties set forth in the Risk Factors section of the Company’s Annual
Report on Form 10-K for the year ended December 31, 2023 filed on April 1, 2024 and all other filings with the Securities and Exchange
Commission after that date including but not limited to the subsequent Quarterly Reports on Form 10-Q and Current Reports on Form 8-K,
as such risks, uncertainties and other important factors may be updated from time to time in the Company’s subsequent reports. Further,
forward-looking statements speak only as of the date they are made, and the Company undertakes no obligation to update or revise any forward-looking
statement to reflect changed assumptions, the occurrence of unanticipated events or changes to future operating results, unless required
to do so by law.
Item
9.01 Financial Statements and Exhibits.
(d)
| Exhibit No |
|
Description |
| 99.1 |
|
Investor Presentation |
| 104 |
|
Cover Page Interactive Data File (embedded within the Inline XBRL document) |
SIGNATURES
Pursuant to the requirements
of the Securities Exchange Act of 1934, the registrant has duly caused this report to be signed on its behalf by the undersigned hereunto
duly authorized.
| |
American Strategic Investment Co. |
| |
|
|
| Date: May 10, 2024 |
By: |
/s/ Michael Anderson |
| |
|
Michael Anderson |
| |
|
Chief Executive Officer |
Exhibit 99.1

| 0
AMERICAN STRATEGIC INVESTMENT CO.
First Quarter Investor Presentation
9 Times Square - New York, NY_ |
| 1
First Quarter 2024 Highlights
1) See appendix for a full description of capitalized terms and Non-GAAP reconciliations.
2) Refer to slide 7 – Top 10 Tenant Investment Grade Profile. Based on Annualized Straight-line Rent and on ratings information as of March 31, 2024. For our purposes, includes both actual investment grade ratings of the tenant or guarantor, if available, or implied investment grade ratings, which includes
ratings of the tenant’s parent (regardless of whether the parent has guaranteed the tenant’s obligation under the lease) or lease guarantor. See appendix for a full definition of Investment Grade. ASIC’s top 10 tenants are 61% actual Investment Grade (“IG”) rated and 20% implied Investment Grade.
3) Refer to slide 8 – Active Portfolio Management for additional information.
4) Refer to slide 10 – Capital Structure and Q1’24 Financial Results for further information regarding our capital structure and liquidity.
5) Based on Annualized Straight-Line Rent as of March 31, 2024.
6) In October 2024, the $49.5 million loan at 9 Times Square matures. The Company has an option to extend the maturity an additional three months subject to certain conditions. The interest rate on 9 Times Square was 3.72% as of March 31, 2024.
7) Data as of April 30, 2024.
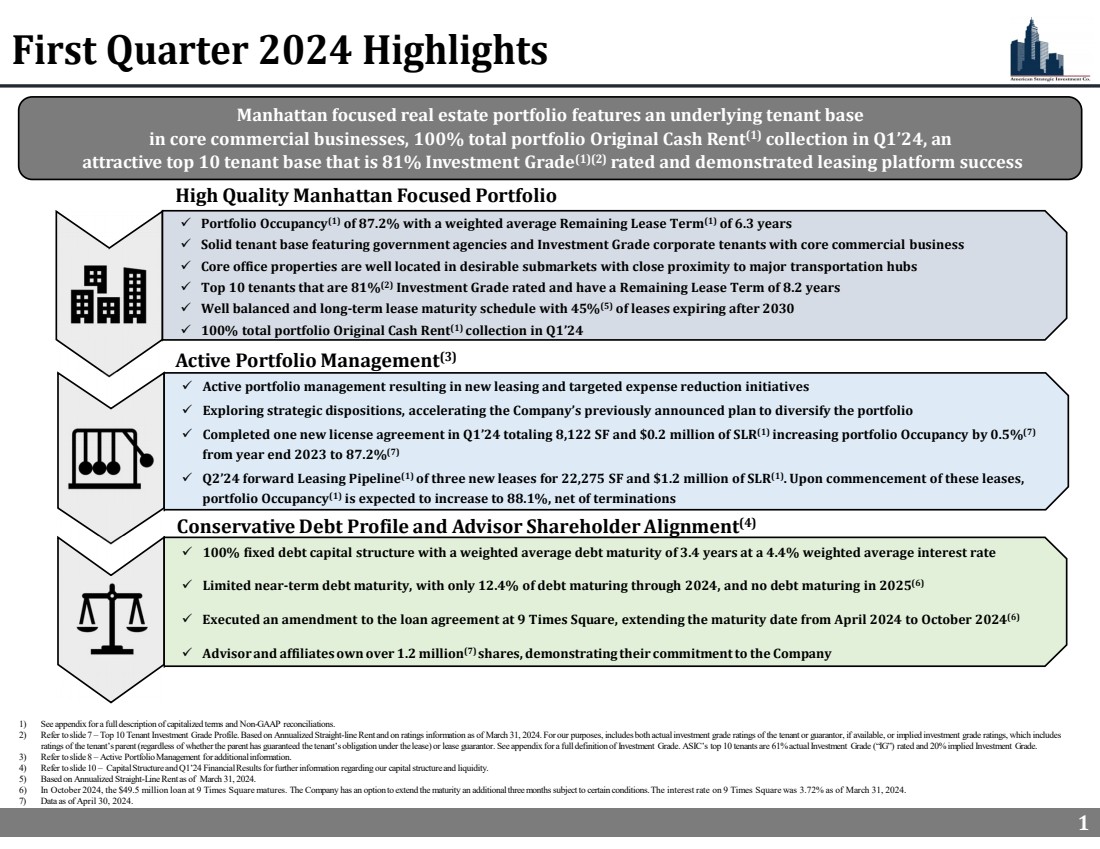
1
Manhattan focused real estate portfolio features an underlying tenant base
in core commercial businesses, 100% total portfolio Original Cash Rent(1) collection in Q1’24, an
attractive top 10 tenant base that is 81% Investment Grade(1)(2) rated and demonstrated leasing platform success
Portfolio Occupancy(1) of 87.2% with a weighted average Remaining Lease Term(1) of 6.3 years
Solid tenant base featuring government agencies and Investment Grade corporate tenants with core commercial business
Core office properties are well located in desirable submarkets with close proximity to major transportation hubs
Top 10 tenants that are 81%(2) Investment Grade rated and have a Remaining Lease Term of 8.2 years
Well balanced and long-term lease maturity schedule with 45%(5) of leases expiring after 2030
100% total portfolio Original Cash Rent(1) collection in Q1’24
Active portfolio management resulting in new leasing and targeted expense reduction initiatives
Exploring strategic dispositions, accelerating the Company’s previously announced plan to diversify the portfolio
Completed one new license agreement in Q1’24 totaling 8,122 SF and $0.2 million of SLR(1) increasing portfolio Occupancy by 0.5%(7)
from year end 2023 to 87.2%(7)
Q2’24 forward Leasing Pipeline(1) of three new leases for 22,275 SF and $1.2 million of SLR(1). Upon commencement of these leases,
portfolio Occupancy(1) is expected to increase to 88.1%, net of terminations
100% fixed debt capital structure with a weighted average debt maturity of 3.4 years at a 4.4% weighted average interest rate
Limited near-term debt maturity, with only 12.4% of debt maturing through 2024, and no debt maturing in 2025(6)
Executed an amendment to the loan agreement at 9 Times Square, extending the maturity date from April 2024 to October 2024(6)
Advisor and affiliates own over 1.2 million(7) shares, demonstrating their commitment to the Company
High Quality Manhattan Focused Portfolio
Active Portfolio Management(3)
Conservative Debt Profile and Advisor Shareholder Alignment(4) |
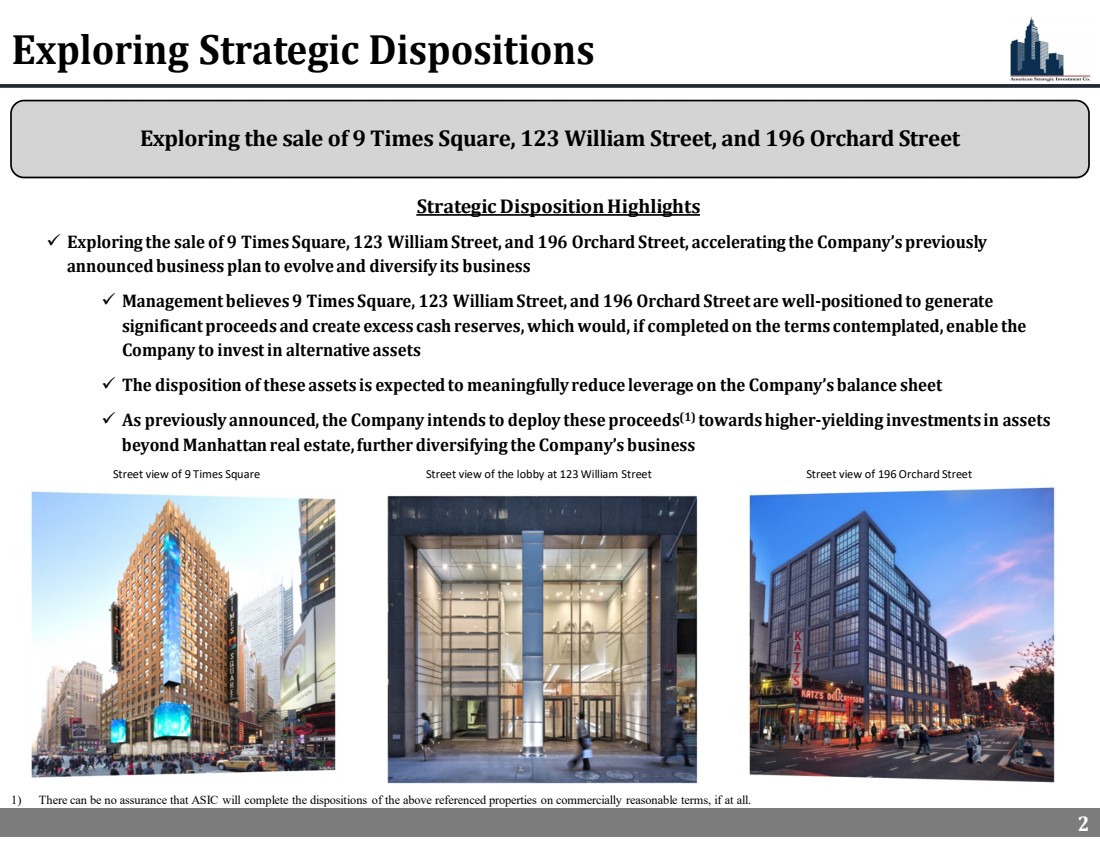
| 2
Exploring the sale of 9 Times Square, 123 William Street, and 196 Orchard Street
Exploring Strategic Dispositions
Strategic Disposition Highlights
Exploring the sale of 9 Times Square, 123 William Street, and 196 Orchard Street, accelerating the Company’s previously
announced business plan to evolve and diversify its business
Management believes 9 Times Square, 123 William Street, and 196 Orchard Street are well-positioned to generate
significant proceeds and create excess cash reserves, which would, if completed on the terms contemplated, enable the
Company to invest in alternative assets
The disposition of these assets is expected to meaningfully reduce leverage on the Company’s balance sheet
As previously announced, the Company intends to deploy these proceeds(1) towards higher-yielding investments in assets
beyond Manhattan real estate, further diversifying the Company’s business
Street view of 9 Times Square Street view of the lobby at 123 William Street Street view of 196 Orchard Street
1) There can be no assurance that ASIC will complete the dispositions of the above referenced properties on commercially reasonable terms, if at all. |
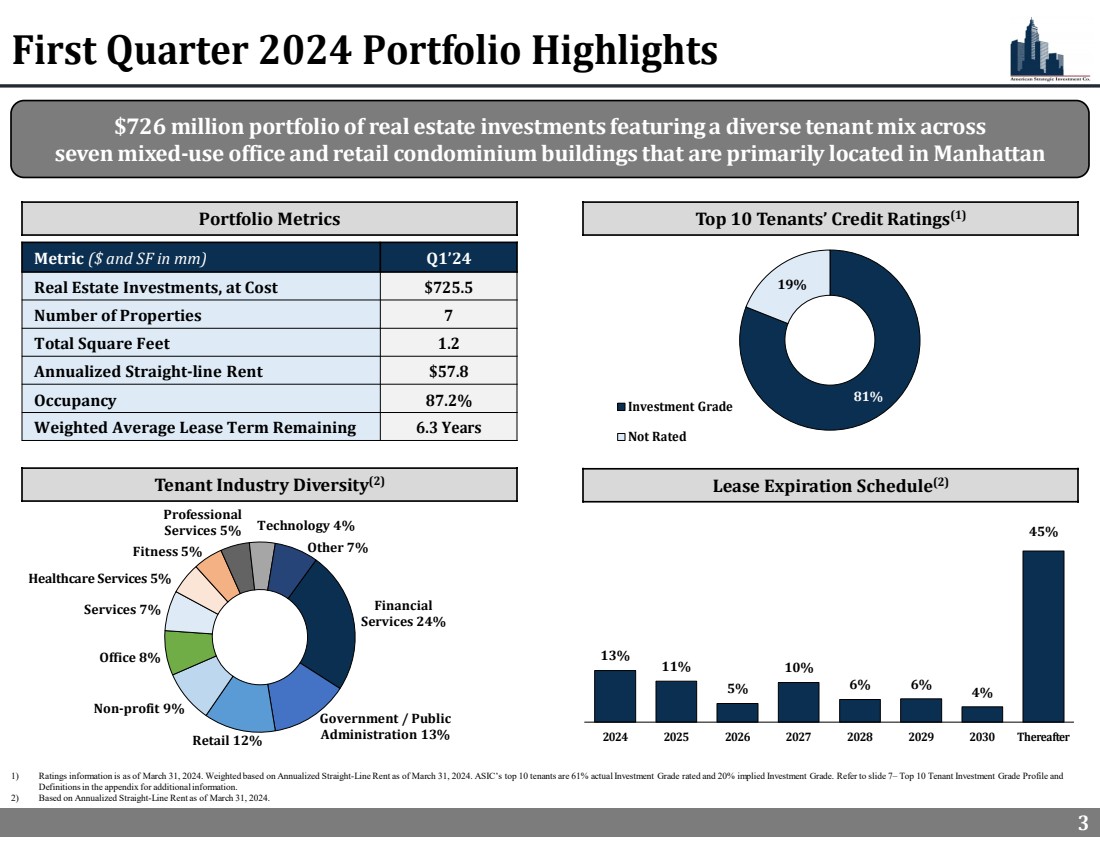
| 3
First Quarter 2024 Portfolio Highlights
Metric ($ and SF in mm) Q1’24
Real Estate Investments, at Cost $725.5
Number of Properties 7
Total Square Feet 1.2
Annualized Straight-line Rent $57.8
Occupancy 87.2%
Weighted Average Lease Term Remaining 6.3 Years
1) Ratings information is as of March 31, 2024. Weighted based on Annualized Straight-Line Rent as of March 31, 2024. ASIC’s top 10 tenants are 61% actual Investment Grade rated and 20% implied Investment Grade. Refer to slide 7– Top 10 Tenant Investment Grade Profile and
Definitions in the appendix for additional information.
2) Based on Annualized Straight-Line Rent as of March 31, 2024.
3
13%
11%
5%
10%
6% 6% 4%
45%
2024 2025 2026 2027 2028 2029 2030 Thereafter
Financial
Services 24%
Government / Public
Retail 12% Administration 13%
Non-profit 9%
Office 8%
Services 7%
Healthcare Services 5%
Fitness 5%
Professional
Services 5% Technology 4%
Other 7%
$726 million portfolio of real estate investments featuring a diverse tenant mix across
seven mixed-use office and retail condominium buildings that are primarily located in Manhattan
Top 10 Tenants’ Credit Ratings(1)
Tenant Industry Diversity(2) Lease Expiration Schedule(2)
Portfolio Metrics
81%
19%
Investment Grade
Not Rated |
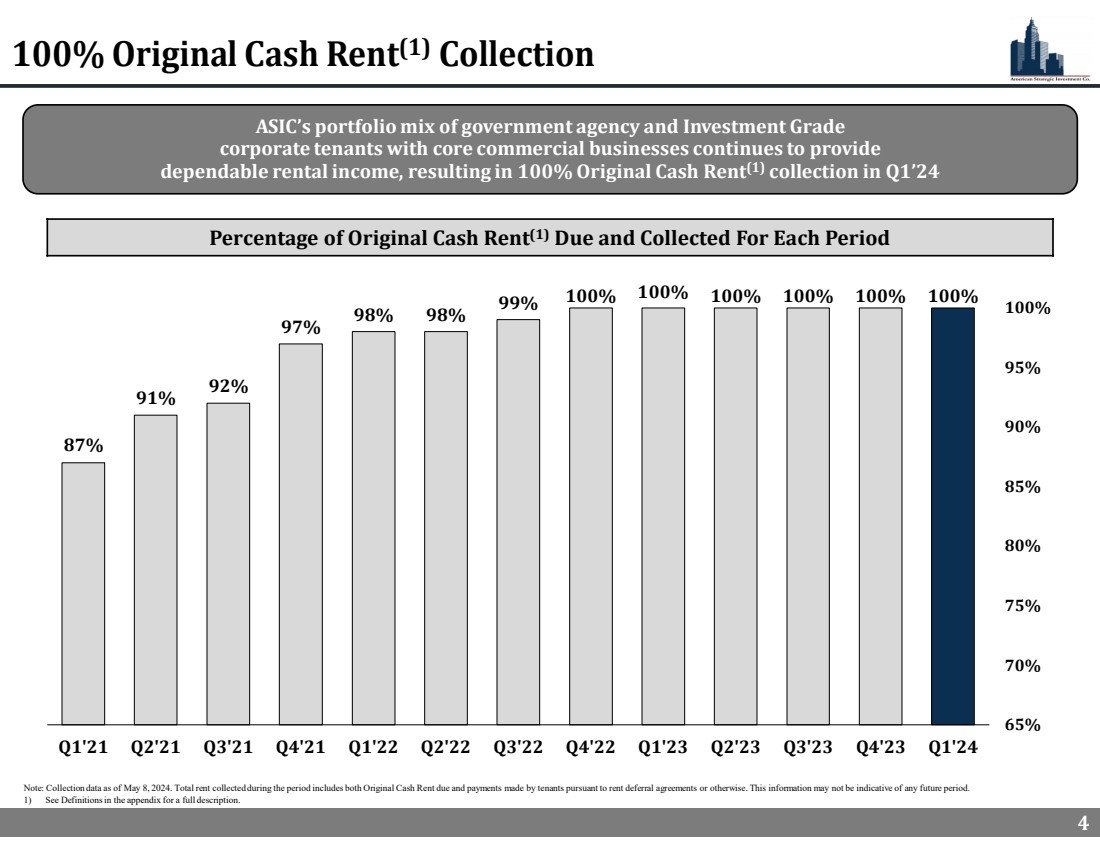
| 4
100% Original Cash Rent(1) Collection
Percentage of Original Cash Rent(1) Due and Collected For Each Period
Note: Collection data as of May 8, 2024. Total rent collected during the period includes both Original Cash Rent due and payments made by tenants pursuant to rent deferral agreements or otherwise. This information may not be indicative of any future period.
1) See Definitions in the appendix for a full description.
99% 100% 100% 100% 100% 100% 100%
98% 98% 97%
92% 91%
87%
65%
70%
75%
80%
85%
90%
95%
100%
Q1'21 Q2'21 Q3'21 Q4'21 Q1'22 Q2'22 Q3'22 Q4'22 Q1'23 Q2'23 Q3'23 Q4'23 Q1'24
ASIC’s portfolio mix of government agency and Investment Grade
corporate tenants with core commercial businesses continues to provide
dependable rental income, resulting in 100% Original Cash Rent(1) collection in Q1’24 |
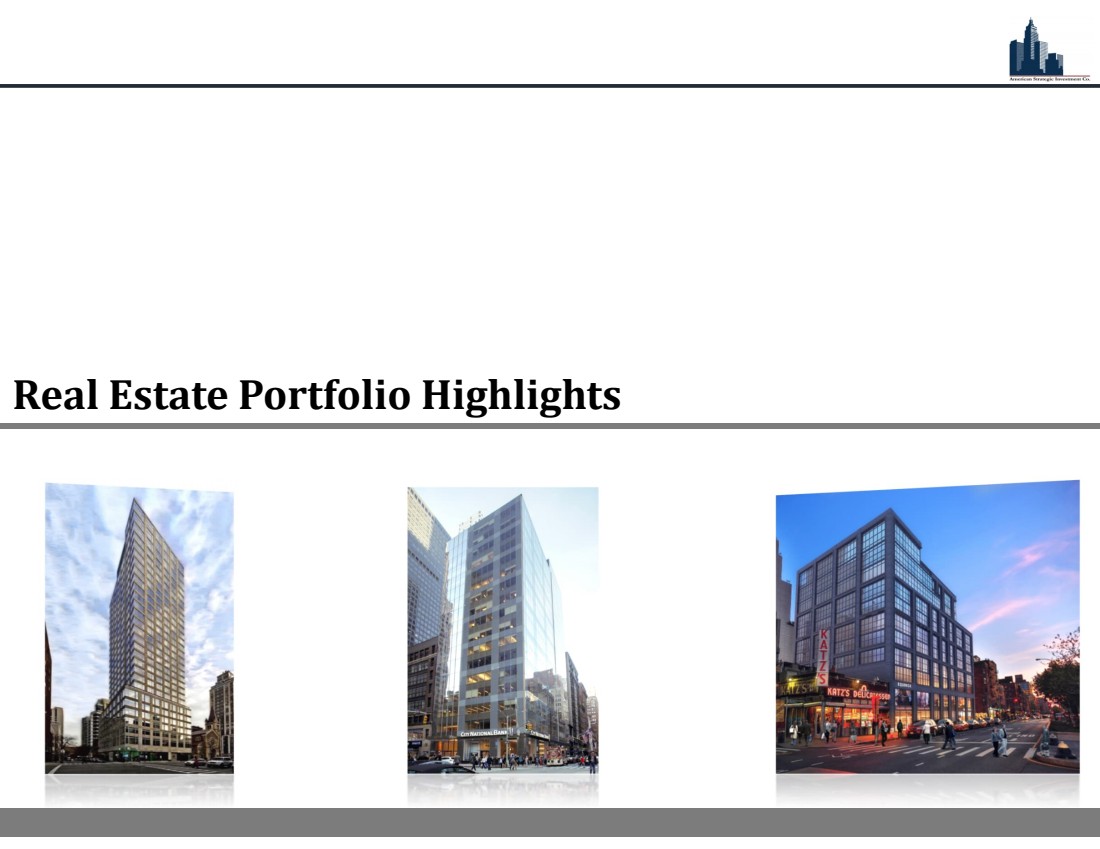
| 5
Real Estate Portfolio Highlights |
| 6
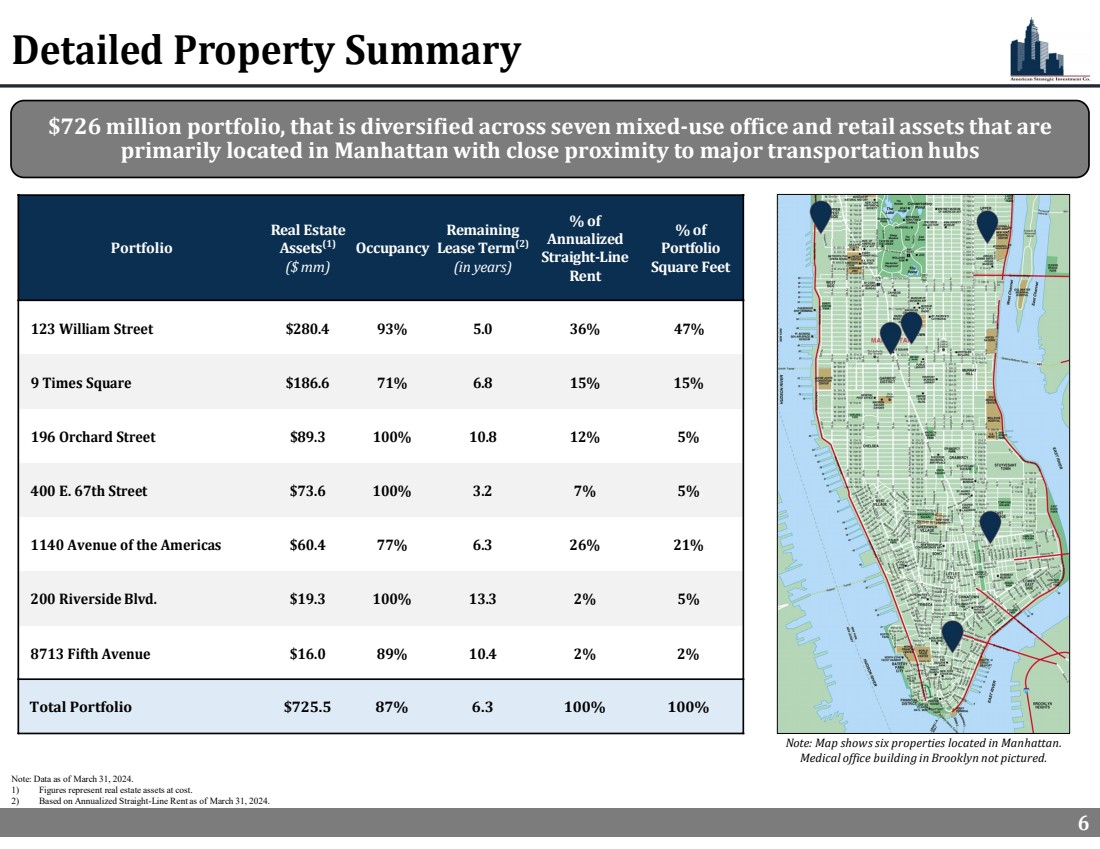
Detailed Property Summary
Note: Data as of March 31, 2024.
1) Figures represent real estate assets at cost.
2) Based on Annualized Straight-Line Rent as of March 31, 2024.
% of
Portfolio
Square Feet
% of
Annualized
Straight-Line
Rent
Remaining
Lease Term(2)
(in years)
Occupancy
Real Estate
Assets(1)
($ mm)
Portfolio
123 William Street $280.4 93% 5.0 36% 47%_
9 Times Square $186.6 71% 6.8 15% 15%_
196 Orchard Street $89.3 100% 10.8 12% 5%_
400 E. 67th Street $73.6 100% 3.2 7% 5%_
1140 Avenue of the Americas $60.4 77% 6.3 26% 21%_
200 Riverside Blvd. $19.3 100% 13.3 2% 5%_
8713 Fifth Avenue $16.0 89% 10.4 2% 2%_
Total Portfolio $725.5 87% 6.3 100% 100%_
Note: Map shows six properties located in Manhattan.
Medical office building in Brooklyn not pictured.
$726 million portfolio, that is diversified across seven mixed-use office and retail assets that are
primarily located in Manhattan with close proximity to major transportation hubs |
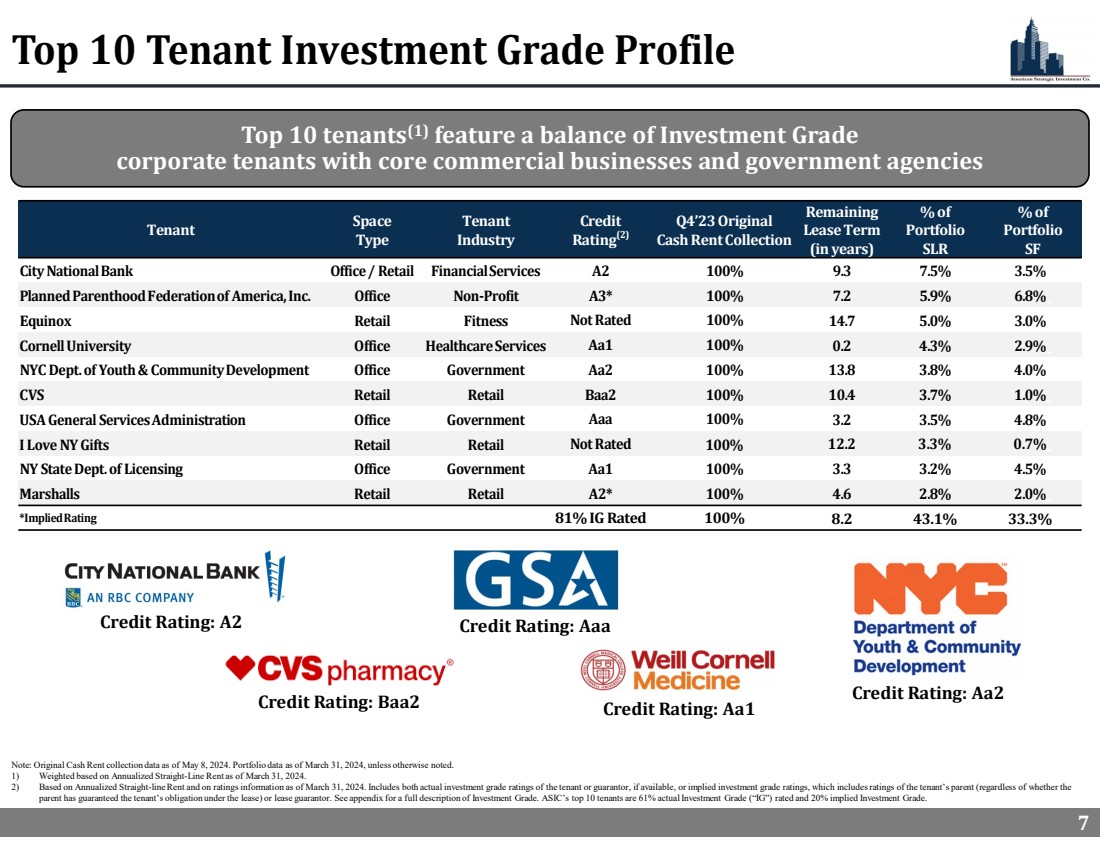
| 7
Note: Original Cash Rent collection data as of May 8, 2024. Portfolio data as of March 31, 2024, unless otherwise noted.
1) Weighted based on Annualized Straight-Line Rent as of March 31, 2024.
2) Based on Annualized Straight-line Rent and on ratings information as of March 31, 2024. Includes both actual investment grade ratings of the tenant or guarantor, if available, or implied investment grade ratings, which includes ratings of the tenant’s parent (regardless of whether the
parent has guaranteed the tenant’s obligation under the lease) or lease guarantor. See appendix for a full description of Investment Grade. ASIC’s top 10 tenants are 61% actual Investment Grade (“IG”) rated and 20% implied Investment Grade.
Top 10 Tenant Investment Grade Profile
% of
Portfolio
SF
% of
Portfolio
SLR
Remaining
Lease Term
(in years)
Q4’23 Original
Cash Rent Collection
Credit
Rating(2)
Tenant
Industry
Space
Type Tenant
City National Bank Office / Retail Financial Services A2 100% 9.3 7.5% 3.5%_
Planned Parenthood Federation of America, Inc. Office Non-Profit A3* 100% 7.2 5.9% 6.8%_
Equinox Retail Fitness Not Rated 100% 14.7 5.0% 3.0%_
Cornell University Office Healthcare Services Aa1 100% 0.2 4.3% 2.9%_
NYC Dept. of Youth & Community Development Office Government Aa2 100% 13.8 3.8% 4.0%_
CVS Retail Retail Baa2 100% 10.4 3.7% 1.0%_
USA General Services Administration Office Government Aaa 100% 3.2 3.5% 4.8%_
I Love NY Gifts Retail Retail Not Rated 100% 12.2 3.3% 0.7%_
NY State Dept. of Licensing Office Government Aa1 100% 3.3 3.2% 4.5%_
Marshalls Retail Retail A2* 100% 4.6 2.8% 2.0%_
*Implied Rating 81% IG Rated 100% 8.2 43.1% 33.3%_
Credit Rating: A2
Credit Rating: Aa1 Credit Rating: Baa2
Credit Rating: Aaa
Credit Rating: Aa2
Top 10 tenants(1) feature a balance of Investment Grade
corporate tenants with core commercial businesses and government agencies |
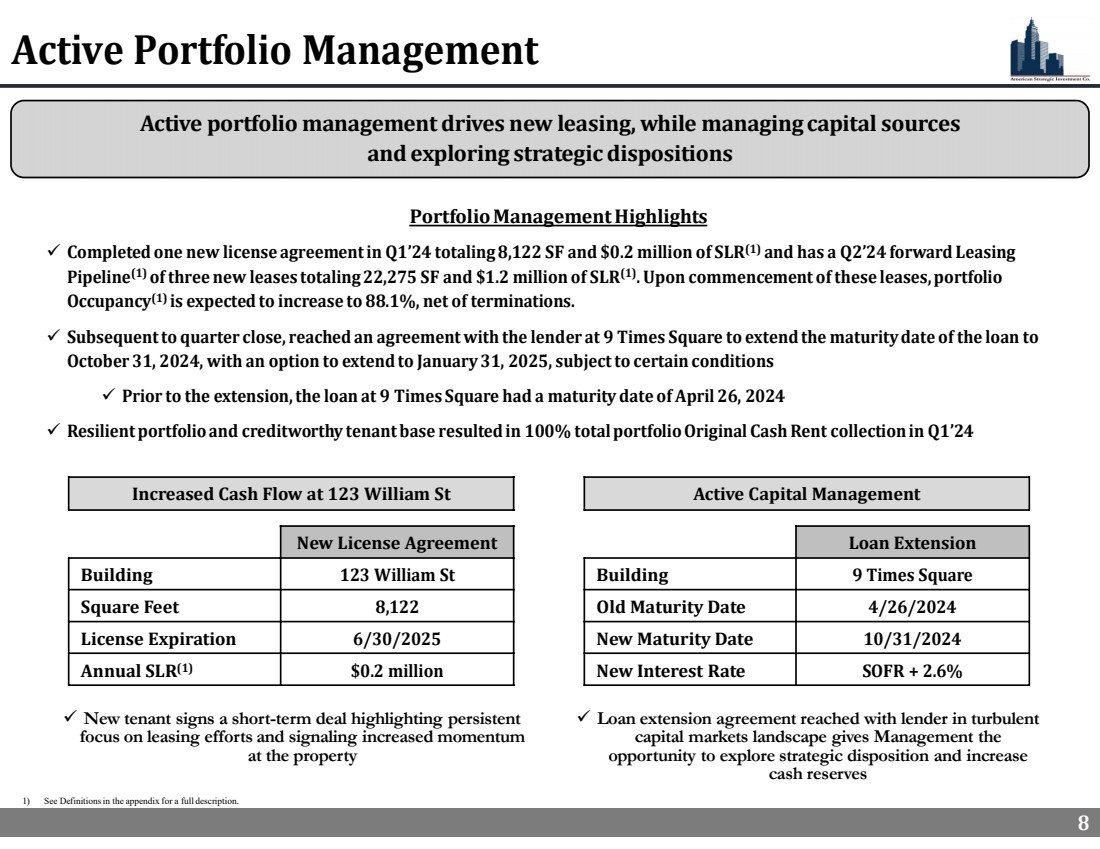
| 8
Active portfolio management drives new leasing, while managing capital sources
and exploring strategic dispositions
Active Portfolio Management
Increased Cash Flow at 123 William St
New tenant signs a short-term deal highlighting persistent
focus on leasing efforts and signaling increased momentum
at the property
Portfolio Management Highlights
Completed one new license agreement in Q1’24 totaling 8,122 SF and $0.2 million of SLR(1) and has a Q2’24 forward Leasing
Pipeline(1) of three new leases totaling 22,275 SF and $1.2 million of SLR(1). Upon commencement of these leases, portfolio
Occupancy(1) is expected to increase to 88.1%, net of terminations.
Subsequent to quarter close, reached an agreement with the lender at 9 Times Square to extend the maturity date of the loan to
October 31, 2024, with an option to extend to January 31, 2025, subject to certain conditions
Prior to the extension, the loan at 9 Times Square had a maturity date of April 26, 2024
Resilient portfolio and creditworthy tenant base resulted in 100% total portfolio Original Cash Rent collection in Q1’24
New License Agreement
Building 123 William St
Square Feet 8,122
License Expiration 6/30/2025
Annual SLR(1) $0.2 million
1) See Definitions in the appendix for a full description.
Active Capital Management
Loan extension agreement reached with lender in turbulent
capital markets landscape gives Management the
opportunity to explore strategic disposition and increase
cash reserves
Loan Extension
Building 9 Times Square
Old Maturity Date 4/26/2024
New Maturity Date 10/31/2024
New Interest Rate SOFR + 2.6% |
| 9
Financial Highlights |
| 10
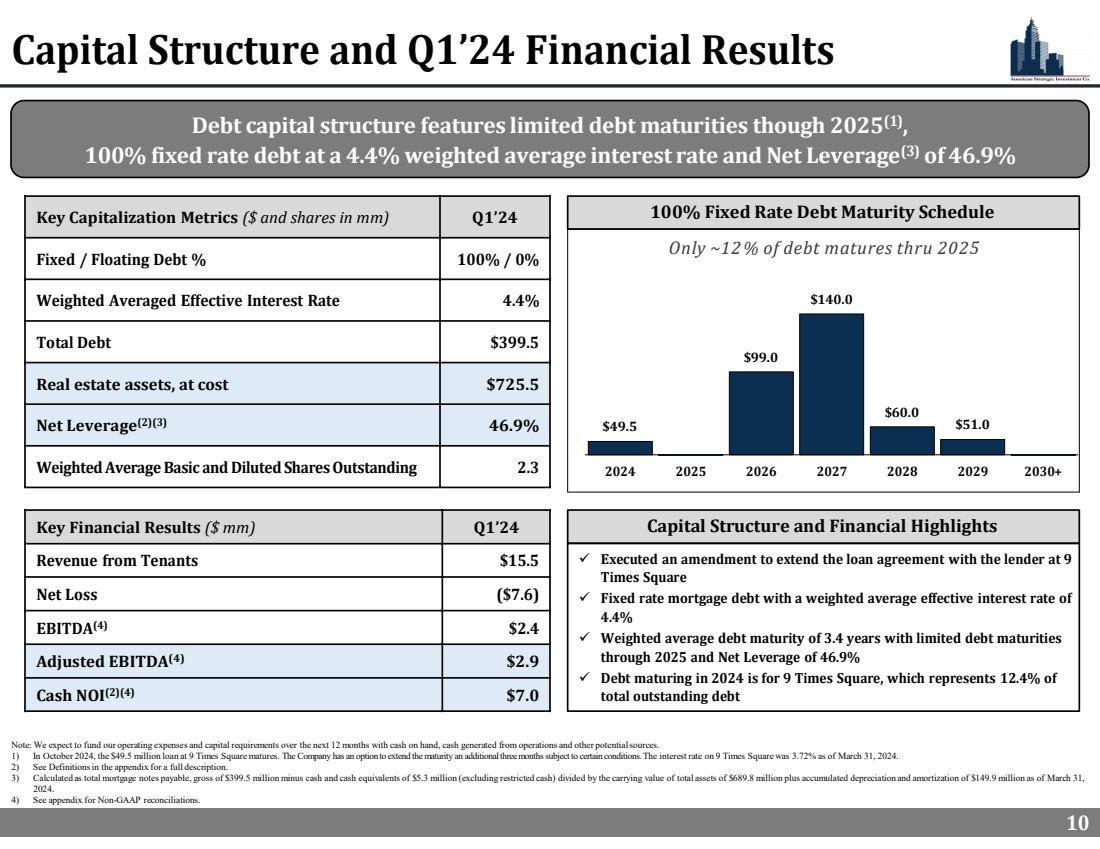
Capital Structure and Q1’24 Financial Results
Note: We expect to fund our operating expenses and capital requirements over the next 12 months with cash on hand, cash generated from operations and other potential sources.
1) In October 2024, the $49.5 million loan at 9 Times Square matures. The Company has an option to extend the maturity an additional three months subject to certain conditions. The interest rate on 9 Times Square was 3.72% as of March 31, 2024.
2) See Definitions in the appendix for a full description.
3) Calculated as total mortgage notes payable, gross of $399.5 million minus cash and cash equivalents of $5.3 million (excluding restricted cash) divided by the carrying value of total assets of $689.8 million plus accumulated depreciation and amortization of $149.9 million as of March 31,
2024.
4) See appendix for Non-GAAP reconciliations.
Debt capital structure features limited debt maturities though 2025(1)
,
100% fixed rate debt at a 4.4% weighted average interest rate and Net Leverage(3) of 46.9%
Key Capitalization Metrics ($ and shares in mm) Q1’24
Fixed / Floating Debt % 100% / 0%
Weighted Averaged Effective Interest Rate 4.4%
Total Debt $399.5
Real estate assets, at cost $725.5
Net Leverage(2)(3) 46.9%
Weighted Average Basic and Diluted Shares Outstanding 2.3
100% Fixed Rate Debt Maturity Schedule
$49.5
$99.0
$140.0
$60.0
$51.0
$40.0
$60.0
$80.0
$100.0
$120.0
$140.0
$160.0
$180.0
2024 2025 2026 2027 2028 2029 2030+
Key Financial Results ($ mm) Q1’24
Revenue from Tenants $15.5
Net Loss ($7.6)
EBITDA $2.4 (4)
Adjusted EBITDA $2.9 (4)
Cash NOI $7.0 (2)(4)
Capital Structure and Financial Highlights
Executed an amendment to extend the loan agreement with the lender at 9
Times Square
Fixed rate mortgage debt with a weighted average effective interest rate of
4.4%
Weighted average debt maturity of 3.4 years with limited debt maturities
through 2025 and Net Leverage of 46.9%
Debt maturing in 2024 is for 9 Times Square, which represents 12.4% of
total outstanding debt
Only ~12% of debt matures thru 2025 |
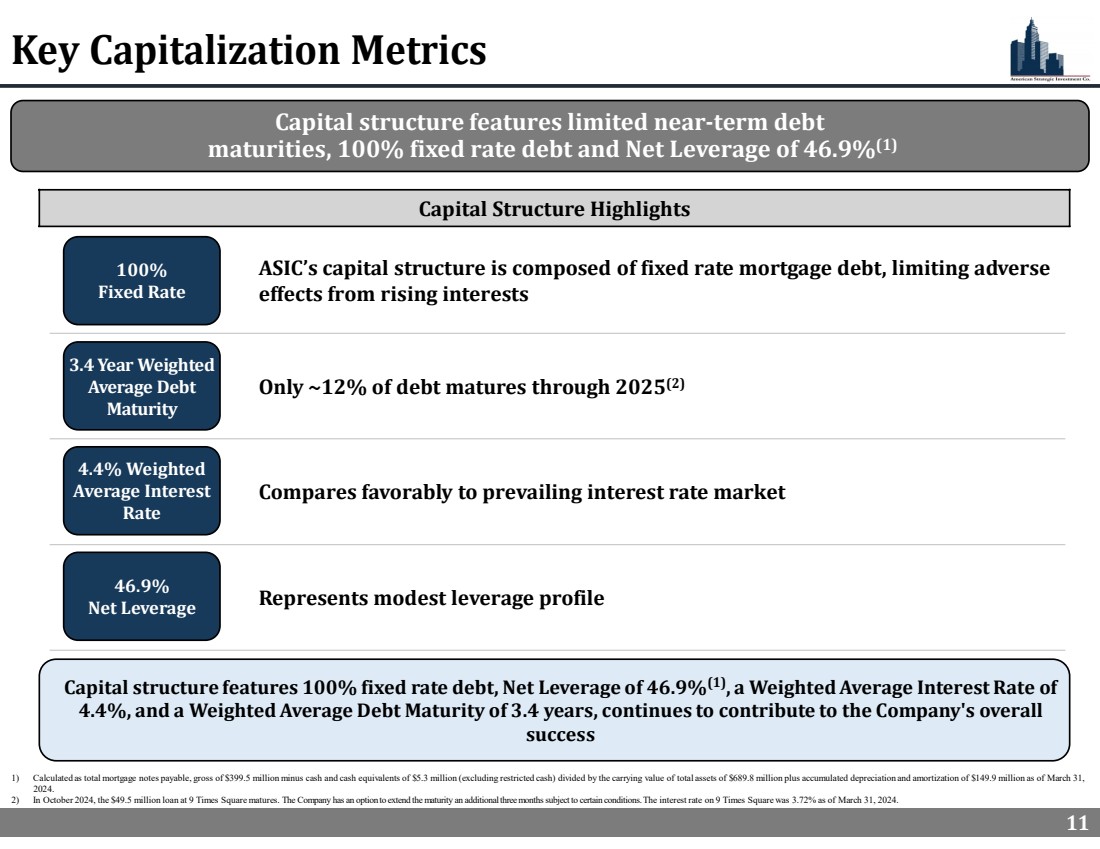
| 11
ASIC’s capital structure is composed of fixed rate mortgage debt, limiting adverse
effects from rising interests
Only ~12% of debt matures through 2025(2)
Compares favorably to prevailing interest rate market
Represents modest leverage profile
Key Capitalization Metrics
11
Capital structure features limited near-term debt
maturities, 100% fixed rate debt and Net Leverage of 46.9%(1)
Capital Structure Highlights
100%
Fixed Rate
Capital structure features 100% fixed rate debt, Net Leverage of 46.9%(1), a Weighted Average Interest Rate of
4.4%, and a Weighted Average Debt Maturity of 3.4 years, continues to contribute to the Company's overall
success
3.4 Year Weighted
Average Debt
Maturity
4.4% Weighted
Average Interest
Rate
46.9%
Net Leverage
1) Calculated as total mortgage notes payable, gross of $399.5 million minus cash and cash equivalents of $5.3 million (excluding restricted cash) divided by the carrying value of total assets of $689.8 million plus accumulated depreciation and amortization of $149.9 million as of March 31,
2024.
2) In October 2024, the $49.5 million loan at 9 Times Square matures. The Company has an option to extend the maturity an additional three months subject to certain conditions. The interest rate on 9 Times Square was 3.72% as of March 31, 2024. |

| 12
Management and Board of Directors |
| 13
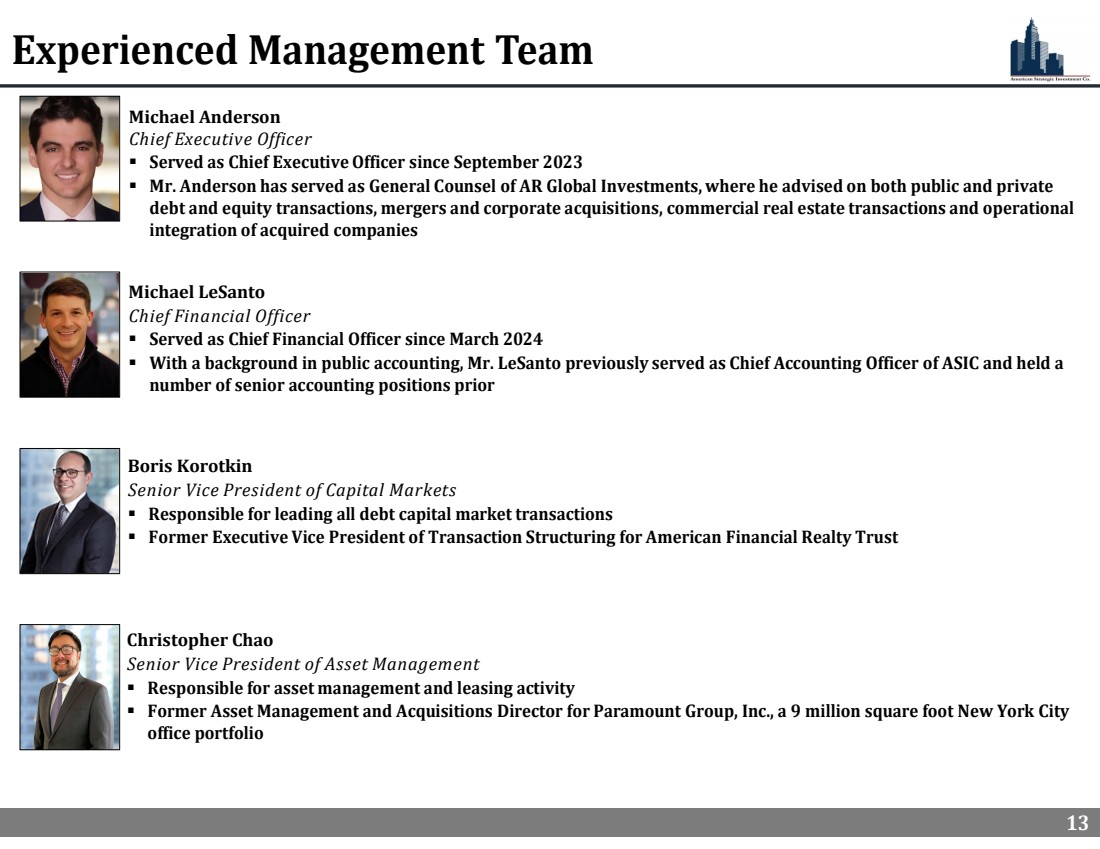
Experienced Management Team
Boris Korotkin
Senior Vice President of Capital Markets
Responsible for leading all debt capital market transactions
Former Executive Vice President of Transaction Structuring for American Financial Realty Trust
Christopher Chao
Senior Vice President of Asset Management
Responsible for asset management and leasing activity
Former Asset Management and Acquisitions Director for Paramount Group, Inc., a 9 million square foot New York City
office portfolio
Michael LeSanto
Chief Financial Officer
Served as Chief Financial Officer since March 2024
With a background in public accounting, Mr. LeSanto previously served as Chief Accounting Officer of ASIC and held a
number of senior accounting positions prior
Michael Anderson
Chief Executive Officer
Served as Chief Executive Officer since September 2023
Mr. Anderson has served as General Counsel of AR Global Investments, where he advised on both public and private
debt and equity transactions, mergers and corporate acquisitions, commercial real estate transactions and operational
integration of acquired companies |
| 14
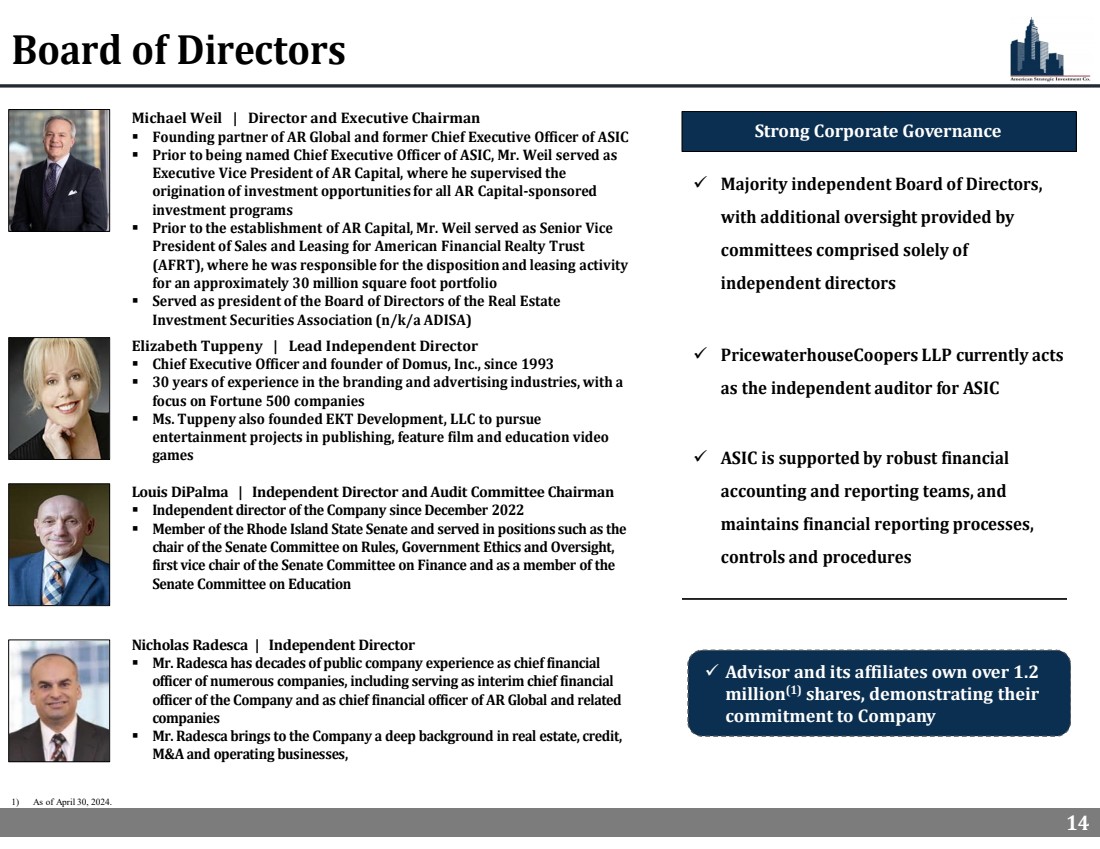
Board of Directors
Michael Weil | Director and Executive Chairman
Founding partner of AR Global and former Chief Executive Officer of ASIC
Prior to being named Chief Executive Officer of ASIC, Mr. Weil served as
Executive Vice President of AR Capital, where he supervised the
origination of investment opportunities for all AR Capital-sponsored
investment programs
Prior to the establishment of AR Capital, Mr. Weil served as Senior Vice
President of Sales and Leasing for American Financial Realty Trust
(AFRT), where he was responsible for the disposition and leasing activity
for an approximately 30 million square foot portfolio
Served as president of the Board of Directors of the Real Estate
Investment Securities Association (n/k/a ADISA)
Louis DiPalma | Independent Director and Audit Committee Chairman
Independent director of the Company since December 2022
Member of the Rhode Island State Senate and served in positions such as the
chair of the Senate Committee on Rules, Government Ethics and Oversight,
first vice chair of the Senate Committee on Finance and as a member of the
Senate Committee on Education
Nicholas Radesca | Independent Director
Mr. Radesca has decades of public company experience as chief financial
officer of numerous companies, including serving as interim chief financial
officer of the Company and as chief financial officer of AR Global and related
companies
Mr. Radesca brings to the Company a deep background in real estate, credit,
M&A and operating businesses,
Elizabeth Tuppeny | Lead Independent Director
Chief Executive Officer and founder of Domus, Inc., since 1993
30 years of experience in the branding and advertising industries, with a
focus on Fortune 500 companies
Ms. Tuppeny also founded EKT Development, LLC to pursue
entertainment projects in publishing, feature film and education video
games
Strong Corporate Governance
Majority independent Board of Directors,
with additional oversight provided by
committees comprised solely of
independent directors
PricewaterhouseCoopers LLP currently acts
as the independent auditor for ASIC
ASIC is supported by robust financial
accounting and reporting teams, and
maintains financial reporting processes,
controls and procedures
Advisor and its affiliates own over 1.2
million(1) shares, demonstrating their
commitment to Company
1) As of April 30, 2024. |
| 15
Appendix |
| 16
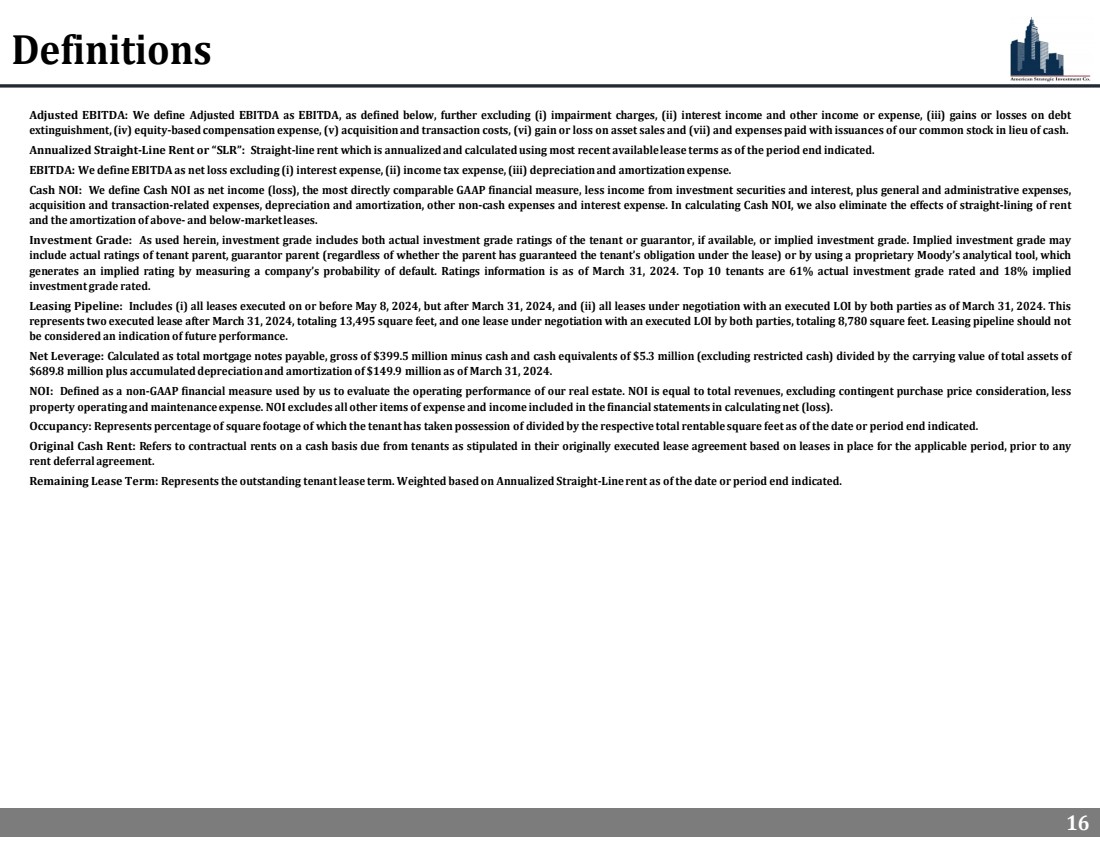
Definitions
Adjusted EBITDA: We define Adjusted EBITDA as EBITDA, as defined below, further excluding (i) impairment charges, (ii) interest income and other income or expense, (iii) gains or losses on debt
extinguishment, (iv) equity-based compensation expense, (v) acquisition and transaction costs, (vi) gain or loss on asset sales and (vii) and expenses paid with issuances of our common stock in lieu of cash.
Annualized Straight-Line Rent or “SLR”: Straight-line rent which is annualized and calculated using most recent available lease terms as of the period end indicated.
EBITDA: We define EBITDA as net loss excluding (i) interest expense, (ii) income tax expense, (iii) depreciation and amortization expense.
Cash NOI: We define Cash NOI as net income (loss), the most directly comparable GAAP financial measure, less income from investment securities and interest, plus general and administrative expenses,
acquisition and transaction-related expenses, depreciation and amortization, other non-cash expenses and interest expense. In calculating Cash NOI, we also eliminate the effects of straight-lining of rent
and the amortization of above- and below-market leases.
Investment Grade: As used herein, investment grade includes both actual investment grade ratings of the tenant or guarantor, if available, or implied investment grade. Implied investment grade may
include actual ratings of tenant parent, guarantor parent (regardless of whether the parent has guaranteed the tenant’s obligation under the lease) or by using a proprietary Moody’s analytical tool, which
generates an implied rating by measuring a company’s probability of default. Ratings information is as of March 31, 2024. Top 10 tenants are 61% actual investment grade rated and 18% implied
investment grade rated.
Leasing Pipeline: Includes (i) all leases executed on or before May 8, 2024, but after March 31, 2024, and (ii) all leases under negotiation with an executed LOI by both parties as of March 31, 2024. This
represents two executed lease after March 31, 2024, totaling 13,495 square feet, and one lease under negotiation with an executed LOI by both parties, totaling 8,780 square feet. Leasing pipeline should not
be considered an indication of future performance.
Net Leverage: Calculated as total mortgage notes payable, gross of $399.5 million minus cash and cash equivalents of $5.3 million (excluding restricted cash) divided by the carrying value of total assets of
$689.8 million plus accumulated depreciation and amortization of $149.9 million as of March 31, 2024.
NOI: Defined as a non-GAAP financial measure used by us to evaluate the operating performance of our real estate. NOI is equal to total revenues, excluding contingent purchase price consideration, less
property operating and maintenance expense. NOI excludes all other items of expense and income included in the financial statements in calculating net (loss).
Occupancy: Represents percentage of square footage of which the tenant has taken possession of divided by the respective total rentable square feet as of the date or period end indicated.
Original Cash Rent: Refers to contractual rents on a cash basis due from tenants as stipulated in their originally executed lease agreement based on leases in place for the applicable period, prior to any
rent deferral agreement.
Remaining Lease Term: Represents the outstanding tenant lease term. Weighted based on Annualized Straight-Line rent as of the date or period end indicated. |
| 17
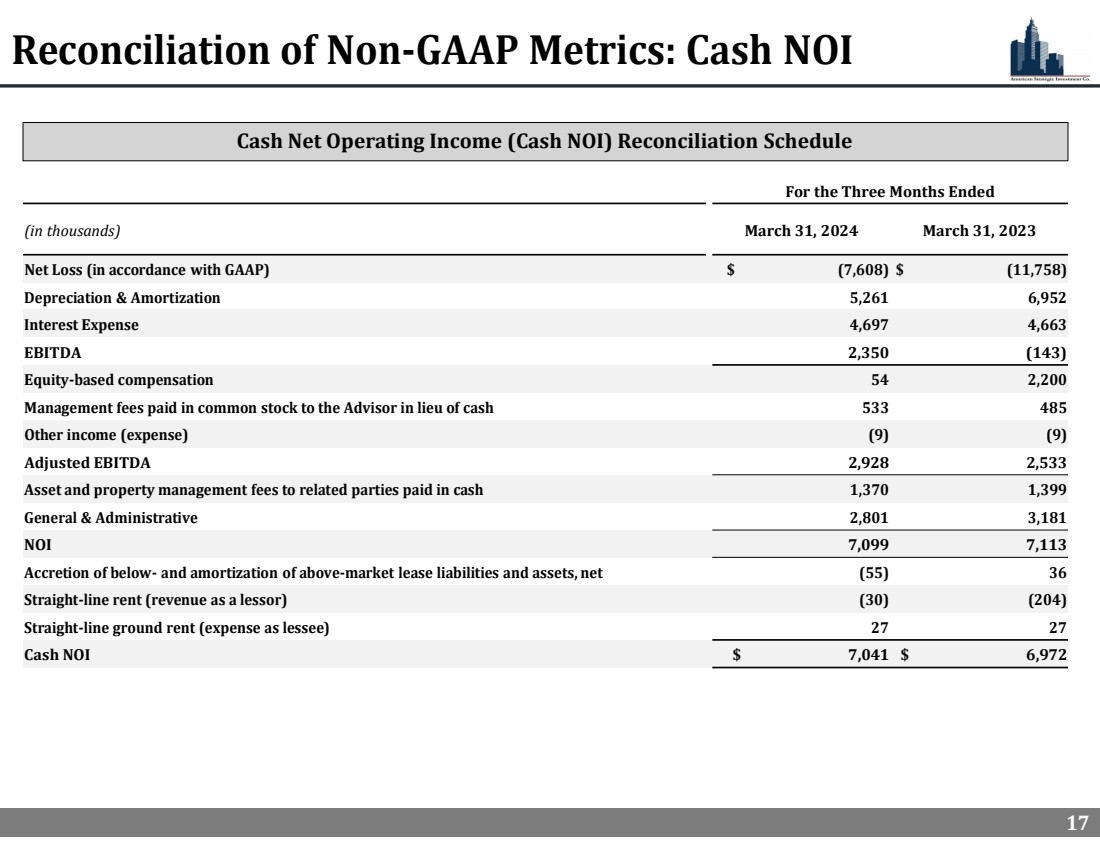
Reconciliation of Non-GAAP Metrics: Cash NOI
For the Three Months Ended
(in thousands) March 31, 2024 March 31, 2023
Net Loss (in accordance with GAAP) $ (7,608) $ (11,758)
Depreciation & Amortization 5,261 6,952
Interest Expense 4,697 4,663
EBITDA 2,350 (143)
Equity-based compensation 54 2,200
Management fees paid in common stock to the Advisor in lieu of cash 533 485
Other income (expense) (9) (9)
Adjusted EBITDA 2,928 2,533
Asset and property management fees to related parties paid in cash 1,370 1,399
General & Administrative 2,801 3,181
NOI 7,099 7,113
Accretion of below- and amortization of above-market lease liabilities and assets, net (55) 36
Straight-line rent (revenue as a lessor) (30) (204)
Straight-line ground rent (expense as lessee) 27 27
Cash NOI $ 7,041 $ 6,972
Cash Net Operating Income (Cash NOI) Reconciliation Schedule |
| 18
Legal Notices |
| 19
Important Additional Information and Where to Find It
References in this presentation to the “Company,” “we,” “us” and “our” refer to American Strategic Investment Co. (“ASIC”) and its consolidated
subsidiaries.
This presentation contains estimates and information concerning the Company's industry that are based on industry publications and reports.
The Company has not independently verified the accuracy of the data contained in these industry publications and reports. Estimates and
information in this presentation involve a number of assumptions and limitations, and you are cautioned not to rely on or give undue weight to
this information. The industry in which we operate is subject to a high degree of uncertainty and risk due to variety of factors, including those
described in the “Risk Factors” and “Management's Discussion and Analysis of Financial Condition and Results of Operations” sections of the
Company's Annual Report on Form 10-K for the year ended December 31, 2023 filed on April 1, 2024 and the Company’s Quarterly Report on
on Form 10-Q for the quarter ended March 31, 2024 filed on May 10, 2024 with the Securities and Exchange Commission (the "SEC") on May
10, 2024 and all other filings filed with the SEC after that date including but not limited to the subsequent Quarterly Reports on Form 10-Q and
Current Reports on Form 8-K, as such risks, uncertainties and other important factors may be updated from time to time in the Company's
subsequent reports. These and other factors could cause results to differ materially from those expressed in these publications and reports.
The majority of the concessions granted to our tenants as a result of the COVID-19 pandemic were rent deferrals or temporary rent abatements
with the original lease term unchanged and collection of deferred rent deemed probable. As a result of relief granted by the Financial
Accounting Standards Board and the SEC related to lease modification accounting, rental revenue used to calculate Net Income, NOI, Cash NOI,
EBITDA, and Adjusted EBITDA has not been, and we do not expect it to be, significantly impacted by these types of deferrals.
Non-GAAP Financial Measures
We disclose certain non-GAAP financial measures we use to evaluate our performance, such as Cash Net Operating Income (“Cash NOI”). A
description of these non-GAAP measures and reconciliations to the most directly comparable GAAP measure, which is net income (loss), is
provided on slide 16. None of these non-GAAP financial measures should be considered as a substitute for net income or any other financial
measure presented in accordance with generally accepted accounting principles in the United States ("GAAP"). Because non-GAAP financial
measures are not standardized, such as Cash NOI, as defined by the Company, may not be comparable to similarly titled measures reported by
other companies. It therefore may not be possible to compare the Company's use of these non-GAAP financial measures with those used by
other companies. A reconciliation of all non-GAAP measures disclosed in this presentation to their nearest respective GAAP measures can be
found on slide 15 of this presentation.
19 |
| 20
Forward Looking Statements
This presentation does not constitute an offer to sell or a solicitation of an offer to purchase any securities of American Strategic Investment Co. (“We” or the
“Company”). Any offer or sale of securities will be made only by means of a prospectus and related documentation meeting the requirements of the Securities
Act of 1933, as amended, and no offer to sell or solicitation of an offer to buy shall be made in any jurisdiction in which such offer, solicitation or sale would be
unlawful.
This presentation contains statements that are not historical facts and may be forward-looking statements, including statements regarding the intent, belief
or current expectations of us, our operating partnership and members of our management team, as well as the assumptions on which such statements are
based, and generally are identified by the use of words such as “may,” “will,” “seeks,” “anticipates,” “believes,” “estimates,” “projects,” “potential,” “predicts,”
“expects,” “plans,” “intends,” “would,” “could,” “should” or similar expressions are intended to identify forward-looking statements, although not all forward-looking statements contain these identifying words. Actual results may differ materially from those contemplated by such forward-looking statements.
Further, forward-looking statements speak only as of the date they are made, and we undertake no obligation to update or revise forward-looking statements
to reflect changed assumptions, the occurrence of unanticipated events or changes to future operating results over time, unless required by law.
These forward-looking statements are subject to a number of risks, uncertainties and other factors, many of which are outside of the Company’s control,
which could cause actual results to differ materially from the results contemplated by the forward-looking statements. These risks and uncertainties include
(a) the anticipated benefits of the Company’s election to terminate its status as a real estate investment trust, (b) whether the Company will be able to
successfully acquire new assets or businesses, (c) the ability of the Company to execute its business plan and sell certain of its properties on commercially
practicable terms, if at all; (d) the potential adverse effects of the geopolitical instability due to the ongoing military conflict between Russia and Ukraine and
Israel and Hamas, including related sanctions and other penalties imposed by the U.S. and European Union, and the related impact on the Company, the
Company’s tenants, and the global economy and financial markets, (e) the potential adverse effects of inflationary conditions and higher interest rate
environment, (f) that any potential future acquisition or disposition is subject to market conditions and capital availability and may not be completed on
favorable terms, or at all, and (g) the Company may not be able to continue to meet the New York Stock Exchange's (“NYSE”) continued listing requirements
and rules, and the NYSE may delist the Company's common stock, which could negatively affect the Company, the price of the Company's common stock and
the Company's shareholders' ability to sell the Company's common stock, as well as those risks and uncertainties set forth in the Risk Factors section of the
Company’s Annual Report on Form 10-K for the year ended December 31, 2023 filed on April 1, 2024 and all other filings with the Securities and Exchange
Commission after that date including but not limited to the subsequent Quarterly Reports on Form 10-Q and Current Reports on Form 8-K, as such risks,
uncertainties and other important factors may be updated from time to time in the Company’s subsequent reports. Further, forward-looking statements
speak only as of the date they are made, and the Company undertakes no obligation to update or revise any forward-looking statement to reflect changed
assumptions, the occurrence of unanticipated events or changes to future operating results, unless required to do so by law. |
v3.24.1.1.u2
| X |
- DefinitionBoolean flag that is true when the XBRL content amends previously-filed or accepted submission.
| Name: |
dei_AmendmentFlag |
| Namespace Prefix: |
dei_ |
| Data Type: |
xbrli:booleanItemType |
| Balance Type: |
na |
| Period Type: |
duration |
|
| X |
- DefinitionFor the EDGAR submission types of Form 8-K: the date of the report, the date of the earliest event reported; for the EDGAR submission types of Form N-1A: the filing date; for all other submission types: the end of the reporting or transition period. The format of the date is YYYY-MM-DD.
| Name: |
dei_DocumentPeriodEndDate |
| Namespace Prefix: |
dei_ |
| Data Type: |
xbrli:dateItemType |
| Balance Type: |
na |
| Period Type: |
duration |
|
| X |
- DefinitionThe type of document being provided (such as 10-K, 10-Q, 485BPOS, etc). The document type is limited to the same value as the supporting SEC submission type, or the word 'Other'.
| Name: |
dei_DocumentType |
| Namespace Prefix: |
dei_ |
| Data Type: |
dei:submissionTypeItemType |
| Balance Type: |
na |
| Period Type: |
duration |
|
| X |
- DefinitionAddress Line 1 such as Attn, Building Name, Street Name
| Name: |
dei_EntityAddressAddressLine1 |
| Namespace Prefix: |
dei_ |
| Data Type: |
xbrli:normalizedStringItemType |
| Balance Type: |
na |
| Period Type: |
duration |
|
| X |
- Definition
+ References
+ Details
| Name: |
dei_EntityAddressCityOrTown |
| Namespace Prefix: |
dei_ |
| Data Type: |
xbrli:normalizedStringItemType |
| Balance Type: |
na |
| Period Type: |
duration |
|
| X |
- DefinitionCode for the postal or zip code
| Name: |
dei_EntityAddressPostalZipCode |
| Namespace Prefix: |
dei_ |
| Data Type: |
xbrli:normalizedStringItemType |
| Balance Type: |
na |
| Period Type: |
duration |
|
| X |
- DefinitionName of the state or province.
| Name: |
dei_EntityAddressStateOrProvince |
| Namespace Prefix: |
dei_ |
| Data Type: |
dei:stateOrProvinceItemType |
| Balance Type: |
na |
| Period Type: |
duration |
|
| X |
- DefinitionA unique 10-digit SEC-issued value to identify entities that have filed disclosures with the SEC. It is commonly abbreviated as CIK. Reference 1: http://www.xbrl.org/2003/role/presentationRef
-Publisher SEC
-Name Exchange Act
-Number 240
-Section 12
-Subsection b-2
| Name: |
dei_EntityCentralIndexKey |
| Namespace Prefix: |
dei_ |
| Data Type: |
dei:centralIndexKeyItemType |
| Balance Type: |
na |
| Period Type: |
duration |
|
| X |
- DefinitionIndicate if registrant meets the emerging growth company criteria. Reference 1: http://www.xbrl.org/2003/role/presentationRef
-Publisher SEC
-Name Exchange Act
-Number 240
-Section 12
-Subsection b-2
| Name: |
dei_EntityEmergingGrowthCompany |
| Namespace Prefix: |
dei_ |
| Data Type: |
xbrli:booleanItemType |
| Balance Type: |
na |
| Period Type: |
duration |
|
| X |
- DefinitionCommission file number. The field allows up to 17 characters. The prefix may contain 1-3 digits, the sequence number may contain 1-8 digits, the optional suffix may contain 1-4 characters, and the fields are separated with a hyphen.
| Name: |
dei_EntityFileNumber |
| Namespace Prefix: |
dei_ |
| Data Type: |
dei:fileNumberItemType |
| Balance Type: |
na |
| Period Type: |
duration |
|
| X |
- DefinitionTwo-character EDGAR code representing the state or country of incorporation.
| Name: |
dei_EntityIncorporationStateCountryCode |
| Namespace Prefix: |
dei_ |
| Data Type: |
dei:edgarStateCountryItemType |
| Balance Type: |
na |
| Period Type: |
duration |
|
| X |
- DefinitionThe exact name of the entity filing the report as specified in its charter, which is required by forms filed with the SEC. Reference 1: http://www.xbrl.org/2003/role/presentationRef
-Publisher SEC
-Name Exchange Act
-Number 240
-Section 12
-Subsection b-2
| Name: |
dei_EntityRegistrantName |
| Namespace Prefix: |
dei_ |
| Data Type: |
xbrli:normalizedStringItemType |
| Balance Type: |
na |
| Period Type: |
duration |
|
| X |
- DefinitionThe Tax Identification Number (TIN), also known as an Employer Identification Number (EIN), is a unique 9-digit value assigned by the IRS. Reference 1: http://www.xbrl.org/2003/role/presentationRef
-Publisher SEC
-Name Exchange Act
-Number 240
-Section 12
-Subsection b-2
| Name: |
dei_EntityTaxIdentificationNumber |
| Namespace Prefix: |
dei_ |
| Data Type: |
dei:employerIdItemType |
| Balance Type: |
na |
| Period Type: |
duration |
|
| X |
- DefinitionLocal phone number for entity.
| Name: |
dei_LocalPhoneNumber |
| Namespace Prefix: |
dei_ |
| Data Type: |
xbrli:normalizedStringItemType |
| Balance Type: |
na |
| Period Type: |
duration |
|
| X |
- DefinitionBoolean flag that is true only for a security having no trading symbol.
| Name: |
dei_NoTradingSymbolFlag |
| Namespace Prefix: |
dei_ |
| Data Type: |
dei:trueItemType |
| Balance Type: |
na |
| Period Type: |
duration |
|
| X |
- DefinitionBoolean flag that is true when the Form 8-K filing is intended to satisfy the filing obligation of the registrant as pre-commencement communications pursuant to Rule 13e-4(c) under the Exchange Act. Reference 1: http://www.xbrl.org/2003/role/presentationRef
-Publisher SEC
-Name Exchange Act
-Number 240
-Section 13e
-Subsection 4c
| Name: |
dei_PreCommencementIssuerTenderOffer |
| Namespace Prefix: |
dei_ |
| Data Type: |
xbrli:booleanItemType |
| Balance Type: |
na |
| Period Type: |
duration |
|
| X |
- DefinitionBoolean flag that is true when the Form 8-K filing is intended to satisfy the filing obligation of the registrant as pre-commencement communications pursuant to Rule 14d-2(b) under the Exchange Act. Reference 1: http://www.xbrl.org/2003/role/presentationRef
-Publisher SEC
-Name Exchange Act
-Number 240
-Section 14d
-Subsection 2b
| Name: |
dei_PreCommencementTenderOffer |
| Namespace Prefix: |
dei_ |
| Data Type: |
xbrli:booleanItemType |
| Balance Type: |
na |
| Period Type: |
duration |
|
| X |
- DefinitionTitle of a 12(b) registered security. Reference 1: http://www.xbrl.org/2003/role/presentationRef
-Publisher SEC
-Name Exchange Act
-Number 240
-Section 12
-Subsection b
| Name: |
dei_Security12bTitle |
| Namespace Prefix: |
dei_ |
| Data Type: |
dei:securityTitleItemType |
| Balance Type: |
na |
| Period Type: |
duration |
|
| X |
- DefinitionName of the Exchange on which a security is registered. Reference 1: http://www.xbrl.org/2003/role/presentationRef
-Publisher SEC
-Name Exchange Act
-Number 240
-Section 12
-Subsection d1-1
| Name: |
dei_SecurityExchangeName |
| Namespace Prefix: |
dei_ |
| Data Type: |
dei:edgarExchangeCodeItemType |
| Balance Type: |
na |
| Period Type: |
duration |
|
| X |
- DefinitionBoolean flag that is true when the Form 8-K filing is intended to satisfy the filing obligation of the registrant as soliciting material pursuant to Rule 14a-12 under the Exchange Act. Reference 1: http://www.xbrl.org/2003/role/presentationRef
-Publisher SEC
-Name Exchange Act
-Section 14a
-Number 240
-Subsection 12
| Name: |
dei_SolicitingMaterial |
| Namespace Prefix: |
dei_ |
| Data Type: |
xbrli:booleanItemType |
| Balance Type: |
na |
| Period Type: |
duration |
|
| X |
- DefinitionTrading symbol of an instrument as listed on an exchange.
| Name: |
dei_TradingSymbol |
| Namespace Prefix: |
dei_ |
| Data Type: |
dei:tradingSymbolItemType |
| Balance Type: |
na |
| Period Type: |
duration |
|
| X |
- DefinitionBoolean flag that is true when the Form 8-K filing is intended to satisfy the filing obligation of the registrant as written communications pursuant to Rule 425 under the Securities Act. Reference 1: http://www.xbrl.org/2003/role/presentationRef
-Publisher SEC
-Name Securities Act
-Number 230
-Section 425
| Name: |
dei_WrittenCommunications |
| Namespace Prefix: |
dei_ |
| Data Type: |
xbrli:booleanItemType |
| Balance Type: |
na |
| Period Type: |
duration |
|
| X |
- Details
| Name: |
us-gaap_StatementClassOfStockAxis=us-gaap_CommonStockMember |
| Namespace Prefix: |
|
| Data Type: |
na |
| Balance Type: |
|
| Period Type: |
|
|
| X |
- Details
| Name: |
us-gaap_StatementClassOfStockAxis=us-gaap_RightsMember |
| Namespace Prefix: |
|
| Data Type: |
na |
| Balance Type: |
|
| Period Type: |
|
|
American Strategic Inves... (NYSE:NYC)
Gráfica de Acción Histórica
De Abr 2024 a May 2024

American Strategic Inves... (NYSE:NYC)
Gráfica de Acción Histórica
De May 2023 a May 2024
