UNITED STATES
SECURITIES AND EXCHANGE COMMISSION
Washington, D.C. 20549
FORM 6-K
REPORT OF FOREIGN PRIVATE ISSUER
PURSUANT TO SECTION 13a-16 OR 15d-16 UNDER
THE SECURITIES EXCHANGE ACT OF 1934
July 24, 2024
Commission file number:
001-14251
SAP EUROPEAN COMPANY
(Translation of registrant's name into English)
Dietmar-Hopp-Allee 16
69190 Walldorf
Federal Republic of Germany
(Address of principal executive offices)
Indicate by check mark whether the registrant files or will file annual
reports under cover of Form 20-F or Form 40-F.
| Form 20-F | [X] |
Form
40-F |
[ ] |
SAP SE
FORM 6-K
On July 22, 2024, SAP SE, (“SAP"),
issued a quarterly statement (the “Quarterly Statement”) announcing SAP’s financial results for the second quarter ended
June 30, 2024. The Quarterly Statement is attached as Exhibit 99.1 hereto and incorporated by reference herein.
On July 23, 2024, SAP filed a half-year
report with Deutsche Boerse AG for the first half ended June 30, 2024 (the “Half-Year Report”). The Half-Year Report
is attached as Exhibit 99.2 hereto and incorporated by reference herein.
The Quarterly Statement and the Half-Year Report disclose certain non-IFRS
measures. These measures are not prepared in accordance with IFRS and are therefore considered non-IFRS financial measures. The non-IFRS
financial measures that we report should be considered in addition to, and not as substitutes for or superior to, revenue, operating income,
cash flows, or other measures of financial performance prepared in accordance with IFRS.
Please refer to Explanations of Non-IFRS Measures online (www.sap.com/about/investor/index.epx)
for further information regarding the non-IFRS measures.
Any statements contained in this document that are not historical
facts are forward-looking statements as defined in the U.S. Private Securities Litigation Reform Act of 1995. Words such as "anticipate,"
"believe," "estimate," "expect," "forecast," "intend," "may," "plan,"
"project," "predict," "should" and "will" and similar expressions as they relate to SAP are intended
to identify such forward-looking statements. SAP undertakes no obligation to publicly update or revise any forward-looking statements.
All forward-looking statements are subject to various risks and uncertainties that could cause actual results to differ materially from
expectations. The factors that could affect SAP's future financial results are discussed more fully in SAP's filings with the U.S. Securities
and Exchange Commission (the "SEC"), including SAP's most recent Annual Report on Form 20-F filed with the SEC. Readers are
cautioned not to place undue reliance on these forward-looking statements, which speak only as of their dates.
This filing is also intended to fulfil the NYSE rules set forth in
Sections 103.00 and 203.03.
EXHIBITS
SIGNATURES
Pursuant to the requirements of the Securities Exchange Act of 1934,
the registrant has duly caused this report to be signed on its behalf by the undersigned, thereunto duly authorized.
| By: | /s/ Christopher Sessar |
| | | Name: |
Dr. Christopher Sessar |
| | | Title: |
Chief Accounting Officer |
| By: | /s/ Julia Zicke |
| | | Name: |
Dr. Julia Zicke |
| | | Title: |
Head of External Reporting and Accounting Technology |
Date: July 24, 2024
EXHIBIT INDEX
Exhibit 99.1
 | Quarterly
Statement Q2 2024 |
SAP
Announces Q2 2024 Results
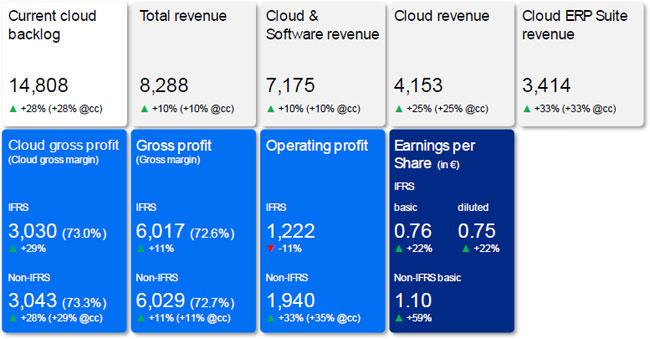
| • | Current
cloud backlog of €14.8 billion, up 28%, both at nominal and constant currencies |
| • | Cloud
revenue up 25%, underpinned by 33% Cloud ERP Suite revenue growth, all at nominal and constant
currencies |
| • | Total
revenue up 10%, both at nominal and constant currencies |
| • | IFRS
cloud gross profit up 29%, non-IFRS cloud gross profit up 28% and up 29% at constant currencies |
| • | IFRS
operating profit down 11% due to restructuring expenses of €0.6 billion. Non-IFRS operating
profit up 33% and up 35% at constant currencies |
| • | 2024
financial outlook reiterated. 2025 operating profit ambition increased to reflect anticipated
incremental efficiency gains from expanded transformation program |
in
€ millions, unless otherwise stated; based on SAP group results from continuing operations
| Quarterly
Statement Q2 2024 |
Walldorf,
Germany – July 22, 2024
SAP SE (NYSE: SAP) announced today its financial results for the second quarter
ended June 30, 2024.
Christian
Klein, CEO:
Our
cloud growth momentum remained strong in Q2, with Business AI enabling many deals. We continue to execute on our transformation
with great discipline, leading to an increase in our operating profit ambition for 2025. At the same time, we continue to invest
into our transformation to be the leader in Business AI. Given our progress and strong pipeline, we are confident to achieve accelerating
topline growth through 2027.
Dominik
Asam, CFO:
We
are staying squarely focused on delivering our outlook for this year. Our current cloud backlog growth during the second half
of 2024, and especially in Q4 will be decisive to lay a solid foundation for our cloud revenue ambition for 2025. At the same
time, we’ll continue to execute against our transformation plan to achieve our 2025 free cash flow ambition despite a mid-triple-digit
million cash out for restructuring spilling into next year.
All
figures in this statement are based on SAP group results from continuing operations unless otherwise noted.
Financial
Performance
Group
results at a glance – Second quarter 2024
| |
IFRS |
|
Non-IFRS1 |
| |
|
|
|
| €
million, unless otherwise stated |
Q2
2024 |
Q2
2023 |
∆
in % |
|
Q2
2024 |
Q2
2023 |
∆
in % |
∆
in %
const. curr. |
| SaaS/PaaS |
4,018 |
3,130 |
28 |
|
4,018 |
3,130 |
28 |
28 |
| Thereof
Cloud ERP Suite2 |
3,414 |
2,562 |
33 |
|
3,414 |
2,562 |
33 |
33 |
| Thereof
Extension Suite3 |
604 |
568 |
6 |
|
604 |
568 |
6 |
6 |
| IaaS4 |
135 |
186 |
–27 |
|
135 |
186 |
–27 |
–27 |
| Cloud
revenue |
4,153 |
3,316 |
25 |
|
4,153 |
3,316 |
25 |
25 |
| Cloud
and software revenue |
7,175 |
6,505 |
10 |
|
7,175 |
6,505 |
10 |
10 |
| Total
revenue |
8,288 |
7,554 |
10 |
|
8,288 |
7,554 |
10 |
10 |
| Share
of more predictable revenue (in %) |
84 |
82 |
2pp |
|
84 |
82 |
2pp |
|
| Cloud
gross profit |
3,030 |
2,357 |
29 |
|
3,043 |
2,368 |
28 |
29 |
| Gross
profit |
6,017 |
5,409 |
11 |
|
6,029 |
5,432 |
11 |
11 |
| Operating
profit (loss) |
1,222 |
1,371 |
–11 |
|
1,940 |
1,457 |
33 |
35 |
| Profit
(loss) after tax from continuing operations |
918 |
724 |
27 |
|
1,278 |
799 |
60 |
|
| Profit
(loss) after tax5 |
918 |
2,982 |
–69 |
|
1,278 |
2,437 |
–48 |
|
| Earnings
per share - Basic (in €) from continuing operations |
0.76 |
0.62 |
22 |
|
1.10 |
0.69 |
59 |
|
| Earnings
per share - Basic (in €)5 |
0.76 |
2.70 |
–72 |
|
1.10 |
2.40 |
–54 |
|
| Net
cash flows from operating activities from continuing operations |
1,540 |
848 |
82 |
|
|
|
|
|
| Free
cash flow |
|
|
|
|
1,291 |
604 |
>100 |
|
1
For a breakdown of the individual adjustments see table “Non-IFRS Operating Expense Adjustments by Functional Areas”
in this Quarterly Statement.
2
Cloud ERP Suite references the portfolio of strategic Software-as-a-Service (SaaS) and Platform-as-a-Service (PaaS) solutions
that are tightly integrated with our core ERP solutions and are included in key commercial packages, such as RISE with SAP. The
following offerings contribute to Cloud ERP Suite revenue: SAP S/4HANA Cloud, SAP Business Technology Platform, and core solutions
for HR and payroll, spend management, commerce, customer data solutions, business process transformation, and working capital
management. For additional information and historical data on Cloud ERP Suite, see SAP’s Reporting
Framework.
3
Extension Suite references SAP’s remaining SaaS and PaaS solutions that supplement and extend the functional coverage
of the Cloud ERP Suite.
4
Infrastructure as a service (IaaS): The major portion of IaaS comes from SAP HANA Enterprise Cloud.
5
From continuing and discontinued operations.
| Quarterly
Statement Q2 2024 |
Group
results at a glance – Six months ended June 2024
| |
IFRS |
|
Non-IFRS1 |
| €
million, unless otherwise stated |
Q1–Q2
2024 |
Q1–Q2
2023 |
∆
in % |
|
Q1–Q2
2024 |
Q1–Q2
2023 |
∆
in % |
∆
in %
const. curr. |
| SaaS/PaaS |
7,782 |
6,110 |
27 |
|
7,782 |
6,110 |
27 |
28 |
| Thereof
Cloud ERP Suite revenue2 |
6,581 |
4,984 |
32 |
|
6,581 |
4,984 |
32 |
33 |
| Thereof
Extension Suite revenue3 |
1,202 |
1,126 |
7 |
|
1,202 |
1,126 |
7 |
7 |
| IaaS4 |
299 |
383 |
–22 |
|
299 |
383 |
–22 |
–21 |
| Cloud
revenue |
8,082 |
6,493 |
24 |
|
8,082 |
6,493 |
24 |
25 |
| Cloud
and software revenue |
14,134 |
12,863 |
10 |
|
14,134 |
12,863 |
10 |
11 |
| Total
revenue |
16,329 |
14,995 |
9 |
|
16,329 |
14,995 |
9 |
10 |
| Share
of more predictable revenue (in %) |
84 |
82 |
2pp |
|
84 |
82 |
2pp |
|
| Cloud
gross profit |
5,867 |
4,596 |
28 |
|
5,892 |
4,617 |
28 |
29 |
| Gross
profit |
11,778 |
10,693 |
10 |
|
11,803 |
10,737 |
10 |
11 |
| Operating
profit (loss) |
434 |
2,174 |
–80 |
|
3,473 |
2,779 |
25 |
27 |
| Profit
(loss) after tax from continuing operations |
94 |
1,128 |
–92 |
|
2,223 |
1,667 |
33 |
|
| Profit
(loss) after tax5 |
94 |
3,491 |
–97 |
|
2,223 |
3,448 |
–36 |
|
| Earnings
per share - Basic (in €) from continuing operations |
0.05 |
0.97 |
–95 |
|
1.91 |
1.44 |
33 |
|
| Earnings
per share - Basic (in €)5 |
0.05 |
3.12 |
–98 |
|
1.91 |
3.23 |
–41 |
|
| Net
cash flows from operating activities from continuing operations |
4,297 |
3,160 |
36 |
|
|
|
|
|
| Free
cash flow |
|
|
|
|
3,784 |
2,559 |
48 |
|
1
For a breakdown of the individual adjustments see table “Non-IFRS Operating Expense Adjustments by Functional Areas”
in this Quarterly Statement.
2
Cloud ERP Suite references the portfolio of strategic Software-as-a-Service (SaaS) and Platform-as-a-Service (PaaS) solutions
that are tightly integrated with our core ERP solutions and are included in key commercial packages, such as RISE with SAP. The
following offerings contribute to Cloud ERP Suite revenue: SAP S/4HANA Cloud, SAP Business Technology Platform, and core solutions
for HR and payroll, spend management, commerce, customer data solutions, business process transformation, and working capital
management. For additional information and historical data on Cloud ERP Suite, see SAP’s Reporting
Framework.
3
Extension Suite references SAP’s remaining SaaS and PaaS solutions that supplement and extend the functional coverage
of the Cloud ERP Suite.
4
Infrastructure as a service (IaaS): The major portion of IaaS comes from SAP HANA Enterprise Cloud.
5
From continuing and discontinued operations.
Financial
Highlights1
Second
Quarter 2024
In
the second quarter, SAP’s strong cloud momentum continued. Current cloud backlog grew by 28% to €14.81 billion and
again was up 28% at constant currencies. Cloud revenue was up 25% to €4.15 billion and up 25% at constant currencies, mainly
driven by Cloud ERP Suite revenue, which was up 33% to €3.41 billion and up 33% at constant currencies.
Software
licenses revenue decreased by 28% to €0.2 billion and was down 27% at constant currencies. Cloud and software revenue was
up 10% to €7.17 billion and up 10% at constant currencies. Services revenue was up 6% to €1.11 billion and up 6% at
constant currencies. Total revenue was up 10% to €8.29 billion and up 10% at constant currencies.
The
share of more predictable revenue increased by 2 percentage points to 84% in the second quarter.
Cloud
gross profit was up 29% (IFRS) to €3.03 billion, up 28% to €3.04 billion (non-IFRS), and up 29% (non-IFRS at constant
currencies).
IFRS
operating profit in the second quarter was down 11% to €1.22 billion. The decrease was driven by restructuring expenses of
€0.6 billion associated with the 2024 transformation program. Non-IFRS operating profit was up 33% to €1.94 billion
and was up 35% at constant currencies. Non-IFRS operating profit growth was supported by strong revenue growth as well as disciplined
execution of the 2024 transformation program.
1
The Q2 2024 results were also impacted by
other effects. For details, please refer to the disclosures on page 27 of this document.
| Quarterly
Statement Q2 2024 |
IFRS
earnings per share (basic) increased 22% to €0.76. Non-IFRS earnings per share (basic) increased 59% to €1.10. The effective
tax rate (IFRS) was 33.8% (Q2/2023: 33.8%) and the effective tax rate (non-IFRS) was 33.6% (Q2/2023: 33.0%). For non-IFRS, the
year-over-year increase mainly resulted from a temporary inability to offset withholding taxes in Germany due to tax losses in
2024 resulting from restructuring. For IFRS, the negative effects from withholding taxes were compensated mainly by changes in
tax-exempt income and valuation allowances on deferred tax assets.
Free
cash flow in the second quarter increased by 114% to €1.3 billion. While around €0.5 billion was paid out for restructuring,
the positive development was primarily attributable to increased profitability and enhanced working capital management. For the
first six months, free cash flow was up 48% to €3.8 billion.
Share
Repurchase Program
In
May 2023, SAP announced a share repurchase program with an aggregate volume of up to €5 billion and a term until December
31, 2025. As of June 30, 2024, SAP had repurchased 12,895,525 shares at an average price of €145.20 resulting in a purchased
volume of approximately €1.87 billion under the program.
2024
Transformation Program: Focus on scalability of operations and key strategic growth areas
In
2024, SAP is further increasing its focus on key strategic growth areas, in particular business AI. It is transforming its operational
setup to capture organizational synergies and AI-driven efficiencies, and to prepare the company for highly scalable future revenue
growth.
To
this end, as announced in January, SAP is executing a company-wide restructuring program which is anticipated to conclude in early
2025. The restructuring is intended to ensure that SAP’s skillset and resources continue to meet future business needs and
is currently expected to affect 9,000 to 10,000 positions, a majority of which will be covered by voluntary leave programs and
internal re-skilling measures. Reflecting re-investments into strategic growth areas, SAP still expects to exit 2024 at a headcount
similar to year-end 2023.
In
the second quarter, additional restructuring expenses of €0.6 billion were recorded, which mainly reflect the positive reception
of the voluntary leave programs.
While
restructuring expenses recorded in the first half of 2024 total €2.9 billion, the overall expenses associated with the program
are now estimated to be approximately €3 billion.
Restructuring
payouts in the second quarter and first half of 2024 amounted to €0.5 billion. Overall payouts associated with the program
are currently expected at approximately €3 billion, of which a mid-triple-digit million amount is expected to occur in 2025.
| Quarterly
Statement Q2 2024 |
Business
Highlights
In
the second quarter, customers around the globe continued to choose “RISE with SAP”
to drive their end-to-end business transformations. These customers included: Alpargatas,
Auckland Council, Blue Diamond Growers, Border States, Copenhagen Airports, ExxonMobil,
Navantia, PANDORA, Porsche Informatik, Powerlink Queensland, Prairie Farms Dairy, ProRail,
Prysmian, Shiseido Company, Tokio Marine & Nichido Fire Insurance, VistaPrint, Warsaw
City Hall, and Xerox.
BMI
Group Holdings, Co-op, Fiagril, Pure Storage, UBE Corporation, and Wegmans went live on SAP S/4HANA Cloud in the second quarter.
Consolidated
Hospitality Supplies, flatexDEGIRO, Fortera Corporation, La Trobe University, Stern-Wywiol Gruppe, and Trade Capital Corporation
chose “GROW with SAP”, an offering helping customers adopt cloud ERP with speed, predictability, and continuous innovation.
Key
customer wins across SAP’s solution portfolio included: Accenture, Ambipar, Arca Continental, BASF, Buderus Guss, Carl Zeiss,
DACHSER, Endress+Hauser, iHerb, Lenovo, Minor Hotels, New Look, Parle Biscuits, Refresco, U.S. Sugar, Veolia Group, and Zoomlion.
Beiersdorf,
E.ON, Gerdau, Hyundai Motor Company, Kia Corporation and SMA Solar Technology went live on SAP solutions.
In
the second quarter, SAP’s cloud revenue performance was particularly strong in APJ and EMEA and robust in the Americas region.
Brazil, Canada, Germany, India, Japan, and South Korea had outstanding performances in cloud revenue growth while China, the U.S.,
and Saudi Arabia were particularly strong.
On
April 22, SAP announced AI advancements in its supply chain solutions that we anticipate will unleash a transformative wave of
productivity, efficiency and precision in manufacturing. AI-driven insights from real-time data will help companies use their
own data to make better decisions across supply chains, streamline product development and improve manufacturing efficiency.
On
May 6, SAP announced that it had extended the contract of CEO and Member of the Executive Board Christian Klein for three years,
until April 2028.
On
May 8, SAP and IBM announced their vision for the next era of their collaboration, which includes new generative AI capabilities
and industry-specific cloud solutions that can help clients unlock business value.
On
May 13, SAP announced that Charoen Pokphand Foods Public Company Limited (“CP Foods”) had selected multiple SAP solutions
to drive further growth and competitive advantage and to ensure the sustainability of its products for the future.
On
May 15, SAP announced that the Annual General Meeting (AGM) of Shareholders of SAP SE elected Pekka Ala-Pietilä as new member
of the company’s Supervisory Board. Subsequently, Ala-Pietilä was also elected the new Chairman of the SAP Supervisory
Board, completing the handover from former Chairman of the Board, Prof. Dr. h. c. mult. Hasso Plattner. In addition, Prof. Dr.
Ralf Herbrich was elected and Aicha Evans, Gerhard Oswald and Dr. Friederike Rotsch were reelected as members of the Supervisory
Board. The AGM also approved all other proposals of the Executive Board and Supervisory Board with strong support. That includes
the adjustment of the compensation of the Chairman of the Supervisory Board. Furthermore, the dividend proposal of €2.20
per share for fiscal year 2023 was approved.
On
May 29, SAP and Amazon Web Services (AWS), an Amazon.com company, announced an expanded, strategic collaboration to transform
modern cloud enterprise resource planning (ERP) experiences and help enterprises drive new capabilities and efficiencies with
generative artificial intelligence (AI).
On
June 5, SAP and WalkMe Ltd. (Walkme) announced that the companies had entered into a definitive agreement under which SAP will
acquire 100% of WalkMe, a leader in digital adoption platforms. The Executive and Supervisory Boards of SAP SE and the board of
directors of WalkMe have approved the transaction for US $14.00 per share in an all-cash transaction, representing an equity value
of approximately US $1.5 billion. The offer price represents a 45% premium to WalkMe’s closing share price on June 4, 2024.
The acquisition is subject to customary closing conditions, including the receipt of WalkMe shareholder approval and necessary
regulatory clearances, and is expected to close in the third quarter of 2024.
On
June 5, SAP announced that it was adjusting its dividend policy effective immediately. The new policy is to pay a dividend amounting
to at least 40% of the group’s non-IFRS profit after tax from continuing operations (previously: at least 40% of the group’s
IFRS profit after tax).
| Quarterly
Statement Q2 2024 |
Financial
Outlook 2024
SAP’s
financial outlook 2024 is based on SAP’s updated non-IFRS definition of profit measures which, beginning in 2024, include
share-based compensation expenses and exclude gains and losses from equity securities, net. For more details, please refer to
the Reporting Framework section on our Investor Relations website: https://www.sap.com/investors/en/reports/reporting-framework.html.
SAP
continues to expect:
| • | €17.0
– 17.3 billion cloud revenue at constant currencies (2023: €13.66 billion),
up 24% to 27% at constant currencies. |
| • | €29.0
– 29.5 billion cloud and software revenue at constant currencies (2023: €26.92
billion), up 8% to 10% at constant currencies. |
| • | €7.6
– 7.9 billion non-IFRS operating profit at constant currencies (2023: €6.51
billion), up 17% to 21% at constant currencies. |
| • | Free
cash flow of approximately €3.5 billion (2023: €5.09 billion). |
| • | An
effective tax rate (non-IFRS) of approximately 32% (2023: 30.3%)2. |
While
SAP’s 2024 financial outlook is at constant currencies, actual currency reported figures are expected to be impacted by
currency exchange rate fluctuations as the company progresses through the year, as reflected in the table below.
Currency
Impact Assuming June 30, 2024 Rates Apply for 2024
| In
percentage points |
Q3
2024 |
FY
2024 |
| Cloud
revenue growth |
+0.5pp |
–0.5pp |
| Cloud
and software revenue growth |
+0.5pp |
–0.5pp |
| Operating
profit growth (non-IFRS) |
+0.0pp |
–1.5pp |
Non-Financial
Outlook 2024
SAP
now expects the Employee Engagement Index to be in a range of 70% to 74% in 2024 (previously: 76% to 80%).
In
2024, SAP continues to expect:
| • | A
Customer Net Promoter Score of 9 to 13. |
| • | To
steadily decrease carbon emissions across the relevant value chain, in line with our
target of achieving Net Zero carbon emissions by 2030. |
| • | To
steadily increase the number of women in executive roles in line with our end of year
2027 target to achieve 25%. |
Ambition
2025
SAP
is updating its financial ambition 2025, reflecting the anticipated incremental benefits from the transformation program.
By
2025, SAP now expects:
| • | Non-IFRS
operating profit of approximately €10.2 billion (previously: approximately €10
billion). |
SAP
continues to expect:
| • | Cloud
revenue of more than €21.5 billion. |
| • | Total
revenue of more than €37.5 billion. |
| • | Non-IFRS
cloud gross profit of approximately €16.2 billion. |
| • | Free
cash flow of approximately €8.0 billion (now including an anticipated mid-triple-digit
million Euro restructuring payout in 2025 associated with the 2024 transformation program). |
2
The effective tax rate (non-IFRS) is a non-IFRS financial measure and is presented for supplemental informational purposes
only. We do not provide an outlook for the effective tax rate (IFRS) due to the uncertainty and potential variability of gains
and losses associated with equity securities, which are reconciling items between the two effective tax rates (non-IFRS and IFRS).
These items cannot be provided without unreasonable efforts but could have a significant impact on our future effective tax rate
(IFRS).
| Quarterly
Statement Q2 2024 |
| • | A
share of more predictable revenue of approximately 86%. |
The
2025 financial ambition is based on an exchange rate of 1.10 USD per EUR.
Non-Financial
Ambition 2025
For
2025, SAP now aims to increase the Employee Engagement Index (previously: Steadily increasing the Employee Engagement Index).
SAP
continues to aim for
| • | Steadily
increasing the Customer Net Promoter Score. |
The
2025 non-financial ambitions are in addition to our medium-term targets of achieving Net Zero carbon emissions across the value
chain by 2030 and reaching 25% women in executive roles by the end of 2027.
| Quarterly
Statement Q2 2024 |
Additional
Information
This
press release and all information therein is preliminary and unaudited. Due to rounding, numbers may not add up precisely.
SAP
Performance Measures
For
more information about our key growth metrics and performance measures, their calculation, their usefulness, and their limitations,
please refer to the following document on our Investor Relations website: https://www.sap.com/investors/performance-measures
Webcast
SAP
senior management will host a financial analyst conference call on Monday, July 22nd at 11:00 PM (CEST) / 10:00 PM (BST) /
5:00 PM (EDT) / 2:00 PM (PDT). The conference will be webcast on the Company’s website at https://www.sap.com/investor
and will be available for replay. Supplementary financial information pertaining to the second quarter results can be found
at https://www.sap.com/investor
About
SAP
As a
global leader in enterprise applications and business AI, SAP (NYSE: SAP) stands at the nexus of business and
technology. For over 50 years, organizations have trusted SAP to bring out their best by uniting business-critical operations
spanning finance, procurement, HR, supply chain, and customer experience. For more information, visit www.sap.com.
For
more information, financial community only:
| Alexandra
Steiger |
+49
(6227) 7-767336 |
investor@sap.com,
CET |
Follow
SAP Investor Relations on LinkedIn at SAP Investor Relations.
For
more information, press only:
| Joellen
Perry |
+1
(650) 445-6780 |
joellen.perry@sap.com,
PT |
| Daniel
Reinhardt |
+49
(6227) 7-40201 |
daniel.reinhardt@sap.com,
CET |
For
customers interested in learning more about SAP products:
| Global
Customer Center: |
+49
180 534-34-24 |
| United
States Only: |
+1
(800) 872-1SAP (+1-800-872-1727) |
Note
to editors:
To
preview and download broadcast-standard stock footage and press photos digitally, please visit www.sap.com/photos.
On this platform, you can find high resolution material for your media channels.
This
document contains forward-looking statements, which are predictions, projections, or other statements about future events. These
statements are based on current expectations, forecasts, and assumptions that are subject to risks and uncertainties that could
cause actual results and outcomes to materially differ. Additional information regarding these risks and uncertainties may be
found in our filings with the Securities and Exchange Commission, including but not limited to the risk factors section of SAP’s
2023 Annual Report on Form 20-F.
©
2024 SAP SE. All rights reserved.
SAP and other SAP products and services mentioned herein as well as their respective logos are trademarks or registered trademarks
of SAP SE in Germany and other countries. Please see https://www.sap.com/copyright
for additional trademark information and notices
| Quarterly
Statement Q2 2024 |
Contents
| |
Quarterly
Statement Q2 2024 |
Financial
and Non-Financial Key Facts
(IFRS and Non-IFRS)
| €
millions, unless otherwise stated |
Q1
2023 |
Q2
2023 |
Q3
2023 |
Q4
2023 |
TY
2023 |
Q1
2024 |
Q2
2024 |
| Revenues |
|
|
|
|
|
|
|
| Cloud |
3,178 |
3,316 |
3,472 |
3,699 |
13,664 |
3,928 |
4,153 |
| %
change – yoy |
24 |
19 |
16 |
20 |
20 |
24 |
25 |
| %
change constant currency – yoy |
22 |
22 |
23 |
25 |
23 |
25 |
25 |
| Cloud
ERP Suite |
2,422 |
2,562 |
2,711 |
2,931 |
10,626 |
3,167 |
3,414 |
| %
change – yoy |
35 |
30 |
26 |
28 |
29 |
31 |
33 |
| %
change constant currency – yoy |
33 |
33 |
34 |
33 |
33 |
32 |
33 |
| Software
licenses |
276 |
316 |
335 |
838 |
1,764 |
203 |
229 |
| %
change – yoy |
–13 |
–26 |
–17 |
–8 |
–14 |
–26 |
–28 |
| %
change constant currency – yoy |
–13 |
–24 |
–14 |
–6 |
–12 |
–25 |
–27 |
| Software
support |
2,905 |
2,873 |
2,872 |
2,846 |
11,496 |
2,829 |
2,792 |
| %
change – yoy |
–1 |
–3 |
–5 |
–5 |
–3 |
–3 |
–3 |
| %
change constant currency – yoy |
–1 |
–1 |
–1 |
–1 |
–1 |
–1 |
–3 |
| Software
licenses and support |
3,180 |
3,189 |
3,208 |
3,683 |
13,261 |
3,031 |
3,021 |
| %
change – yoy |
–2 |
–6 |
–6 |
–6 |
–5 |
–5 |
–5 |
| %
change constant currency – yoy |
–2 |
–4 |
–2 |
–2 |
–3 |
–4 |
–5 |
| Cloud
and software |
6,358 |
6,505 |
6,679 |
7,382 |
26,924 |
6,960 |
7,175 |
| %
change – yoy |
10 |
5 |
4 |
6 |
6 |
9 |
10 |
| %
change constant currency – yoy |
8 |
8 |
9 |
10 |
9 |
11 |
10 |
| Total
revenue |
7,441 |
7,554 |
7,744 |
8,468 |
31,207 |
8,041 |
8,288 |
| %
change – yoy |
10 |
5 |
4 |
5 |
6 |
8 |
10 |
| %
change constant currency – yoy |
9 |
8 |
9 |
9 |
9 |
9 |
10 |
| Share
of more predictable revenue (in %) |
82 |
82 |
82 |
77 |
81 |
84 |
84 |
| Profits |
|
|
|
|
|
|
|
| Operating
profit (loss) (IFRS) |
803 |
1,371 |
1,723 |
1,902 |
5,799 |
–787 |
1,222 |
| Operating
profit (loss) (non-IFRS) |
1,321 |
1,457 |
1,767 |
1,969 |
6,514 |
1,533 |
1,940 |
| %
change |
–15 |
14 |
7 |
1 |
1 |
16 |
33 |
| %
change constant currency |
–15 |
19 |
13 |
5 |
5 |
19 |
35 |
| Profit
(loss) after tax (IFRS) |
403 |
724 |
1,272 |
1,201 |
3,600 |
–824 |
918 |
| Profit
(loss) after tax (non-IFRS) |
868 |
799 |
1,352 |
1,302 |
4,321 |
944 |
1,278 |
| %
change |
–20 |
–9 |
13 |
–10 |
–6 |
9 |
60 |
| Margins |
|
|
|
|
|
|
|
| Cloud
gross margin (IFRS, in %) |
70.5 |
71.1 |
72.7 |
71.9 |
71.6 |
72.2 |
73.0 |
| Cloud
gross margin (non-IFRS, in %) |
70.8 |
71.4 |
73.0 |
72.2 |
71.9 |
72.5 |
73.3 |
| Software
license and support gross margin (IFRS, in %) |
88.6 |
89.8 |
90.0 |
89.8 |
89.6 |
89.2 |
89.7 |
| Software
license and support gross margin (non-IFRS, in %) |
88.9 |
90.2 |
90.1 |
89.8 |
89.8 |
89.2 |
89.7 |
| Cloud
and software gross margin (IFRS, in %) |
79.5 |
80.3 |
81.0 |
80.8 |
80.4 |
79.6 |
80.0 |
| Cloud
and software gross margin (non-IFRS, in %) |
79.9 |
80.6 |
81.2 |
81.0 |
80.7 |
79.8 |
80.2 |
| Gross
margin (IFRS, in %) |
71.0 |
71.6 |
72.8 |
73.3 |
72.2 |
71.7 |
72.6 |
| Gross
margin (non-IFRS, in %) |
71.3 |
71.9 |
73.0 |
73.4 |
72.4 |
71.8 |
72.7 |
| Operating
margin (IFRS, in %) |
10.8 |
18.2 |
22.2 |
22.5 |
18.6 |
–9.8 |
14.7 |
| |
Quarterly
Statement Q2 2024 |
| €
millions, unless otherwise stated |
Q1
2023 |
Q2
2023 |
Q3
2023 |
Q4
2023 |
TY
2023 |
Q1
2024 |
Q2
2024 |
| Operating
margin (non-IFRS, in %) |
17.8 |
19.3 |
22.8 |
23.3 |
20.9 |
19.1 |
23.4 |
| Key
Profit Ratios |
|
|
|
|
|
|
|
| Effective
tax rate (IFRS, in %) |
40.5 |
33.8 |
27.8 |
33.6 |
32.6 |
16.0 |
33.8 |
| Effective
tax rate (non-IFRS, in %) |
29.1 |
33.0 |
27.1 |
32.5 |
30.3 |
32.4 |
33.6 |
| |
|
|
|
|
|
|
|
| Earnings
per share, basic (IFRS, in €) from continuing operations |
0.35 |
0.62 |
1.09 |
1.05 |
3.11 |
–0.71 |
0.76 |
| Earnings
per share, basic (non-IFRS, in €) from continuing operations |
0.75 |
0.69 |
1.16 |
1.12 |
3.72 |
0.81 |
1.10 |
| Earnings
per share, basic (IFRS, in €)1 |
0.41 |
2.70 |
1.09 |
1.05 |
5.26 |
–0.71 |
0.76 |
| Earnings
per share, basic (non-IFRS, in €)1 |
0.83 |
2.40 |
1.16 |
1.12 |
5.51 |
0.81 |
1.10 |
| Order
Entry and current cloud backlog |
|
|
|
|
|
|
|
| Current
cloud backlog |
11,148 |
11,537 |
12,269 |
13,745 |
13,745 |
14,179 |
14,808 |
| %
change – yoy |
25 |
21 |
19 |
25 |
25 |
27 |
28 |
| %
change constant currency – yoy |
25 |
25 |
25 |
27 |
27 |
28 |
28 |
| Share
of cloud orders greater than €5 million based on total cloud order entry volume (in %) |
45 |
46 |
49 |
62 |
55 |
52 |
52 |
| Share
of cloud orders smaller than €1 million based on total cloud order entry volume (in %) |
26 |
25 |
21 |
14 |
19 |
21 |
20 |
| Liquidity
and Cash Flow |
|
|
|
|
|
|
|
| Net
cash flows from operating activities |
2,311 |
848 |
1,124 |
1,926 |
6,210 |
2,757 |
1,540 |
| Purchase
of intangible assets and property, plant, and equipment |
–257 |
–156 |
–182 |
–190 |
–785 |
–187 |
–178 |
| Payments
of lease liabilities |
–99 |
–89 |
–78 |
–66 |
–332 |
–78 |
–70 |
| Free
cash flow |
1,955 |
604 |
865 |
1,670 |
5,093 |
2,492 |
1,291 |
| %
of total revenue |
26 |
8 |
11 |
20 |
16 |
31 |
16 |
| %
of profit after tax (IFRS) |
485 |
83 |
68 |
139 |
141 |
N/A |
141 |
| Cash
and cash equivalents |
8,766 |
14,142 |
9,378 |
8,124 |
8,124 |
9,295 |
7,870 |
| Group
liquidity |
9,700 |
14,326 |
12,122 |
11,275 |
11,275 |
13,411 |
11,449 |
| Financial
debt (–) |
–10,751 |
–10,146 |
–8,445 |
–7,755 |
–7,755 |
–7,770 |
–7,776 |
| Net
liquidity (+) / Net debt(–) |
–1,050 |
4,180 |
3,677 |
3,521 |
3,521 |
5,641 |
3,674 |
| Non-Financials |
|
|
|
|
|
|
|
| Number
of employees (quarter end)2 |
105,132 |
105,328 |
106,495 |
107,602 |
107,602 |
108,133 |
105,315 |
| Employee
retention (in %, rolling 12 months) |
93.8 |
95.1 |
96.0 |
96.4 |
96.4 |
96.6 |
96.6 |
| Women
in management (in %, quarter end) |
29.4 |
29.5 |
29.5 |
29.7 |
29.7 |
29.8 |
29.9 |
| Women
in executive roles (in %, quarter end) |
21.8 |
21.9 |
22.1 |
22.2 |
22.2 |
21.7 |
21.9 |
Gross
greenhouse gas emissions (scope 1, 2, 3 / market-based)3
(in
million tons CO2 equivalents) |
|
|
|
|
6.9 |
1.8 |
1.8 |
1 From
continuing and discontinued operations.
2 In
full-time equivalents.
3 Our
gross greenhouse gas emissions (GHG) – which cover scope 1, scope 2, and scope 3 (market based) – include the total
lifecycle emissions resulting from the use of our on-premise software. A projection over the next 12 months amounts to 5.9 million
tons CO2e. The calculation of use of sold products emissions is based on the number of active maintenance contracts
at quarter end. Therefore, the emissions for individual quarters will not add up to the total sum of GHG emissions at year end.
| |
Quarterly
Statement Q2 2024 |
Primary
Financial Statements of SAP Group (IFRS)
| (A) | Consolidated
Income Statements |
| (A.1) | Consolidated
Income Statements – Quarter |
| €
millions, unless otherwise stated |
|
Q2
2024 |
Q2
2023 |
∆
in % |
| Cloud |
|
4,153 |
3,316 |
25 |
| Software
licenses |
|
229 |
316 |
–28 |
| Software
support |
|
2,792 |
2,873 |
–3 |
| Software
licenses and support |
|
3,021 |
3,189 |
–5 |
| Cloud
and software |
|
7,175 |
6,505 |
10 |
| Services |
|
1,114 |
1,050 |
6 |
| Total
revenue |
|
8,288 |
7,554 |
10 |
| |
|
|
|
|
| Cost
of cloud |
|
–1,123 |
–959 |
17 |
| Cost
of software licenses and support |
|
–311 |
–324 |
–4 |
| Cost
of cloud and software |
|
–1,434 |
–1,282 |
12 |
| Cost
of services |
|
–837 |
–863 |
–3 |
| Total
cost of revenue |
|
–2,272 |
–2,145 |
6 |
| Gross
profit |
|
6,017 |
5,409 |
11 |
| Research
and development |
|
–1,605 |
–1,565 |
3 |
| Sales
and marketing |
|
–2,217 |
–2,165 |
2 |
| General
and administration |
|
–336 |
–322 |
4 |
| Restructuring |
|
–631 |
3 |
N/A |
| Other
operating income/expense, net |
|
–5 |
11 |
N/A |
| Total
operating expenses |
|
–7,067 |
–6,183 |
14 |
| Operating
profit (loss) |
|
1,222 |
1,371 |
–11 |
| |
|
|
|
|
| Other
non-operating income/expense, net |
|
–5 |
–102 |
–95 |
| Finance
income |
|
412 |
187 |
>100 |
| Finance
costs |
|
–242 |
–363 |
–33 |
| Financial
income, net |
|
170 |
–175 |
N/A |
| Profit
(loss) before tax from continuing operations |
|
1,387 |
1,093 |
27 |
| |
|
|
|
|
| Income
tax expense |
|
–469 |
–369 |
27 |
| Profit
(loss) after tax from continuing operations |
|
918 |
724 |
27 |
| Attributable
to owners of parent |
|
888 |
728 |
22 |
| Attributable
to non-controlling interests |
|
30 |
–4 |
N/A |
| Profit
(loss) after tax from discontinued operations |
|
0 |
2,257 |
N/A |
| Profit
(loss) after tax2 |
|
918 |
2,982 |
–69 |
| Attributable
to owners of parent2 |
|
888 |
3,161 |
–72 |
| Attributable
to non-controlling interests2 |
|
30 |
–179 |
N/A |
| |
|
|
|
|
| Earnings
per share, basic (in €)1 from continuing operations |
|
0.76 |
0.62 |
22 |
| Earnings
per share, basic (in €)1, 2 |
|
0.76 |
2.70 |
–72 |
| Earnings
per share, diluted (in €)1 from continuing operations |
|
0.75 |
0.62 |
22 |
| Earnings
per share, diluted (in €)1, 2 |
|
0.75 |
2.68 |
–72 |
1
For the three months ended June 30, 2024 and 2023, the weighted average number of shares was 1,166 million (diluted 1,178 million)
and 1,169 million
(diluted: 1,180 million), respectively (treasury stock excluded).
2
From continuing and discontinued operations
| |
Quarterly
Statement Q2 2024 |
(A.2) Consolidated
Income Statements – Year-to-Date
| €
millions, unless otherwise stated |
|
Q1–Q2
2024 |
Q1–Q2
2023 |
∆
in % |
| Cloud |
|
8,082 |
6,493 |
24 |
| Software
licenses |
|
432 |
591 |
–27 |
| Software
support |
|
5,621 |
5,778 |
–3 |
| Software
licenses and support |
|
6,053 |
6,369 |
–5 |
| Cloud
and software |
|
14,134 |
12,863 |
10 |
| Services |
|
2,195 |
2,132 |
3 |
| Total
revenue |
|
16,329 |
14,995 |
9 |
| |
|
|
|
|
| Cost
of cloud |
|
–2,214 |
–1,897 |
17 |
| Cost
of software licenses and support |
|
–637 |
–687 |
–7 |
| Cost
of cloud and software |
|
–2,851 |
–2,584 |
10 |
| Cost
of services |
|
–1,699 |
–1,718 |
–1 |
| Total
cost of revenue |
|
–4,550 |
–4,301 |
6 |
| Gross
profit |
|
11,778 |
10,693 |
10 |
| Research
and development |
|
–3,270 |
–3,138 |
4 |
| Sales
and marketing |
|
–4,496 |
–4,457 |
1 |
| General
and administration |
|
–696 |
–670 |
4 |
| Restructuring |
|
–2,873 |
–257 |
>100 |
| Other
operating income/expense, net |
|
–9 |
3 |
N/A |
| Total
operating expenses |
|
–15,894 |
–12,820 |
24 |
| Operating
profit (loss) |
|
434 |
2,174 |
–80 |
| |
|
|
|
|
| Other
non-operating income/expense, net |
|
–153 |
–116 |
32 |
| Finance
income |
|
611 |
369 |
65 |
| Finance
costs |
|
–486 |
–656 |
–26 |
| Financial
income, net |
|
125 |
–287 |
N/A |
| Profit
(loss) before tax from continuing operations |
|
407 |
1,771 |
–77 |
| |
|
|
|
|
| Income
tax expense |
|
–313 |
–643 |
–51 |
| Profit
(loss) after tax from continuing operations |
|
94 |
1,128 |
–92 |
| Attributable
to owners of parent |
|
60 |
1,135 |
–95 |
| Attributable
to non-controlling interests |
|
34 |
–7 |
N/A |
| Profit
(loss) after tax from discontinued operations |
|
0 |
2,363 |
N/A |
| Profit
(loss) after tax2 |
|
94 |
3,491 |
–97 |
| Attributable
to owners of parent2 |
|
60 |
3,640 |
–98 |
| Attributable
to non-controlling interests2 |
|
34 |
–149 |
N/A |
| |
|
|
|
|
| Earnings
per share, basic (in €)1 from continuing operations |
|
0.05 |
0.97 |
–95 |
| Earnings
per share, basic (in €)1, 2 |
|
0.05 |
3.12 |
–98 |
| Earnings
per share, diluted (in €)1 from continuing operations |
|
0.05 |
0.97 |
–95 |
| Earnings
per share, diluted (in €)1, 2 |
|
0.05 |
3.09 |
–98 |
1 For
the six months ended June 30, 2024 and 2023, the weighted average number of shares was 1,167 million (diluted:
1,178 million) and 1,168 million (diluted: 1,176 million), respectively (treasury stock excluded).
2 From continuing and discontinued operations
| |
Quarterly
Statement Q2 2024 |
(B) Consolidated
Statements of Financial Position
| as
at 06/30/2024 and 12/31/2023 |
| €
millions |
2024 |
2023 |
| Cash
and cash equivalents |
7,870 |
8,124 |
| Other
financial assets |
3,808 |
3,344 |
| Trade
and other receivables |
6,148 |
6,322 |
| Other
non-financial assets |
2,531 |
2,374 |
| Tax
assets |
539 |
407 |
| Total
current assets |
20,896 |
20,571 |
| Goodwill |
29,777 |
29,088 |
| Intangible
assets |
2,365 |
2,505 |
| Property,
plant, and equipment |
4,255 |
4,276 |
| Other
financial assets |
6,109 |
5,543 |
| Trade
and other receivables |
121 |
203 |
| Other
non-financial assets |
3,515 |
3,573 |
| Tax
assets |
346 |
382 |
| Deferred
tax assets |
2,993 |
2,193 |
| Total
non-current assets |
49,482 |
47,763 |
| Total
assets |
70,378 |
68,335 |
| |
| €
millions |
2024 |
2023 |
| Trade
and other payables |
1,875 |
1,783 |
| Tax
liabilities |
439 |
266 |
| Financial
liabilities |
2,271 |
1,735 |
| Other
non-financial liabilities |
4,002 |
5,648 |
| Provisions |
2,341 |
235 |
| Contract
liabilities |
7,734 |
4,975 |
| Total
current liabilities |
18,662 |
14,642 |
| Trade
and other payables |
20 |
39 |
| Tax
liabilities |
818 |
877 |
| Financial
liabilities |
7,321 |
7,941 |
| Other
non-financial liabilities |
850 |
698 |
| Provisions |
444 |
433 |
| Deferred
tax liabilities |
267 |
265 |
| Contract
liabilities |
55 |
33 |
| Total
non-current liabilities |
9,774 |
10,286 |
| Total
liabilities |
28,436 |
24,928 |
| Issued
capital |
1,229 |
1,229 |
| Share
premium |
2,263 |
1,845 |
| Retained
earnings |
39,953 |
42,457 |
| Other
components of equity |
3,519 |
2,368 |
| Treasury
shares |
–5,311 |
–4,741 |
| Equity
attributable to owners of parent |
41,652 |
43,157 |
| |
|
|
| Non-controlling
interests |
289 |
249 |
| Total
equity |
41,942 |
43,406 |
| Total
equity and liabilities |
70,378 |
68,335 |
| |
Quarterly
Statement Q2 2024 |
(C) Consolidated
Statements of Cash Flows
| €
millions |
Q1–Q2
2024 |
Q1–Q2
2023 |
| Profit
(loss) after tax |
94 |
3,890 |
| Adjustments
to reconcile profit (loss) after tax to net cash flows from operating activities: |
|
|
| (Profit)
loss after tax from discontinued operations |
0 |
–2,763 |
| Depreciation
and amortization |
626 |
714 |
| Share-based
payment expense |
1,280 |
1,167 |
| Income
tax expense |
313 |
643 |
| Financial
income, net |
–125 |
287 |
| Decrease/increase
in allowances on trade receivables |
–23 |
5 |
| Other
adjustments for non-cash items |
110 |
76 |
| Increase/decrease
in trade and other receivables |
372 |
396 |
| Decrease/increase
in other assets |
–17 |
–600 |
| Increase/decrease
in trade payables, provisions, and other liabilities |
876 |
–896 |
| Increase/decrease
in contract liabilities |
2,718 |
2,109 |
| Share-based
payments |
–778 |
–697 |
| Interest
paid |
–378 |
–244 |
| Interest
received |
287 |
197 |
| Income
taxes paid, net of refunds |
–1,057 |
–1,127 |
| Net cash
flows from operating activities – continuing operations |
4,297 |
3,160 |
| Net cash
flows from operating activities – discontinued operations |
0 |
80 |
| Net
cash flows from operating activities |
4,297 |
3,240 |
| Business
combinations, net of cash and cash equivalents acquired |
–19 |
0 |
| Cash
flows from derivative financial instruments related to the sale of subsidiaries or businesses |
0 |
–91 |
| Purchase
of intangible assets and property, plant, and equipment |
–365 |
–413 |
| Proceeds
from sales of intangible assets and property, plant, and equipment |
55 |
43 |
| Purchase
of equity or debt instruments of other entities |
–7,987 |
–220 |
| Proceeds
from sales of equity or debt instruments of other entities |
7,370 |
722 |
| Net cash
flows from investing activities – continuing operations |
–947 |
41 |
| Net cash
flows from investing activities – discontinued operations |
0 |
6,323 |
| Net
cash flows from investing activities |
–947 |
6,364 |
| Dividends
paid |
–2,565 |
–2,395 |
| Dividends
paid on non-controlling interests |
–6 |
–18 |
| Purchase
of treasury shares |
–975 |
0 |
| Proceeds
from borrowings |
1 |
0 |
| Repayments
of borrowings |
–14 |
–1,724 |
| Payments
of lease liabilities |
–148 |
–188 |
| Transactions
with non-controlling interests |
0 |
43 |
| Net cash
flows from financing activities – continuing operations |
–3,708 |
–4,283 |
| Net cash
flows from financing activities – discontinued operations |
0 |
24 |
| Net
cash flows from financing activities |
–3,708 |
–4,259 |
| Effect
of foreign currency rates on cash and cash equivalents |
104 |
–212 |
| Net
decrease/increase in cash and cash equivalents |
–254 |
5,134 |
| Cash
and cash equivalents at the beginning of the period |
8,124 |
9,008 |
| Cash
and cash equivalents at the end of the period |
7,870 |
14,142 |
| |
Quarterly
Statement Q2 2024 |
Non-IFRS
Numbers
| (D) | Basis
of Non-IFRS Presentation |
SAP
disclose certain financial measures such as expense (non-IFRS) and profit measures (non-IFRS) that are not prepared in accordance
with IFRS and are therefore considered non-IFRS financial measures.
For
a more detailed description of all of SAP’s non-IFRS measures and their limitations as well as SAP’s constant currency
and free cash flow figures, see Explanation of Non-IFRS Measures.
| (E) | Reconciliation
from Non-IFRS Numbers to IFRS Numbers |
| (E.1) | Reconciliation
of Non-IFRS Revenue – Quarter |
| €
millions, unless otherwise stated |
Q2
2024 |
Q2
2023 |
∆
in % |
| IFRS |
Currency
Impact |
Non-IFRS
Constant
Currency |
IFRS |
IFRS |
Non-IFRS
Constant
Currency |
| Revenue
Numbers |
|
|
|
|
|
|
| Cloud |
4,153 |
–1 |
4,153 |
3,316 |
25 |
25 |
| Software
licenses |
229 |
1 |
230 |
316 |
–28 |
–27 |
| Software
support |
2,792 |
7 |
2,799 |
2,873 |
–3 |
–3 |
| Software
licenses and support |
3,021 |
8 |
3,029 |
3,189 |
–5 |
–5 |
| Cloud
and software |
7,175 |
7 |
7,182 |
6,505 |
10 |
10 |
| Services |
1,114 |
–2 |
1,111 |
1,050 |
6 |
6 |
| Total
revenue |
8,288 |
5 |
8,293 |
7,554 |
10 |
10 |
| |
Quarterly
Statement Q2 2024 |
(E.2) Reconciliation
of Non-IFRS Operating Expenses – Quarter
| €
millions, unless otherwise stated |
Q2
2024 |
Q2
2023 |
∆
in % |
| IFRS |
Adj. |
Non-IFRS |
Currency
Impact |
Non-IFRS
Constant
Currency |
IFRS |
Adj. |
Non-IFRS |
IFRS |
Non-IFRS |
Non-IFRS
Constant
Currency |
| Operating
Expense Numbers |
|
|
|
|
|
|
|
|
|
|
|
| Cost
of cloud |
–1,123 |
13 |
–1,110 |
|
|
–959 |
11 |
–947 |
17 |
17 |
|
| Cost
of software licenses and support |
–311 |
0 |
–311 |
|
|
–324 |
11 |
–313 |
–4 |
–1 |
|
| Cost
of cloud and software |
–1,434 |
13 |
–1,422 |
|
|
–1,282 |
22 |
–1,260 |
12 |
13 |
|
| Cost
of services |
–837 |
0 |
–837 |
|
|
–863 |
0 |
–862 |
–3 |
–3 |
|
| Total
cost of revenue |
–2,272 |
13 |
–2,259 |
|
|
–2,145 |
22 |
–2,122 |
6 |
6 |
|
| Gross
profit |
6,017 |
13 |
6,029 |
16 |
6,046 |
5,409 |
22 |
5,432 |
11 |
11 |
11 |
| Research
and development |
–1,605 |
1 |
–1,604 |
|
|
–1,565 |
2 |
–1,562 |
3 |
3 |
|
| Sales
and marketing |
–2,217 |
65 |
–2,153 |
|
|
–2,165 |
64 |
–2,102 |
2 |
2 |
|
| General
and administration |
–336 |
8 |
–328 |
|
|
–322 |
0 |
–321 |
4 |
2 |
|
| Restructuring |
–631 |
631 |
0 |
|
|
3 |
–3 |
0 |
N/A |
N/A |
|
| Other
operating income/expense, net |
–5 |
0 |
–5 |
|
|
11 |
0 |
11 |
N/A |
N/A |
|
| Total
operating expenses |
–7,067 |
718 |
–6,348 |
18 |
–6,331 |
–6,183 |
86 |
–6,097 |
14 |
4 |
4 |
(E.3) Reconciliation
of Non-IFRS Profit Figures, Income Tax, and Key Ratios – Quarter
| €
millions, unless otherwise stated |
Q2
2024 |
Q2
2023 |
∆
in % |
| IFRS |
Adj. |
Non-IFRS |
Currency
Impact |
Non-IFRS
Constant
Currency |
IFRS |
Adj. |
Non-IFRS |
IFRS |
Non-IFRS |
Non-IFRS
Constant
Currency |
| Profit
Numbers |
|
|
|
|
|
|
|
|
|
|
|
| Operating
profit (loss) |
1,222 |
718 |
1,940 |
23 |
1,963 |
1,371 |
86 |
1,457 |
–11 |
33 |
35 |
| Other
non-operating income/expense, net |
–5 |
0 |
–5 |
|
|
–102 |
0 |
–102 |
–95 |
–95 |
|
| Finance
income |
412 |
–250 |
162 |
|
|
187 |
–81 |
106 |
>100 |
52 |
|
| Finance
costs |
–242 |
70 |
–171 |
|
|
–363 |
93 |
–270 |
–33 |
–36 |
|
| Financial
income, net |
170 |
–179 |
–9 |
|
|
–175 |
12 |
–163 |
N/A |
–94 |
|
| Profit
(loss) before tax from continuing operations |
1,387 |
539 |
1,926 |
|
|
1,093 |
98 |
1,192 |
27 |
62 |
|
| Income
tax expense |
–469 |
–178 |
–647 |
|
|
–369 |
–24 |
–393 |
27 |
65 |
|
| Profit
(loss) after tax from continuing operations |
918 |
361 |
1,278 |
|
|
724 |
75 |
799 |
27 |
60 |
|
| Attributable
to owners of parent |
888 |
395 |
1,283 |
|
|
728 |
80 |
808 |
22 |
59 |
|
| Attributable
to non-controlling interests |
30 |
–34 |
–4 |
|
|
–4 |
–5 |
–9 |
N/A |
–55 |
|
| Profit
(loss) after tax1 |
918 |
361 |
1,278 |
|
|
2,982 |
–545 |
2,437 |
–69 |
–48 |
|
| Attributable
to owners of parent1 |
888 |
395 |
1,283 |
|
|
3,161 |
–354 |
2,807 |
–72 |
–54 |
|
| Attributable
to non-controlling interests1 |
30 |
–34 |
–4 |
|
|
–179 |
–191 |
–370 |
N/A |
–99 |
|
| |
|
|
|
|
|
|
|
|
|
|
|
| Key
Ratios |
|
|
|
|
|
|
|
|
|
|
|
| Operating
margin (in %) |
14.7 |
|
23.4 |
|
23.7 |
18.2 |
|
19.3 |
–3.4pp |
4.1pp |
4.4pp |
| Effective
tax rate (in %)2 |
33.8 |
|
33.6 |
|
|
33.8 |
|
33.0 |
0.1pp |
0.7pp |
|
| Earnings
per share, basic (in €) from continuing operations |
0.76 |
|
1.10 |
|
|
0.62 |
|
0.69 |
22 |
59 |
|
| Earnings
per share, basic (in €)1 |
0.76 |
|
1.10 |
|
|
2.70 |
|
2.40 |
–72 |
–54 |
|
1
From continuing and discontinued operations
2 The difference between our effective tax rate (IFRS) and effective tax rate (non-IFRS) in Q2 2024 mainly resulted
from tax effects of restructuring expenses. The difference between our effective tax rate (IFRS) and effective tax rate (non-IFRS)
in Q2 2023 mainly resulted from tax effects of acquisition-related charges.
| |
Quarterly
Statement Q2 2024 |
(E.4) Reconciliation
of Non-IFRS Revenue – Year-to-Date
| €
millions, unless otherwise stated |
Q1–Q2
2024 |
Q1–Q2
2023 |
∆
in % |
| IFRS |
Currency
Impact |
Non-IFRS
Constant
Currency |
IFRS |
IFRS |
Non-IFRS
Constant
Currency |
| Revenue
Numbers |
|
|
|
|
|
|
| Cloud |
8,082 |
49 |
8,131 |
6,493 |
24 |
25 |
| Software
licenses |
432 |
5 |
436 |
591 |
–27 |
–26 |
| Software
support |
5,621 |
40 |
5,661 |
5,778 |
–3 |
–2 |
| Software
licenses and support |
6,053 |
44 |
6,097 |
6,369 |
–5 |
–4 |
| Cloud
and software |
14,134 |
93 |
14,228 |
12,863 |
10 |
11 |
| Services |
2,195 |
8 |
2,202 |
2,132 |
3 |
3 |
| Total
revenue |
16,329 |
101 |
16,430 |
14,995 |
9 |
10 |
(E.5) Reconciliation
of Non-IFRS Operating Expenses – Year-to-Date
| €
millions, unless otherwise stated |
Q1–Q2
2024 |
Q1–Q2
2023 |
∆
in % |
| IFRS |
Adj. |
Non-IFRS |
Currency
Impact |
Non-IFRS
Constant
Currency |
IFRS |
Adj. |
Non-IFRS |
IFRS |
Non-IFRS |
Non-IFRS
Constant
Currency |
| Operating
Expense Numbers |
|
|
|
|
|
|
|
|
|
|
|
| Cost
of cloud |
–2,214 |
25 |
–2,190 |
|
|
–1,897 |
21 |
–1,876 |
17 |
17 |
|
| Cost
of software licenses and support |
–637 |
0 |
–637 |
|
|
–687 |
22 |
–665 |
–7 |
–4 |
|
| Cost
of cloud and software |
–2,851 |
25 |
–2,827 |
|
|
–2,584 |
43 |
–2,541 |
10 |
11 |
|
| Cost
of services |
–1,699 |
0 |
–1,699 |
|
|
–1,718 |
0 |
–1,717 |
–1 |
–1 |
|
| Total
cost of revenue |
–4,550 |
25 |
–4,526 |
|
|
–4,301 |
44 |
–4,258 |
6 |
6 |
|
| Gross
profit |
11,778 |
25 |
11,803 |
97 |
11,900 |
10,693 |
44 |
10,737 |
10 |
10 |
11 |
| Research
and development |
–3,270 |
3 |
–3,267 |
|
|
–3,138 |
4 |
–3,134 |
4 |
4 |
|
| Sales
and marketing |
–4,496 |
129 |
–4,366 |
|
|
–4,457 |
299 |
–4,158 |
1 |
5 |
|
| General
and administration |
–696 |
9 |
–687 |
|
|
–670 |
1 |
–669 |
4 |
3 |
|
| Restructuring |
–2,873 |
2,873 |
0 |
|
|
–257 |
257 |
0 |
>100 |
N/A |
|
| Other
operating income/expense, net |
–9 |
0 |
–9 |
|
|
3 |
0 |
3 |
N/A |
N/A |
|
| Total
operating expenses |
–15,894 |
3,039 |
–12,855 |
–34 |
–12,890 |
–12,820 |
604 |
–12,216 |
24 |
5 |
6 |
| |
Quarterly
Statement Q2 2024 |
(E.6) Reconciliation
of Non-IFRS Profit Figures, Income Tax, and Key Ratios – Year-to-Date
| €
millions, unless otherwise stated |
Q1–Q2
2024 |
Q1–Q2
2023 |
∆
in % |
| IFRS |
Adj. |
Non-IFRS |
Currency
Impact |
Non-IFRS
Constant
Currency |
IFRS |
Adj. |
Non-IFRS |
IFRS |
Non-IFRS |
Non-IFRS
Constant
Currency |
| Profit
Numbers |
|
|
|
|
|
|
|
|
|
|
|
| Operating
profit (loss) |
434 |
3,039 |
3,473 |
67 |
3,540 |
2,174 |
604 |
2,779 |
–80 |
25 |
27 |
| Other
non-operating income/expense, net |
–153 |
0 |
–153 |
|
|
–116 |
0 |
–116 |
32 |
32 |
|
| Finance
income |
611 |
–282 |
328 |
|
|
369 |
–185 |
184 |
65 |
79 |
|
| Finance
costs |
–486 |
159 |
–327 |
|
|
–656 |
226 |
–430 |
–26 |
–24 |
|
| Financial
income, net |
125 |
–123 |
2 |
|
|
–287 |
41 |
–247 |
N/A |
N/A |
|
| Profit
(loss) before tax from continuing operations |
407 |
2,916 |
3,322 |
|
|
1,771 |
645 |
2,416 |
–77 |
37 |
|
| Income
tax expense |
–313 |
–787 |
–1,100 |
|
|
–643 |
–106 |
–749 |
–51 |
47 |
|
| Profit
(loss) after tax from continuing operations |
94 |
2,129 |
2,223 |
|
|
1,128 |
539 |
1,667 |
–92 |
33 |
|
| Attributable
to owners of parent |
60 |
2,163 |
2,222 |
|
|
1,135 |
543 |
1,678 |
–95 |
32 |
|
| Attributable
to non-controlling interests |
34 |
–34 |
0 |
|
|
–7 |
–4 |
–11 |
N/A |
N/A |
|
| Profit
(loss) after tax1 |
94 |
2,129 |
2,223 |
|
|
3,491 |
–43 |
3,448 |
–97 |
–36 |
|
| Attributable
to owners of parent1 |
60 |
2,163 |
2,222 |
|
|
3,640 |
136 |
3,776 |
–98 |
–41 |
|
| Attributable
to non-controlling interests1 |
34 |
–34 |
0 |
|
|
–149 |
–179 |
–327 |
N/A |
N/A |
|
| |
|
|
|
|
|
|
|
|
|
|
|
| Key
Ratios |
|
|
|
|
|
|
|
|
|
|
|
| Operating
margin (in %) |
2.7 |
|
21.3 |
|
21.5 |
14.5 |
|
18.5 |
–11.8pp |
2.7pp |
3.0pp |
| Effective
tax rate (in %)2 |
76.9 |
|
33.1 |
|
|
36.3 |
|
31.0 |
40.6pp |
2.1pp |
|
| Earnings
per share, basic (in €) from continuing operations |
0.05 |
|
1.91 |
|
|
0.97 |
|
1.44 |
–95 |
33 |
|
| Earnings
per share, basic (in €)1 |
0.05 |
|
1.91 |
|
|
3.12 |
|
3.23 |
–98 |
–41 |
|
1 From
continuing and discontinued operations
2 The difference between our effective tax rate (IFRS) and effective tax rate (non-IFRS) in the first half of
2024 and 2023 mainly resulted from restructuring expenses.
| |
Quarterly
Statement Q2 2024 |
| (E.7) | Reconciliation
of Free Cash Flow |
| €
millions, unless otherwise stated |
Q1-Q2
2024 |
Q1-Q2
2023 |
| Net
cash flows from operating activities – continuing operations |
4,297 |
3,160 |
| Purchase
of intangible assets and property, plant, and equipment |
–365 |
–413 |
| Payments
of lease liabilities |
–148 |
–188 |
| Free
cash flow |
3,784 |
2,559 |
| |
|
|
| Net
cash flows from investing activities – continuing operations |
–947 |
41 |
| Net
cash flows from financing activities – continuing operations |
–3,708 |
–4,283 |
| |
Quarterly
Statement Q2 2024 |
| (F) | Non-IFRS
Adjustments – Actuals and Estimates |
| €
millions, unless otherwise stated |
Estimated
Amounts for
Full
Year 2024
|
Q2
2024 |
Q1–Q2
2024 |
Q2
2023 |
Q1–Q2
2023 |
| Profit
(loss) before tax from continuing operations (IFRS) |
|
1,387 |
407 |
1,093 |
1,771 |
| Adjustment
for acquisition-related charges |
280–360 |
87 |
166 |
89 |
177 |
| Adjustment
for restructuring |
approximately
€3 B |
631 |
2,873 |
–3 |
257 |
| Adjustment
for regulatory compliance matter expenses |
0 |
0 |
0 |
0 |
170 |
| Adjustment
for gains and losses from equity securities, net |
N/A1 |
–179 |
–123 |
12 |
41 |
| Profit
(loss) before tax from continuing operations (non-IFRS) |
|
1,926 |
3,322 |
1,192 |
2,416 |
1
Due to the uncertainty and potential variability of gains and losses from equity securities, we cannot provide an estimate
for the full year without unreasonable efforts. This item could however have a material impact on our non-IFRS measures below
operating profit.
| (G) | Non-IFRS
Operating Expense Adjustments by Functional Areas |
| € millions |
Q2
2024 |
Q2
2023 |
| |
IFRS |
Acquisition-
Related |
Restruc-
turing |
RCM1 |
Non-IFRS |
IFRS |
Acquisition-
Related |
Restruc-
turing |
RCM1 |
Non-IFRS |
| Cost
of cloud |
–1,123 |
13 |
0 |
0 |
–1,110 |
–959 |
11 |
0 |
0 |
–947 |
| Cost
of software licenses and support |
–311 |
0 |
0 |
0 |
–311 |
–324 |
11 |
0 |
0 |
–313 |
| Cost
of services |
–837 |
0 |
0 |
0 |
–837 |
–863 |
0 |
0 |
0 |
–862 |
| Research
and development |
–1,605 |
1 |
0 |
0 |
–1,604 |
–1,565 |
2 |
0 |
0 |
–1,562 |
| Sales
and marketing |
–2,217 |
65 |
0 |
0 |
–2,153 |
–2,165 |
64 |
0 |
0 |
–2,102 |
| General
and administration |
–336 |
8 |
0 |
0 |
–328 |
–322 |
0 |
0 |
0 |
–321 |
| Restructuring |
–631 |
0 |
631 |
0 |
0 |
3 |
0 |
–3 |
0 |
0 |
| Other
operating income/expense, net |
–5 |
0 |
0 |
0 |
–5 |
11 |
0 |
0 |
0 |
11 |
| Total
operating expenses |
–7,067 |
87 |
631 |
0 |
–6,348 |
–6,183 |
89 |
–3 |
0 |
–6,097 |
| |
|
|
|
|
|
|
|
|
|
|
1 Regulatory
Compliance Matters
| €
millions |
Q1–Q2
2024 |
Q1–Q2
2023 |
| IFRS |
Acquisition-
Related |
Restruc-
turing |
RCM1 |
Non-IFRS |
IFRS |
Acquisition-
Related |
Restruc-
turing |
RCM1 |
Non-IFRS |
| Cost
of cloud |
–2,214 |
25 |
0 |
0 |
–2,190 |
–1,897 |
21 |
0 |
0 |
–1,876 |
| Cost
of software licenses and support |
–637 |
0 |
0 |
0 |
–637 |
–687 |
22 |
0 |
0 |
–665 |
| Cost
of services |
–1,699 |
0 |
0 |
0 |
–1,699 |
–1,718 |
0 |
0 |
0 |
–1,717 |
| Research
and development |
–3,270 |
3 |
0 |
0 |
–3,267 |
–3,138 |
4 |
0 |
0 |
–3,134 |
| Sales
and marketing |
–4,496 |
129 |
0 |
0 |
–4,366 |
–4,457 |
129 |
0 |
170 |
–4,158 |
| General
and administration |
–696 |
9 |
0 |
0 |
–687 |
–670 |
1 |
0 |
0 |
–669 |
| Restructuring |
–2,873 |
0 |
2,873 |
0 |
0 |
–257 |
0 |
257 |
0 |
0 |
| Other
operating income/expense, net |
–9 |
0 |
0 |
0 |
–9 |
3 |
0 |
0 |
0 |
3 |
| Total
operating expenses |
–15,894 |
166 |
2,873 |
0 |
–12,855 |
–12,820 |
177 |
257 |
170 |
–12,216 |
1 Regulatory
Compliance Matters
| |
Quarterly
Statement Q2 2024 |
If
not presented in a separate line item in our income statement, the restructuring expenses would break down as follows:
| €
millions |
Q2
2024 |
Q1–Q2
2024 |
Q2
2023 |
Q1–Q2
2023 |
| Cost
of cloud |
–28 |
–95 |
–1 |
–6 |
| Cost
of software licenses and support |
–24 |
–80 |
0 |
–11 |
| Cost
of services |
–107 |
–533 |
1 |
–34 |
| Research
and development |
–144 |
–1,100 |
–3 |
–40 |
| Sales
and marketing |
–284 |
–906 |
9 |
–150 |
| General
and administration |
–43 |
–160 |
–3 |
–16 |
| Restructuring
expenses |
–631 |
–2,873 |
3 |
–257 |
| |
Quarterly
Statement Q2 2024 |
Disaggregations
| (H.1) | Segment
Policies and Segment Changes |
In
the first quarter of 2024, the non-reportable Business Network segment was dissolved and integrated into the Applications, Technology
& Services segment.
Driven
by SAP’s continuous transformation into a holistically steered cloud company by a cohesive product portfolio and commercialization
of product bundles (such as RISE with SAP and GROW with SAP) as well as resulting changes in Executive Board responsibility
in the second quarter of 2024 it was concluded that SAP’s Chief Operating Decision Maker (CODM) steers SAP on a consolidated
basis. Consequently, with effect from the second quarter of 2024, SAP has a single operating segment.
For
more information about SAP’s operating performance, see the Reconciliation from
Non-IFRS Numbers to IFRS Numbers section.
For
a more detailed description of SAP’s segment reporting, see Note (C.1)
“Results of Segments” of our Consolidated Half-Year Financial Statements 2024.
| |
Quarterly
Statement Q2 2024 |
| (I) | Revenue
by Region (IFRS and Non-IFRS) |
| (I.1) | Revenue
by Region (IFRS and Non-IFRS) – Quarter |
| €
millions |
Q2
2024 |
Q2
2023 |
∆
in % |
| Actual
currency |
Currency
Impact |
Constant
Currency |
Actual
currency |
Actual
currency |
Constant
Currency |
| Cloud
Revenue by Region |
|
|
|
| EMEA |
1,673 |
–9 |
1,664 |
1,267 |
32 |
31 |
| Americas |
1,914 |
–14 |
1,901 |
1,622 |
18 |
17 |
| APJ |
566 |
22 |
588 |
427 |
33 |
38 |
| Cloud
revenue |
4,153 |
–1 |
4,153 |
3,316 |
25 |
25 |
| Cloud
and Software Revenue by Region |
|
|
|
| EMEA |
3,215 |
–13 |
3,202 |
2,878 |
12 |
11 |
| Americas |
2,912 |
–21 |
2,891 |
2,646 |
10 |
9 |
| APJ |
1,047 |
42 |
1,090 |
980 |
7 |
11 |
| Cloud
and software revenue |
7,175 |
7 |
7,182 |
6,505 |
10 |
10 |
| Total
Revenue by Region |
|
|
|
| Germany |
1,283 |
0 |
1,282 |
1,146 |
12 |
12 |
| Rest
of EMEA |
2,444 |
–16 |
2,428 |
2,200 |
11 |
10 |
| Total
EMEA |
3,727 |
–16 |
3,711 |
3,346 |
11 |
11 |
| United
States |
2,701 |
–30 |
2,672 |
2,477 |
9 |
8 |
| Rest
of Americas |
690 |
3 |
693 |
628 |
10 |
10 |
| Total
Americas |
3,392 |
–27 |
3,365 |
3,105 |
9 |
8 |
| Japan |
337 |
37 |
374 |
313 |
7 |
19 |
| Rest
of APJ |
833 |
11 |
844 |
790 |
5 |
7 |
| Total
APJ |
1,170 |
48 |
1,217 |
1,103 |
6 |
10 |
| Total
revenue |
8,288 |
5 |
8,293 |
7,554 |
10 |
10 |
| |
Quarterly
Statement Q2 2024 |
| (I.2) | Revenue
by Region (IFRS and Non-IFRS) – Year-to-Date |
| €
millions |
Q1–Q2
2024 |
Q1–Q2
2023 |
∆
in % |
| Actual
Currency |
Currency
Impact |
Constant
Currency |
Actual
Currency |
Actual
Currency |
Constant
Currency |
| Cloud
Revenue by Region |
|
|
|
| EMEA |
3,230 |
–12 |
3,219 |
2,458 |
31 |
31 |
| Americas |
3,761 |
5 |
3,766 |
3,194 |
18 |
18 |
| APJ |
1,090 |
56 |
1,146 |
841 |
30 |
36 |
| Cloud
revenue |
8,082 |
49 |
8,131 |
6,493 |
24 |
25 |
| Cloud
and Software Revenue by Region |
|
|
|
| EMEA |
6,325 |
–18 |
6,306 |
5,660 |
12 |
11 |
| Americas |
5,776 |
5 |
5,781 |
5,283 |
9 |
9 |
| APJ |
2,034 |
107 |
2,140 |
1,919 |
6 |
12 |
| Cloud
and software revenue |
14,134 |
93 |
14,228 |
12,863 |
10 |
11 |
| Total
Revenue by Region |
|
|
|
| Germany |
2,520 |
0 |
2,520 |
2,283 |
10 |
10 |
| Rest
of EMEA |
4,804 |
–23 |
4,781 |
4,338 |
11 |
10 |
| Total
EMEA |
7,323 |
–23 |
7,301 |
6,621 |
11 |
10 |
| United
States |
5,369 |
1 |
5,370 |
4,974 |
8 |
8 |
| Rest
of Americas |
1,359 |
3 |
1,362 |
1,233 |
10 |
10 |
| Total
Americas |
6,728 |
4 |
6,732 |
6,207 |
8 |
8 |
| Japan |
662 |
78 |
740 |
616 |
7 |
20 |
| Rest
of APJ |
1,615 |
42 |
1,658 |
1,550 |
4 |
7 |
| Total
APJ |
2,277 |
120 |
2,397 |
2,166 |
5 |
11 |
| Total
revenue |
16,329 |
101 |
16,430 |
14,995 |
9 |
10 |
| |
Quarterly
Statement Q2 2024 |
| (J) | Employees
by Region and Functional Areas |
| Full-time
equivalents |
06/30/2024 |
06/30/2023 |
| |
EMEA |
Americas |
APJ |
Total |
EMEA |
Americas |
APJ |
Total |
| Cloud
and software |
4,434 |
4,148 |
4,448 |
13,029 |
4,010 |
4,083 |
4,000 |
12,093 |
| Services |
8,292 |
4,618 |
5,410 |
18,320 |
7,993 |
5,000 |
5,476 |
18,469 |
| Research
and development |
18,073 |
5,441 |
12,331 |
35,844 |
17,910 |
5,872 |
12,318 |
36,100 |
| Sales and
marketing |
12,053 |
9,438 |
5,112 |
26,603 |
11,778 |
10,121 |
5,303 |
27,202 |
| General and
administration |
3,640 |
1,723 |
1,291 |
6,653 |
3,475 |
1,765 |
1,281 |
6,521 |
| Infrastructure |
2,845 |
1,129 |
890 |
4,865 |
2,800 |
1,284 |
859 |
4,943 |
| SAP
Group (06/30) |
49,337 |
26,496 |
29,482 |
105,315 |
47,966 |
28,125 |
29,237 |
105,328 |
| Thereof
acquisitions1 |
0 |
0 |
0 |
0 |
0 |
0 |
0 |
0 |
| SAP
Group (six months' end average) |
49,414 |
27,689 |
29,745 |
106,848 |
47,917 |
28,127 |
29,337 |
105,380 |
1
Acquisitions closed between January 1 and June 30 of the respective year.
| |
Quarterly
Statement Q2 2024 |
Other
Disclosures
SAP’s
share-based payment expenses included in our non-IFRS operating expenses break down as follows:
| €
millions |
Q2
2024 |
Q1–Q2
2024 |
Q2
2023 |
Q1–Q2
2023 |
| Cost
of cloud |
–34 |
–73 |
–27 |
–47 |
| Cost
of software licenses and support |
–11 |
–22 |
–11 |
–20 |
| Cost
of services |
–89 |
–192 |
–107 |
–198 |
| Research
and development |
–191 |
–403 |
–202 |
–371 |
| Sales
and marketing |
–218 |
–476 |
–232 |
–435 |
| General
and administration |
–48 |
–114 |
–36 |
–96 |
| Share-based
payment expenses |
–592 |
–1,280 |
–614 |
–1,167 |
Additionally
in the second quarter of 2024, SAP recognized €107 million (Q2/2023: €0 million), and in the first half of 2024 €189
million (HY1/2023: €0 million), of accelerated share-based payment expenses triggered by the transformation program. These
share-based payment expenses are classified as restructuring expenses in SAP’s consolidated income statements.
Associated share-based payments are classified as a decrease in provisions and other liabilities in SAP’s consolidated statements
of cash flows. The payment amount in the first half of 2024 was immaterial.
Exhibit
99.2
| |
 |
SAP
Half-Year Report 2024 |

| |
|
SAP
Half-Year Report 2024 |
Table
of Contents
| |
|
SAP
Half-Year Report 2024 |
Introductory
Notes
This
Half-Year Group Report meets the requirements of German Accounting Standard No. 16 “Half-yearly Financial Reporting”
(GAS 16). We prepared the financial data in the Half-Year Report section for SAP SE and its subsidiaries in accordance
with International Financial Reporting Standards (IFRS). In doing so, we observed the IFRS both as issued by the International
Accounting Standards Board (IASB) and as endorsed by the European Union (EU). This does not apply to numbers expressly identified
as non-IFRS. For additional IFRS and non-IFRS information, see the Supplementary Financial
Information section.
This
Half-Year Group Report complies with the legal requirements in accordance with the German Securities Trading Act (Wertpapierhandelsgesetz,
WpHG) for a half-year financial report, and comprises the consolidated Half-Year Management Report, condensed consolidated Half-Year
Financial Statements, and the responsibility statement in accordance with the German Securities Trading Act, section 115 (2).
This
Half-Year Group Report updates our consolidated Financial Statements 2023, presents significant events and transactions of
the first half of 2024, and updates the forward-looking information as well as significant non-financial key figures contained
in our Management Report 2023. This Half-Year Financial Report only includes half-year numbers. Our quarterly numbers are
available in the Quarterly Statements for the first and second quarter 2024. Both the 2023 Consolidated Financial Statements and
the 2023 Management Report are part of our Integrated Report 2023, which is available at www.sapintegratedreport.com.
All
of the information in this Half-Year Group Report is unaudited. This means that the information has been subject neither to any
audit nor to any review by an independent auditor.
Unless
otherwise stated, all figures in this Half-Year Report are based on SAP Group results from continuing operations.
| |
|
SAP
Half-Year Report 2024 |
Consolidated
Half-Year Management Report
Strategy
and Business Model
SAP
continues to execute on the strategy and business model as described in the SAP Integrated
Report 2023 to become the #1 enterprise application and business AI company.
Our
Product Strategy
SAP’s
product portfolio allows enterprises to manage their resources, spend, employees, and customer relationships. For more information
about SAP’s product strategy and product portfolio, see the Our Product Strategy
section in our Management Report 2023.
Substantial
updates to SAP’s product strategy and portfolio for the first half of 2024 are as follows:
SAP
Business AI
SAP’s
goal is to deliver artificial intelligence (AI) solutions that are relevant, reliable, and responsible. More than 27,000 customers already
use SAP Business AI. SAP Business AI solutions are embedded in systems that power critical business processes, with
the context of industry-specific data and deep process knowledge, and they are built on ethical AI practices. With Joule, SAP’s
generative AI (GenAI) copilot, users can work with the system in natural language, transforming the user experience. Besides embedding
AI scenarios in its solutions, SAP also provides access to frontier AI models through the generative AI hub capability in SAP AI
Core on SAP Business Technology Platform (SAP BTP), allowing customers and partners to build their own AI use cases and extend
embedded GenAI use cases while relying on deep business process integration and secure data access.
In
March 2024, we announced a partnership with NVIDIA focused on accelerating GenAI adoption across enterprise applications
powering global industries. Meanwhile, as announced at our SAP Sapphire event in 2024, the partnership has already created
new capabilities for Joule. This includes AI-assisted coding of application extensions for SAP systems and expert consulting guidance
for SAP system deployment. In May 2024, SAP and IBM announced an extension of their partnership focused on helping to deliver
greater client productivity and innovation with new GenAI capabilities and industry-specific cloud solutions. In the same month,
SAP and Amazon Web Services (AWS) announced an expanded partnership focused on unlocking innovation with GenAI and on helping
SAP customers modernize key business processes built on SAP solutions by integrating models from Amazon Bedrock into the generative
AI hub in SAP AI Core.
At
our SAP Sapphire event in 2024, we also announced additional SAP Business AI innovations and collaborations with partners
including Accenture, Boston Consulting Group, Google Cloud, Meta, McKinsey & Company, Microsoft, and Mistral AI. Examples
of SAP’s AI innovations include embedding Joule throughout our enterprise portfolio, integrating Joule with Microsoft Copilot,
combining Joule with Google’s Gemini AI assistant in integrated business planning, and new generative AI use cases across
our solutions in ERP and finance, human resources, sourcing and procurement, supply chain management, customer experience, and
IT and platform.
Cloud
ERP
In
January 2024, SAP announced the RISE with SAP Migration and Modernization program, a set of resources, services, and
financial incentives to help customers move to the cloud and maintain the pace and level of innovation that cloud enables.
| |
|
SAP
Half-Year Report 2024 |
Joule,
our natural-language, GenAI copilot built directly into SAP S/4HANA Cloud Public Edition in an SAP Early Adopter Care
program, was released in February 2024. It aims to transform the way customers interact with the system and to improve business
process efficiency and user experience.
At
SAP Sapphire in 2024, we announced the next evolution in our RISE with SAP and GROW with SAP solutions and
related add-on packages: RISE with SAP includes add-on packages targeted to finance and supply-chain buying centers; GROW with SAP
premium subscription now includes SAP Sales Cloud capabilities and Concur Expense solutions at no additional charge. Additionally,
tailored add-on packages for advanced finance and HR management are available for customers to easily expand their solutions as needed.
Human
Capital Management
In
May 2024, we released new AI capabilities throughout SAP SuccessFactors solutions, such as additional capabilities for
learning, goals, compensation, and more.
Customer
Experience
In
the first half of 2024, our SAP Customer Experience organizational unit released the SAP CX AI Toolkit, a new set of
business AI capabilities that can be used to generate relevant, personalized content that meets specific customer experience business
needs.
SAP Business
Technology Platform
At
SAP Sapphire in 2024, SAP announced new tools for SAP Build solutions in the low-code and pro-code area and new features
for the ABAP Cloud development model, enabling software developers to write ABAP code with GenAI, further driving its clean-core
strategy. In addition, Joule powers the SAP Build Code development tools, enabling customers to create SAP Fiori front ends
for their SAP S/4HANA Cloud systems faster using GenAI, thus simplifying SAP S/4HANA Cloud extensions.
Business
Process Transformation
In
May 2024, we launched the SAP Signavio Process Transformation Manager solution as an integrated toolkit to manage process
transformation holistically, and the value accelerator library for SAP Signavio solutions, a one-stop library
of self-installable value accelerators combining ready-to-use expertise gathered from successfully delivered projects.
At
SAP Sapphire in 2024, we announced the beta availability of GenAI capabilities embedded into SAP Signavio solutions: Process
& KPI Recommender for pre-configured process models based on SAP best practices, and Text-to-Process, an AI-assisted process
model creation.
Working
Capital Management
In
March 2024, Taulia announced a partnership with Visa to make embedded finance solutions accessible to businesses worldwide
through Taulia Virtual Cards. This partnership is in addition to the already existing Mastercard partnership. Taulia Virtual Cards
integrates with SAP ERP and other business applications for a seamless and streamlined payment experience for buyers and suppliers.
Sustainability
Management
At
SAP Sapphire in 2024, we introduced SAP’s carbon calculator engine, available within our SAP Sustainability Control
Tower and SAP Sustainability Footprint Management solutions, that helps customers get granular, accurate, and auditable
emissions data covering all scopes of required reporting on emissions.
| |
|
SAP
Half-Year Report 2024 |
Services
and Support
At
SAP Sapphire in 2024, we announced a new certification program for IT professionals responsible for SAP S/4HANA Cloud
implementations, which is now available on SAP Learning Hub.
Also
at our SAP Sapphire event in 2024, we announced new editions of our SAP Preferred Success plan. These editions are designed
to deliver expanded capabilities for specific groups of solutions and to provide a personalized partnership for the lifetime of a customer’s
cloud solution.
Our
Investments in Innovation
Investment
in R&D
SAP’s
strong commitment to research and development (R&D) is reflected in our expenditures. In the first half of 2024, our R&D
(IFRS) expenses increased 4% to €3,270 million (first half of 2023: €3,138 million). Our IFRS R&D
ratio, reflecting R&D expenses as a portion of total revenue, decreased one percentage point (pp) to 20% (first half of 2023: 21%)
year over year. Similarly, our non-IFRS R&D ratio decreased 1pp to 20% (first half of 2023: 21%). At the end of the first
half of 2024, our total full-time equivalent (FTE) headcount in development was 35,844 (first half of 2023: 36,100). Measured
in FTEs, our R&D headcount remained unchanged at 34% of total headcount.
Total
R&D expense includes not only our own personnel costs but also the external costs of work and services from the providers
and cooperation partners we work with to deliver and enhance our products. We also incur external costs for the following:
| – | Translation,
localization, and testing of products |
| – | Certification
of products in different markets |
| – | Patent
attorney services and fees |
| – | Consulting
related to our product strategy |
| – | Professional
development of our R&D workforce |
Competitive
Intangibles
The
majority of (intangible) resources underlying our current and future success does not appear in the book value of equity in our
Consolidated Financial Statements. This is apparent from a comparison of the market capitalization of SAP SE (based on all
issued shares), which was €232.8 billion at the end of the first half of 2024 (2023: €171.4 billion),
with the book value of our equity in the Consolidated Financial Statements, which was €41.9 billion (2023: €43.4 billion).
Hence, the market capitalization of our equity is more than five times higher than the book value.
Acquisitions
and Divestitures
On
June 5, 2024, SAP announced its intent to acquire 100% of WalkMe Ltd. (“WalkMe”), a leader in digital adoption
platforms (DAPs). The acquisition is subject to customary closing conditions, including the receipt of WalkMe shareholder approval
and necessary regulatory clearances, and is expected to close in the third quarter of 2024. The envisioned combination complements
SAP’s Business Transformation Management portfolio of SAP Signavio and SAP LeanIX solutions to help customers
on their transformation journeys. The Executive Board and Supervisory Board of SAP SE and the board of directors of WalkMe
approved the transaction for US$14.00 per share in an all-cash transaction, representing an equity value of approximately US$1.5 billion.
The offer price represents a 45% premium over WalkMe’s closing share price on June 4, 2024.
| |
|
SAP
Half-Year Report 2024 |
Performance
Management System
SAP
uses various performance measures to manage our performance with regard to our primary financial objectives, which are growth
and profitability, and our primary non-financial objectives, which are customer loyalty, employee engagement, Net Zero climate
performance, and women in executive roles.
For
a more detailed description of SAP’s performance measures, the usefulness and limitations of our non-IFRS measures,
and information about constant currency calculation, see SAP Performance
Measures which is available on our Web site.
Change
in Non-IFRS Expense Measures
In
recent years, SAP has replaced many of its cash-settled share-based compensation plans with equity-settled plans. Having most
of these plans as equity-settled reduces the impact of share price fluctuations and of other factors outside of our control. For
these reasons, SAP has decided that, starting 2024, it will no longer exclude share-based payment expenses from its operating
profit (non-IFRS).
Effective
2024, numbers that are identified as financial income, net (non IFRS) are adjusted by excluding gains and losses from equity securities,
net. This includes realized and unrealized effects from the disposal of equity securities, ongoing mark-to-market adjustments
on marketable equity investments, changes in fair value of non-marketable equity securities, and others.
Excluding
gains and losses from equity securities, net, improves the period-over-period comparability, because there is less volatility
caused by share price fluctuation, market developments, and other factors beyond our control.
Change
in Non-Financial Measures
In
2023, SAP achieved carbon neutrality in its own operations. As part of our Net Zero by 2030 commitment, we discontinued the non-financial
measure Net Carbon Emissions in 2024 and replaced it with Gross Greenhouse Gas Emissions. This new non-financial measure is used
to measure greenhouse gas emissions along the value chain (scope 1, scope 2, and scope 3 emissions relevant for
SAP’s business model). We apply a market-based approach. Renewable energies, for example in the form of self-generated renewable
electricity, investments in certified renewable energy certificates, long-term green electricity contracts (power purchase agreements),
or renewable electricity purchased by our suppliers and customers can be counted toward the reduction of greenhouse gas emissions.
We define, measure, and report our greenhouse gas emissions according to the Greenhouse Gas Protocol (in million tons of CO2
equivalents).
Effective
2024, we introduced the Women in Executive Roles (WiER) KPI to measure the ratio of women to all genders in the three executive
levels below the SAP Executive Board, namely the Global Executive Team, the Senior Executive Team, and the Executive Team,
to promote gender equality in the workplace and gender balance across the organization. Our priority, with the help of this KPI,
is to monitor how the Company is progressing on this commitment.
Financial
Performance Review and Analysis
Economy
and the Market
Global
Economic Trends
In
the first half of 2024, global economic activity improved gradually amid remaining headwinds, summarizes the European Central
Bank (ECB) in its most recent Economic Bulletin.1 The ECB places particular emphasis on the recovery of imports in
emerging markets and major advanced economies.
| |
|
SAP
Half-Year Report 2024 |
Furthermore,
the ECB highlights a positive surprise in the euro area at the start of the year: The euro area economy picked up in the first
half of 2024, largely due to a broad-based improvement in the services sector and a positive contribution from net trade and domestic
demand. Manufacturing showed slight signs of stabilization as well, though still affected by weak demand particularly in energy-intensive
sectors. However, exports to some key trading partners such as central and eastern European countries weakened.
The
United States showed robust economic activity at the beginning of 2024, although inflation persisted, growth in real disposable
income slowed, and the savings rate fell further. However, domestic demand remained solid due to a strong labor market and imports
picked up, thus contributing to a trade recovery.
As
for China, the ECB finds that economic growth in the first quarters of 2024 turned out stronger than expected. Domestic demand
remained weak, but high growth resumed in industrial production and investment improved steadily. This reflected rising public
investment from fiscal stimulus carried over from a budget revision in late 2023.
The
IT Market
“Organizations
are now realizing the benefits of the cloud, particularly when it comes to new innovation and its ability to bring the innovation
faster, without necessarily disrupting the technology core with customized software,”2 says International Data
Corporation (IDC), a U.S.-based market research firm. Furthermore, “innovation such as traditional AI, machine learning,
and generative AI (GenAI) can quickly be embedded into the workflows, creating faster and more intelligent insights and decision
points. When decisions are made faster, the organization can pivot quickly to answer the call of disruptions that might occur
in the business.”2 These conclusions are part of the Worldwide Enterprise Applications Software Forecast 2024–2028
that the research company issued in May 2024.
IDC’s
2024 SaaS Path Survey, analyzing data from 2,875 enterprise software respondents, finds that […] “approximately 38.5%
of organizations on average are using SaaS products and 42% on average are planning on investing in SaaS enterprise applications
in the next three years. In addition, across the same grouping, 59.5% of organizations on average plan to renew with the same
vendor, while 21% on average are planning to switch to a new vendor.”3
According
to IDC, there are clear signals of a change in user behavior when it comes to utilizing enterprise software. “Employees
are engaging and interacting with software as a coworker, relying upon its information to navigate the business to the desired
outcomes quickly. This change in technology and experience greatly improves the selection of intelligent technology providers
that will enhance the market for years to come,”2 said Mickey North Rizza, group vice president, Enterprise Software,
IDC.
1 European
Central Bank, Economic Bulletin, Issue 4/2024, Publication Date: June 20, 2024
2 Worldwide
Enterprise Applications Software Forecast, 2024–2028: AI Everywhere World Brings Intelligence and Experience-Orchestrated
Applications. May 2024, IDC #US51079424
3 IDC
SaaS Path: Executive Summary, 2024 – Examining the SaaS Buyer’s Journey, 22-May-2024, IDC #US51872624
Impact
on SAP
SAP
had a strong start into the first half of the year, demonstrating resilient momentum despite ongoing macroeconomic uncertainties.
This is highlighted by continued growth in demand for SAP’s solutions and progress with our strategic initiatives. Order
entry, Current Cloud Backlog, and Cloud revenues showed persistent high growth rates.
During
our SAP Sapphire event in May, SAP announced several partnerships and particularly an expansion of our engagement with NVIDIA,
establishing a strong focus on accelerating generative AI across SAP’s portfolio of cloud solutions and applications. With
this, SAP’s Business AI strategy is further evolving and is expected to play a key role in customer interactions. Furthermore,
our strategic acquisition of WalkMe, a leader in digital adoption platforms, will complement the SAP Signavio and SAP LeanIX
portfolios, aiming to improve adoption rates and reduce time to value for our customers.
| |
|
SAP
Half-Year Report 2024 |
Performance
Against Our Outlook for 2024
In
this section, all discussion of the contributions to target achievement is based either on IFRS or non-IFRS measures. Whether
IFRS or non-IFRS measures are discussed is either explicitly stated in the header of the respective subsection, or the numbers
are individually identified as either IFRS or non-IFRS measures.
We
present, discuss, and explain the reconciliation of IFRS measures to non-IFRS measures in the Supplementary
Financial Information section.
Outlook
for 2024 (Non-IFRS)
For
our outlook based on non-IFRS numbers, see the Financial Targets and Prospects
section in this consolidated Half-Year Management Report.
Key
Figures – SAP Group in the First Half of 2024 (IFRS and Non-IFRS)
| |
|
|
IFRS |
Non-IFRS |
| €
millions, unless otherwise stated |
Q1–Q2
2024 |
Q1–Q2
2023 |
∆
in % |
Q1–Q2
2024 |
Q1–Q2
2023 |
∆
in % |
∆
in % (constant
currency) |
| Current
Cloud Backlog |
NA |
NA |
NA |
14,808 |
11,537 |
28 |
28 |
| SaaS/PaaS |
7,782 |
6,110 |
27 |
7,782 |
6,110 |
27 |
28 |
| Thereof
Cloud ERP Suite1 |
6,581 |
4,984 |
32 |
6,581 |
4,984 |
32 |
33 |
| Thereof
Extension Suite2 |
1,202 |
1,126 |
7 |
1,202 |
1,126 |
7 |
7 |
| IaaS3 |
299 |
383 |
–22 |
299 |
383 |
–22 |
–21 |
| Cloud |
8,082 |
6,493 |
24 |
8,082 |
6,493 |
24 |
25 |
| Software
licenses |
432 |
591 |
–27 |
432 |
591 |
–27 |
–26 |
| Software
support |
5,621 |
5,778 |
–3 |
5,621 |
5,778 |
–3 |
–2 |
| Cloud
and software |
14,134 |
12,863 |
10 |
14,134 |
12,863 |
10 |
11 |
| Total
revenue |
16,329 |
14,995 |
9 |
16,329 |
14,995 |
9 |
10 |
| Operating
expenses |
–15,894 |
–12,820 |
24 |
–12,855 |
–12,216 |
5 |
6 |
| Operating
profit |
434 |
2,174 |
–80 |
3,473 |
2,779 |
25 |
27 |
| Operating
margin (in %) |
2.7 |
14.5 |
–11.8pp |
21.3 |
18.5 |
2.7pp |
3.0pp |
| Profit
(loss) after tax from continuing operations |
94 |
1,128 |
–92 |
2,223 |
1,667 |
33 |
NA |
| Profit
after tax4 |
94 |
3,491 |
–97 |
2,223 |
3,448 |
–36 |
NA |
| Effective
tax rate (in %) |
76.9 |
36.3 |
40.6pp |
33.1 |
31.0 |
2.1pp |
NA |
| Earnings
per share, basic (in €) from continuing operations |
0.05 |
0.97 |
–95 |
1.91 |
1.44 |
33 |
NA |
| Earnings
per share, basic (in €)4 |
0.05 |
3.12 |
–98 |
1.91 |
3.23 |
–41 |
NA |
1 Cloud
ERP Suite references the portfolio of strategic Software-as-a-Service (SaaS) and Platform-as-a-Service (PaaS) solutions that are
tightly integrated with our core ERP solutions and are included in key commercial packages, such as RISE with SAP. The
following offerings contribute to Cloud ERP Suite revenue: SAP S/4HANA Cloud, SAP Business Technology Platform, and
core solutions for HR and payroll, spend management, commerce, customer data solutions, business process transformation, and working
capital management.
2 Extension
Suite references SAP’s remaining SaaS and PaaS solutions that supplement and extend the functional coverage of Cloud ERP
Suite.
3 Infrastructure
as a service (IaaS): The major portion of IaaS comes from SAP HANA Enterprise Cloud.
4 From
continuing and discontinued operations
Operating
Performance (IFRS and Non-IFRS)
Cloud
and software revenue (IFRS and non-IFRS) was €14,134 million (first half of 2023: €12,863 million), an
increase of 10%. On a constant currency basis (non-IFRS), the increase was 11%. This increase was mainly driven by cloud revenue
growth of 24%, which was particularly fueled by strong growth in our Cloud ERP Suite. Software licenses revenue (IFRS and non-IFRS)
decreased 27% (26% at constant currencies, non-IFRS) as more customers selected SAP’s cloud offerings such as RISE with SAP.
Software support revenue (IFRS and non-IFRS) was €5,621 million (first half of 2023: €5,778 million),
a decrease of 3% (2% at constant currencies, non-IFRS).
| |
|
SAP
Half-Year Report 2024 |
Our
operating expenses (IFRS) increased 24% to €15,894 million (first half of 2023: €12,820 million), primarily
due to restructuring expenses. Operating expenses (non-IFRS) increased 5% to €12,855 million (first half of 2023: €12,216 million)
at a slower pace compared to revenue growth.
Share-based
payment expenses increased to €1,280 million (first half of 2023: €1,167 million), mainly due to an increase
in the SAP share price of around €50 in the first half of 2024 (first half of 2023: increase in the SAP share price of around
€30). For more information about share-based payment expenses, see the Notes to the Consolidated Half-Year Financial Statements,
Note (B.3).
The
restructuring expenses, which increased to €2,873 million (first half of 2023: €257 million), mainly
relate to the transformation program that SAP announced in the first quarter of 2024 to further increase its focus on key strategic
growth areas, notably AI. The vast majority of projected expenses has already been recognized in the first half of 2024. For more
information about restructuring, see the Notes to the Consolidated Half-Year Financial Statements, Note (B.4).
Compared
with the same period in the previous year, our operating profit (IFRS) decreased 80%, or €1,740 million, to €434 million
(first half of 2023: €2,174 million), mainly due to the restructuring expenses.
The
described effects also apply to our non-IFRS operating profit and non-IFRS operating margin, which are excluded from the restructuring
expenses.
Profit
After Tax and Earnings per Share (IFRS)
Profit
after tax (IFRS) was €94 million (first half of 2023: €1,128 million), a decrease of more than 92% compared
to the same period in 2023. Basic earnings per share (IFRS) was €0.05 (first half of 2023: €0.97), a decrease of
95%. The change in profit after tax (IFRS) and in basic earnings per share (IFRS) is mainly due to the above-mentioned increase
in shared based compensation expenses and restructuring expenses. These effects are slightly compensated by the result of gains
and losses from equity securities, net which increased €164 million to €123 million (first half of 2023: –€41 million).
Profit after tax from continuing operations and discontinued operations decreased 97% from €3,491 million to €94 million
due to the above-mentioned effects and the divesture of Qualtrics and the corresponding disposal gain in the first half of 2023.
The
effective tax rate (IFRS) was 76.9% (first half of 2023: 36.3%). The year-over-year increase mainly resulted from a temporary
inability to offset withholding taxes in Germany due to tax losses in 2024 resulting from restructuring, which were partly compensated
by changes in tax-exempt income and non-deductible expenses.
Profit
After Tax and Earnings per Share (Non-IFRS)
Profit
after tax (non-IFRS) was €2,223 million (first half of 2023: €1,667 million), an increase of 33%. Basic
earnings per share (non-IFRS) was €1.91 (first half of 2023: €1.44), an increase of 33%. The change in profit after
tax (non-IFRS) and in basic earnings per share (non-IFRS) is mainly due to the above-mentioned increase of cloud revenue and improvements
in margin. Profit after tax from continuing operations and discontinued operations (non-IFRS) was €2,223 million (first
half of 2023: €3,448 million), due to the divesture of Qualtrics and the corresponding disposal gain in the first
half of 2023.
The
effective tax rate (non-IFRS) was 33.1% (first half of 2023: 31.0%). The year-over-year increase mainly resulted from a temporary
inability to offset withholding taxes in Germany due to tax losses in 2024 resulting from restructuring.
Segment
Information
At
the end of the first half of 2024, SAP had one operating segment.
For
more information about our segment reporting, see the Notes to the Consolidated Half-Year Financial Statements, Note (C.1)
and Note (C.2). For more information about our operating
performance, see the Operating Performance (IFRS and Non-IFRS) section in
this consolidated Half-Year Management Report.
| |
|
SAP
Half-Year Report 2024 |
Finances
and Assets (IFRS)
Cash
Flow
| €
millions |
Q1–Q2
2024 |
Q1–Q2
2023 |
∆ |
| Net cash
flows from operating activities |
4,297 |
3,160 |
36% |
| Capital
expenditure |
–365 |
–413 |
–12% |
| Payments
of lease liabilities |
–148 |
–188 |
–21% |
| Free
cash flow |
3,784 |
2,559 |
48% |
| Free
cash flow margin |
23 |
17 |
6pp |
| Free
cash flow (as a percentage of profit after tax) |
4,036 |
227 |
3,809pp |
The
higher operating cash flow is mainly attributable to increased profitability and an enhanced working capital management, as well
as lower payments for income taxes (€70 million decrease year over year). Payouts related to restructuring amounted
to €563 million in the first half of 2024. For more information about our transformation program, see the Notes to the
Consolidated Half-Year Financial Statements, Note (B.4).
The
free cash flow margin, defined as free cash flow as a percentage of total revenue, increased 6pp year over year.
Group
Liquidity
| €
millions |
|
|
2024 |
2023 |
Net
liquidity (+)/net debt (–) 12/31/2023
(PY:
12/31/2022) |
Free
Cash Flow |
|
3,521 |
–2,070 |
| Net cash
flows from operating activities |
3,784 |
|
4,297 |
3,160 |
| Capital
expenditure |
|
–365 |
–413 |
| Lease
payments |
|
–148 |
–188 |
| Business
combinations |
|
|
–19 |
0 |
| Dividends |
|
|
–2,565 |
–2,395 |
| Treasury
shares |
|
|
–975 |
0 |
| Net proceeds
from Qualtrics sale |
|
|
0 |
6,323 |
| Other |
|
|
–73 |
–237 |
Net
liquidity (+)/net debt (–) 6/30/2024
(PY:
6/30/2023) |
|
|
3,674 |
4,180 |
Liquidity and Financial Position
| €
millions |
6/30/2024 |
12/31/2023 |
∆ |
| Financial
debt |
–7,776 |
–7,755 |
–21 |
| Cash
and cash equivalents |
7,870 |
8,124 |
–254 |
| Current
time deposits and debt securities |
3,579 |
3,151 |
+428 |
| Group
liquidity |
11,449 |
11,275 |
+174 |
| Net
liquidity (+)/net debt (–) |
3,674 |
3,521 |
+153 |
| |
|
|
|
| Goodwill |
29,777 |
29,088 |
+689 |
| Total
assets |
70,378 |
68,335 |
+2,043 |
| Total
equity |
41,942 |
43,406 |
–1,465 |
| Equity
ratio (total equity as a percentage of total assets) |
60 |
64 |
–4pp |
| |
|
SAP
Half-Year Report 2024 |
Dividend
Policy
On
June 5, 2024, SAP announced that it was adjusting its dividend policy effective immediately.
The
new policy is to pay a dividend amounting to at least 40% of the Group’s non-IFRS profit after tax from continuing operations
(previously: at least 40% of the Group’s IFRS profit after tax).
This
change is intended to reduce volatility in the dividend payout ratio and ensure close alignment between dividend payout and financial
performance.
Employees
For
over five decades now, our people have been the driving force behind the continuous success of SAP, through dedication, customer
focus, and innovation power. Aiming for a highly engaged, diverse, future-fit workforce equipped with the right skills while also
adapting to new market trends helps SAP attract and retain the best talent.
As
part of SAP’s business transformation, we also want to leverage the power of AI to best support our managers and employees,
elevating their employee experience and guiding our people decisions, while increasing the digitalization and overall efficiency
and effectiveness of our People & Culture function.
In
the first six months of 2024, we accelerated the adoption of new transformational technologies to support our managers and employees
across the employee lifecycle with cutting-edge human capital management (HCM) solutions, for example:
| – | Our
over 105,000 employees have direct access to business AI solutions such as the internal
Job Matching Assistant app developed on SAP BTP. |
| – | More
than 4,000 SAP employees can already leverage Joule integrated
into SAP SuccessFactors, supported by our clear ambition for an SAP-wide
roll-out by the end of 2024. |
Aiming
to become one of the world’s leading AI-powered People & Culture functions, we apply insights from our own implementation
journey to help drive the development of leading-edge HCM solutions from an HR practitioner perspective, while actively sharing
our showcase with SAP customers and partners.
With
SAP entering a new era, we believe that getting together again in person more regularly (as envisaged by our Return to Office
guidance) will be key to success – fostering collaboration, innovation, and productivity as the basis for strengthening
our culture and shared values. In January 2024, we announced our evolved Pledge
to Flex hybrid work guidance, requiring all SAP employees to work three-days-a-week in-office or at a customer/partner site, considering
local regulations. A transition period until the end of April (for Germany until the end
of May), with targeted enablement for employees and leaders, ensured a country-specific adaptation and Company-wide ramp-up. An
exception handling framework empowers SAP leaders to grant temporary exceptions within certain guardrails. This supports employees
throughout the transition.
With
employees from more than 150 nationalities and five generations, diversity and inclusion (D&I) is an integral part of SAP’s
DNA. Over the last 18 months, we have received 170 Employer of Choice awards, including 55 recognitions for equality and diversity.
Our
D&I strategy focuses on multiple dimensions of human identity. From a gender diversity perspective, our aspiration to reach
gender parity continues, and we aim to increase the share of women in the workforce1 to 40% by the end of 2030. At
the end of the first half of 2024, women comprised 35.3% of our workforce and held 29.9% of all management positions2
at the Company. Also, SAP has set a new target of increasing the representation of women in executive roles3 to 25%
by the end of 2027. This target is linked to the compensation of the SAP Executive Board members. We are currently at 21.9%.
| |
|
SAP
Half-Year Report 2024 |
We
are building a leadership pipeline through initiatives such as our Women to Watch program; piloted in the first half of 2023 with
251 participants. The first cohort ran from May 2023 until April 2024 with a 27.9% progression and promotions rate during
this time. In addition, a stronger focus on inclusive hiring practices, which led to a 41.6% female hiring share in 2023, has
supported progress on our KPIs.
Crucial
to our success are our 13 employee network groups, led by over 900 employee volunteers, which connect one-third of our global
workforce across 50 countries. The Business Women’s Network, dedicated to helping women advance their careers at SAP, is
the largest of these groups, with more than 19,000 members. Through the active participation of employees, topics such as LGBT
inclusion, neurodiversity/autism inclusion, accessibility, and faith in the workplace also remain a priority for SAP.
Our
market-leading Fair Pay practices are agnostic of personal characteristics such as gender and age. They continue to ensure that all employees
are compensated both within the pay range for their individual roles and within the acceptable spread of pay differences with peers.
We accomplish this through annual global reviews and centrally funded pay adjustments, which most recently took place in the first half
of 2024. Our post-review analysis found that fewer women than men needed pay equity adjustments.
What’s more, 99.8% of employees have transparency into their own pay ranges and visibility into their annual compensation statements.
These statements were enhanced in 2024 to include the previous years’ equity grants (as applicable) and the value of top benefits
(available to 80% of employees compared to 66% in 2023). Among the top benefits, we displayed SAP’s contributions to pensions,
healthcare plans, and, where available, flexible benefits schemes in certain countries.
Looking
at our people-related KPIs, the Employee Engagement Index was at 72%, a decrease of 8pp compared to both the score of 80% in October 2023
and the full-year score published in our Integrated Report 2023. We expect the full-year score for Employee Engagement to
range between 70% and 74%. Our Leadership Trust Net Promoter Score remains robust at 67 points. Similarly, the Business Health
Culture Index stands strong at 78%, meeting the target corridor of 78% to 80%. At the end of the first half of 2024, SAP’s
Employee Retention Rate4 was still high at 96.6% (compared to 95.1% at the end of
the first half of 2023 and 96.4% at the end of 2023). On June 30, 2024, we had 105,315 FTEs worldwide (June 30, 2023:
105,328 FTEs; December 31, 2023: 107,602 FTEs). For a breakdown of headcount by function and geography,
see the Notes to the Consolidated Half Year Financial Statements, Note (B.1).
SAP
is constantly adapting to new market conditions and changing customer requirements. As part of this ongoing transformation, we
launched a Company-wide restructuring program in 2024. Our aim is to further simplify our structures and processes while investing
in key strategic growth areas such as AI. For more information on the impact of the program, see Note (B.4).
1 We
define “women in the workforce” as the share of women in the total workforce.
2 We
define “women in management” as the share of women in management positions as compared to the total number of managers,
expressed by the number of individuals and not FTEs. It includes three categories: 1) Managers managing teams: Refers to managing
teams of at least one employee or vacant positions; 2) Managers managing managers: Refers to managing managers who manage teams;
3) Executive Board members.
3 We
define “women in executive roles” as the ratio of women on the three management levels below the Executive Board out
of the combined total of all genders at these three levels. “Women in executive roles” is measured as a percentage
of women heads out of the total number of heads at those three executive levels.
4 Ratio
of the average number of employees minus the employees who left voluntarily, to the average number of employees, over the past
12 months (in full-time equivalents, or FTEs). This ratio puts emphasis on employee-initiated turnover. In other words, we
seek to measure how many employees choose to stay with SAP. As opposed to keeping a low turnover rate, we aim to keep our retention
rate high. For more transparency and precise headcount management purposes, the number of employees who left voluntarily excludes
those who left voluntarily as part of restructuring-related departures.
Energy
and Emissions
In the first half of
2024, we maintained our commitment to help rebuild a more resilient, restorative, and inclusive economy while respecting planetary
boundaries and human rights – both as an enabler and exemplar. SAP aims to put sustainability at the core of every business.
To help our customers on their sustainability journey, we offer an expanded portfolio of solutions for sustainability management.
For more information, see the Our Product Strategy section in this consolidated
Half-Year Management Report.
| |
|
SAP
Half-Year Report 2024 |
In
2023, SAP achieved carbon neutrality in its own operations following our strategic approach to first avoid, secondly reduce, and
thirdly compensate our yet unavoidable emissions. This means that the net carbon emissions of our own operations (covering scope 1,
2 and selected scope 3 emissions) reached 0 kilotons (kt) of CO2 equivalents (CO2e) after
we continued and expanded efficiency and innovation programs. Having reached our carbon neutrality milestone in 2023, we are now
focused on our next goal: achieving net zero emissions along our entire value chain (covering scope 1, 2 and 3)
by 2030 in line with a 1.5°C future. In this regard, we aim to apply the demanding Corporate Net-Zero Standard set by the
Science-Based Targets initiative (SBTi).
SAP’s
ESG efforts – along with its measures, initiatives, and targets – have been recognized by renowned sustainability
ratings and ranking organizations:
| – | In
IDC’s “Sustainability Index for Software Providers” report, SAP placed
in the top 3 of 23 assessed software vendors. |
| – | We
ranked 48th in Corporate Knights’ 2024 Global 100 Most Sustainable Corporations
in the World index. |
Organization
and Changes in Management
On
April 2, 2024, SAP announced that the Supervisory Board had extended the contract of Executive Board member Dr. Juergen
Mueller, Chief Technology Officer, for three years until the end of 2027.
On
May 6, 2024, SAP announced that the Supervisory Board had extended the contract of CEO and Executive Board member Christian
Klein for three years until the end of April 2028 and had made him the chairperson of the Executive Board.
Risk
Management and Risks
We
have comprehensive risk-management structures in place that are intended to enable us to recognize and analyze risks early on,
take the appropriate action, and mitigate any risks that materialize as presented in the Risk
Management and Risks section in our Integrated Report 2023 and our Annual Report on Form 20-F for 2023.
For
changes in our Litigation, Claims, and Legal Contingencies since our last Integrated Report, see the Notes to the Consolidated
Half-Year Financial Statements, Note (G.1).
Based
on our aggregation approach and taking into consideration the mitigations implemented for all our risk factors and risks, as at
June 30, 2024, we see no material change relative to our 2023 risk assessment or 2023 risk-bearing capacity. We do not
believe that any of the risks we identified in our Integrated Report 2023 and Annual Report on Form 20-F for 2023, and as
outlined herein, jeopardize our ability to continue as a going concern.
Expected
Developments and Opportunities
Future
Trends in the Global Economy
In
its most recent Economic Bulletin,1 the European Central Bank (ECB) presents a largely unchanged outlook for global
economic growth, compared to statements earlier this year: Global GDP growth in 2024 and beyond might remain slightly below the
average rate for the past decade. Presumably, the risks to economic growth will be balanced in the near term. However, trade tensions
between major economies, geopolitical risks, and restrictive monetary policies could diminish economic growth projections.
According
to the ECB, the euro area economy is likely to continue its services-led expansion in the near future, even at a higher pace than
previously suggested. Robust wage growth might lead to increasing disposable income, more confidence, and improving terms of trade,
giving rise to a consumption-driven recovery over the course of 2024. Economic growth in the euro area could also benefit from
a resilient labor market, lower inflation, and a pick-up in productivity over the projection horizon. Expanding foreign demand
should support euro area export growth.
| |
|
SAP
Half-Year Report 2024 |
In
the United States, the ECB expects imports to recover further in the second half of the year. Real GDP growth might increase slightly
but will likely remain below the pace of growth recorded in the second half of 2023.
As
for China, the ECB suggests that investment in industrial production will probably improve steadily, driven by stimulus in infrastructure
projects. However, it also projects continued weakness in producer price developments and sluggish domestic demand.
Economic
Trends – GDP Growth Year Over Year
| % |
2023 |
2024p |
2025p |
| World |
3.2 |
3.2 |
3.2 |
| Advanced
Economies |
1.6 |
1.7 |
1.8 |
| Emerging
Markets and Developing Economies |
4.3 |
4.2 |
4.2 |
| Regions
(according to IMF taxonomy) |
|
|
|
| Euro
Area |
0.4 |
0.8 |
1.5 |
| Germany |
–0.3 |
0.2 |
1.3 |
| Emerging
and Developing Europe |
3.2 |
3.1 |
2.8 |
| Middle
East and Central Asia |
2.0 |
2.8 |
4.2 |
| Sub-Saharan
Africa |
3.4 |
3.8 |
4.0 |
| United
States |
2.5 |
2.7 |
1.9 |
| Canada |
1.1 |
1.2 |
2.3 |
| Latin
America and the Caribbean |
2.3 |
2.0 |
2.5 |
| Japan |
1.9 |
0.9 |
1.0 |
| Emerging
and Developing Asia |
5.6 |
5.2 |
4.9 |
| China |
5.2 |
4.6 |
4.1 |
| p = projection |
|
|
|
Source:
International Monetary Fund (IMF), World Economic Outlook April 2024, Steady but Slow: Resilience amid Divergence (https://www.imf.org/-/media/Files/Publications/WEO/2024/April/English/text.ashx),
p. 10.
The
IT Market – Outlook for 2024 and Beyond
“The
demand for cloud-based enterprise applications software, which continues to be the foundational deployment model in the digital
era and AI everywhere world, outpaces that of on-premises and other software solutions.”2 This is what the U.S.-based
market research firm IDC said in May 2024 in its Worldwide Enterprise Applications Software Forecast 2024–2028. On-premise
deployment in the worldwide enterprise software market is expected to grow 2.3% CAGR whereas the public cloud growth rate is expected
to reach 16.5% CAGR by 2028.2 “With organizations making this shift to the cloud, and many others planning on
replacing their current cloud system, the enterprise applications software market overall, along with the individual application
markets, will continue to be very competitive for years to come,”2 says IDC.
Adding
generative artificial intelligence (GenAI) to the equation, IDC states: “Competitive advantage is a clear differentiator
in the digital world, and applying GenAI is a clear-cut win for organizations as it improves not only productivity but also decision
velocity.”2 Enterprise software vendors’ commercial models to monetize AI are in early stages, though.
Interestingly, “30.9% of the respondents from IDC’s 2024 SaaS Path Survey are willing to pay more for machine learning
and artificial intelligence capabilities”2,3 in their enterprise software landscape, which might lead to better
predictability of future revenue streams for vendors. As a clear mandate for enterprise software vendors, IDC advises to “embrace
generative AI. Vendors that are not embracing generative AI may find themselves in trouble quickly.”2,3 The aforementioned
2024 Survey finds that “across the enterprise application markets, 25.4% of corporations plan to replace their current application
if GenAI is not included in the next release and 21.4% will renew because GenAI is included in the next release.”2,3
Overall, “the transformative potential of GenAI in the business is an incredible opportunity to reshape business experience
completely,”2 says IDC.
| |
|
SAP
Half-Year Report 2024 |
As
an important aspect for vendors to focus on, IDC suggests to “harness the internal uses of GenAI, as Generative AI solutions
are revolutionizing the software development process by enabling the automatic generation of computer code from text prompts”.2
According to IDC, GenAI will have a multifold impact on software developer efficiency and productivity, by “handling
routine tasks and identifying errors but also modernizing legacy systems and facilitating language translation. This integration
of AI into development tools promises high-quality code recommendations, streamlining the creation process and bolstering security.”2
1 European
Central Bank, Economic Bulletin, Issue 4/2024, Publication Date: June 20, 2024
2 Worldwide
Enterprise Applications Software Forecast, 2024–2028: AI Everywhere World Brings Intelligence and Experience-Orchestrated
Applications. May 2024, IDC #US51079424
3 IDC
SaaS Path: Executive Summary, 2024 – Examining the SaaS Buyer’s Journey, 22-May-2024, IDC #US51872624
Impact
on SAP
The
number of macro challenges has not gotten smaller in 2024, and business model agility and resiliency is key for SAP and its customers.
Ongoing wars in Ukraine and Gaza pose real threats to supply chains, and trade tensions between major economies put additional
pressure on companies.
Nevertheless,
SAP reported very strong business results in the first six months of the year and confidently confirms the 2024 outlook.
Our
clear strategy towards cloud and business AI across the complete portfolio resonates with the robust demand from our customers.
As we focus on tangible and applicable use cases for our customers, enabling them to differentiate and gain competitive advantage
over their peers, the strategy positions SAP as trusted advisor and vendor of choice. Our healthy pipeline fueled by net new customers,
the cloud conversions by existing customers and substantial upselling and cross-selling makes us confident for the future. Growth
rates for Current Cloud Backlog, Cloud revenues and particularly for Cloud ERP Suite show sustained high values, and the percentage
of more predictable revenues reached 84% in the second quarter.
The
Company-wide transformation program that we initiated in January 2024 continues to progress well, further enhancing our operational
efficiencies and laying the groundwork for future growth and agility.
Financial
Targets and Prospects (Non-IFRS)
Revenue
and Operating Profit Targets and Prospects
In
April 2024, SAP revisited its 2024 outlook and confirmed its performance expectations underlying its January 2024 outlook.
In July 2024, SAP reconfirmed its 2024 outlook and continues to expect:
| – | €17.0 billion
to €17.3 billion in cloud revenue at constant currencies (2023: €13.66 billion),
up 24% to 27% at constant currencies |
| – | €29.0 billion
to €29.5 billion in cloud and software revenue at constant currencies (2023: €26.92 billion),
up 8% to 10% at constant currencies |
| – | €7.6 billion
to €7.9 billion non-IFRS operating profit at constant currencies (2023: €6.51 billion),
up 17% to 21% at constant currencies. |
| – | Free
cash flow of approximately €3.5 billion (2023: €5.09 billion) |
| – | An
effective tax rate (non-IFRS) of around 32.0% (2023: 30.3%) |
Additionally,
SAP continues to expect:
| – | Current
Cloud Backlog: we expect a year-end growth rate similar to that of 2023, while at a larger
scale |
| |
|
SAP
Half-Year Report 2024 |
| – | Cloud
ERP Suite revenue: we expect to sustain the high growth rate in 2024 |
While
SAP’s full-year 2024 business outlook is at constant currencies, actual-currency reported figures are expected to be impacted
by currency exchange rate fluctuations as the Company progresses through the year. For the third-quarter and full-year 2024
expected currency impacts, see the table below:
| Currency
Impact Assuming June 30, 2024 Rates Apply for 2024 |
|
| |
| In
percentage points |
Q3 |
FY |
|
| Cloud |
+0.5 pp |
−0.5 pp |
|
| Cloud
and software |
+0.5 pp |
−0.5 pp |
|
| Operating
profit |
+0.0 pp |
−1.5 pp |
|
The following table shows the estimates of the items
that represent the differences between our IFRS financial measures and our non-IFRS financial measures.
Non-IFRS
Measures
| €
millions |
Estimated
Amounts for
Full
Year 2024 |
Q1–Q2
2024
|
Q1–Q2
2023
|
| Acquisition-related
charges |
280–360 |
166 |
177 |
| Restructuring1 |
approximately
€3 B |
2,873 |
257 |
| Regulatory
compliance matters |
0 |
0 |
170 |
| Adjustment
for gains and losses from equity securities, net |
NA2 |
−123 |
41 |
1 For
more information about restructuring, see the Notes to the Consolidated Half-Year Financial Statements, Note (B.4).
2 We
do not provide an outlook for the effective tax rate (IFRS) due to the uncertainty and potential variability of gains and losses
associated with equity securities, which are reconciling items between the two effective tax rates (non-IFRS and IFRS). These
items cannot be provided without unreasonable efforts but could have a significant impact on our future effective tax rate (IFRS).
Furthermore,
the differences between free cash flow as our non-IFRS financial measure and operating cash flow as our IFRS financial measure
include estimated cash flows in 2024 for leasing and capital expenditures of €1.1 billion (2023: €1.1 billion).
Medium-Term
Prospects
SAP
is updating its financial ambition 2025, reflecting the anticipated incremental benefits from the expanded transformation program.
Overall savings from the transformation program are expected to include a triple-digit million Euro amount from the internal deployment
of Business AI scenarios.
By
2025, SAP now expects:
| – | Non-IFRS
operating profit of approximately €10.2 billion (previously: approximately
€10 billion) reflecting expected savings of approximately €200 million
from the increased volume of the restructuring program. |
SAP
continues to expect:
| – | Cloud
revenue of more than €21.5 billion |
| – | Total
revenue of more than €37.5 billion |
| – | Non-IFRS
cloud gross profit of approximately €16.2 billion |
| – | Free
cash flow of approximately €8.0 billion including an anticipated mid-triple-digit
million Euro restructuring payout in 2025 associated with the 2024 transformation program |
| – | A
share of more predictable revenue of approximately 86% |
The
2025 financial ambition is based on an exchange rate of 1.10 USD per EUR.
Furthermore,
SAP expects:
| – | Operating
margin to expand beyond 2025 |
| – | Total
revenue growth to accelerate through 2027 |
| |
|
SAP
Half-Year Report 2024 |
| – | The
sum of total revenue growth and free cash flow margin (as a percentage of total revenue)
to increase through 2025 (2023: 22% based on actual currency) |
Goals
for Liquidity, Finance, and Investments
SAP
believes that its liquid assets combined with its undrawn credit facilities are sufficient to meet its operating financing needs
in the second half of 2024 as well, and, together with expected cash flows from operations, will support debt repayments and its
currently planned capital expenditure requirements over the near and medium term.
In
2024 and compared to 2023, SAP expects a decrease in free cash flow to approximately €3.5 billion mainly due to restructuring
and compliance payments, which are expected to be partially offset by increased profitability. Consistently to what SAP disclosed
in its Integrated Report 2023, SAP reiterates its expectations for free cash flow of approximately €3.5 billion
in 2024 and approximately €8.0 billion in 2025 despite anticipated mid-triple-digit million Euro payouts due to restructuring.
Overall payouts associated with the program are currently expected at approximately €3 billion.
In
the second half of 2024, SAP intends to repay U.S. private placements with a volume of $0.3 billion as well as a Eurobond
with a volume of €0.9 billion.
SAP’s
planned investment expenditures for 2024 and 2025, other than from business combinations, consist primarily of the purchase of
IT infrastructure (such as data centers) and the construction of new buildings. Primarily driven by lower investment expenditures
for Facility and IT, SAP now expects planned investment expenditures below €900 million for 2024, compared to the approximately
€950 million disclosed in the Integrated Report 2023. In 2025, capital expenditures are still expected to decrease
to approximately €700 million.
Non-Financial
Goals 2024 and Ambitions for 2025
In
addition to our financial goals, we focus on four non-financial targets: customer loyalty, employee engagement, Net Zero climate
performance, and women in executive roles.
In
2024, SAP now expects the Employee Engagement Index to be in a range of 70% to 74% (previously: 76% to 80%).
SAP
continues to expect:
| – | A
Customer Net Promoter score of 9 to 13 |
| – | To
steadily decrease carbon emissions across the relevant value chain, in line with our
target of achieving Net Zero carbon emissions by 2030 |
| – | To
steadily increase the number of women in executive roles in line with our end of year
2027 target to achieve 25% |
For
2025, SAP now aims to increase the Employee Engagement Index (previously: Steadily increasing the Employee Engagement Index).
SAP
continues to aim for:
| – | A
steadily increasing Customer Net Promoter Score |
The
2025 non-financial ambitions are in addition to our medium-term targets of achieving net-zero carbon emissions across the value
chain by 2030 and of reaching 25% women in executive roles by the end of 2027.
Premises
on Which Our Outlook and Prospects Are Based
In
preparing our outlook and prospects, we have taken into account all events known to us at the time we prepared this report that
could influence SAP’s business going forward.
| |
|
SAP
Half-Year Report 2024 |
Opportunities
We
have comprehensive opportunity-management structures in place that are intended to enable us to recognize and analyze opportunities
early and to take the appropriate action. The opportunities remain largely unchanged compared to what we disclosed in our Integrated
Report 2023.
| |
|
SAP
Half-Year Report 2024 |
Consolidated
Half-Year Financial Statements – IFRS
| |
|
SAP
Half-Year Report 2024 |
 Consolidated Income Statement of SAP Group – Half Year
| €
millions, unless otherwise stated |
|
Q1–Q2
2024 |
Q1–Q2
2023 |
∆
in % |
| Cloud |
|
8,082 |
6,493 |
24 |
| Software
licenses |
|
432 |
591 |
–27 |
| Software
support |
|
5,621 |
5,778 |
–3 |
| Software
licenses and support |
|
6,053 |
6,369 |
–5 |
| Cloud
and software |
|
14,134 |
12,863 |
10 |
| Services |
|
2,195 |
2,132 |
3 |
| Total
revenue |
(A.1),
(C.2) |
16,329 |
14,995 |
9 |
| |
|
|
|
|
| Cost
of cloud |
|
–2,214 |
–1,897 |
17 |
| Cost
of software licenses and support |
|
–637 |
–687 |
–7 |
| Cost
of cloud and software |
|
–2,851 |
–2,584 |
10 |
| Cost
of services |
|
–1,699 |
–1,718 |
–1 |
| Total
cost of revenue |
|
–4,550 |
–4,301 |
6 |
| Gross
profit |
|
11,778 |
10,693 |
10 |
| Research
and development |
|
–3,270 |
–3,138 |
4 |
| Sales
and marketing |
|
–4,496 |
–4,457 |
1 |
| General
and administration |
|
–696 |
–670 |
4 |
| Restructuring |
(B.4) |
–2,873 |
–257 |
>100 |
| Other
operating income/expense, net |
|
–9 |
3 |
NA |
| Total
operating expenses |
|
–15,894 |
–12,820 |
24 |
| Operating
profit (loss) |
|
434 |
2,174 |
–80 |
| |
|
|
|
|
| Other
non-operating income/expense, net |
|
–153 |
–116 |
32 |
| Finance
income |
|
611 |
369 |
65 |
| Finance
costs |
|
–486 |
–656 |
–26 |
| Financial
income, net |
(C.3) |
125 |
–287 |
NA |
| Profit
(loss) before tax from continuing operations |
(C.2) |
407 |
1,771 |
–77 |
| |
|
|
|
|
| Income
tax expense |
|
–313 |
–643 |
–51 |
| Profit
(loss) after tax from continuing operations |
|
94 |
1,128 |
–92 |
| Attributable
to owners of parent |
|
60 |
1,135 |
–95 |
| Attributable
to non-controlling interests |
|
34 |
–7 |
NA |
| Profit
(loss) after tax from discontinued operations |
|
0 |
2,363 |
NA |
| Profit
(loss) after tax2 |
|
94 |
3,491 |
–97 |
| Attributable
to owners of parent2 |
|
60 |
3,640 |
–98 |
| Attributable
to non-controlling interests2 |
|
34 |
–149 |
NA |
| |
|
|
|
|
| Earnings
per share, basic (in €)1 from continuing operations |
|
0.05 |
0.97 |
–95 |
| Earnings
per share, basic (in €)1, 2 |
|
0.05 |
3.12 |
–98 |
| Earnings
per share, diluted (in €)1 from continuing operations |
|
0.05 |
0.97 |
–95 |
| Earnings
per share, diluted (in €)1, 2 |
|
0.05 |
3.09 |
–98 |
1 For
the six months ended June 30, 2024 and 2023, the weighted average number of shares was 1,167 million (diluted:
1,178 million) and 1,168 million (diluted: 1,176 million), respectively (treasury stock excluded).
2 From continuing and discontinued operations
| |
|
SAP
Half-Year Report 2024 |
Consolidated
Statements of Comprehensive Income of SAP Group – Half Year
| €
millions |
Q1–Q2
2024 |
Q1–Q2
2023 |
 Profit after tax
 |
94 |
3,890 |
| Items
that will not be reclassified to profit or loss |
|
|
| Remeasurements
on defined benefit pension plans, before tax |
–5 |
0 |
| Income
taxes relating to remeasurements on defined benefit pension plans |
0 |
0 |
| Remeasurements
on defined benefit pension plans, net of tax |
–4 |
0 |
| Other
comprehensive income for items that will not be reclassified to profit or loss, net of tax |
–4 |
0 |
| Items
that will be reclassified subsequently to profit or loss |
|
|
| Gains
(losses) on exchange differences on translation, before tax |
1,127 |
–755 |
| Reclassification
adjustments on exchange differences on translation, before tax |
25 |
–129 |
| Exchange
differences, before tax |
1,153 |
–884 |
| Income
taxes relating to exchange differences on translation |
10 |
8 |
| Exchange
differences, net of tax |
1,163 |
–876 |
| Gains
(losses) on cash flow hedges/cost of hedging, before tax |
4 |
45 |
| Reclassification
adjustments on cash flow hedges/cost of hedging, before tax |
–10 |
–32 |
| Cash
flow hedges/cost of hedging, before tax |
–6 |
13 |
| Income
taxes relating to cash flow hedges/cost of hedging |
7 |
–4 |
| Cash
flow hedges/cost of hedging, net of tax |
1 |
10 |
| Other
comprehensive income for items that will be reclassified to profit or loss, net of tax |
1,164 |
–866 |
| Other
comprehensive income, net of tax |
1,160 |
–866 |
| Total
comprehensive income1 |
1,253 |
3,024 |
| Attributable
to owners of parent1 |
1,207 |
3,233 |
| Attributable
to non-controlling interests1 |
47 |
–208 |
1 From
continuing and discontinued operations
| |
|
SAP
Half-Year Report 2024 |
 Consolidated Statement of Financial Position of SAP Group
| as
at 6/30/2024 and 12/31/2023 |
|
| €
millions |
|
2024 |
2023 |
| Cash
and cash equivalents |
|
7,870 |
8,124 |
| Other
financial assets |
|
3,808 |
3,344 |
| Trade
and other receivables |
|
6,148 |
6,322 |
| Other
non-financial assets |
(A.2) |
2,531 |
2,374 |
| Tax
assets |
|
539 |
407 |
| Total
current assets |
|
20,896 |
20,571 |
| Goodwill |
(D.1) |
29,777 |
29,088 |
| Intangible
assets |
|
2,365 |
2,505 |
| Property,
plant, and equipment |
(D.2) |
4,255 |
4,276 |
| Other
financial assets |
|
6,109 |
5,543 |
| Trade
and other receivables |
|
121 |
203 |
| Other
non-financial assets |
(A.2) |
3,515 |
3,573 |
| Tax
assets |
|
346 |
382 |
| Deferred
tax assets |
|
2,993 |
2,193 |
| Total
non-current assets |
|
49,482 |
47,763 |
| Total
assets |
|
70,378 |
68,335 |
| |
|
| €
millions |
|
2024 |
2023 |
| Trade
and other payables |
|
1,875 |
1,783 |
| Tax
liabilities |
|
439 |
266 |
| Financial
liabilities |
(E.2) |
2,271 |
1,735 |
| Other
non-financial liabilities |
|
4,002 |
5,648 |
| Provisions |
(B.4) |
2,341 |
235 |
| Contract
liabilities |
|
7,734 |
4,975 |
| Total
current liabilities |
|
18,662 |
14,642 |
| Trade
and other payables |
|
20 |
39 |
| Tax
liabilities |
|
818 |
877 |
| Financial
liabilities |
(E.2) |
7,321 |
7,941 |
| Other
non-financial liabilities |
|
850 |
698 |
| Provisions |
|
444 |
433 |
| Deferred
tax liabilities |
|
267 |
265 |
| Contract
liabilities |
|
55 |
33 |
| Total
non-current liabilities |
|
9,774 |
10,286 |
| Total
liabilities |
|
28,436 |
24,928 |
| Issued
capital |
|
1,229 |
1,229 |
| Share
premium |
|
2,263 |
1,845 |
| Retained
earnings |
|
39,953 |
42,457 |
| Other
components of equity |
|
3,519 |
2,368 |
| Treasury
shares |
|
–5,311 |
–4,741 |
| Equity
attributable to owners of parent |
|
41,652 |
43,157 |
| |
|
|
|
| Non-controlling
interests |
|
289 |
249 |
| Total
equity |
(E.1) |
41,942 |
43,406 |
| Total
equity and liabilities |
|
70,378 |
68,335 |
| |
|
|
|
|
| |
|
SAP
Half-Year Report 2024 |
Consolidated
Statements of Changes in Equity of SAP Group
| €
millions |
Equity
Attributable to Owners of Parent |
Non-
Controlling
Interests |
Total
Equity |
|
Issued
Capital |
Share
Premium |
Retained
Earnings |
Other
Components
of Equity |
Treasury
Shares |
Total |
|
| |
| 12/31/2022 |
1,229 |
3,081 |
36,418 |
3,801 |
–4,341 |
40,186 |
2,662 |
42,848 |
|
 Profit after tax
 |
|
|
3,933 |
|
|
3,933 |
–43 |
3,890 |
|
| Other
comprehensive income |
|
|
0 |
–701 |
|
–701 |
–165 |
–866 |
|
| Comprehensive
income |
|
|
3,933 |
–701 |
|
3,233 |
–208 |
3,024 |
|
| Share-based
payments |
|
777 |
|
|
|
777 |
111 |
888 |
|
| Dividends |
|
|
–2,395 |
|
|
–2,395 |
–21 |
–2,416 |
|
| Reissuance
of treasury shares under share-based payments |
|
|
|
|
182 |
182 |
|
182 |
|
| Transactions
with non-controlling interests |
|
–2,306 |
2,306 |
|
|
0 |
–2,261 |
–2,261 |
|
| Other
changes |
|
0 |
–37 |
|
|
–37 |
0 |
–37 |
|
| 6/30/2023 |
1,229 |
1,552 |
40,225 |
3,100 |
–4,159 |
41,946 |
283 |
42,229 |
|
| |
|
|
|
|
|
|
|
|
|
 12/31/2023
 |
1,229 |
1,845 |
42,457 |
2,368 |
–4,741 |
43,157 |
249 |
43,406 |
|
|
Profit after tax |
|
|
60 |
|
|
60 |
34 |
94 |
|
| Other
comprehensive income |
|
|
–4 |
1,152 |
|
1,147 |
13 |
1,160 |
|
| Comprehensive
income |
|
|
55 |
1,152 |
|
1,207 |
47 |
1,253 |
|
| Share-based
payments |
|
418 |
|
|
|
418 |
0 |
418 |
|
| Dividends |
|
|
–2,565 |
|
|
–2,565 |
–7 |
–2,571 |
|
| Purchase
of treasury shares |
|
|
|
|
–947 |
–947 |
|
–947 |
|
| Reissuance
of treasury shares under share-based payments |
|
|
|
|
377 |
377 |
|
377 |
|
| Other
changes |
|
|
5 |
|
|
5 |
0 |
6 |
|
 6/30/2024
 |
1,229 |
2,263 |
39,953 |
3,519 |
–5,311 |
41,652 |
289 |
41,942 |
|
| |
|
| |
|
SAP
Half-Year Report 2024 |
Consolidated
Statement of Cash Flows of SAP Group
| €
millions |
Q1–Q2
2024 |
Q1–Q2
2023 |
 Profit (loss) after tax
 |
94 |
3,890 |
| Adjustments
to reconcile profit (loss) after tax to net cash flows from operating activities: |
|
|
|
(Profit) loss after tax from discontinued operations |
0 |
–2,763 |
| Depreciation
and amortization |
626 |
714 |
| Share-based
payment expense |
1,280 |
1,167 |
 Income tax expense
 |
313 |
643 |
|
Financial income, net |
–125 |
287 |
| Decrease/increase
in allowances on trade receivables |
–23 |
5 |
| Other
adjustments for non-cash items |
110 |
76 |
| Increase/decrease
in trade and other receivables |
372 |
396 |
| Decrease/increase
in other assets |
–17 |
–600 |
| Increase/decrease
in trade payables, provisions, and other liabilities |
876 |
–896 |
| Increase/decrease
in contract liabilities |
2,718 |
2,109 |
| Share-based
payments |
–778 |
–697 |
| Interest
paid |
–378 |
–244 |
| Interest
received |
287 |
197 |
| Income
taxes paid, net of refunds |
–1,057 |
–1,127 |
| Net cash
flows from operating activities – continuing operations |
4,297 |
3,160 |
| Net cash
flows from operating activities – discontinued operations |
0 |
80 |
| Net
cash flows from operating activities |
4,297 |
3,240 |
| Business
combinations, net of cash and cash equivalents acquired |
–19 |
0 |
| Cash
flows from derivative financial instruments related to the sale of subsidiaries or businesses |
0 |
–91 |
| Purchase
of intangible assets and property, plant, and equipment |
–365 |
–413 |
| Proceeds
from sales of intangible assets and property, plant, and equipment |
55 |
43 |
| Purchase
of equity or debt instruments of other entities |
–7,987 |
–220 |
| Proceeds
from sales of equity or debt instruments of other entities |
7,370 |
722 |
| Net cash
flows from investing activities – continuing operations |
–947 |
41 |
| Net cash
flows from investing activities – discontinued operations |
0 |
6,323 |
| Net
cash flows from investing activities |
–947 |
6,364 |
| Dividends
paid |
–2,565 |
–2,395 |
| Dividends
paid on non-controlling interests |
–6 |
–18 |
| Purchase
of treasury shares |
–975 |
0 |
| Proceeds
from borrowings |
1 |
0 |
| Repayments
of borrowings |
–14 |
–1,724 |
| Payments
of lease liabilities |
–148 |
–188 |
| Transactions
with non-controlling interests |
0 |
43 |
| Net cash
flows from financing activities – continuing operations |
–3,708 |
–4,283 |
| Net cash
flows from financing activities – discontinued operations |
0 |
24 |
| Net
cash flows from financing activities |
–3,708 |
–4,259 |
| Effect
of foreign currency rates on cash and cash equivalents |
104 |
–212 |
| Net
decrease/increase in cash and cash equivalents |
–254 |
5,134 |
 Cash
and cash equivalents at the beginning of the period Cash
and cash equivalents at the beginning of the period |
8,124 |
9,008 |
|
Cash and cash equivalents at the end of the period |
7,870 |
14,142 |
| |
|
SAP
Half-Year Report 2024 |
Notes
to the Consolidated Half-Year Financial Statements
(IN.1) Basis for
Preparation
General Information About
Consolidated Half-Year Financial Statements
The registered seat
of SAP SE is in Walldorf, Germany (Commercial Register of the Lower Court of Mannheim HRB 719915). The condensed Consolidated
Half-Year Financial Statements of SAP SE and its subsidiaries (collectively, “we,” “us,” “our,”
“SAP,” “Group,” and “Company”) have been prepared in accordance with the International Financial
Reporting Standards (IFRS) and in particular in compliance with International Accounting Standard (IAS) 34. In this context,
IFRS includes all standards issued by the International Accounting Standards Board (IASB) and related interpretations issued by
the IFRS Interpretations Committee (IFRS IC). The variances between the applicable IFRS standards as issued by the IASB and
the standards as used by the European Union are not relevant to these financial statements.
Certain information
and disclosures normally included in the notes to annual financial statements prepared in accordance with IFRS have been condensed
or omitted. We believe that the disclosures made are adequate and that the information gives a true and fair view.
With the ongoing transformation
from on-premise to cloud services, our business activities are no longer significantly influenced by seasonal effects. Consequently,
interim results are now more indicative of our results for the full year, enabling more consistent financial planning and forecasting.
Our operating cash
flow, however, is generally highest in the first quarter.
Amounts reported in
previous years have been reclassified if appropriate to conform to the presentation in this half-year report.
These unaudited condensed
Consolidated Half-Year Financial Statements should be read in conjunction with SAP’s audited Consolidated IFRS Financial
Statements for the Year Ended December 31, 2023, included in our Integrated Report 2023 and our Annual Report on
Form 20-F for 2023.
Due to rounding, numbers
presented throughout these Consolidated Half-Year Financial Statements may not add up precisely to the totals we provide and percentages
may not precisely reflect the absolute figures.
Amounts disclosed in
our Consolidated Half-Year Financial Statements that are taken directly from our  Consolidated Income Statements or our
  Consolidated Statements of Financial Position
are marked by the symbols and ,
respectively.
Consolidated Statements of Financial Position
are marked by the symbols and ,
respectively.
Accounting Policies, Management
Judgments, and Sources of Estimation Uncertainty
How We Present
Our Accounting Policies, Judgments, and Estimates
To ease the understanding
of our financial statements, we present the accounting policies, judgments, and estimates on a given subject together with other
disclosures related to the same subject in the Note that deals with this subject, and highlighted this disclosure with a light
gray box and the symbol  . We describe, however,
only material changes of our accounting policies, judgments, and estimates in relation to our Consolidated Financial Statements
for 2023.
. We describe, however,
only material changes of our accounting policies, judgments, and estimates in relation to our Consolidated Financial Statements
for 2023.
| |
|
SAP
Half-Year Report 2024 |
New Accounting Standards Not Yet Adopted
The
IASB has issued IFRS 9 and IFRS 7 (Amendments to the Classification and Measurement of Financial Instruments) and published
the new standard IFRS 18 (Presentation and Disclosure in Financial Statements) which are relevant for SAP but not yet effective.
We are currently assessing the potential impacts on SAP.
| |
|
SAP
Half-Year Report 2024 |
Section A
– Customers
This section discusses
disclosures related to contracts with our customers. These consist of revenue breakdowns and information about our trade receivables.
For more information, see our Consolidated Financial Statements for 2023, Section A
– Customers.
(A.1) Revenue
Accounting for Revenue from Contracts with Customers
Allocation
of Transaction Price
We
have established a hierarchy to identify the standalone selling prices (SSPs) that we use to allocate the transaction price of
a customer contract to the performance obligations in the contract.
–
Where SSPs for an offering are observable and reasonably consistent across customers (that is, not highly variable), our SSP estimates
are derived from our respective pricing history. Typically, our standardized support offerings and our professional service offerings
follow this approach.
–
Where sales prices for an offering are not directly observable or highly variable across customers, we use estimation techniques.
As
of 2024, we apply a new estimation technique to estimate the SSP using input parameters that more appropriately reflect SAP’s
evolving business models. This SSP considers overall pricing objectives, taking market conditions and other factors into account.
We estimate the SSP using a specific pricing range that encompasses the majority of our transactions. Typically, our cloud offerings
follow this approach.
The
change in estimation techniques for our cloud offerings did not lead to any material change in the allocation of transaction prices
of a customer contract to the performance obligations of the contract. This estimate is based on contracts signed in the first
half of the year and is subject to change based on the volume and nature of business conducted in the second half of the year.
As
the Company’s go-to-market strategies evolve, the Company may modify its pricing practices in the future, which could result
in changes to our SSPs.
–
For offerings for which we cannot justify a range and we observe highly variable pricing, and for which we lack substantial direct
costs to estimate based on a cost-plus-margin approach, we allocate the transaction price by applying a residual approach. We
use this technique in particular for our standard on-premise software offerings.
Judgment
is required when estimating SSPs. To judge whether the historical pricing of our goods and services is highly variable, we have
established thresholds of pricing variability.
When
we estimate an SSP range based on pricing objectives, we use judgment in determining the upper and lower end of the range. Such
judgment considers price points achieved in the market as well as strategic pricing decisions.
Geographic Information
The amounts for revenue
by region in the following tables are based on the location of customers.
Cloud Revenue
by Region
| €
millions |
Q1–Q2
2024 |
Q1–Q2
2023 |
| EMEA |
3,230 |
2,458 |
| Americas |
3,761 |
3,194 |
| APJ |
1,090 |
841 |
|
SAP Group |
8,082 |
6,493 |
| |
|
SAP
Half-Year Report 2024 |
Cloud and Software Revenue by Region
| €
millions |
Q1–Q2
2024 |
Q1–Q2
2023 |
| EMEA |
6,325 |
5,660 |
| Americas |
5,776 |
5,283 |
| APJ |
2,034 |
1,919 |
|
SAP Group |
14,134 |
12,863 |
Total Revenue by Region
| €
millions |
Q1–Q2
2024 |
Q1–Q2
2023 |
| Germany |
2,520 |
2,283 |
| Rest
of EMEA |
4,804 |
4,338 |
| EMEA |
7,323 |
6,621 |
| United
States |
5,369 |
4,974 |
| Rest
of Americas |
1,359 |
1,233 |
| Americas |
6,728 |
6,207 |
| Japan |
662 |
616 |
| Rest
of APJ |
1,615 |
1,550 |
| APJ |
2,277 |
2,166 |
|
SAP Group |
16,329 |
14,995 |
For more information
about our revenue accounting policies, see the Notes to the Consolidated Financial Statements for 2023, Note (A.1).
(A.2) Trade and
Other Receivables
| €
millions |
6/30/2024 |
| Current |
Non-Current |
Total |
| Trade
receivables, net |
5,721 |
4 |
5,725 |
| Other
receivables |
427 |
116 |
543 |
|
Total |
6,148 |
121 |
6,269 |
| €
millions |
12/31/2023 |
| Current |
Non-Current |
Total |
| Trade
receivables, net |
5,892 |
5 |
5,897 |
| Other
receivables |
429 |
198 |
627 |
|
Total |
6,321 |
203 |
6,524 |
| |
|
SAP
Half-Year Report 2024 |
Section B
– Employees
This section provides
financial insights into our employee benefit arrangements. It should be read in conjunction with the compensation disclosures
for key management personnel in Note (G.5) in our Consolidated Financial
Statements for 2023, as well as SAP’s Compensation Report. For more
information, see our Consolidated Financial Statements for 2023, Section B –
Employees.
(B.1) Employee
Headcount
On June 30, 2024,
the breakdown of our full-time equivalent employee numbers by function and by region was as shown in the table below.
Number of Employees (in Full-Time
Equivalents)
| Full-time
equivalents |
6/30/2024 |
6/30/2023 |
| |
EMEA |
Americas |
APJ |
Total |
EMEA |
Americas |
APJ |
Total |
| Cloud
and software |
4,434 |
4,148 |
4,448 |
13,029 |
4,010 |
4,083 |
4,000 |
12,093 |
| Services |
8,292 |
4,618 |
5,410 |
18,320 |
7,993 |
5,000 |
5,476 |
18,469 |
| Research
and development |
18,073 |
5,441 |
12,331 |
35,844 |
17,910 |
5,872 |
12,318 |
36,100 |
| Sales and
marketing |
12,053 |
9,438 |
5,112 |
26,603 |
11,778 |
10,121 |
5,303 |
27,202 |
| General and
administration |
3,640 |
1,723 |
1,291 |
6,653 |
3,475 |
1,765 |
1,281 |
6,521 |
| Infrastructure |
2,845 |
1,129 |
890 |
4,865 |
2,800 |
1,284 |
859 |
4,943 |
| SAP
Group (6/30) |
49,337 |
26,496 |
29,482 |
105,315 |
47,966 |
28,125 |
29,237 |
105,328 |
| Thereof
acquisitions1 |
0 |
0 |
0 |
0 |
0 |
0 |
0 |
0 |
| SAP
Group (six months’ end average) |
49,414 |
27,689 |
29,745 |
106,848 |
47,917 |
28,127 |
29,337 |
105,380 |
1 Acquisitions
closed between January 1 and June 30 of the respective year
(B.2) Employee
Benefits Expenses
| €
millions |
Q1–Q2
2024 |
Q1–Q2
2023 |
| Salaries |
6,173 |
5,915 |
| Social
security expenses |
1,056 |
975 |
| Share-based
payment expenses |
1,280 |
1,167 |
| Pension
expenses |
254 |
235 |
| Employee-related
restructuring expenses |
2,873 |
250 |
| Termination
benefits |
13 |
22 |
| Employee
benefits expenses |
11,649 |
8,565 |
| |
|
SAP
Half-Year Report 2024 |
(B.3)
Share-Based Payments
The
allocations of expenses for share-based payments to the various expense items are as follows:
Share-Based
Payments
| €
millions |
Q1–Q2
2024 |
Q1–Q2
2023 |
| Cost
of cloud |
73 |
47 |
| Cost
of software licenses and support |
22 |
20 |
| Cost
of services |
192 |
198 |
| Research
and development |
403 |
371 |
| Sales
and marketing |
476 |
435 |
| General
and administration |
114 |
96 |
| Share-based
payment expenses |
1,280 |
1,167 |
| Thereof
cash-settled share-based payments |
515 |
473 |
| Thereof
equity-settled share-based payments |
765 |
694 |
In
the first half of 2024, SAP also recognized €189 million (first half of 2023: €0 million) in accelerated
share-based payment expenses triggered by the transformation program. These share-based payment expenses are classified as restructuring
expenses in our consolidated income statements. For more information about SAP’s restructuring program, see Note (B.4).
Move SAP
Plan and Grow SAP Plan
In
the first half of 2024, we granted 7.4 million (first half of 2023: 13.9 million) share units. This includes 7.0 million
(first half of 2023: 12.4 million) share units which we intend to settle in shares. The dilutive effect of outstanding
equity-settled share units is reflected in the calculation of earnings per share, diluted. Of the share units we intend to settle
in cash, 0.8 million share units were granted in June 2023 under the Grow SAP plan for the last time.
Own SAP
Plan
Under
the Own SAP plan, employees can purchase, on a monthly basis, SAP shares without any required holding period. The number
of shares purchased by our employees under this plan was 2.4 million in the first half of 2024 (first half of 2023: 3.5 million).
For
more information about our share-based payments and a detailed description of our share-based payment plans, see the Notes to
the Consolidated Financial Statements for 2023, Note (B.3).
(B.4)
Restructuring
| €
millions |
Q1–Q2
2024 |
Q1–Q2
2023 |
Employee-related
restructuring expenses |
2,873 |
250 |
Onerous
contract-related restructuring expenses and restructuring related impairment losses |
–1 |
8 |
|
Restructuring expenses |
2,873 |
257 |
The
vast majority of the restructuring expenses and related payments recognized in the first half of 2024 relate to the Company-wide
transformation program that SAP announced in the first quarter to further increase its focus on key strategic growth areas, in
particular business AI. SAP is transforming its operational setup to capture organizational synergies and AI-driven efficiencies,
and to prepare the company for highly scalable future revenue growth. The restructuring is intended to ensure that SAP’s
skillset and resources continue to meet future business needs and is expected to affect 9,000 to 10,000 positions, a majority
of which will be covered by voluntary leave programs and internal re-skilling measures. The program is expected to be concluded
early 2025.
| |
|
SAP
Half-Year Report 2024 |
Restructuring
expenses primarily include employee-related benefits such as severance payments and accelerated share-based payment expenses triggered
by the transformation program (for more information on recognition and measurement of share-based payment programs, see Note B.3).
The restructuring costs presented in 2023 mainly include expenses related to the targeted restructuring program in selected areas
of the Company that was executed in 2023.
For
the movement of the restructuring provision, please refer to the below table:
| €
millions |
Restructuring
Provision |
| Opening
balance as at 1/1/2024 |
37 |
| Additions |
2,873 |
| Utilizations |
–550 |
| Transfer
to share-based payment liability |
–92 |
| Ending
balance as at 6/30/2024 |
2,268 |
The
table below reconciles the utilization of the restructuring provision with the overall cash outflow related to restructuring:
| €
millions |
Q1–Q2
2024 |
| Utilizations |
550 |
| Restructuring
related share-based payments |
2 |
| Payments
related to time account |
11 |
| Net
cash outflow |
563 |
If
not presented separately, the restructuring expenses would break down in our income statements as follows:
Restructuring
Expenses by Functional Area
| €
millions |
Q1–Q2
2024 |
Q1–Q2
2023 |
| Cost
of cloud |
95 |
6 |
| Cost
of software licenses and support |
80 |
11 |
| Cost
of services |
533 |
34 |
| Research
and development |
1,100 |
40 |
| Sales
and marketing |
906 |
150 |
| General
and administration |
160 |
16 |
|
Restructuring expenses |
2,873 |
257 |
| |
|
SAP
Half-Year Report 2024 |
Section C
– Financial Results
This
section provides insight into the financial results of SAP’s reportable segments and of SAP overall, as far as not already
covered by previous sections. This includes segment results and income taxes. For more information, see our Consolidated Financial
Statements for 2023, Section C – Financial Results.
(C.1)
Results of Segments
General
Information
At
year end 2023, SAP had five operating segments. The Applications, Technology & Services (ATS) segment was SAP’s only
reportable segment. Due to their size, the Emarsys, Taulia, Sustainability, and Business Network segments were non-reportable.
In
the first quarter of 2024, the non-reportable Business Network segment was dissolved and integrated into the ATS segment.
SAP
is evolving into a holistically steered cloud company with the help of a cohesive product portfolio and commercialization of product
bundles (such as RISE with SAP and GROW with SAP). In the course of this continuous transformation and the resulting
changes in Executive Board responsibility in the second quarter of 2024, it was concluded that SAP’s Chief Operating Decision
Maker (CODM) steers SAP on a consolidated basis. Consequently, with effect from the second quarter of 2024, SAP has a single operating
segment.
Segment Reporting Policies
Our
management reporting system produces reports that present information about our business activities in a variety of ways, for
example, by line of business, geography, and areas of responsibility of individual Board members. Based on these reports, the
Executive Board, which is responsible for assessing the performance of our Company and for making resource allocation decisions
as our Chief Operating Decision Maker (CODM), evaluates business activities in based on several different results. However, operating
results of SAP are reviewed on a Group level by the CODM as a whole.
There
are no parts of our Company that qualify as separate operating segments under IFRS 8, and our Executive Board assesses the
financial performance of our Company on a consolidated basis.
Our
management reporting system produces a variety of reports that differ due to the currency exchange rates used in the accounting
for foreign-currency transactions and operations, where both actual and constant currency numbers are reported to and used by
our CODM. Reports based on actual currencies use the same currency rates that are used in our financial statements, whereas reports
based on constant-currency report revenues and expenses use the average exchange rates from the previous year’s corresponding
period.
We
use an operating profit indicator to measure the performance of our operating segments. The accounting policies applied in the
measurement of operating segment expenses and profit differ as follows from the IFRS accounting principles used to determine the
operating profit measure in our income statement:
The
expense measures exclude:
| – | Acquisition-related
charges such as amortization expense and impairment charges for intangibles acquired
in business combinations, including goodwill impairment charges, and certain standalone
acquisitions of intellectual property (including purchased in-process research and development)
as well as settlements of pre-existing business relationships in connection with a business
combination, and acquisition-related third-party expenses |
| |
|
SAP
Half-Year Report 2024 |
| – | Regulatory
compliance matter expenses |
| | | |
Information
about assets and liabilities is not regularly provided to our CODM.
Results
of Segments
| €
millions, unless otherwise stated |
Q1–Q2
2024 |
Q1–Q2
2023 |
Actual
Currency
|
Constant
Currency
|
Actual
Currency
|
| Cloud |
8,082 |
8,131 |
6,493 |
| Software
licenses |
432 |
436 |
591 |
| Software
support |
5,621 |
5,661 |
5,778 |
| Software
licenses and support |
6,053 |
6,097 |
6,369 |
| Cloud
and software |
14,134 |
14,228 |
12,863 |
| Services |
2,195 |
2,202 |
2,132 |
| Total
segment revenue |
16,329 |
16,430 |
14,995 |
| Cost
of cloud |
–2,190 |
–2,197 |
–1,876 |
| Cost
of software licenses and support |
–637 |
–633 |
–665 |
| Cost
of cloud and software |
–2,827 |
–2,830 |
–2,541 |
| Cost
of services |
–1,699 |
–1,700 |
–1,717 |
| Total
cost of revenue |
–4,526 |
–4,530 |
–4,258 |
| Cloud
gross profit |
5,892 |
5,934 |
4,617 |
| Segment
gross profit |
11,803 |
11,900 |
10,737 |
| Other
segment expenses |
–8,330 |
–8,360 |
–7,958 |
| Segment
profit (loss) |
3,473 |
3,540 |
2,779 |
In
the first half of 2024, the depreciation and amortization expense decreased 13% (13% at constant currencies), from €537 million
to €468 million.
For
more information about the disaggregation of revenue, see the Notes to the Consolidated Half-Year Financial Statements, Note (A.1).
(C.2)
Reconciliation of Segment Measures to Income Statement
| €
millions |
Q1–Q2
2024 |
Q1–Q2
2023 |
Actual
Currency
|
Constant
Currency
|
Actual
Currency
|
| Total
segment revenue |
16,329 |
16,430 |
14,995 |
| Adjustment
for currency impact |
0 |
–101 |
0 |
|
Total revenue |
16,329 |
16,329 |
14,995 |
| Total
segment profit |
3,473 |
3,540 |
2,779 |
| Adjustment
for currency impact |
0 |
–67 |
0 |
| Adjustment
for |
|
|
|
| Acquisition-related
charges |
–166 |
–166 |
–177 |
|
Restructuring |
–2,873 |
–2,873 |
–257 |
| Regulatory
compliance matter expenses |
0 |
0 |
–170 |
|
Operating profit |
434 |
434 |
2,174 |
|
Other non-operating income/expense, net |
–153 |
–153 |
–116 |
| Financial
income, net |
2 |
2 |
–247 |
| Adjustment
for gains and losses from equity securities, net |
123 |
123 |
–41 |
| Profit
before tax |
407 |
407 |
1,771 |
| |
|
SAP
Half-Year Report 2024 |
(C.3)
Financial Income, Net
In
the first half of 2024, finance income mainly consisted of income from gains from disposals and fair value adjustments of equity
securities totaling €284 million (first half of 2023: €186 million), and interest income from loans and
receivables, other financial assets (cash, cash equivalents, and current investments) as well as from derivatives amounting to
€327 million (first half of 2023: €190 million).
In
the first half of 2024, finance costs were primarily impacted by losses from disposals and fair value adjustments of equity securities
amounting to €159 million (first half of 2023: €226 million), and interest expense on financial liabilities
including lease liabilities as well as negative effects from derivatives amounting to €260 million (first half of 2023: €370 million).
For
more information about our financial income, net, see the Notes to the Consolidated Financial Statements for 2023, Note (C.4).
(C.4)
Income Taxes
We
are subject to ongoing tax audits by domestic and foreign tax authorities. Currently, we are in dispute mainly with the German
and only a few foreign tax authorities. The German dispute is in respect of certain secured capital investments, while the few
foreign disputes are mainly in respect of the deductibility of intercompany royalty payments and intercompany services. In all
cases, we expect that a favorable outcome can only be achieved through litigation. For all of these matters, we have not recorded
a provision as we believe that the tax authorities’ claims have no merit and that no adjustment is warranted. If, contrary
to our view, the tax authorities were to prevail in their arguments before the court, we would expect to have an additional expense
of approximately €1,991 million (2023: €1,815 million) in total (including related interest expenses
and penalties of €1,095 million (2023: €1,003 million)).
| |
|
SAP
Half-Year Report 2024 |
Section D
– Invested Capital
This
section highlights the non-current assets including investments that form the basis of our operating activities. Additions in
invested capital include separate asset acquisitions or business combinations. For more information, see our Consolidated Financial
Statements for 2023, Section D – Invested Capital.
(D.1)
Goodwill
In
the first half of 2024, the Company underwent several changes in its segment structure. Starting in the second quarter of 2024,
the Company now has a single operating segment and monitors its goodwill at this level. For more information, see Note (C.1).
The €689 million increase in goodwill since December 31, 2023, was due to the revaluation of amounts denominated
in foreign currencies. The Company evaluates on an ongoing basis whether there are triggering events that would require an impairment
test for goodwill through both qualitative and quantitative analyses. Our assessment of internal and external factors in the first
half of 2024, including the change in segment structure and reorganizations which have no adverse effect, led us to conclude that
no triggering events occurred since our annual goodwill impairment test in 2023. No impairment tests were performed in the first
half of 2024.
(D.2)
Property, Plant, and Equipment
Property,
Plant, and Equipment (Summary)
| €
millions |
6/30/2024 |
12/31/2023 |
| Property,
plant, and equipment excluding leases |
2,925 |
2,901 |
| Right-of-use
assets |
1,330 |
1,375 |
|
Total |
4,255 |
4,276 |
| |
|
|
| Additions |
Q1–Q2
2024 |
Q1–Q4
2023 |
| Property,
plant, and equipment excluding leases |
308 |
626 |
| Right-of-use
assets |
123 |
184 |
|
Total |
431 |
810 |
| |
|
SAP
Half-Year Report 2024 |
Section E
– Capital Structure, Financing, and Liquidity
This
section provides information related to how SAP manages its capital structure. Our capital management is based on a high equity
ratio, modest financial leverage, a well-balanced maturity profile, and deep debt capacity. For more information, see our Consolidated
Financial Statements for 2023, Section E – Capital Structure, Financing,
and Liquidity.
(E.1)
Total Equity
Number
of Shares
| millions |
Issued
Capital |
Treasury
Shares |
| 12/31/2022 |
1,228.5 |
–61.4 |
| Reissuance
under share-based payments |
0 |
2.6 |
| 6/30/2023 |
1,228.5 |
–58.8 |
| |
|
|
| 12/31/2023 |
1,228.5 |
–61.3 |
| Reissuance
under share-based payments |
0 |
4.6 |
| Purchase |
0 |
–5.3 |
| 6/30/2024 |
1,228.5 |
–62.0 |
In
the first half of 2023, we reissued 2.6 million treasury shares to service share-based payment awards under our Move SAP
plan. In the first half of 2024, we bought back 5.3 million shares and reissued 4.6 million treasury shares to service
share-based payment awards under our Move SAP plan.
Other
Components of Equity
| €
millions |
Exchange
Differences |
Cash
Flow Hedges |
Total |
| 12/31/2022 |
4,015 |
16 |
4,031 |
| Other
comprehensive income |
–876 |
10 |
–866 |
| 6/30/2023 |
3,140 |
26 |
3,165 |
| |
|
|
|
| 12/31/2023 |
2,418 |
9 |
2,426 |
| Other
comprehensive income |
1,163 |
1 |
1,164 |
| 6/30/2024 |
3,581 |
10 |
3,591 |
| |
|
SAP
Half-Year Report 2024 |
(E.2)
Liquidity
| €
millions |
6/30/2024 |
| Nominal
Volume |
Carrying
Amount |
| Current |
Non-
Current |
Current |
Non-
Current |
Total |
| Bonds |
1,450 |
5,930 |
1,449 |
5,296 |
6,745 |
| Private
placement transactions |
302 |
93 |
303 |
97 |
400 |
| Commercial
Paper |
0 |
0 |
0 |
0 |
0 |
| Bank
loans |
0 |
0 |
0 |
0 |
0 |
| Financial
debt |
1,752 |
6,024 |
1,752 |
5,393 |
7,145 |
| Lease
liabilities |
NA |
NA |
287 |
1,300 |
1,587 |
| Other
financial liabilities |
NA |
NA |
233 |
627 |
860 |
|
Financial liabilities |
|
|
2,271 |
7,321 |
9,592 |
| Financial
debt as % of financial
liabilities |
|
|
77 |
74 |
74 |
| €
millions |
12/31/2023 |
| Nominal
Volume |
Carrying
Amount |
| Current |
Non-
Current |
Current |
Non-
Current |
Total |
| Bonds |
850 |
6,521 |
849 |
5,932 |
6,780 |
| Private
placement transactions |
292 |
90 |
294 |
95 |
388 |
| Commercial
Paper |
0 |
0 |
0 |
0 |
0 |
| Bank
loans |
0 |
0 |
0 |
0 |
0 |
| Financial
debt |
1,143 |
6,612 |
1,143 |
6,026 |
7,169 |
| Lease
liabilities |
NA |
NA |
294 |
1,327 |
1,621 |
| Other
financial liabilities |
NA |
NA |
298 |
588 |
886 |
|
Financial liabilities |
|
|
1,735 |
7,941 |
9,676 |
| Financial
debt as % of financial
liabilities |
|
|
66 |
76 |
74 |
| |
|
SAP
Half-Year Report 2024 |
Section F
– Management of Financial Risk Factors
This
section discusses financial risk factors and risk management. In our half-year report, this includes the transfers between levels
of the fair value hierarchy. For more information, particularly about our risk management related to foreign currency exchange
rate risk, interest rate risk, equity price risk, credit risk, liquidity risk, and other financial risk factors, see our Consolidated
Financial Statements for 2023, Section F – Risk Management and Fair Value
Disclosures.
(F.1)
Financial Risk Factors, Financial Risk Management, and Fair Value Disclosures on Financial Instruments
A
detailed overview of our other financial instruments, financial risk factors, the management of financial risks, and the
determination of fair value as well as the classification of our other financial instruments into the fair value hierarchy of
IFRS 13 are presented in Note (F.1) and (F.2) in
the Consolidated Financial Statements for 2023.
We
do not disclose the fair value of our financial instruments as at June 30, 2024, for the following reasons:
| – | For
a large number of our financial instruments, their carrying amounts are a reasonable
approximation of their fair values, and |
| – | For
those financial instruments where the carrying amount differs from fair value, there
was no material change in the relation between carrying amount and fair value since December 31, 2023. |
On
June 5, 2024, SAP and WalkMe Ltd. (“WalkMe” / NASDAQ: WKME) announced that the companies had entered into
a definitive agreement under which SAP will acquire 100% of WalkMe. The acquisition is subject to customary closing conditions,
including the receipt of WalkMe shareholder approval and necessary regulatory clearances. To hedge against EUR-USD fluctuations
and thus to secure the euro countervalue of the purchase price of approximately US$1.5 billion, we have entered into a deal
contingent forward applying cash flow hedge accounting.
| |
|
SAP
Half-Year Report 2024 |
Section G
– Other Disclosures
This
section provides additional disclosures on miscellaneous topics, including information pertaining to other litigation, claims,
and legal contingencies, and related party transactions. For more information, see our Consolidated Financial Statements for 2023,
Section G – Other Disclosures.
(G.1)
Other Litigation, Claims, and Legal Contingencies
We
are subject to a variety of claims and lawsuits that arise from time to time in the ordinary course of our business, including
proceedings and claims that relate to companies we have acquired. We will continue to vigorously defend against all claims and
lawsuits against us. We currently believe that resolving the claims and lawsuits pending as at June 30, 2024, will neither
individually nor in the aggregate have a material adverse effect on our business.
Among
the claims and lawsuits are the following classes (for more information about these classes, see the Notes to the Consolidated
Financial Statements for 2023, Note (G.3)).
Intellectual-Property-Related
Litigation and Claims
For
individual cases of intellectual-property-related litigation and claims disclosed in our Integrated Report 2023, there were
no significant developments in the first half of 2024.
The
provisions recorded for intellectual-property-related litigation and claims continue to be not material. There have also been
no significant changes during the first half of 2024 relating to our assessment for contingent liabilities from intellectual-property-related
litigation and claims for which no provision has been recognized.
Tax-Related
Litigation
There
have been no significant changes in contingent liabilities from non-income tax-related litigation for which no provision has been
recognized compared to our Consolidated Financial Statements for 2023, Note (G.3).
For
more information about our income tax-related litigation, see Note (C.4).
Anti-Bribery Matters
In
January 2024, following comprehensive and exhaustive investigations, dialogue, and corresponding remediation activities,
SAP entered into a final settlement agreement with the U.S. Securities and Exchange Commission (U.S. SEC) and the U.S. Department
of Justice (U.S. DOJ), as well as with local authorities and parties in South Africa, to resolve the criminal and civil claims
against SAP fully and finally. Under this agreement, SAP has been required to make payments amounting to €207 million
and will continue to enhance its compliance program, including related internal controls, policies, and procedures, and report
to and cooperate with relevant regulators.
As
a consequence of the agreement, as at December 31, 2023, provisions for fines in regulatory compliance matters totaling
€155 million were recognized in our Consolidated Financial Statements for the year 2023 as well as repayments to customers,
for which revenue recognized from contracts with customers have been reversed. A considerable portion of these repayments to customers
was eligible to be credited against the fines incurred in the regulatory compliance matters. Significant payments were made in
the first half of 2024. The remaining provision as at June 30, 2024, amounts to €25 million and is expected
to be settled in the second half of 2024.
For
more information, see the Notes to the Consolidated Financial Statements for 2023, Note (G.3).
| |
|
SAP
Half-Year Report 2024 |
(G.2)
Related Party Transactions
Certain
Executive Board and Supervisory Board members of SAP SE currently hold or have held positions of significant responsibility
with other entities (for more information, see the Notes to the Consolidated Financial Statements for 2023, Note (G.4)).
We have relationships with certain of these entities in the ordinary course of business.
On
May 15, 2024, the Annual General Meeting of Shareholders elected Pekka Ala-Pietilä as chairperson of the Supervisory
Board as successor to Hasso Plattner, whose term of office expired with effect from that date. As of his election date, Pekka
Ala-Pietilä became a related party. Subsequently, all parties that were considered related to SAP due to their connection
to and/or their relationship with Hasso Plattner will not be considered as related parties after May 15, 2024. This
includes transactions after that date as well as outstanding balances and commitments.
| |
Executive
Board Members |
Supervisory
Board Members |
Companies
Controlled by
Supervisory
Board Members |
Associated
Entities |
| €
millions |
Q1–Q2
2024 |
Q1–Q2
2023 |
Q1–Q2
2024 |
Q1–Q2
2023 |
Q1–Q2
2024 |
Q1–Q2
2023 |
Q1–Q2
2024 |
Q1–Q2
2023 |
Products
and services provided |
NA |
NA |
NA |
0 |
0 |
0 |
22 |
9 |
Products
and services received |
0 |
NA |
01 |
11 |
1 |
2 |
50 |
60 |
Sponsoring
and other financial support provided |
NA |
NA |
NA |
NA |
5 |
2 |
NA |
NA |
| Outstanding
balances on 6/30 (Vendors) |
NA |
NA |
NA |
0 |
NA |
0 |
3 |
2 |
| Outstanding
balances on 6/30 (Customers) |
NA |
NA |
NA |
0 |
NA |
0 |
1 |
1 |
| Commitments
on 6/30 |
NA |
NA |
NA |
0 |
NA |
48 |
NA |
NA |
1 Including
services from employee representatives on the Supervisory Board in their capacity as employees of SAP
For
more information about related party transactions, see the Notes to the Consolidated Financial Statements for 2023, Note (G.6).
(G.3)
Events after the Reporting Period
No events have occurred
since June 30, 2024, that have a material impact on the Company’s Consolidated Half-Year Financial Statements.
(G.4)
Scope of Consolidation
Entities
Consolidated in the Financial Statements
| |
Total |
| 12/31/2023 |
235 |
| Additions |
2 |
| Disposals |
–11 |
| 6/30/2024 |
226 |
The
additions in the first half of 2024 relate to legal entities added in connection with acquisitions and foundations. The disposals
are mainly due to liquidations and mergers of legal entities.
For
more information about our business combinations and the effect on our Consolidated Financial Statements, see the SAP Integrated
Report 2023.
| |
|
SAP
Half-Year Report 2024 |
Release
of the Consolidated Half-Year Financial Statements
The
Executive Board of SAP SE approved these Consolidated Half-Year Financial Statements on July 21, 2024, for submission
to the Audit and Compliance Committee of the Supervisory Board and for subsequent issuance.
| |
|
SAP
Half-Year Report 2024 |
Responsibility
Statement
To
the best of our knowledge, and in accordance with the applicable reporting principles for half-year financial reporting, the Consolidated
Half-Year Financial Statements give a true and fair view of the assets, liabilities, financial position, and profit or loss of
the SAP Group, and the Consolidated Half-Year Management Report of the SAP Group includes a fair review of the development
and performance of the business and the position of the SAP Group, together with a description of the material opportunities
and risks associated with the expected development of the SAP Group for the remaining months of the financial year.
Walldorf,
July 21, 2024
SAP SE
Walldorf,
Baden
The
Executive Board
| Christian Klein |
Muhammad Alam |
| |
|
| Dominik Asam |
Dr. Juergen Mueller |
| |
|
| Scott Russell |
Thomas Saueressig |
| |
|
| Gina Vargiu-Breuer |
Julia White |
| |
|
SAP
Half-Year Report 2024 |
Supplementary
Financial Information
Financial
and Non-Financial Key Facts (IFRS and Non-IFRS)
| €
millions, unless otherwise stated |
Q1
2023 |
Q2
2023 |
Q3
2023 |
Q4
2023 |
TY
2023 |
Q1
2024 |
Q2
2024 |
| Revenues |
|
|
|
|
|
|
|
| Cloud |
3,178 |
3,316 |
3,472 |
3,699 |
13,664 |
3,928 |
4,153 |
| %
change – yoy |
24 |
19 |
16 |
20 |
20 |
24 |
25 |
| %
change constant currency – yoy |
22 |
22 |
23 |
25 |
23 |
25 |
25 |
| Cloud
ERP Suite |
2,422 |
2,562 |
2,711 |
2,931 |
10,626 |
3,167 |
3,414 |
| %
change – yoy |
35 |
30 |
26 |
28 |
29 |
31 |
33 |
| %
change constant currency – yoy |
33 |
33 |
34 |
33 |
33 |
32 |
33 |
| Software
licenses |
276 |
316 |
335 |
838 |
1,764 |
203 |
229 |
| %
change – yoy |
–13 |
–26 |
–17 |
–8 |
–14 |
–26 |
–28 |
| %
change constant currency – yoy |
–13 |
–24 |
–14 |
–6 |
–12 |
–25 |
–27 |
| Software
support |
2,905 |
2,873 |
2,872 |
2,846 |
11,496 |
2,829 |
2,792 |
| %
change – yoy |
–1 |
–3 |
–5 |
–5 |
–3 |
–3 |
–3 |
| %
change constant currency – yoy |
–1 |
–1 |
–1 |
–1 |
–1 |
–1 |
–3 |
| Software
licenses and support |
3,180 |
3,189 |
3,208 |
3,683 |
13,261 |
3,031 |
3,021 |
| %
change – yoy |
–2 |
–6 |
–6 |
–6 |
–5 |
–5 |
–5 |
| %
change constant currency – yoy |
–2 |
–4 |
–2 |
–2 |
–3 |
–4 |
–5 |
| Cloud
and software |
6,358 |
6,505 |
6,679 |
7,382 |
26,924 |
6,960 |
7,175 |
| %
change – yoy |
10 |
5 |
4 |
6 |
6 |
9 |
10 |
| %
change constant currency – yoy |
8 |
8 |
9 |
10 |
9 |
11 |
10 |
| Total
revenue |
7,441 |
7,554 |
7,744 |
8,468 |
31,207 |
8,041 |
8,288 |
| %
change – yoy |
10 |
5 |
4 |
5 |
6 |
8 |
10 |
| %
change constant currency – yoy |
9 |
8 |
9 |
9 |
9 |
9 |
10 |
| Share
of more predictable revenue (in %) |
82 |
82 |
82 |
77 |
81 |
84 |
84 |
| Profits |
|
|
|
|
|
|
|
| Operating
profit (loss) (IFRS) |
803 |
1,371 |
1,723 |
1,902 |
5,799 |
–787 |
1,222 |
| Operating
profit (loss) (non-IFRS) |
1,321 |
1,457 |
1,767 |
1,969 |
6,514 |
1,533 |
1,940 |
| %
change -yoy |
–15 |
14 |
7 |
1 |
1 |
16 |
33 |
| %
change constant currency - yoy |
–15 |
19 |
13 |
5 |
5 |
19 |
35 |
| Profit
(loss) after tax (IFRS) |
403 |
724 |
1,272 |
1,201 |
3,600 |
–824 |
918 |
| Profit
(loss) after tax (non-IFRS) |
868 |
799 |
1,352 |
1,302 |
4,321 |
944 |
1,278 |
| %
change |
–20 |
–9 |
13 |
–10 |
–6 |
9 |
60 |
| Margins |
|
|
|
|
|
|
|
| Cloud
gross margin (IFRS, in %) |
70.5 |
71.1 |
72.7 |
71.9 |
71.6 |
72.2 |
73.0 |
| Cloud
gross margin (non-IFRS, in %) |
70.8 |
71.4 |
73.0 |
72.2 |
71.9 |
72.5 |
73.3 |
| Software
license and support gross margin (IFRS, in %) |
88.6 |
89.8 |
90.0 |
89.8 |
89.6 |
89.2 |
89.7 |
| Software
license and support gross margin (non-IFRS, in %) |
88.9 |
90.2 |
90.1 |
89.8 |
89.8 |
89.2 |
89.7 |
| Cloud
and software gross margin (IFRS, in %) |
79.5 |
80.3 |
81.0 |
80.8 |
80.4 |
79.6 |
80.0 |
| Cloud
and software gross margin (non-IFRS, in %) |
79.9 |
80.6 |
81.2 |
81.0 |
80.7 |
79.8 |
80.2 |
| Gross
margin (IFRS, in %) |
71.0 |
71.6 |
72.8 |
73.3 |
72.2 |
71.7 |
72.6 |
| Gross
margin (non-IFRS, in %) |
71.3 |
71.9 |
73.0 |
73.4 |
72.4 |
71.8 |
72.7 |
| Operating
margin (IFRS, in %) |
10.8 |
18.2 |
22.2 |
22.5 |
18.6 |
–9.8 |
14.7 |
| |
|
SAP
Half-Year Report 2024 |
| €
millions, unless otherwise stated |
Q1
2023 |
Q2
2023 |
Q3
2023 |
Q4
2023 |
TY
2023 |
Q1
2024 |
Q2
2024 |
| Operating
margin (non-IFRS, in %) |
17.8 |
19.3 |
22.8 |
23.3 |
20.9 |
19.1 |
23.4 |
| Key
Profit Ratios |
|
|
|
|
|
|
|
| Effective
tax rate (IFRS, in %) |
40.5 |
33.8 |
27.8 |
33.6 |
32.6 |
16.0 |
33.8 |
| Effective
tax rate (non-IFRS, in %) |
29.1 |
33.0 |
27.1 |
32.5 |
30.3 |
32.4 |
33.6 |
| |
|
|
|
|
|
|
|
| Earnings
per share, basic (IFRS, in €) from continuing operations |
0.35 |
0.62 |
1.09 |
1.05 |
3.11 |
–0.71 |
0.76 |
| Earnings
per share, basic (non-IFRS, in €) from continuing operations |
0.75 |
0.69 |
1.16 |
1.12 |
3.72 |
0.81 |
1.10 |
| Earnings
per share, basic (IFRS, in €)1 |
0.41 |
2.70 |
1.09 |
1.05 |
5.26 |
–0.71 |
0.76 |
| Earnings
per share, basic (non-IFRS, in €)1 |
0.83 |
2.40 |
1.16 |
1.12 |
5.51 |
0.81 |
1.10 |
| Order
Entry and current cloud backlog |
|
|
|
|
|
|
|
| Current
cloud backlog |
11,148 |
11,537 |
12,269 |
13,745 |
13,745 |
14,179 |
14,803 |
| %
change – yoy |
25 |
21 |
19 |
25 |
25 |
27 |
28 |
| %
change constant currency – yoy |
25 |
25 |
25 |
27 |
27 |
28 |
28 |
| Share
of cloud orders greater than €5 million based on total cloud order entry volume (in %) |
45 |
46 |
49 |
62 |
55 |
52 |
52 |
| Share
of cloud orders smaller than €1 million based on total cloud order entry volume (in %) |
26 |
25 |
21 |
14 |
19 |
21 |
20 |
| Liquidity
and Cash Flow |
|
|
|
|
|
|
|
| Net
cash flows from operating activities |
2,311 |
848 |
1,124 |
1,926 |
6,210 |
2,757 |
1,540 |
| Purchase
of intangible assets and property, plant, and equipment |
–257 |
–156 |
–182 |
–190 |
–785 |
–187 |
–178 |
| Payments
of lease liabilities |
–99 |
–89 |
–78 |
–66 |
–332 |
–78 |
–70 |
| Free
cash flow |
1,955 |
604 |
865 |
1,670 |
5,093 |
2,492 |
1,291 |
| %
of total revenue |
26 |
8 |
11 |
20 |
16 |
31 |
16 |
| %
of profit after tax (IFRS) |
485 |
83 |
68 |
139 |
141 |
NA |
141 |
| Cash
and cash equivalents |
8,766 |
14,142 |
9,378 |
8,124 |
8,124 |
9,295 |
7,870 |
| Group
liquidity |
9,700 |
14,326 |
12,122 |
11,275 |
11,275 |
13,411 |
11,449 |
| Financial
debt (–) |
–10,751 |
–10,146 |
–8,445 |
–7,755 |
–7,755 |
–7,770 |
–7,776 |
| Net
liquidity (+) / Net debt (–) |
–1,050 |
4,180 |
3,677 |
3,521 |
3,521 |
5,641 |
3,674 |
| Non-Financials |
|
|
|
|
|
|
|
| Number
of employees (quarter end)2 |
105,132 |
105,328 |
106,495 |
107,602 |
107,602 |
108,133 |
105,315 |
| Employee
retention (in %, rolling 12 months) |
93.8 |
95.1 |
96.0 |
96.4 |
96.4 |
96.6 |
96.6 |
| Women
in management (in %, quarter end) |
29.4 |
29.5 |
29.5 |
29.7 |
29.7 |
29.8 |
29.9 |
| Women
in executive roles (in %, quarter end) |
21.8 |
21.9 |
22.1 |
22.2 |
22.2 |
21.7 |
21.9 |
Gross
greenhouse gas emissions (scope 1, 2, 3 / market-based)3
(in
million tons CO2 equivalents) |
|
|
|
|
6.9 |
1.8 |
1.8 |
1
From continuing and discontinued operations
2
In full-time equivalents
3
Our gross greenhouse gas emissions (GHG) – which cover scope 1, scope 2, and scope 3 (market-based) – include
the total lifecycle emissions resulting from the use of our on-premise software. A projection over the next 12 months amounts
to 5.9 million tons CO2e. The calculation of use of sold products emissions is based on the number of active maintenance
contracts at quarter end. Therefore, the emissions for individual quarters will not add up to the total sum of GHG emissions at
year end.
| |
|
SAP
Half-Year Report 2024 |
Reconciliation
of Non-IFRS Numbers to IFRS Numbers – Half Year
Reconciliation
of Non-IFRS Revenue – Year-to-Date
| |
Q1–Q2
2024 |
Q1–Q2
2023 |
∆
in % |
| €
millions, unless otherwise stated |
IFRS |
Currency
Impact |
Non-IFRS
Constant
Currency |
IFRS |
IFRS |
Non-IFRS
Constant
Currency |
| Revenue
Numbers |
|
|
|
|
|
|
| Cloud |
8,082 |
49 |
8,131 |
6,493 |
24 |
25 |
| Software
licenses |
432 |
5 |
436 |
591 |
–27 |
–26 |
| Software
support |
5,621 |
40 |
5,661 |
5,778 |
–3 |
–2 |
| Software
licenses and support |
6,053 |
44 |
6,097 |
6,369 |
–5 |
–4 |
| Cloud
and software |
14,134 |
93 |
14,228 |
12,863 |
10 |
11 |
| Services |
2,195 |
8 |
2,202 |
2,132 |
3 |
3 |
| Total
revenue |
16,329 |
101 |
16,430 |
14,995 |
9 |
10 |
Reconciliation
of Non-IFRS Operating Expenses – Year-to-Date
| |
Q1–Q2
2024 |
Q1–Q2
2023 |
∆
in % |
| €
millions, unless otherwise stated |
IFRS |
Adj. |
Non-IFRS |
Currency
Impact |
Non-IFRS
Constant
Currency |
IFRS |
Adj. |
Non-IFRS |
IFRS |
Non-IFRS |
Non-IFRS
Constant
Currency |
| Operating
Expense Numbers |
|
|
|
|
|
|
|
|
|
|
|
| Cost
of cloud |
–2,214 |
25 |
–2,190 |
|
|
–1,897 |
21 |
–1,876 |
17 |
17 |
|
| Cost
of software licenses and support |
–637 |
0 |
–637 |
|
|
–687 |
22 |
–665 |
–7 |
–4 |
|
| Cost
of cloud and software |
–2,851 |
25 |
–2,827 |
|
|
–2,584 |
43 |
–2,541 |
10 |
11 |
|
| Cost
of services |
–1,699 |
0 |
–1,699 |
|
|
–1,718 |
0 |
–1,717 |
–1 |
–1 |
|
| Total
cost of revenue |
–4,550 |
25 |
–4,526 |
|
|
–4,301 |
44 |
–4,258 |
6 |
6 |
|
| Gross
profit |
11,778 |
25 |
11,803 |
97 |
11,900 |
10,693 |
44 |
10,737 |
10 |
10 |
11 |
| Research
and development |
–3,270 |
3 |
–3,267 |
|
|
–3,138 |
4 |
–3,134 |
4 |
4 |
|
| Sales
and marketing |
–4,496 |
129 |
–4,366 |
|
|
–4,457 |
299 |
–4,158 |
1 |
5 |
|
| General
and administration |
–696 |
9 |
–687 |
|
|
–670 |
1 |
–669 |
4 |
3 |
|
| Restructuring |
–2,873 |
2,873 |
0 |
|
|
–257 |
257 |
0 |
>100 |
NA |
|
| Other
operating income/expense, net |
–9 |
0 |
–9 |
|
|
3 |
0 |
3 |
NA |
NA |
|
| Total
operating expenses |
–15,894 |
3,039 |
–12,855 |
–34 |
–12,890 |
–12,820 |
604 |
–12,216 |
24 |
5 |
6 |
| |
|
SAP
Half-Year Report 2024 |
Reconciliation
of Non-IFRS Profit Figures, Income Tax, and Key Ratios – Year-to-Date
| |
Q1–Q2
2024 |
Q1–Q2
2023 |
∆
in % |
| €
millions, unless otherwise stated |
IFRS |
Adj. |
Non-IFRS |
Currency
Impact |
Non-IFRS
Constant
Currency |
IFRS |
Adj. |
Non-IFRS |
IFRS |
Non-IFRS |
Non-IFRS
Constant
Currency |
| Profit
Numbers |
|
|
|
|
|
|
|
|
|
|
|
| Operating
profit (loss) |
434 |
3,039 |
3,473 |
67 |
3,540 |
2,174 |
604 |
2,779 |
–80 |
25 |
27 |
| Other
non-operating income/expense, net |
–153 |
0 |
–153 |
|
|
–116 |
0 |
–116 |
32 |
32 |
|
| Finance
income |
611 |
–282 |
328 |
|
|
369 |
–185 |
184 |
65 |
79 |
|
| Finance
costs |
–486 |
159 |
–327 |
|
|
–656 |
226 |
–430 |
–26 |
–24 |
|
| Financial
income, net |
125 |
–123 |
2 |
|
|
–287 |
41 |
–247 |
NA |
NA |
|
| Profit
(loss) before tax from continuing operations |
407 |
2,916 |
3,322 |
|
|
1,771 |
645 |
2,416 |
–77 |
37 |
|
| Income
tax expense |
–313 |
–787 |
–1,100 |
|
|
–643 |
–106 |
–749 |
–51 |
47 |
|
| Profit
(loss) after tax from continuing operations |
94 |
2,129 |
2,223 |
|
|
1,128 |
539 |
1,667 |
–92 |
33 |
|
| Attributable
to owners of parent |
60 |
2,163 |
2,222 |
|
|
1,135 |
543 |
1,678 |
–95 |
32 |
|
| Attributable
to non-controlling interests |
34 |
–34 |
0 |
|
|
–7 |
–4 |
–11 |
NA |
NA |
|
| Profit
(loss) after tax1 |
94 |
2,129 |
2,223 |
|
|
3,491 |
–43 |
3,448 |
–97 |
–36 |
|
| Attributable
to owners of parent1 |
60 |
2,163 |
2,222 |
|
|
3,640 |
136 |
3,776 |
–98 |
–41 |
|
| Attributable
to non-controlling interests1 |
34 |
–34 |
0 |
|
|
–149 |
–179 |
–327 |
NA |
NA |
|
| |
|
|
|
|
|
|
|
|
|
|
|
| Key
Ratios |
|
|
|
|
|
|
|
|
|
|
|
| Operating
margin (in %) |
2.7 |
|
21.3 |
|
21.5 |
14.5 |
|
18.5 |
–11.8pp |
2.7pp |
3.0pp |
| Effective
tax rate (in %)2 |
76.9 |
|
33.1 |
|
|
36.3 |
|
31.0 |
40.6pp |
2.1pp |
|
| Earnings
per share, basic (in €) from continuing operations |
0.05 |
|
1.91 |
|
|
0.97 |
|
1.44 |
–95 |
33 |
|
| Earnings
per share, basic (in €)1 |
0.05 |
|
1.91 |
|
|
3.12 |
|
3.23 |
–98 |
–41 |
|
1
From continuing and discontinued operations
2
The difference between our effective tax rate (IFRS) and our effective tax rate (non-IFRS) in the first half of 2024 and 2023
mainly resulted from restructuring expenses.
Reconciliation
of Free Cash Flow
| €
millions, unless otherwise stated |
Q1–Q2
2024 |
Q1–Q2
2023 |
| Net
cash flows from operating activities – continuing operations |
4,297 |
3,160 |
| Purchase
of intangible assets and property, plant, and equipment |
–365 |
–413 |
| Payments
of lease liabilities |
–148 |
–188 |
| Free
cash flow |
3,784 |
2,559 |
| |
|
|
| Net
cash flows from investing activities – continuing operations |
–947 |
41 |
| Net
cash flows from financing activities – continuing operations |
–3,708 |
–4,283 |
| |
|
SAP
Half-Year Report 2024 |
Non-IFRS
Adjustments Actuals and Estimates – Half Year
| €
millions, unless otherwise stated |
Estimated
Amounts for
Full Year 2024 |
Q1–Q2
2024 |
Q1–Q2
2023 |
| Profit
(loss) before tax from continuing operations (IFRS) |
|
407 |
1,771 |
| Adjustment
for acquisition-related charges |
280–360 |
166 |
177 |
| Adjustment
for restructuring |
approximately
€3 B |
2,873 |
257 |
| Adjustment
for regulatory compliance matter expenses |
0 |
0 |
170 |
| Adjustment
for gains and losses from equity securities, net |
NA1 |
–123 |
41 |
| Profit
(loss) before tax from continuing operations (non-IFRS) |
|
3,322 |
2,416 |
1
Due to the uncertainty and potential variability of gains and losses from equity securities, we cannot provide an estimate
for the full year without unreasonable efforts. This item could, however, have a material impact on our non-IFRS measures below
operating profit.
Non-IFRS-Adjustments
by Functional Areas – Half Year
| |
Q1–Q2
2024 |
Q1–Q2
2023 |
| €
millions |
IFRS |
Acquisition-
Related |
Restruc-
turing |
RCM1 |
Non-IFRS |
IFRS |
Acquisition
-Related |
Restruc-
turing |
RCM1 |
Non-IFRS |
| Cost
of cloud |
–2,214 |
25 |
0 |
0 |
–2,190 |
–1,897 |
21 |
0 |
0 |
–1,876 |
| Cost
of software licenses and support |
–637 |
0 |
0 |
0 |
–637 |
–687 |
22 |
0 |
0 |
–665 |
| Cost
of services |
–1,699 |
0 |
0 |
0 |
–1,699 |
–1,718 |
0 |
0 |
0 |
–1,717 |
| Research
and development |
–3,270 |
3 |
0 |
0 |
–3,267 |
–3,138 |
4 |
0 |
0 |
–3,134 |
| Sales
and marketing |
–4,496 |
129 |
0 |
0 |
–4,366 |
–4,457 |
129 |
0 |
170 |
–4,158 |
| General
and administration |
–696 |
9 |
0 |
0 |
–687 |
–670 |
1 |
0 |
0 |
–669 |
| Restructuring |
–2,873 |
0 |
2,873 |
0 |
0 |
–257 |
0 |
257 |
0 |
0 |
| Other
operating income/expense, net |
–9 |
0 |
0 |
0 |
–9 |
3 |
0 |
0 |
0 |
3 |
| Total
operating expenses |
–15,894 |
166 |
2,873 |
0 |
–12,855 |
–12,820 |
177 |
257 |
170 |
–12,216 |
1
Regulatory compliance matters
| |
|
SAP
Half-Year Report 2024 |
Revenue
by Region (IFRS and Non-IFRS) – Half Year
| |
Q1–Q2
2024 |
Q1–Q2
2023 |
∆
in % |
| €
millions |
Actual
Currency |
Currency
Impact |
Constant
Currency |
Actual
Currency |
Actual
Currency |
Constant
Currency |
| Cloud
Revenue by Region |
|
|
|
| EMEA |
3,230 |
–12 |
3,219 |
2,458 |
31 |
31 |
| Americas |
3,761 |
5 |
3,766 |
3,194 |
18 |
18 |
| APJ |
1,090 |
56 |
1,146 |
841 |
30 |
36 |
| Cloud
revenue |
8,082 |
49 |
8,131 |
6,493 |
24 |
25 |
| Cloud
and Software Revenue by Region |
|
|
|
| EMEA |
6,325 |
–18 |
6,306 |
5,660 |
12 |
11 |
| Americas |
5,776 |
5 |
5,781 |
5,283 |
9 |
9 |
| APJ |
2,034 |
107 |
2,140 |
1,919 |
6 |
12 |
| Cloud
and software revenue |
14,134 |
93 |
14,228 |
12,863 |
10 |
11 |
| Total
Revenue by Region |
|
|
|
| Germany |
2,520 |
0 |
2,520 |
2,283 |
10 |
10 |
| Rest
of EMEA |
4,804 |
–23 |
4,781 |
4,338 |
11 |
10 |
| Total
EMEA |
7,323 |
–23 |
7,301 |
6,621 |
11 |
10 |
| United
States |
5,369 |
1 |
5,370 |
4,974 |
8 |
8 |
| Rest
of Americas |
1,359 |
3 |
1,362 |
1,233 |
10 |
10 |
| Total
Americas |
6,728 |
4 |
6,732 |
6,207 |
8 |
8 |
| Japan |
662 |
78 |
740 |
616 |
7 |
20 |
| Rest
of APJ |
1,615 |
42 |
1,658 |
1,550 |
4 |
7 |
| Total
APJ |
2,277 |
120 |
2,397 |
2,166 |
5 |
11 |
| Total
revenue |
16,329 |
101 |
16,430 |
14,995 |
9 |
10 |
| |
|
SAP
Half-Year Report 2024 |
General
Information
Forward-Looking
Statements
This
half-year report contains forward-looking statements and information based on the beliefs of, and assumptions made by, our management
using information currently available to them. Any statements contained in this report that are not historical facts are forward-looking
statements as defined in the U.S. Private Securities Litigation Reform Act of 1995. We have based these forward-looking statements
on our current expectations, assumptions, and projections about future conditions and events. As a result, our forward-looking
statements and information are subject to uncertainties and risks, many of which are beyond our control. If one or more of these
uncertainties or risks materializes, or if management’s underlying assumptions prove incorrect, our actual results could
differ materially from those described in or inferred from our forward-looking statements and information. We describe these risks
and uncertainties in the Risk Management and Risks section, respectively
in the there-mentioned sources.
The
words “aim,” “anticipate,” “assume,” “believe,” “continue,” “could,”
“counting on,” “is confident,” “development,” “estimate,” “expect,”
“forecast,” “future trends,” “guidance,” “intend,” “may,” “might,”
“outlook,” “plan,” “project,” “predict,” “seek,” “should,”
“strategy,” “want,” “will,” “would,” and similar expressions as they relate to
us are intended to identify such forward-looking statements. Such statements include, for example, those made in the Performance
Against Our Outlook for 2024 section, the Risk Management and Risks
section, the Expected Developments and Opportunities section, and other
forward-looking information appearing in other parts of this half-year financial report. To fully consider the factors that could
affect our future financial results, both our Integrated Report 2023 and our Annual Report on Form 20-F for 2023, should be considered,
as well as all of our other filings with the U.S. Securities and Exchange Commission (U.S. SEC). Readers are cautioned not to
place undue reliance on these forward-looking statements, which speak only as at the date specified or the date of this report.
We undertake no obligation to publicly update or revise any forward-looking statements as a result of new information that we
receive about conditions that existed upon issuance of this report, future events, or otherwise unless we are required to do so
by law.
This
report includes statistical data about the IT industry and global economic trends that comes from information published by sources
including IDC, the ECB, and the IMF. This type of data represents only the estimates of IDC, ECB, IMF, and other sources of industry
data. SAP does not adopt or endorse any of the statistical information provided by sources such as IDC, ECB, IMF, or other similar
sources that is contained in this report. The data from these sources is subject to risks and uncertainties, and subject to change
based on various factors, including those described above, in the Risk Management and
Risks section, and elsewhere in this report. These and other factors could cause our results to differ materially from
those expressed in the estimates made by third parties and SAP. We caution readers not to place undue reliance on this data.
All
of the information in this report relates to the situation as at June 30, 2024, or the half year ended on that date unless otherwise
stated.
Non-IFRS
Financial Information
This
half-year report contains non-IFRS measures as well as financial data prepared in accordance with IFRS. We present and discuss
the reconciliation of these non-IFRS measures to the respective IFRS measures in the Supplementary
Financial Information section. For more information about non-IFRS measures, see our Web site www.sap.com/investors/sap-non-ifrs-measures.
| |
|
SAP
Half-Year Report 2024 |
Additional
Information
Financial
Calendar
October
21, 2024
Third-quarter
2024 earnings release, conference call for financial analysts and investors
May
13, 2025
Annual
General Meeting of Shareholders
Investor
Services
Additional
information about this half-year report is available online at www.sap.com/investors/en/calendar,
including the official quarterly statement, a presentation about the quarterly results, and a recording of the conference call
for financial analysts.
Visit
www.sap.com/investors/en/reports to access the following
publications:
| – | SAP
Integrated Report (IFRS, PDF, www.sapintegratedreport.com) |
| – | SAP
Annual Report on Form 20-F (IFRS, PDF) |
| – | SAP
SE Statutory Financial Statements and Review of Operations (HGB, German only, PDF) |
| – | Half-Year
Report (IFRS, PDF) |
| – | Quarterly
Statements (IFRS, PDF) |
Our
Investor Relations Web sites at www.sap.com/investors provide in-depth information
about stock, debt, and corporate governance; financial and event news; and various services designed to help investors find the
information they need.
For
sustainability reasons and faster distribution, SAP decided to refrain from printing reports.
You
can reach us by phone at +49 6227 7-67336, send a fax to +49 6227 7-40805, or e-mail us at investor@sap.com.
| |
|
SAP
Half-Year Report 2024 |
Addresses
SAP
SE
Dietmar-Hopp-Allee
16
69190
Walldorf
Germany
Tel.
+49 6227 7-47474
Fax
+49 6227 7-57575
Internet
www.sap.com
E-mail
info@sap.com
The
addresses of all our international subsidiaries and sales partners are available on our public Web site at www.sap.com/about/company/office-locations
Information
About Content
Investor
Relations
Tel.
+49 6227 7-67336
Fax
+49 6227 7-40805
E-mail
investor@sap.com
LinkedIn:
www.linkedin.com/showcase/sap-investor-relations
Internet:
www.sap.com/investors
Imprint
Overall
responsibility:
SAP
SE
Corporate
Financial Reporting
Published
on July 22, 2024.
The
German version of this Half-Year Report can be found under
www.sap.com/investors/de/reports
Copyright
Usage in Collateral
©
2024 SAP SE or an SAP affiliate company. All rights reserved. No part of this publication may be reproduced or transmitted in
any form or for any purpose without the express permission of SAP SE or an SAP affiliate company. SAP and other SAP products and
services mentioned herein as well as their respective logos are trademarks or registered trademarks of SAP SE (or an SAP affiliate
company) in Germany and other countries. All other product and service names mentioned are the trademarks of their respective
companies. Please see www.sap.com/trademark for additional
trademark information and notices.
| |
|
SAP
Half-Year Report 2024 |
SAP (NYSE:SAP)
Gráfica de Acción Histórica
De Jun 2024 a Jul 2024

SAP (NYSE:SAP)
Gráfica de Acción Histórica
De Jul 2023 a Jul 2024
