BNB Rides Bullish Wave After 100-Day SMA Breakout, Next Stop $605?
20 Septiembre 2024 - 6:30AM
NEWSBTC
Recent price movement reveals that BNB has surged past a critical
barrier, clearing the 100-day Simple Moving Average (SMA) and
signaling renewed bullish momentum. With this breakout, BNB bulls
are setting their sights on the $605 resistance level, as market
sentiment strengthens around the potential for further gains. The
move above the 100-day SMA has sparked optimism, hinting at the
possibility of a sustained rally as BNB looks to capitalize on this
momentum and break through key price targets. The goal of this
analysis is to highlight BNB’s recent surge above the 100-day
Simple Moving Average (SMA) and evaluate the potential for
continued positive movement toward the $605 resistance level. By
examining current market dynamics and technical signals, this
analysis aims to provide insight into whether BNB can maintain its
upward momentum and achieve a significant breakout in the coming
sessions. Rallying Strength: Analyzing BNB’s Surge Above The
100-Day SMA On the 4-hour chart, BNB has demonstrated sustained
positive momentum after successfully breaking above the 100-day
Simple Moving Average (SMA). This significant breach has not only
triggered a shift in market sentiment but set the stage for a
bullish trajectory as BNB rises toward the $605 mark. BNB’s ability
to maintain above this key technical level reflects growing
confidence among traders, suggesting that the upward movement may
continue. Additionally, the Relative Strength Index (RSI) on the
4-hour chart has climbed above the 50% threshold, currently sitting
at 69%. This upward movement in the RSI indicates that bulls are
firmly in control, as the index approaches overbought territory. If
selling pressure remains subdued, there is potential for an
extended increase in BNB’s price, signaling a strong bullish trend
ahead. Related Reading: BNB Weekly Active Addresses Surge Over 6% –
Is A Rally On The Way? On the daily chart, BNB is maintaining an
upswing toward the $605 resistance level while trading above the
100-day Simple Moving Average (SMA). The price has printed multiple
candlesticks above this key indicator, underscoring the strong
buying pressure from investors and indicating a solid sentiment in
BNB’s potential for continued growth. Finally, on the 1-day chart,
a careful examination of the formation of the 1-day RSI reveals
that BNB could sustain its bullish trend toward the $605 resistance
mark as the signal line of the indicator has risen above 50% and is
currently attempting a move towards the 70% threshold. What’s Next
For BNB As Resistance Beckons With strong buying interest and
positive market sentiment, BNB is gearing up to reach the $605
resistance level. When BNB breaks above this point, it could lead
to more gains, aiming for the $635 resistance zone and beyond.
Related Reading: BNB Price Struggles to Hold $500: Is a Breakout
Coming? However, the altcoin may face a pullback toward the $537
support mark if the momentum falters and fails to surpass this
level. A decline below this support could lead to additional drops,
with the price potentially testing the $500 support range and other
lower levels. At the time of writing, BNB was trading at
approximately $575, reflecting a 3.05% increase over the past day.
Its market capitalization was around $84 billion, with trading
volume surpassing $1.9 million, showing increases of 3.05% and
9.81%, respectively. Featured image from Adobe Stock, chart from
Tradingview.com
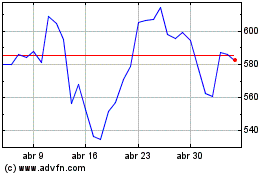
Binance Coin (COIN:BNBUSD)
Gráfica de Acción Histórica
De Dic 2024 a Ene 2025

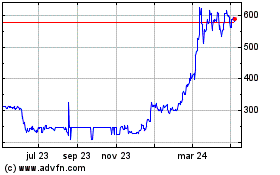
Binance Coin (COIN:BNBUSD)
Gráfica de Acción Histórica
De Ene 2024 a Ene 2025
