XRP Whales Loading Up – Data Reveals Buying Activity
20 Diciembre 2024 - 11:00PM
NEWSBTC
XRP has faced a sharp downturn over the past few days, shedding
over 23% of its value since Tuesday. This steep correction has
mirrored the broader market’s turbulence, intensifying negative
sentiment around XRP. However, notable developments are emerging
beneath the surface of this bearish price action. Related Reading:
Bitcoin Data Reveals No Significant Panic Selling In The Market –
Shakeout Or Trend Shift? Key on-chain data from Santiment reveals
that whales are taking advantage of the dip. In the last 24 hours
alone, these large holders have accumulated an additional 110
million XRP, demonstrating significant confidence in the asset’s
long-term prospects. Historically, whale activity during negative
sentiment often signals strategic positioning for future gains.
This accumulation trend suggests that whales are undeterred by
short-term price fluctuations, focusing instead on XRP’s potential
in the coming months. As retail traders grow increasingly cautious
amidst the recent drop, the actions of these large holders
highlight a different perspective. While the immediate outlook for
XRP remains uncertain, the notable whale activity is a bullish
indicator for the long run. Whether this signals a bottom or simply
positions XRP for a broader recovery remains to be seen, but it is
clear that big players are looking beyond the current market
turbulence. XRP Holding Key Levels XRP is currently trading 28%
below its multi-year high of $2.90, but it has managed to stay
above a critical support level at $1.90. This zone, regarded as the
bulls’ last line of defense, has proven resilient amid recent
market volatility. Holding above this level is essential to
maintaining the bullish structure that has characterized XRP’s
recent price action. Adding to the optimism, key metrics from
Santiment, shared by crypto analyst Ali Martinez, reveal that XRP
whales have accumulated actively during the pullback. Over the last
24 hours, these large holders have purchased an additional 110
million XRP, underscoring their confidence in the asset’s long-term
potential. Historically, whale activity during price dips often
signals preparation for a recovery. The next step for XRP to regain
momentum is to push above critical supply levels that have
previously stalled upward moves. A breakout above these zones could
trigger a swift rally, bringing XRP closer to its multi-year high.
Related Reading: On-Chain Metrics Reveal Cardano Whales Are ‘Buying
The Dip’ – Details The strong support at $1.90 and continued whale
accumulation suggest a positive outlook for the weeks ahead.
However, maintaining current levels and overcoming resistance will
be crucial for XRP to capitalize on this potential and reignite its
bullish trajectory. Technical Levels To Watch XRP is trading
at $2.06, reflecting a loss of momentum after failing to reclaim
the crucial $2.60 level. This inability to push higher has left the
market uncertain, with XRP holding above the critical $1.90 low.
For now, these levels suggest the asset could enter a prolonged
period of range-bound trading, oscillating between $1.90 and $2.60
in the coming days. However, market sentiment remains fragile, and
this indecision could tilt toward the bearish side if the overall
mood doesn’t improve. With XRP trading just above the
psychologically significant $2 mark, a continued lack of bullish
momentum might lead to a significant selloff. If bears take
control, the lack of strong support below $2 could pave the way for
a deeper correction, eroding recent gains. Related Reading: Bitcoin
Stuck Between $99K And $102K – Analyst Explains Macro Situation For
XRP to break free from this indecisive phase, a clear reclaim of
the $2.60 level is necessary to restore confidence among bulls.
Until then, traders and investors are likely to exercise caution,
closely monitoring price movements and sentiment shifts to gauge
the next directional move. Without a decisive breakout, the price
may face mounting pressure, risking a more pronounced downturn if
support at $1.90 fails. Featured image from Dall-E, chart from
TradingView
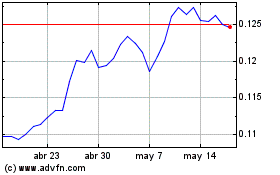
TRON (COIN:TRXUSD)
Gráfica de Acción Histórica
De Nov 2024 a Dic 2024

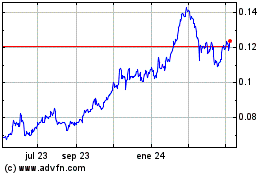
TRON (COIN:TRXUSD)
Gráfica de Acción Histórica
De Dic 2023 a Dic 2024
