Ethereum Stays Within Symmetrical Pattern – Analyst Sets ETH Target
30 Diciembre 2024 - 12:30PM
NEWSBTC
Ethereum (ETH) is currently trading around $3,400, showing signs of
indecision as it fails to establish strong support above this
critical level. Recent price action reflects a lack of conviction
among traders, leaving the market in a state of flux. Despite this
uncertainty, Ethereum has managed to hold above key support zones
that could act as a launchpad for a potential rally to new highs.
Related Reading: Metrics Reveal Cardano Whale Accumulation – Is ADA
Poised For A Rally? Top crypto analyst Carl Runefelt recently
provided technical insights into Ethereum’s price movement, noting
that ETH stayed within a 4-hour symmetrical triangle formation over
the weekend. This pattern often signals consolidation, with the
potential for a breakout in either direction. While Ethereum’s
current positioning keeps bulls hopeful, it also highlights the
importance of maintaining these key levels to prevent further
downside pressure. As traders and investors closely watch
Ethereum’s next moves, the market appears to be at a pivotal
moment. Breaking decisively above $3,400 could spark renewed
momentum while losing support might lead to a deeper retracement.
For now, Ethereum’s resilience at critical levels keeps the
possibility of a bullish reversal alive, but confirmation of a
clear direction remains elusive. Ethereum Testing Liquidity To Move
After weeks of underwhelming price action and a prolonged period of
sideways trading, Ethereum appears ready to make a decisive move.
The pressing question remains: will the breakout be to the upside
or the downside? Renowned crypto analyst Carl Runefelt recently
shared his insights on X, revealing that ETH has maintained a
position within a 4-hour symmetrical triangle pattern over the
weekend. This technical setup often signifies a buildup of
momentum, with the potential for a significant breakout in either
direction. However, Ethereum’s trajectory is closely tied to
Bitcoin’s performance, making BTC’s next move a critical factor.
Runefelt has identified clear targets for Ethereum based on
Bitcoin’s behavior. If Bitcoin gains upward momentum, ETH could
follow suit and push toward higher supply zones, with a bullish
target of $3,900. On the other hand, a bearish move from BTC could
drag ETH down, with the next key support level sitting at $2,920.
Related Reading: Bitcoin Whale Moves 8,000 BTC Aged 5-7 Years –
What Happened Last Time Market participants are now bracing for a
potential volatility spike as Ethereum’s price consolidates within
the triangle. The coming days will be pivotal, as a confirmed
breakout could set the tone for ETH’s price action in the weeks
ahead. Whether it’s a rally toward new highs or a dip to retest
lower supports, Ethereum is at a crucial crossroads. Technical
Levels To Keep An Eye On Ethereum is trading at $3,400 after
several days of oscillating between $3,300 and $3,500, reflecting a
market stuck in indecision. The tight trading range highlights the
growing tug-of-war between bulls and bears as both sides await a
clear signal for the next move. For bullish momentum to regain
control, ETH needs to reclaim the $3,550 level and establish it as
a solid support. Doing so would likely trigger a rally toward
higher resistance zones, potentially setting the stage for a larger
breakout. However, the risks of downside action remain present.
Losing the $3,300 support would expose Ethereum to sub-$3,000
levels, a scenario that could invite further selling pressure and
dampen market sentiment. Related Reading: Dogecoin Whales Bought
Over 90 Million DOGE In 48H – Details The coming days are critical
for Ethereum as traders closely monitor the price’s behavior around
these key levels. With uncertainty adding to the already cautious
market atmosphere, many analysts anticipate a significant move on
the horizon. Whether ETH surges past resistance or slides into
deeper corrections depends largely on broader market dynamics,
including Bitcoin’s performance and macroeconomic trends. For now,
Ethereum’s indecision reflects a market at a crossroads, leaving
participants eager for clarity. Featured image from Dall-E, chart
from TradingView
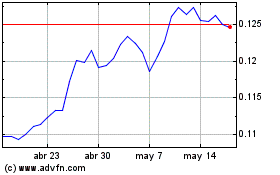
TRON (COIN:TRXUSD)
Gráfica de Acción Histórica
De Dic 2024 a Ene 2025

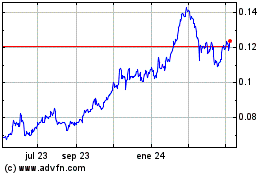
TRON (COIN:TRXUSD)
Gráfica de Acción Histórica
De Ene 2024 a Ene 2025
