false
0000889609
0000889609
2024-08-09
2024-08-09
iso4217:USD
xbrli:shares
iso4217:USD
xbrli:shares
UNITED STATES SECURITIES AND EXCHANGE COMMISSION
WASHINGTON DC 20549
FORM 8-K
CURRENT REPORT
PURSUANT TO SECTION 13 OR 15(d) OF THE
SECURITIES EXCHANGE ACT OF 1934
Date of Report (Date of earliest event reported)
August 9, 2024
| |
CONSUMER PORTFOLIO SERVICES, INC. |
|
| |
(Exact Name of Registrant as Specified in Charter) |
|
| california |
|
1-11416 |
|
33-0459135 |
|
(State or Other Jurisdiction
of Incorporation) |
|
(Commission
File Number) |
|
(IRS Employer
Identification No.) |
| |
3800 Howard Hughes Pkwy, Suite 1400, Las Vegas, NV 89169 |
|
| |
(Address of Principal Executive Offices) (Zip Code) |
|
Registrant's telephone number, including area code
(949) 753-6800
| |
Not Applicable |
|
| |
(Former name or former address, if changed since last report) |
|
Check the appropriate box below if the Form 8-K filing is intended
to simultaneously satisfy the filing obligation of the registrant under any of the following provisions (see General Instruction A.2.
below):
☐ Written
communications pursuant to Rule 425 under the Securities Act (17 CFR 230.425)
☐
Soliciting material pursuant to Rule 14a-12 under the Exchange Act (17 CFR 240.14a-12)
☐
Pre-commencement communications pursuant to Rule 14d-2(b) under the Exchange Act (17 CFR 240.14d-2(b))
☐
Pre-commencement communications pursuant to Rule 13e-4(c) under the Exchange Act (17 CFR 240.13e-4(c))
Securities registered pursuant to Section 12(b) of the Act:
| Title of each class |
Trading Symbol(s) |
Name of each exchange on which registered |
| Common Stock, no par value |
CPSS |
The Nasdaq Stock Market LLC (Global Market) |
Indicate by check mark whether the registrant is an emerging growth
company as defined in Rule 405 of the Securities Act of 1933 (§230.405 of this chapter) or Rule 12b-2 of the Securities Exchange
Act of 1934 (§240.12b-2 of this chapter).
Emerging growth company ☐
If an emerging growth company, indicate by check mark if the registrant
has elected not to use the extended transition period for complying with any new or revised financial accounting standards provided pursuant
to Section 13(a) of the Exchange Act. ☐
ITEM 7.01 REGULATION FD DISCLOSURE.
We are today making available one presentation consisting of 20 slides.
A copy is attached as an exhibit. Although the exhibit is an update of similar presentations made available from time to time as an exhibit
to a report on Form 8-K, we are not undertaking to update further any of the information that is contained in the attached presentation.
The same presentation furnished as an exhibit to this report will be made available on our website, at this address:
http://ir.consumerportfolio.com/events-and-presentations/presentations
We routinely post important information, including news releases and
reports to the U.S. Securities and Exchange Commission, on our website.
The information furnished in this report shall not be deemed “filed”
for purposes of Section 18 of the Securities Exchange Act of 1934, as amended.
ITEM 9.01. FINANCIAL STATEMENTS AND EXHIBITS.
Neither financial statements nor pro forma financial information
are filed with this report.
(d) Exhibits
One exhibit is attached:
SIGNATURES
Pursuant to the requirements of the Securities Exchange
Act of 1934, as amended, the registrant has duly caused this report to be signed on its behalf by the undersigned, thereunto duly authorized.
| |
CONSUMER PORTFOLIO SERVICES, INC. |
| |
|
| Dated: August 9, 2024 |
By: /s/ Denesh Bharwani |
| |
Denesh Bharwani
Executive Vice President
Signing on behalf of the registrant |
Exhibit 99.1

The Subprime Source Since 1991 June 2024 Investor Presentation
SAFE HARBOR STATEMENT Forward - looking statements in this presentation include the Company’s expectations of growth and the Company's recorded figures representing allowances for remaining expected lifetime credit losses, its estimates of fair value (most significantly for its receivables accounted for at fair value), its provision for credit losses, its entries offsetting the preceding, and figures derived from any of the preceding. In each case, such figures are forward - looking statements because they are dependent on the Company’s estimates of losses to be incurred in the future. The accuracy of such statements may be adversely affected by various factors, which include the following: possible increased delinquencies; repossessions and losses on retail installment contracts; incorrect prepayment speed and/or discount rate assumptions; possible unavailability of qualified personnel, which could adversely affect the Company’s ability to service its portfolio; possible increases in the rate of consumer bankruptcy filings, which could adversely affect the Company’s rights to collect payments from its portfolio; other changes in government regulations affecting consumer credit; possible declines in the market price for used vehicles, which could adversely affect the Company’s realization upon repossessed vehicles; economic conditions in geographic areas in which the Company's business is concentrated; and our ability to generate sufficient operating and financing cash flows. Any or all of such factors also may affect the Company’s future financial results, as to which there can be no assurance. Any implication that the results of the most recently completed quarter are indicative of future results is disclaimed, and the reader should draw no such inference. Factors such as those identified above in relation to losses to be incurred in the future may affect future performance. 2
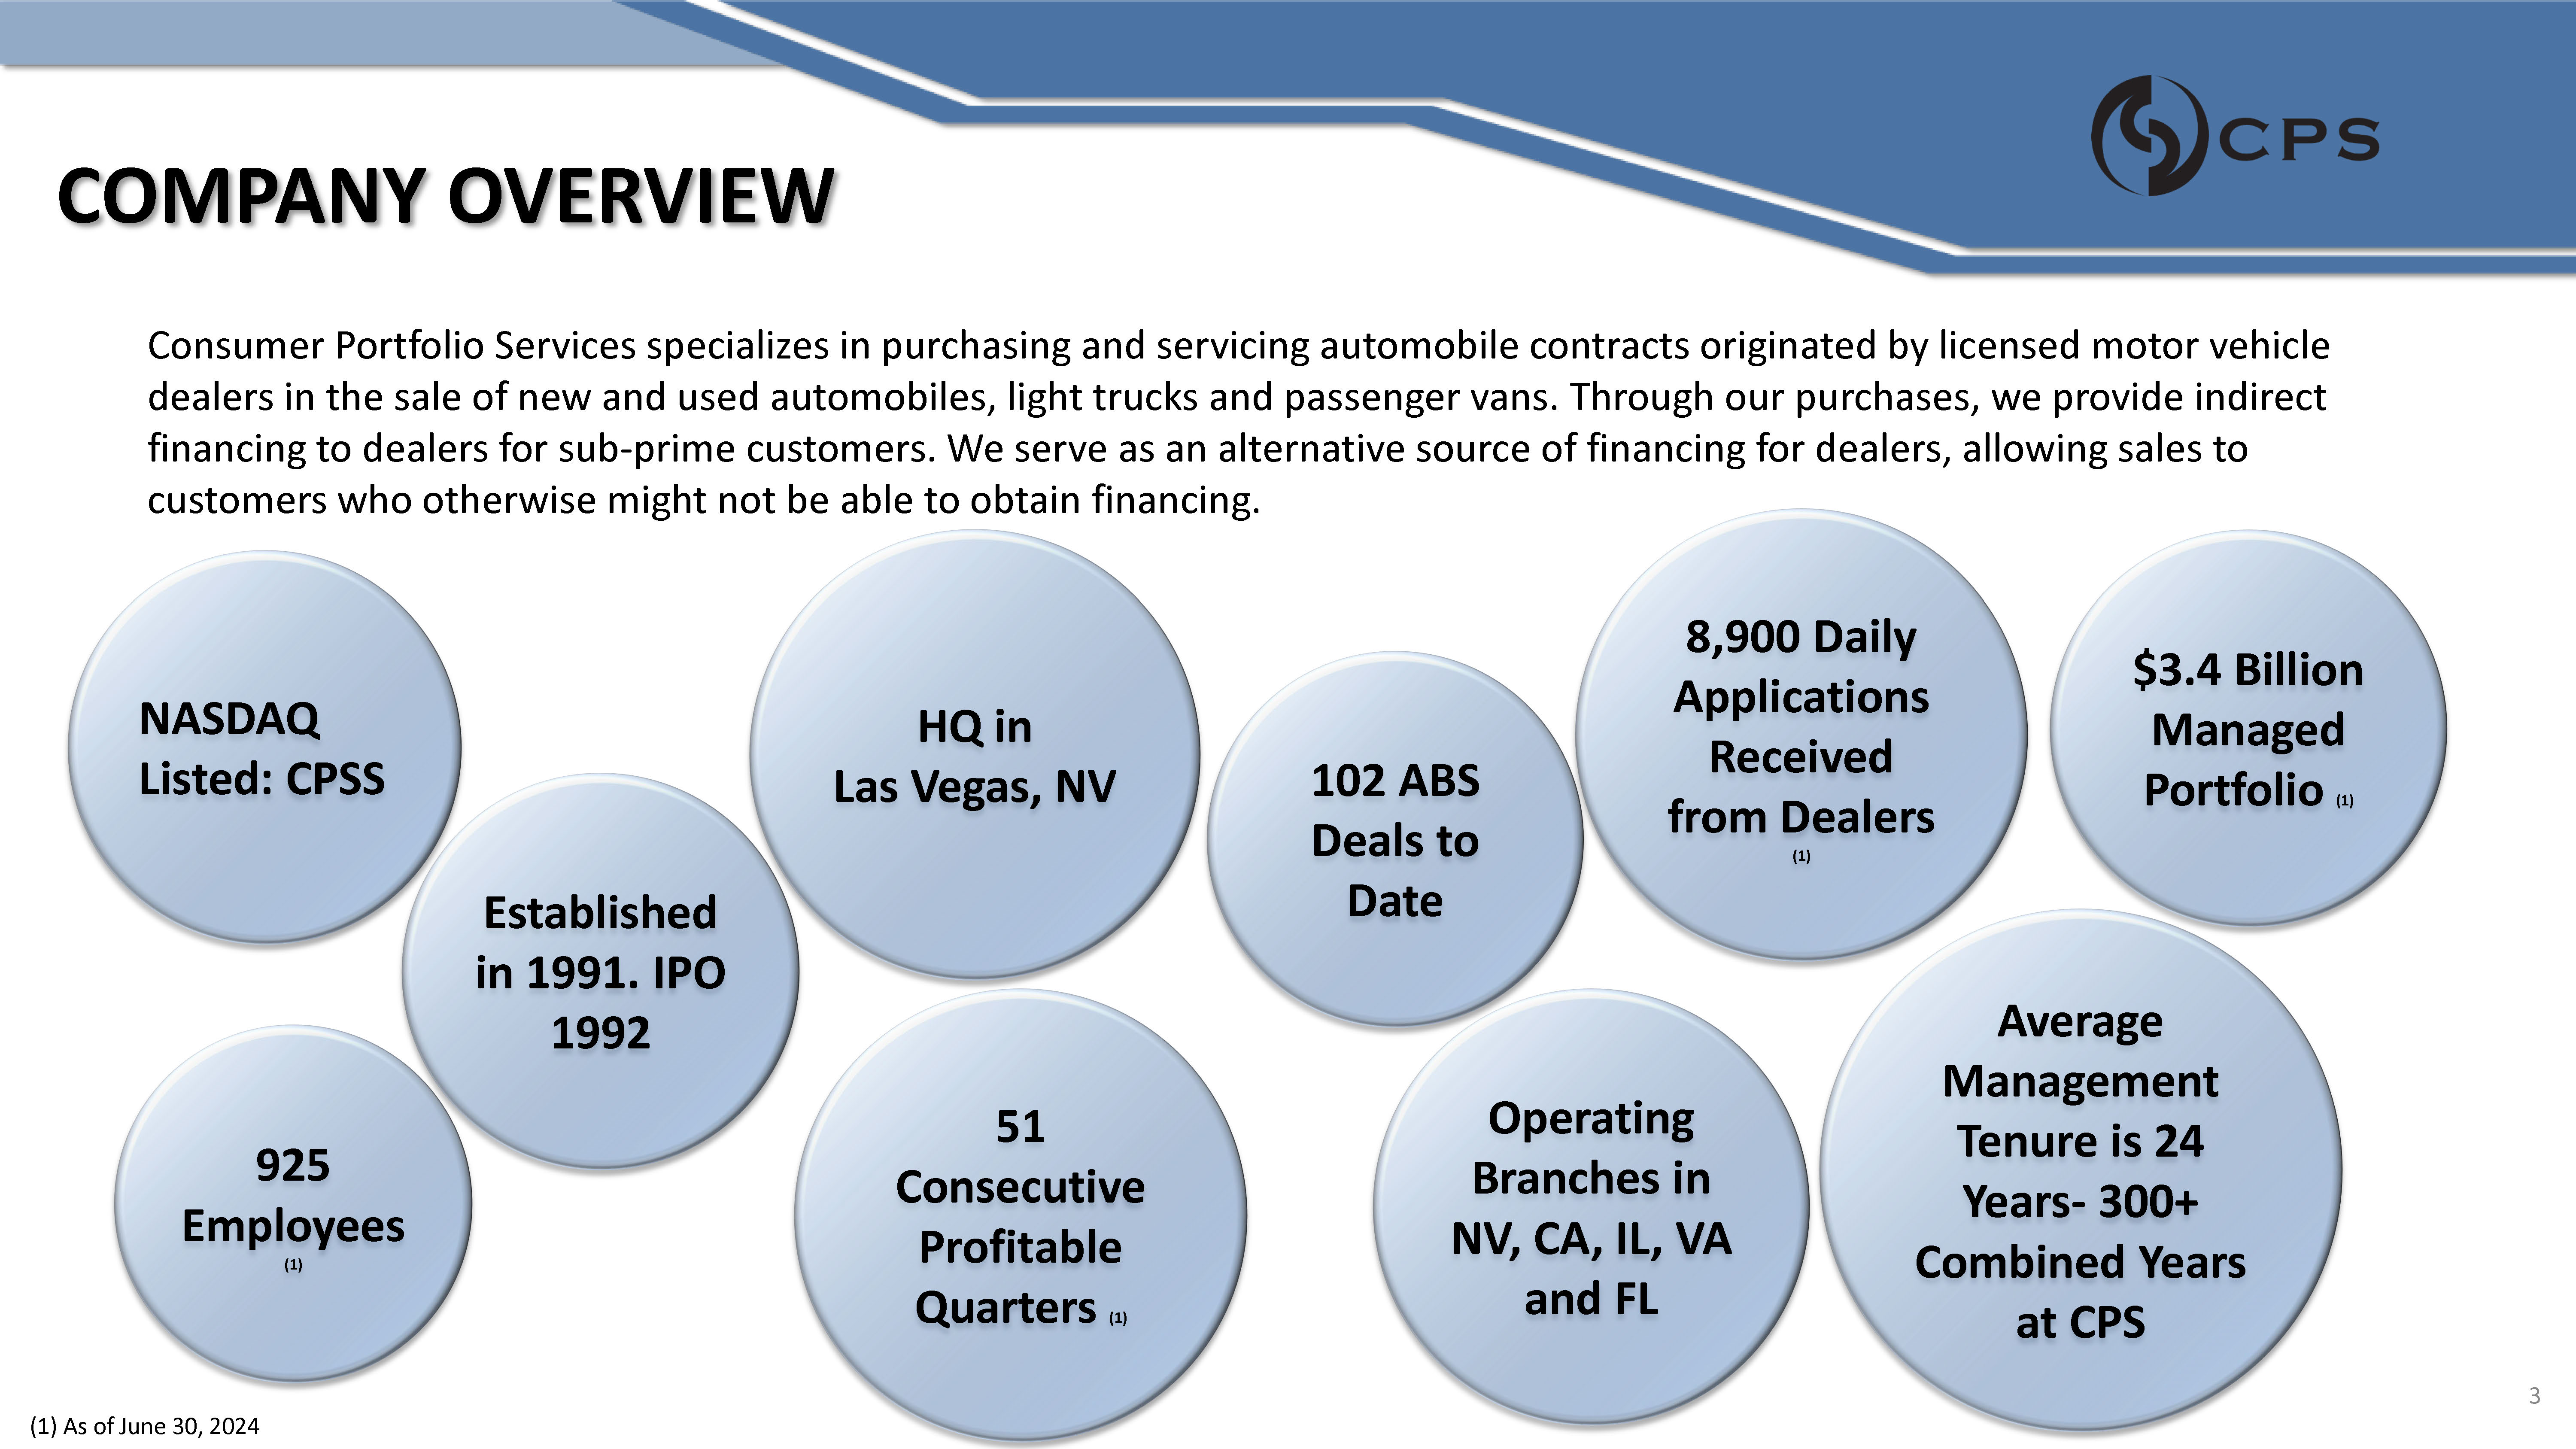
COMPANY OVERVIEW Consumer Portfolio Services specializes in purchasing and servicing automobile contracts originated by licensed motor vehicle dealers in the sale of new and used automobiles, light trucks and passenger vans. Through our purchases, we provide indirect financing to dealers for sub - prime customers. We serve as an alternative source of financing for dealers, allowing sales to customers who otherwise might not be able to obtain financing. $3.4 Billion Managed Portfolio (1) NASDAQ Listed: CPSS Average Management Tenure is 24 Years - 300+ Combined Years at CPS HQ in Las Vegas, NV Operating Branches in NV, CA, IL, VA and FL 925 Employees (1) 8,900 Daily Applications Received from Dealers (1) Established in 1991. IPO 1992 51 Consecutive Profitable Quarters (1) 102 ABS Deals to Date (1) As of June 30, 2024 3
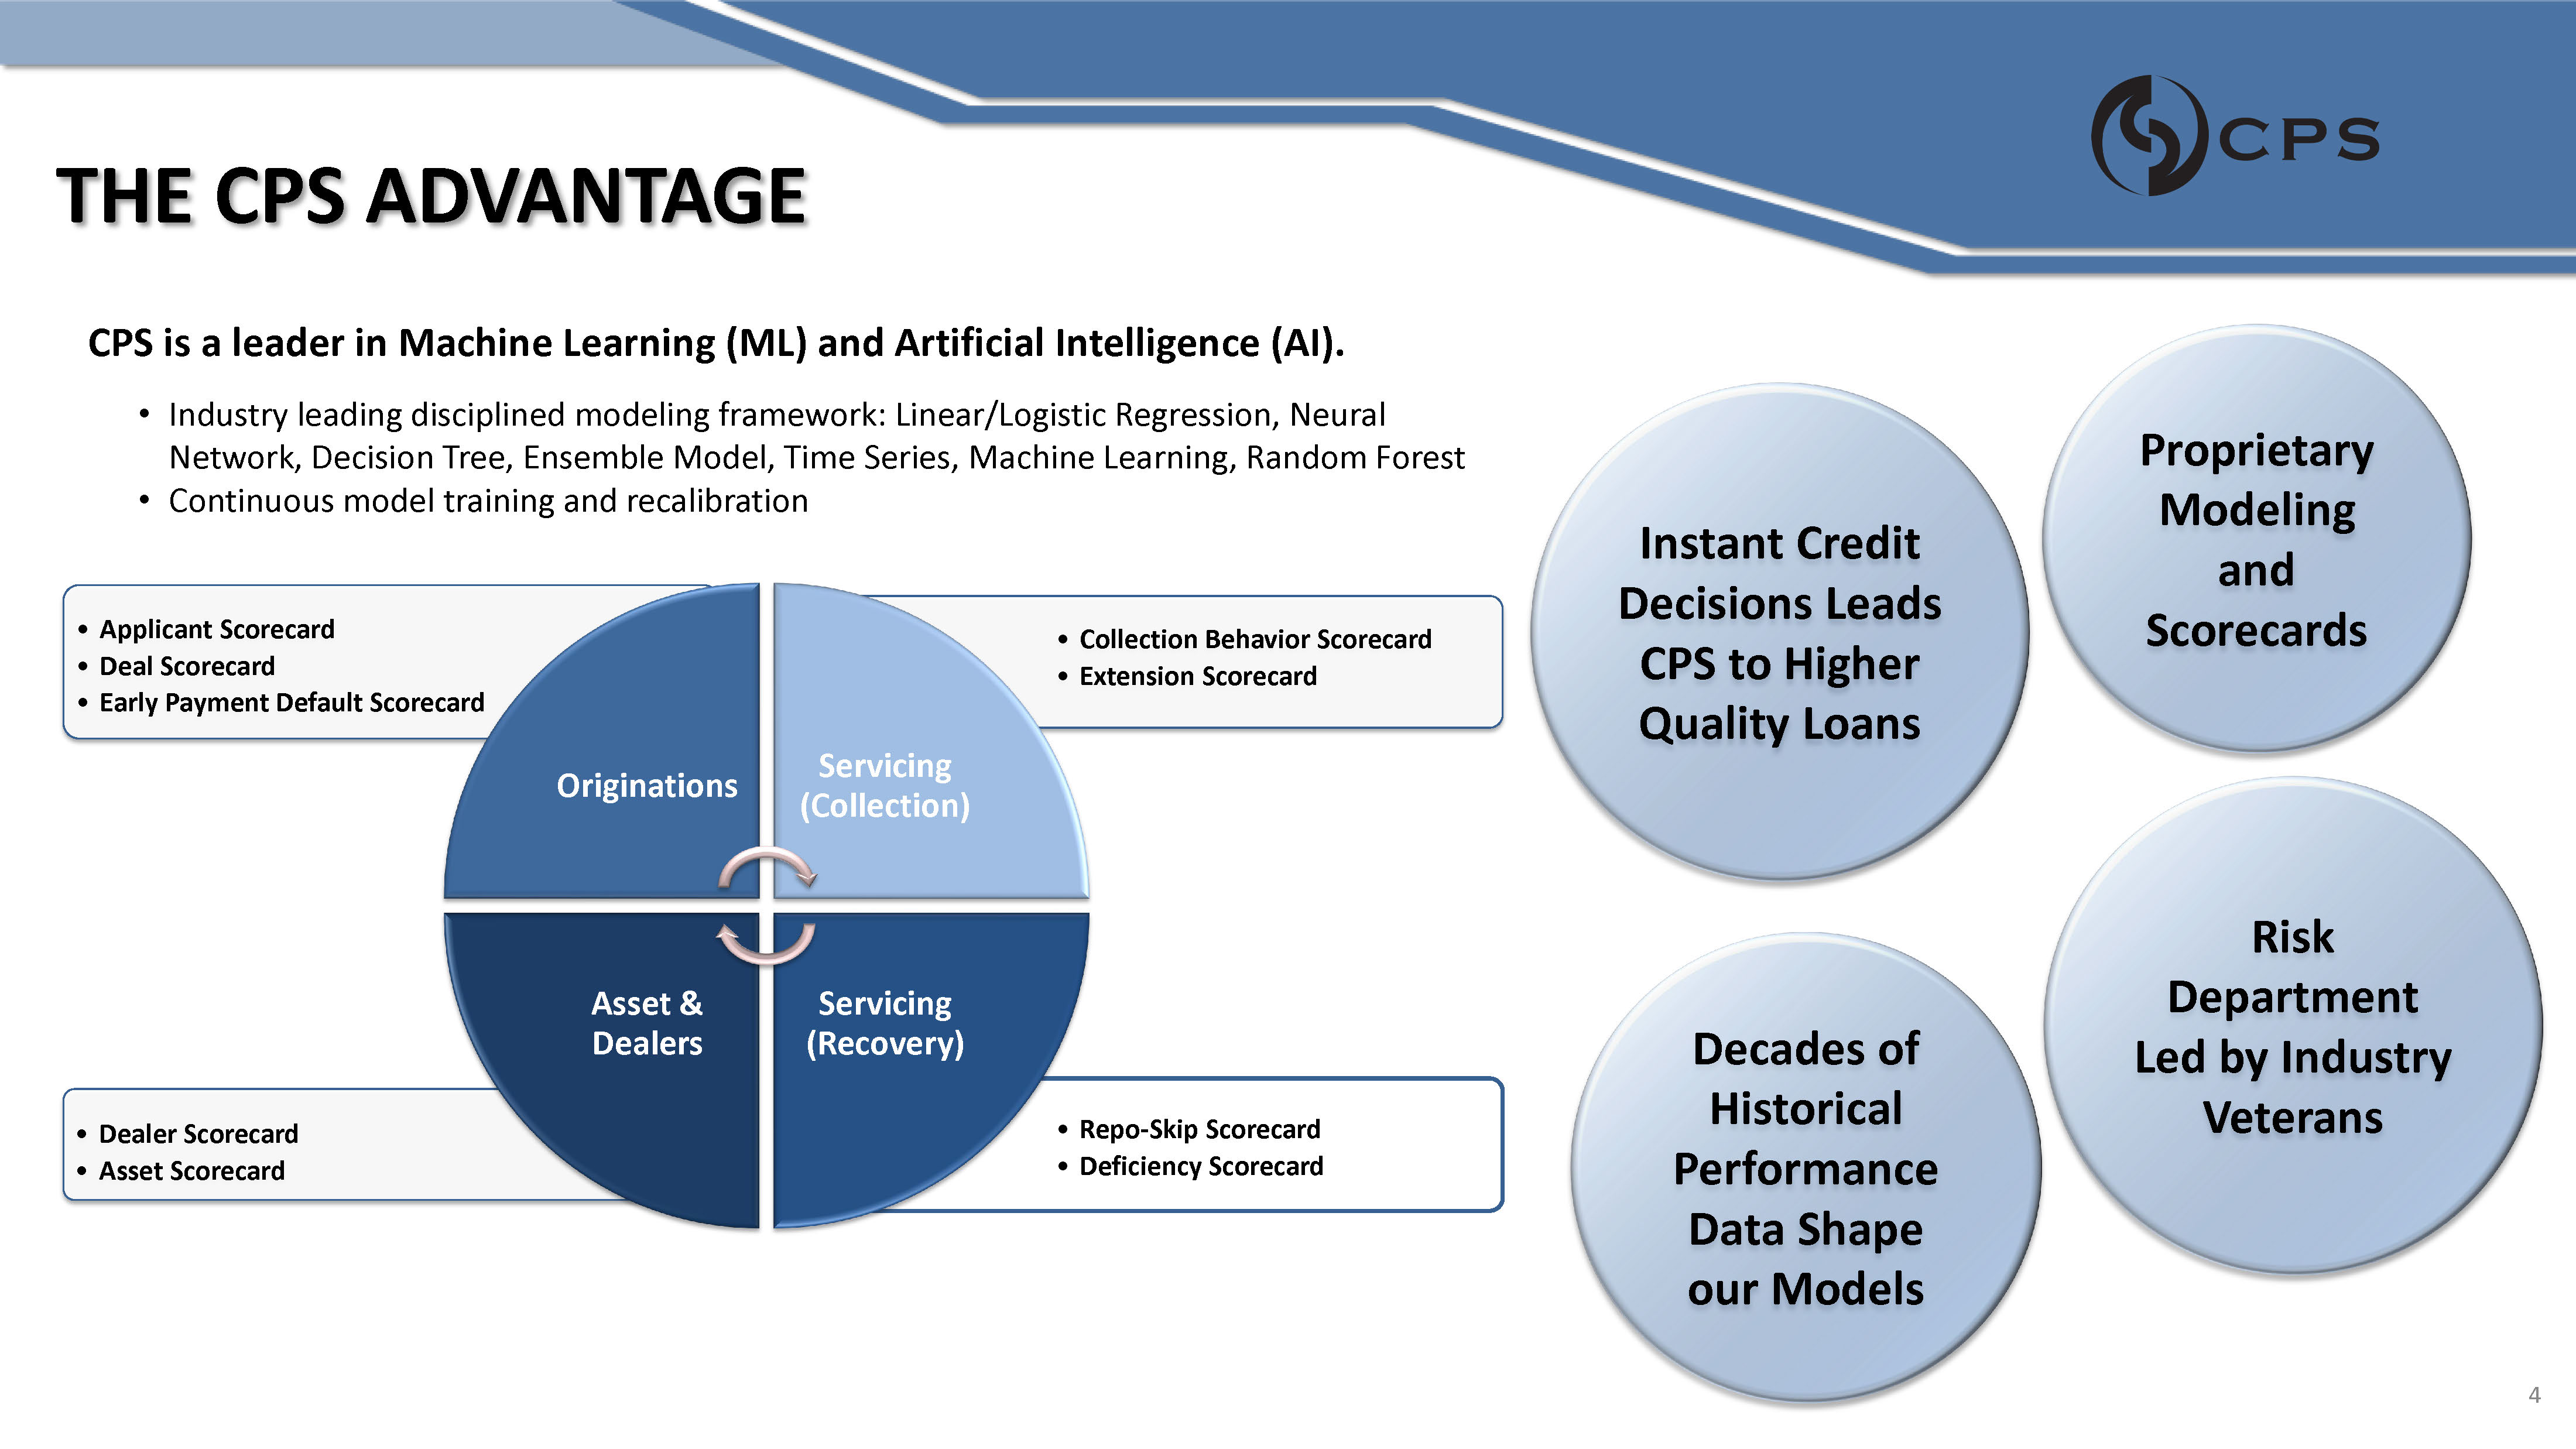
THE CPS ADVANTAGE • Repo - Skip Scorecard • Deficiency Scorecard • Dealer Scorecard • Asset Scorecard • Collection Behavior Scorecard • Extension Scorecard • Applicant Scorecard • Deal Scorecard • Early Payment Default Scorecard Originations Servicing (Collection) Servicing (Recovery) Asset & Dealers CPS is a leader in Machine Learning (ML) and Artificial Intelligence (AI). • Industry leading disciplined modeling framework: Linear/Logistic Regression, Neural Network, Decision Tree, Ensemble Model, Time Series, Machine Learning, Random Forest • Continuous model training and recalibration Proprietary Modeling and Scorecards Instant Credit Decisions Leads CPS to Higher Quality Loans Risk Department Led by Industry Veterans Decades of Historical Performance Data Shape our Models 4
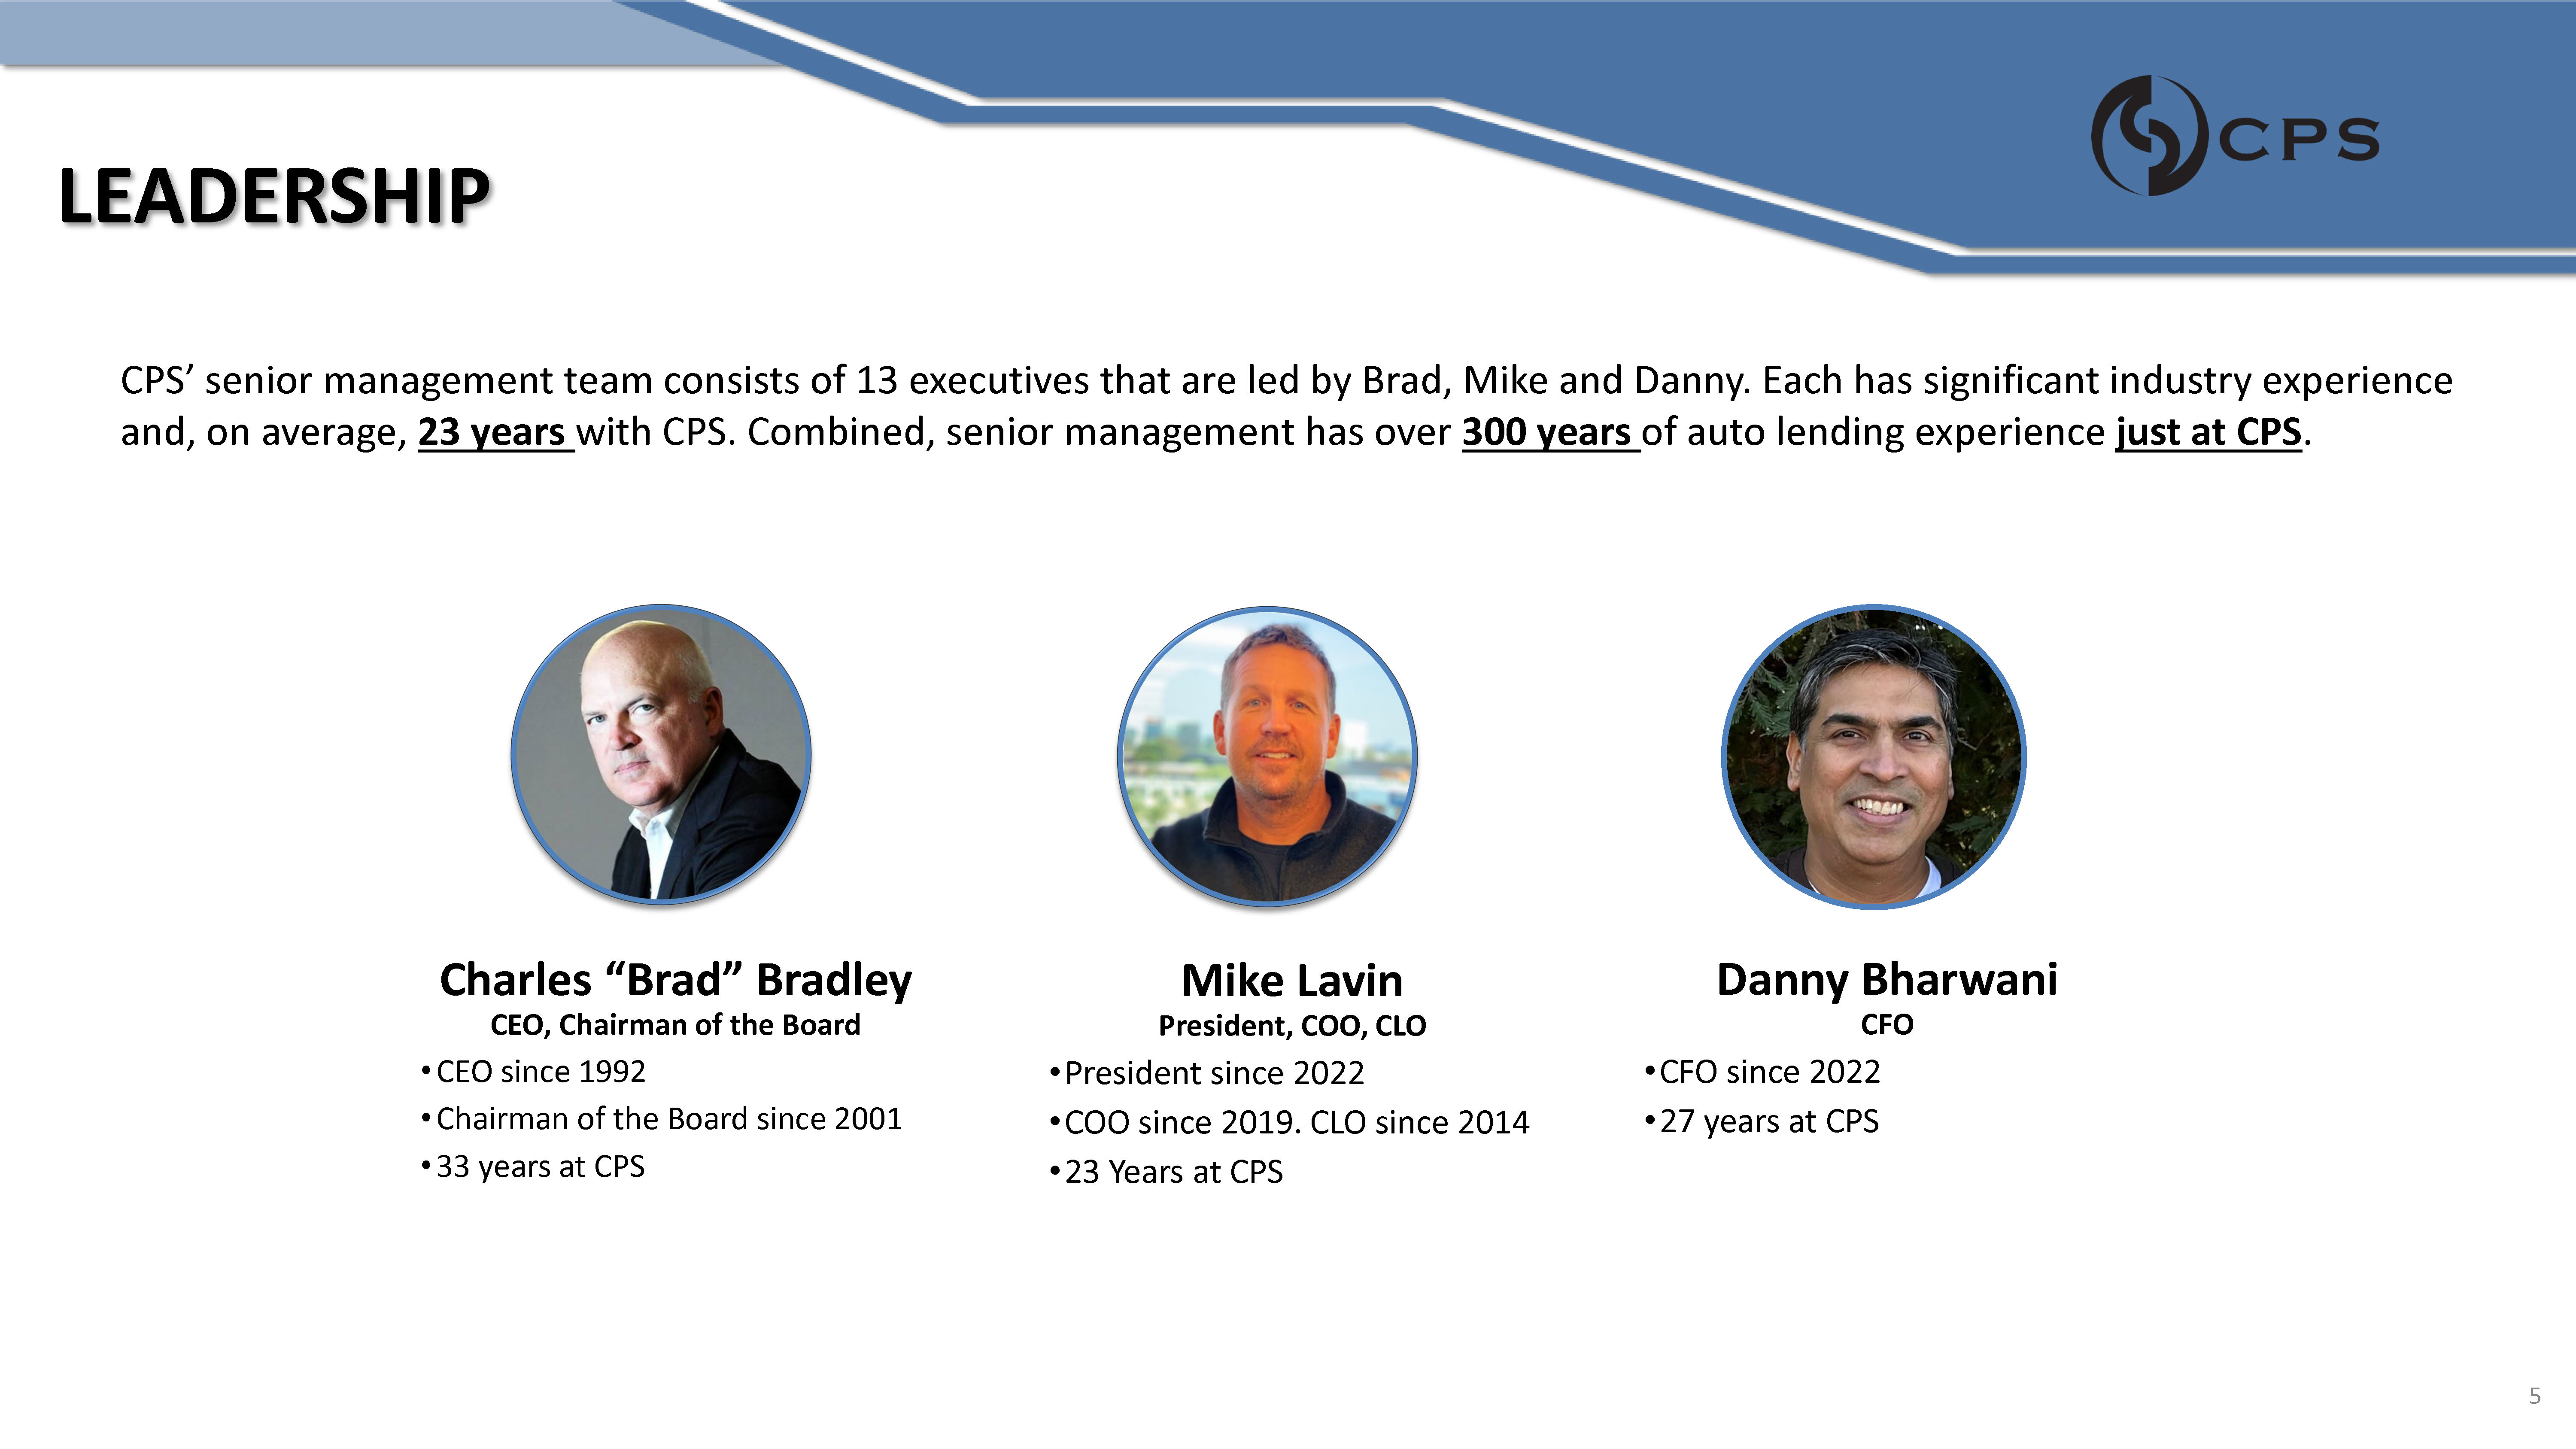
LEADERSHIP Charles “Brad” Bradley CEO, Chairman of the Board • CEO since 1992 • Chairman of the Board since 2001 • 33 years at CPS Mike Lavin President, COO, CLO • President since 2022 • COO since 2019. CLO since 2014 • 23 Years at CPS Danny Bharwani CFO • CFO since 2022 • 27 years at CPS CPS’ senior management team consists of 13 executives that are led by Brad, Mike and Danny. Each has significant industry experience and, on average, 23 years with CPS. Combined, senior management has over 300 years of auto lending experience just at CPS . 5
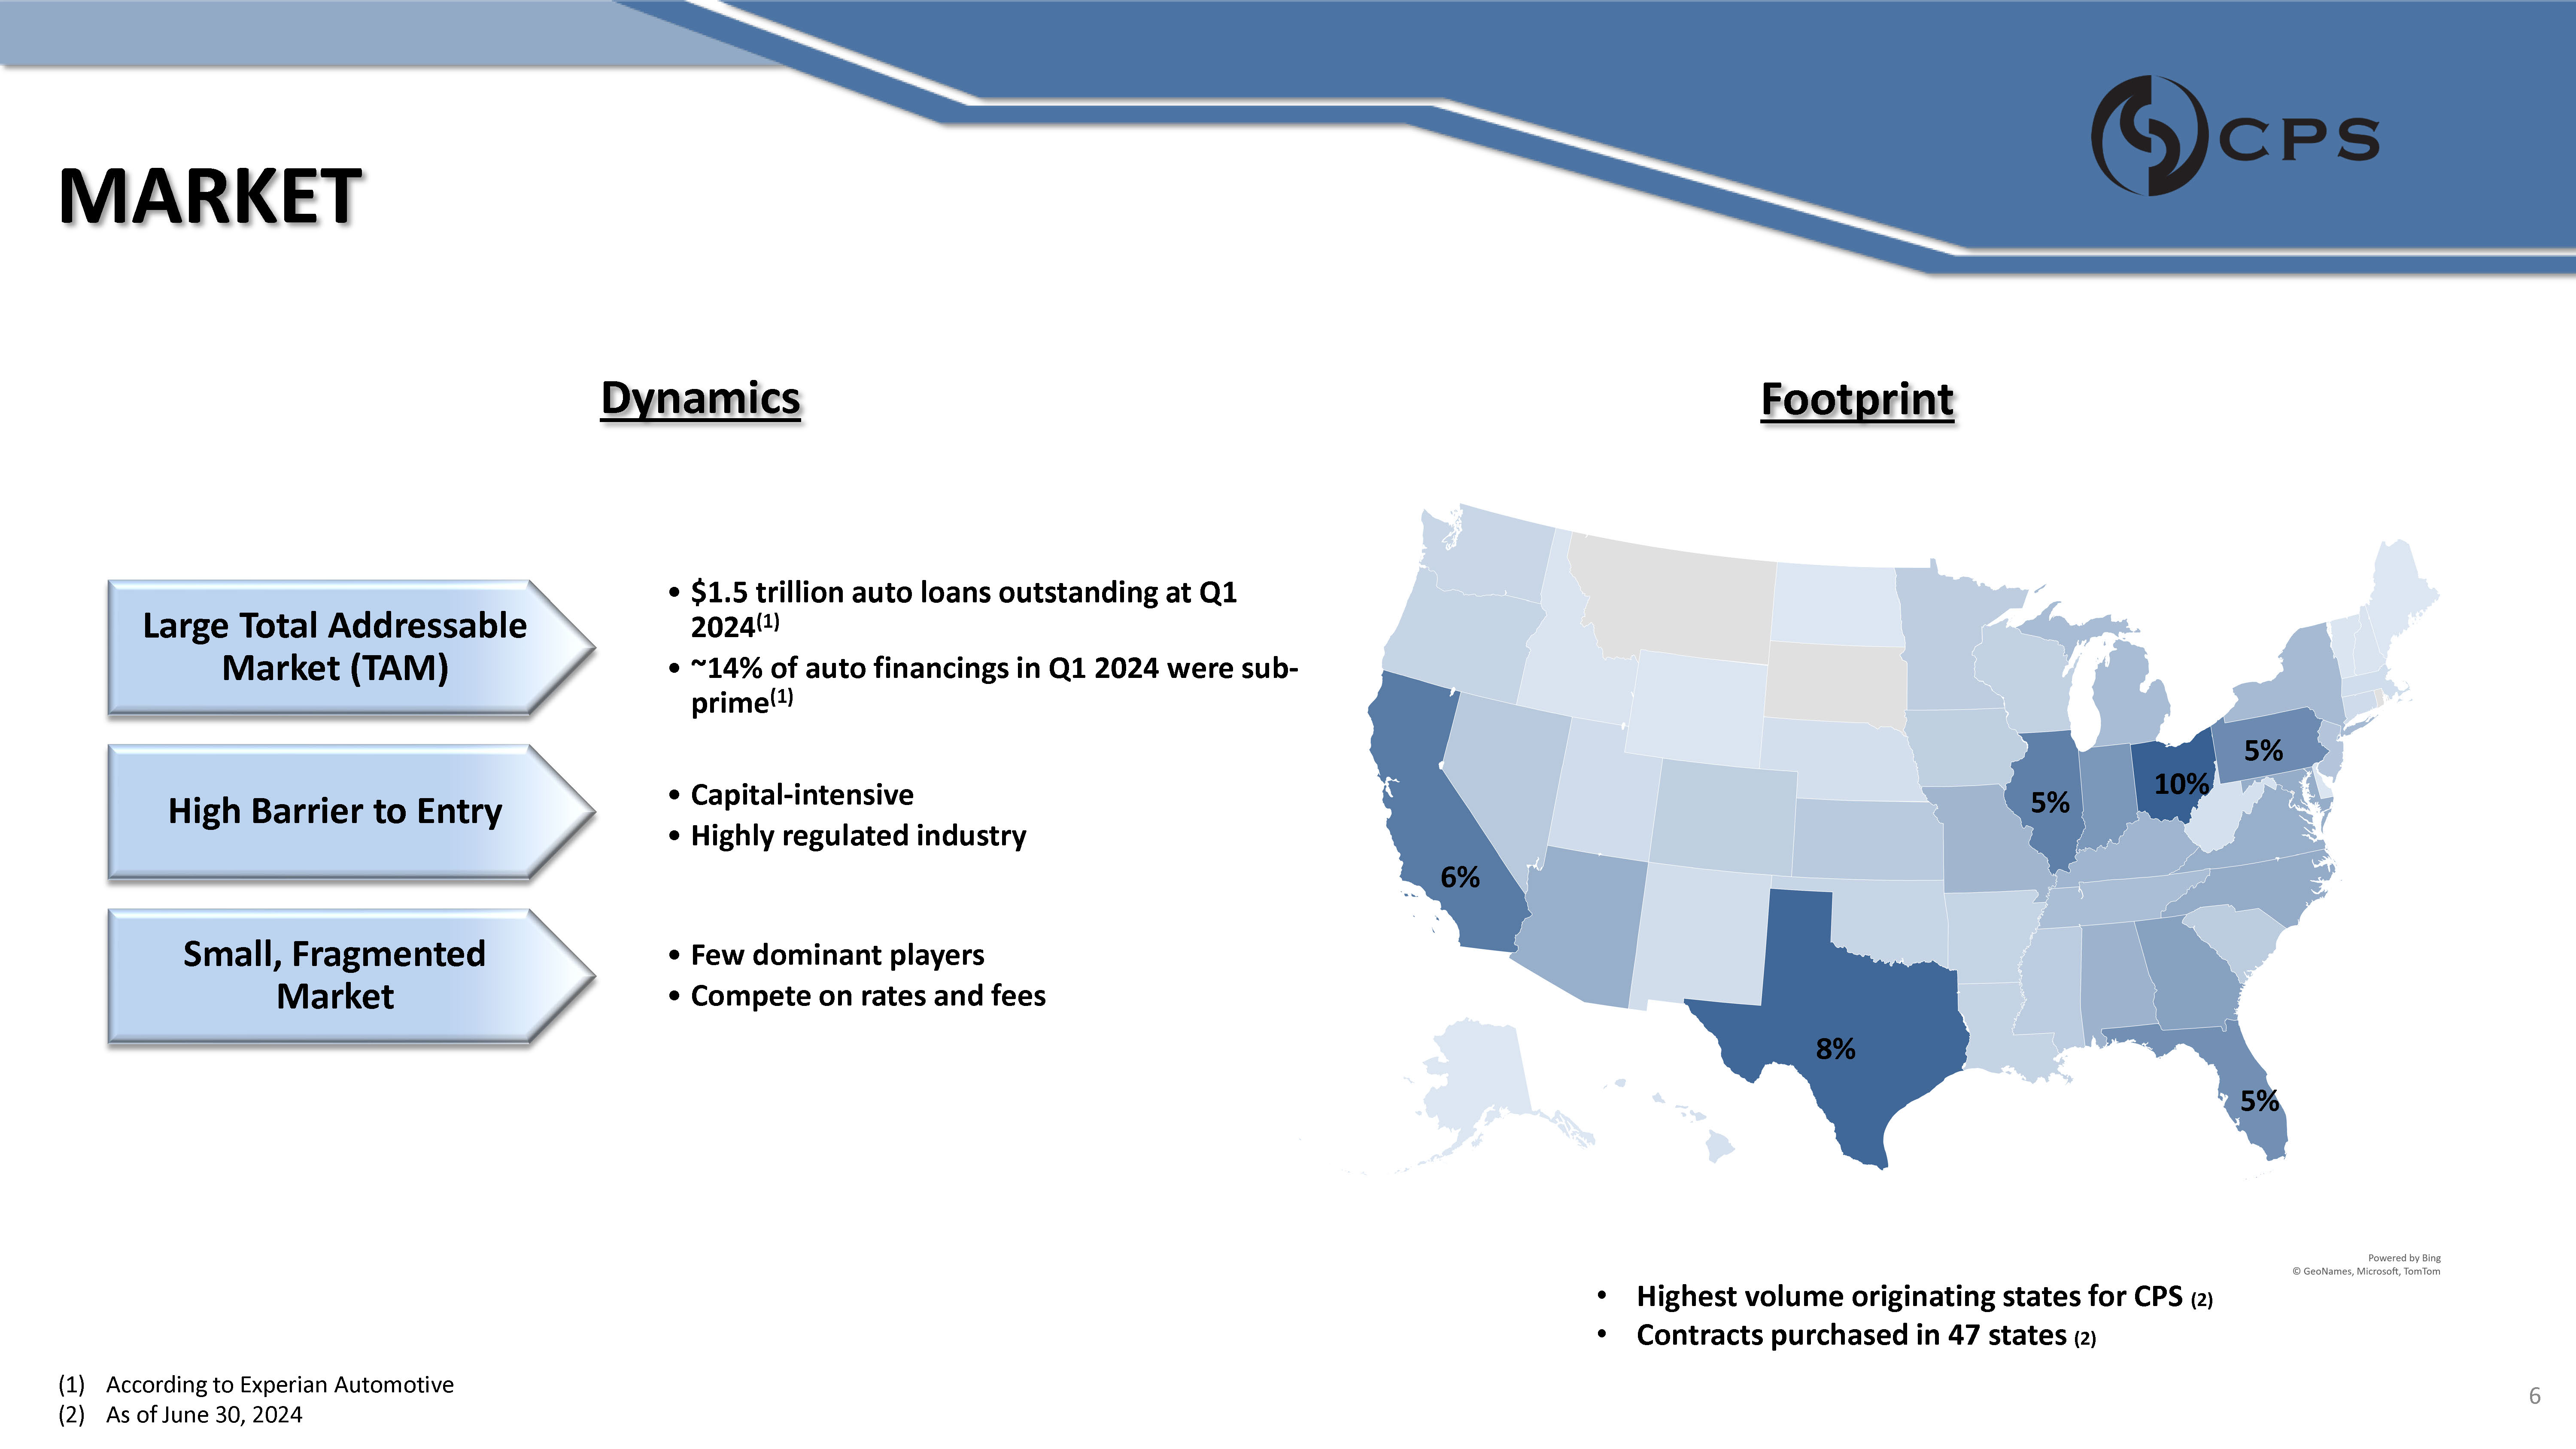
MARKET • $1.5 trillion auto loans outstanding at Q1 2024 (1) • ~14% of auto financings in Q1 2024 were sub - prime (1) Large Total Addressable Market (TAM) • Capital - intensive • Highly regulated industry High Barrier to Entry • Few dominant players • Compete on rates and fees Small, Fragmented Market Dynamics Footprint 6% 8% 10% 5% 5% 5% (1) According to Experian Automotive (2) As of June 30, 2024 • Highest volume originating states for CPS (2) • Contracts purchased in 47 states (2) 6
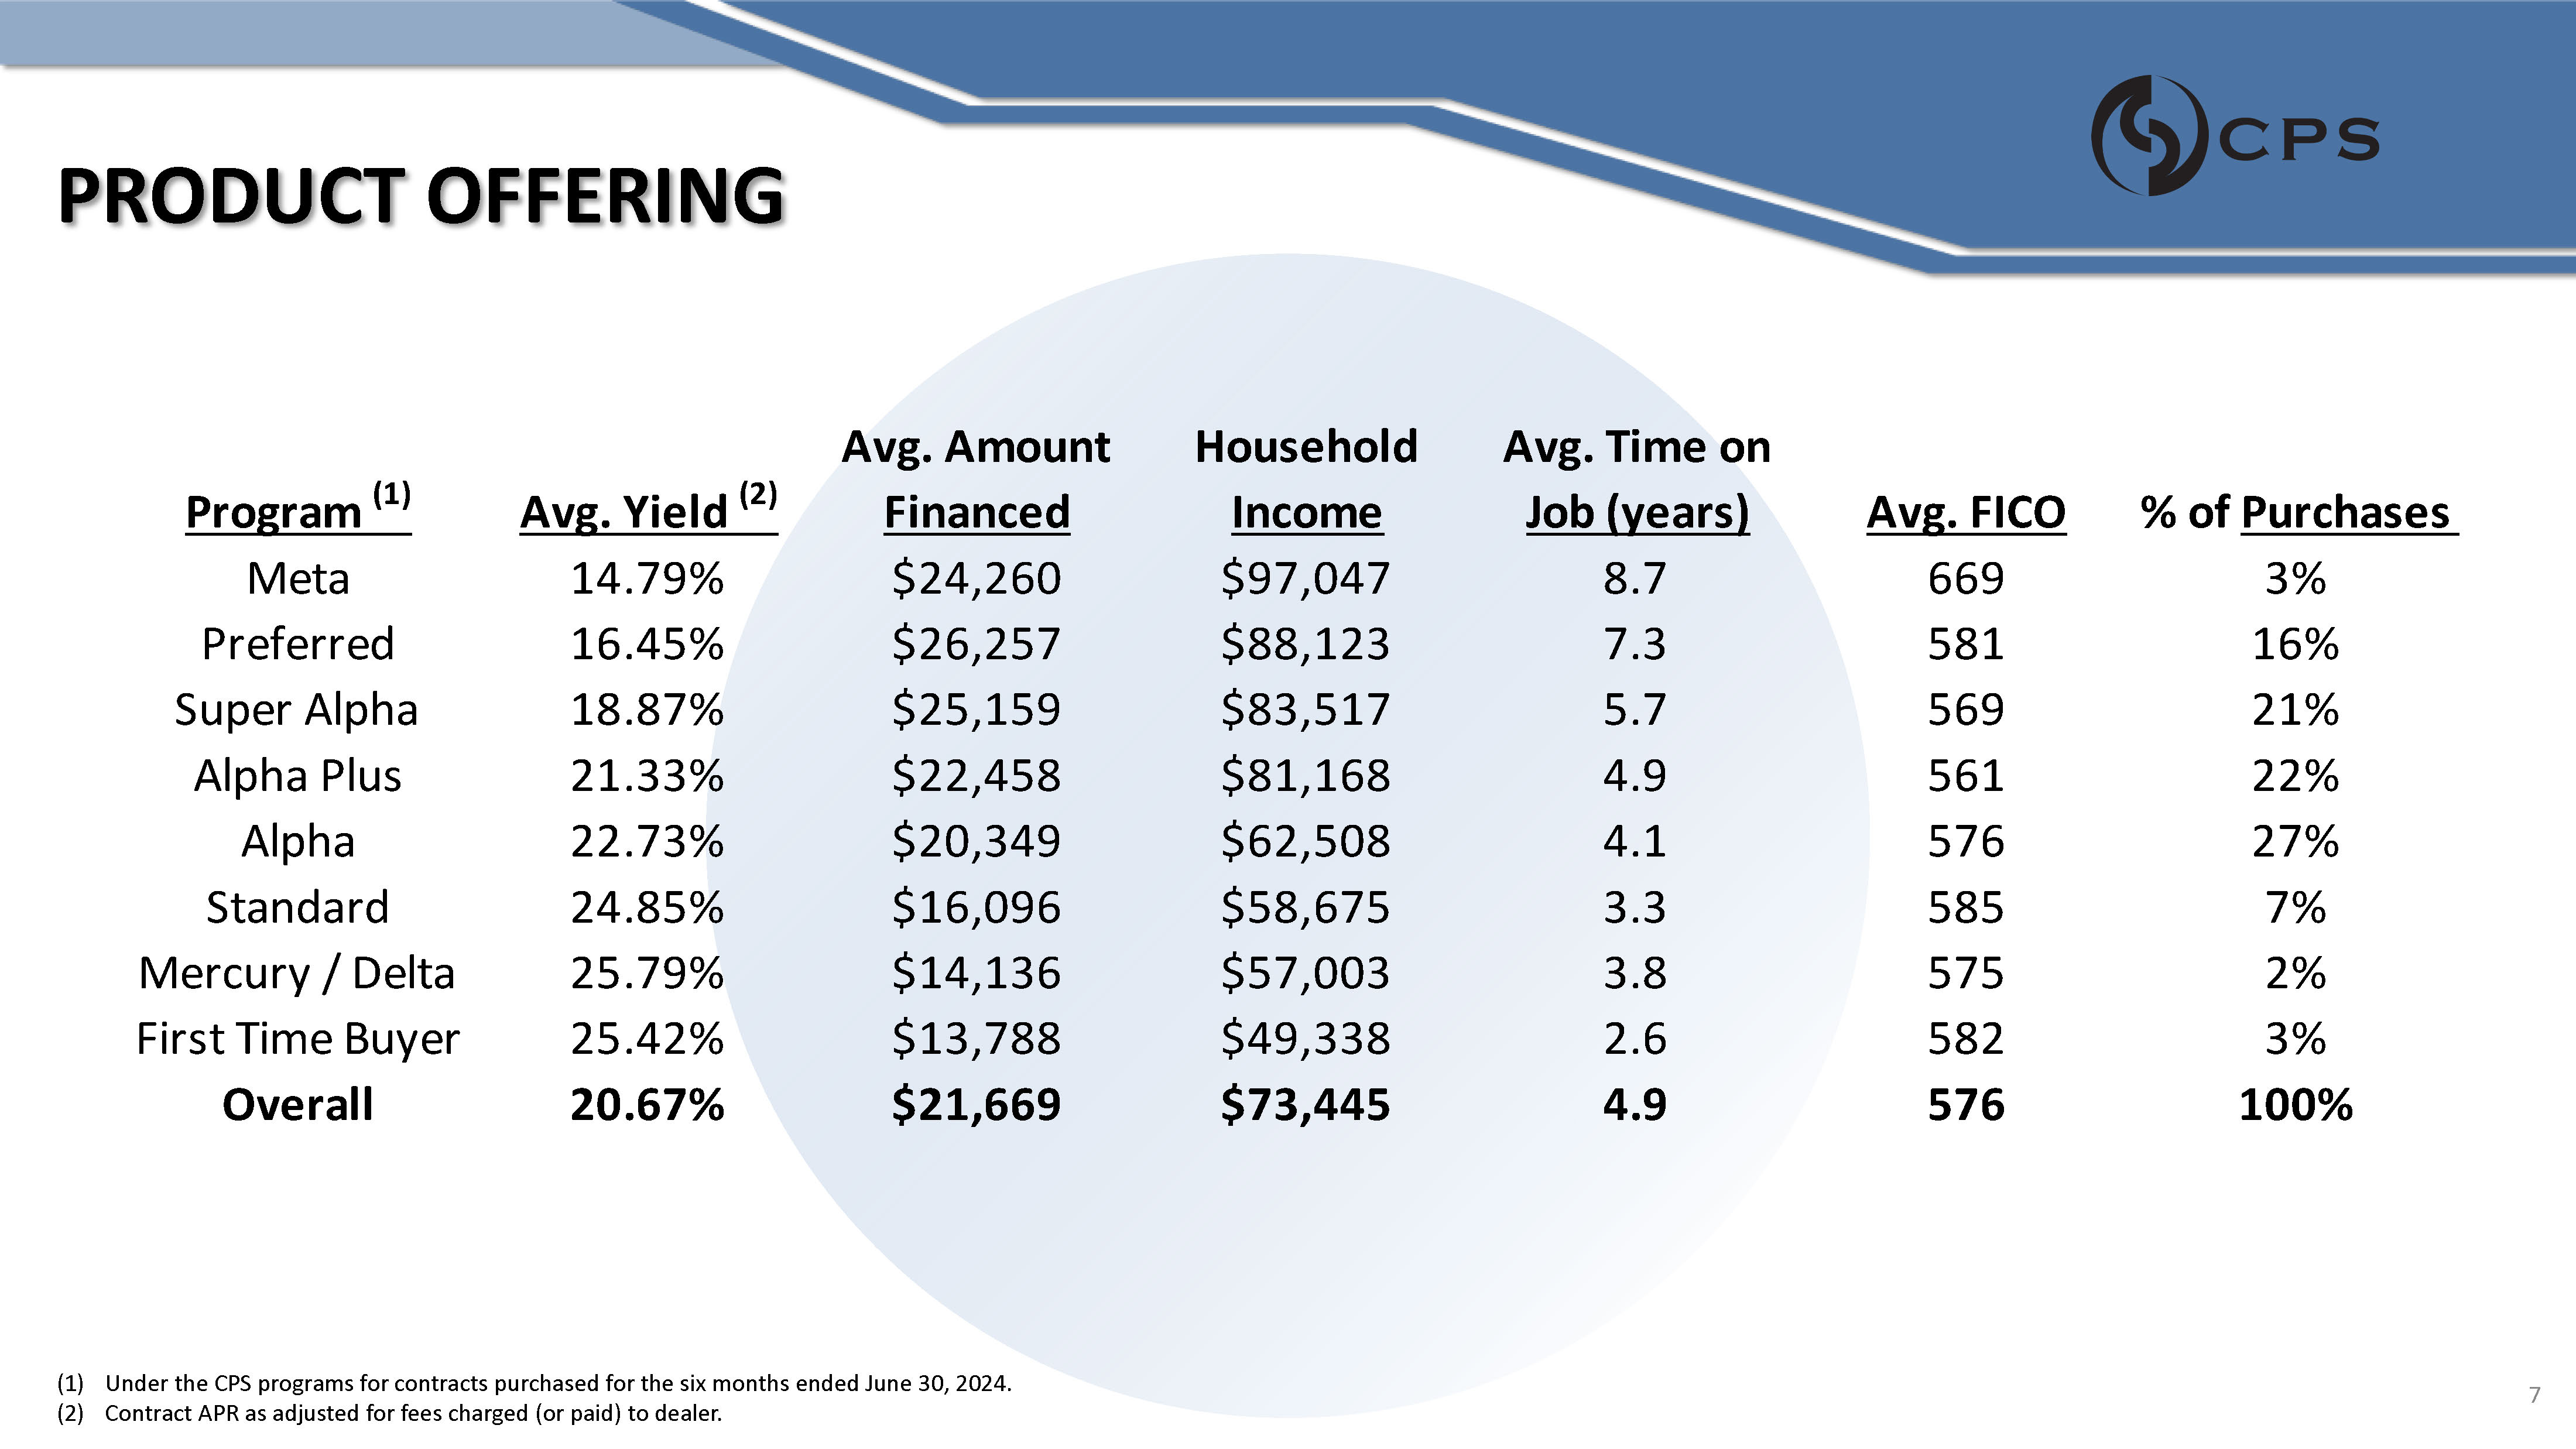
PRODUCT OFFERING % of Purchases Avg. FICO Avg. Time on Job (years) Household Income Avg. Amount Financed Avg. Yield (2) Program (1) 3% 669 8.7 $97,047 $24,260 14.79% Meta 16% 581 7.3 $88,123 $26,257 16.45% Preferred 21% 569 5.7 $83,517 $25,159 18.87% Super Alpha 22% 561 4.9 $81,168 $22,458 21.33% Alpha Plus 27% 576 4.1 $62,508 $20,349 22.73% Alpha 7% 585 3.3 $58,675 $16,096 24.85% Standard 2% 575 3.8 $57,003 $14,136 25.79% Mercury / Delta 3% 582 2.6 $49,338 $13,788 25.42% First Time Buyer 100% 576 4.9 $73,445 $21,669 20.67% Overall (1) Under the CPS programs for contracts purchased for the six months ended June 30, 2024. (2) Contract APR as adjusted for fees charged (or paid) to dealer. 7
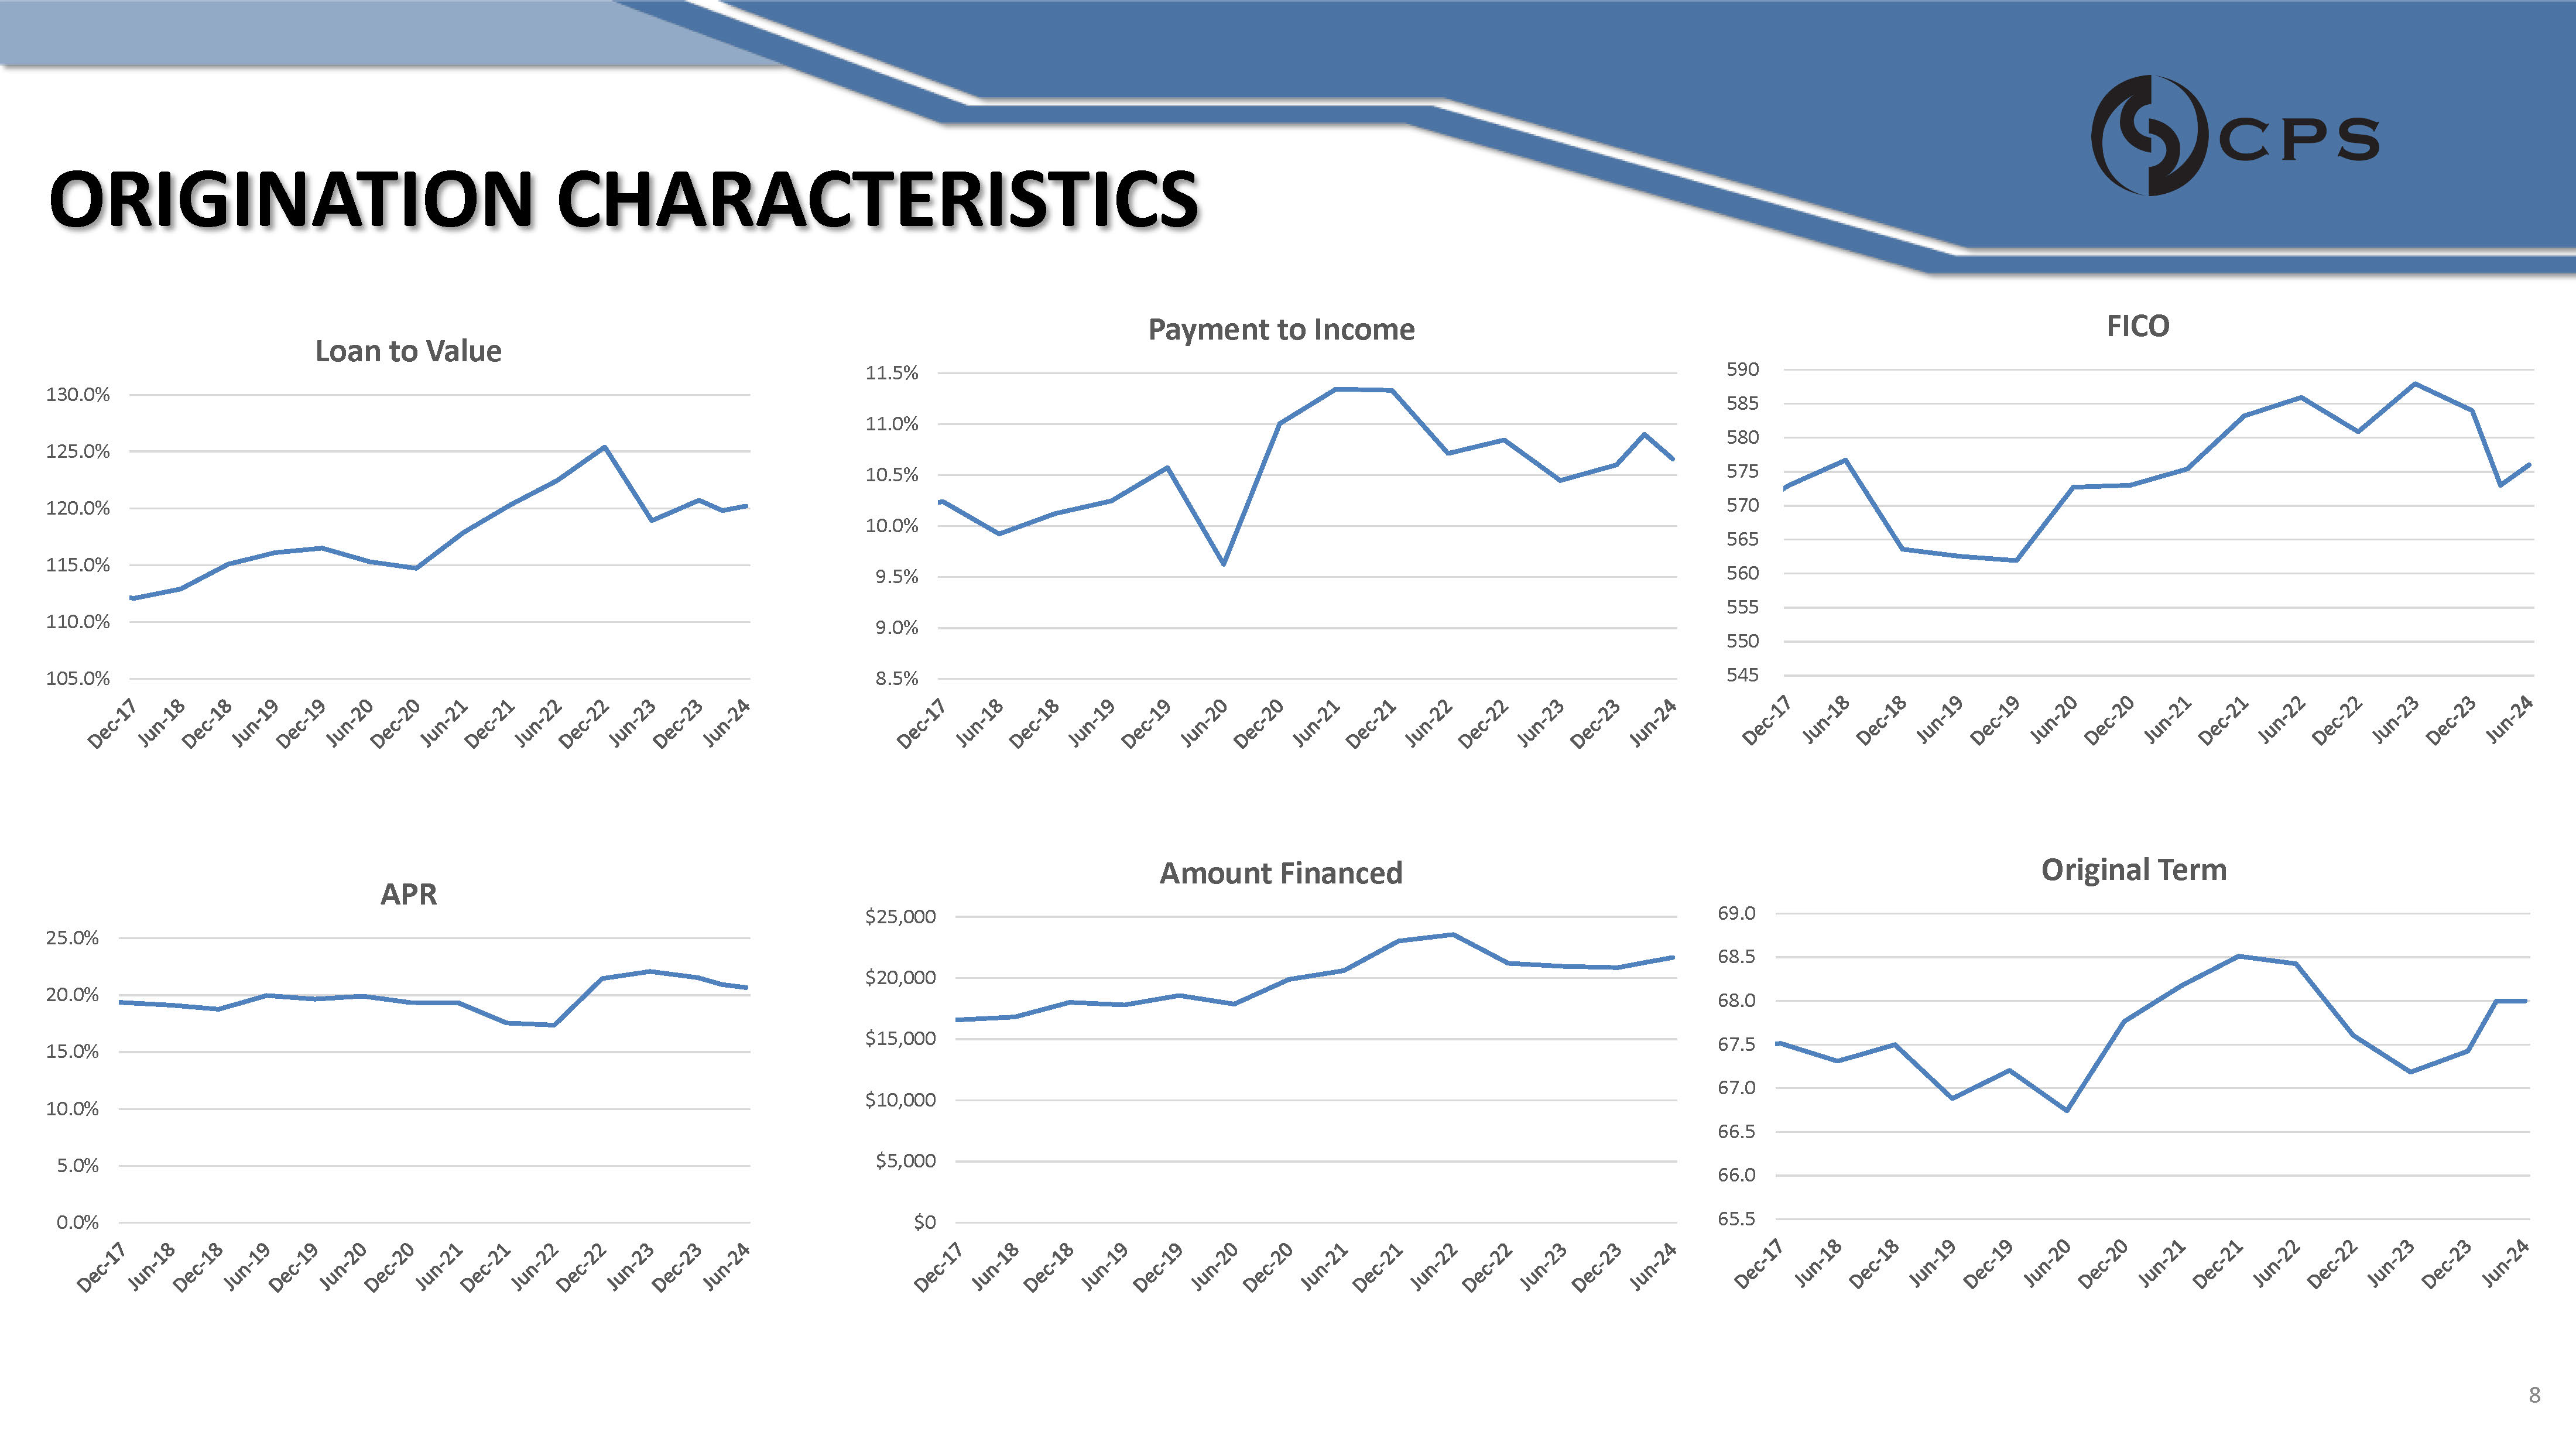
ORIGINATION CHARACTERISTICS 105.0% 110.0% 115.0% 120.0% 125.0% 130.0% Loan to Value 8.5% 9.0% 9.5% 10.0% 10.5% 11.0% 11.5% Payment to Income 590 585 580 575 570 565 560 555 550 545 FICO 0.0% 5.0% 10.0% 15.0% 20.0% 25.0% APR $0 $5,000 $10,000 $15,000 $20,000 $25,000 Amount Financed 65.5 66.0 66.5 67.0 67.5 68.0 68.5 69.0 Original Term 8
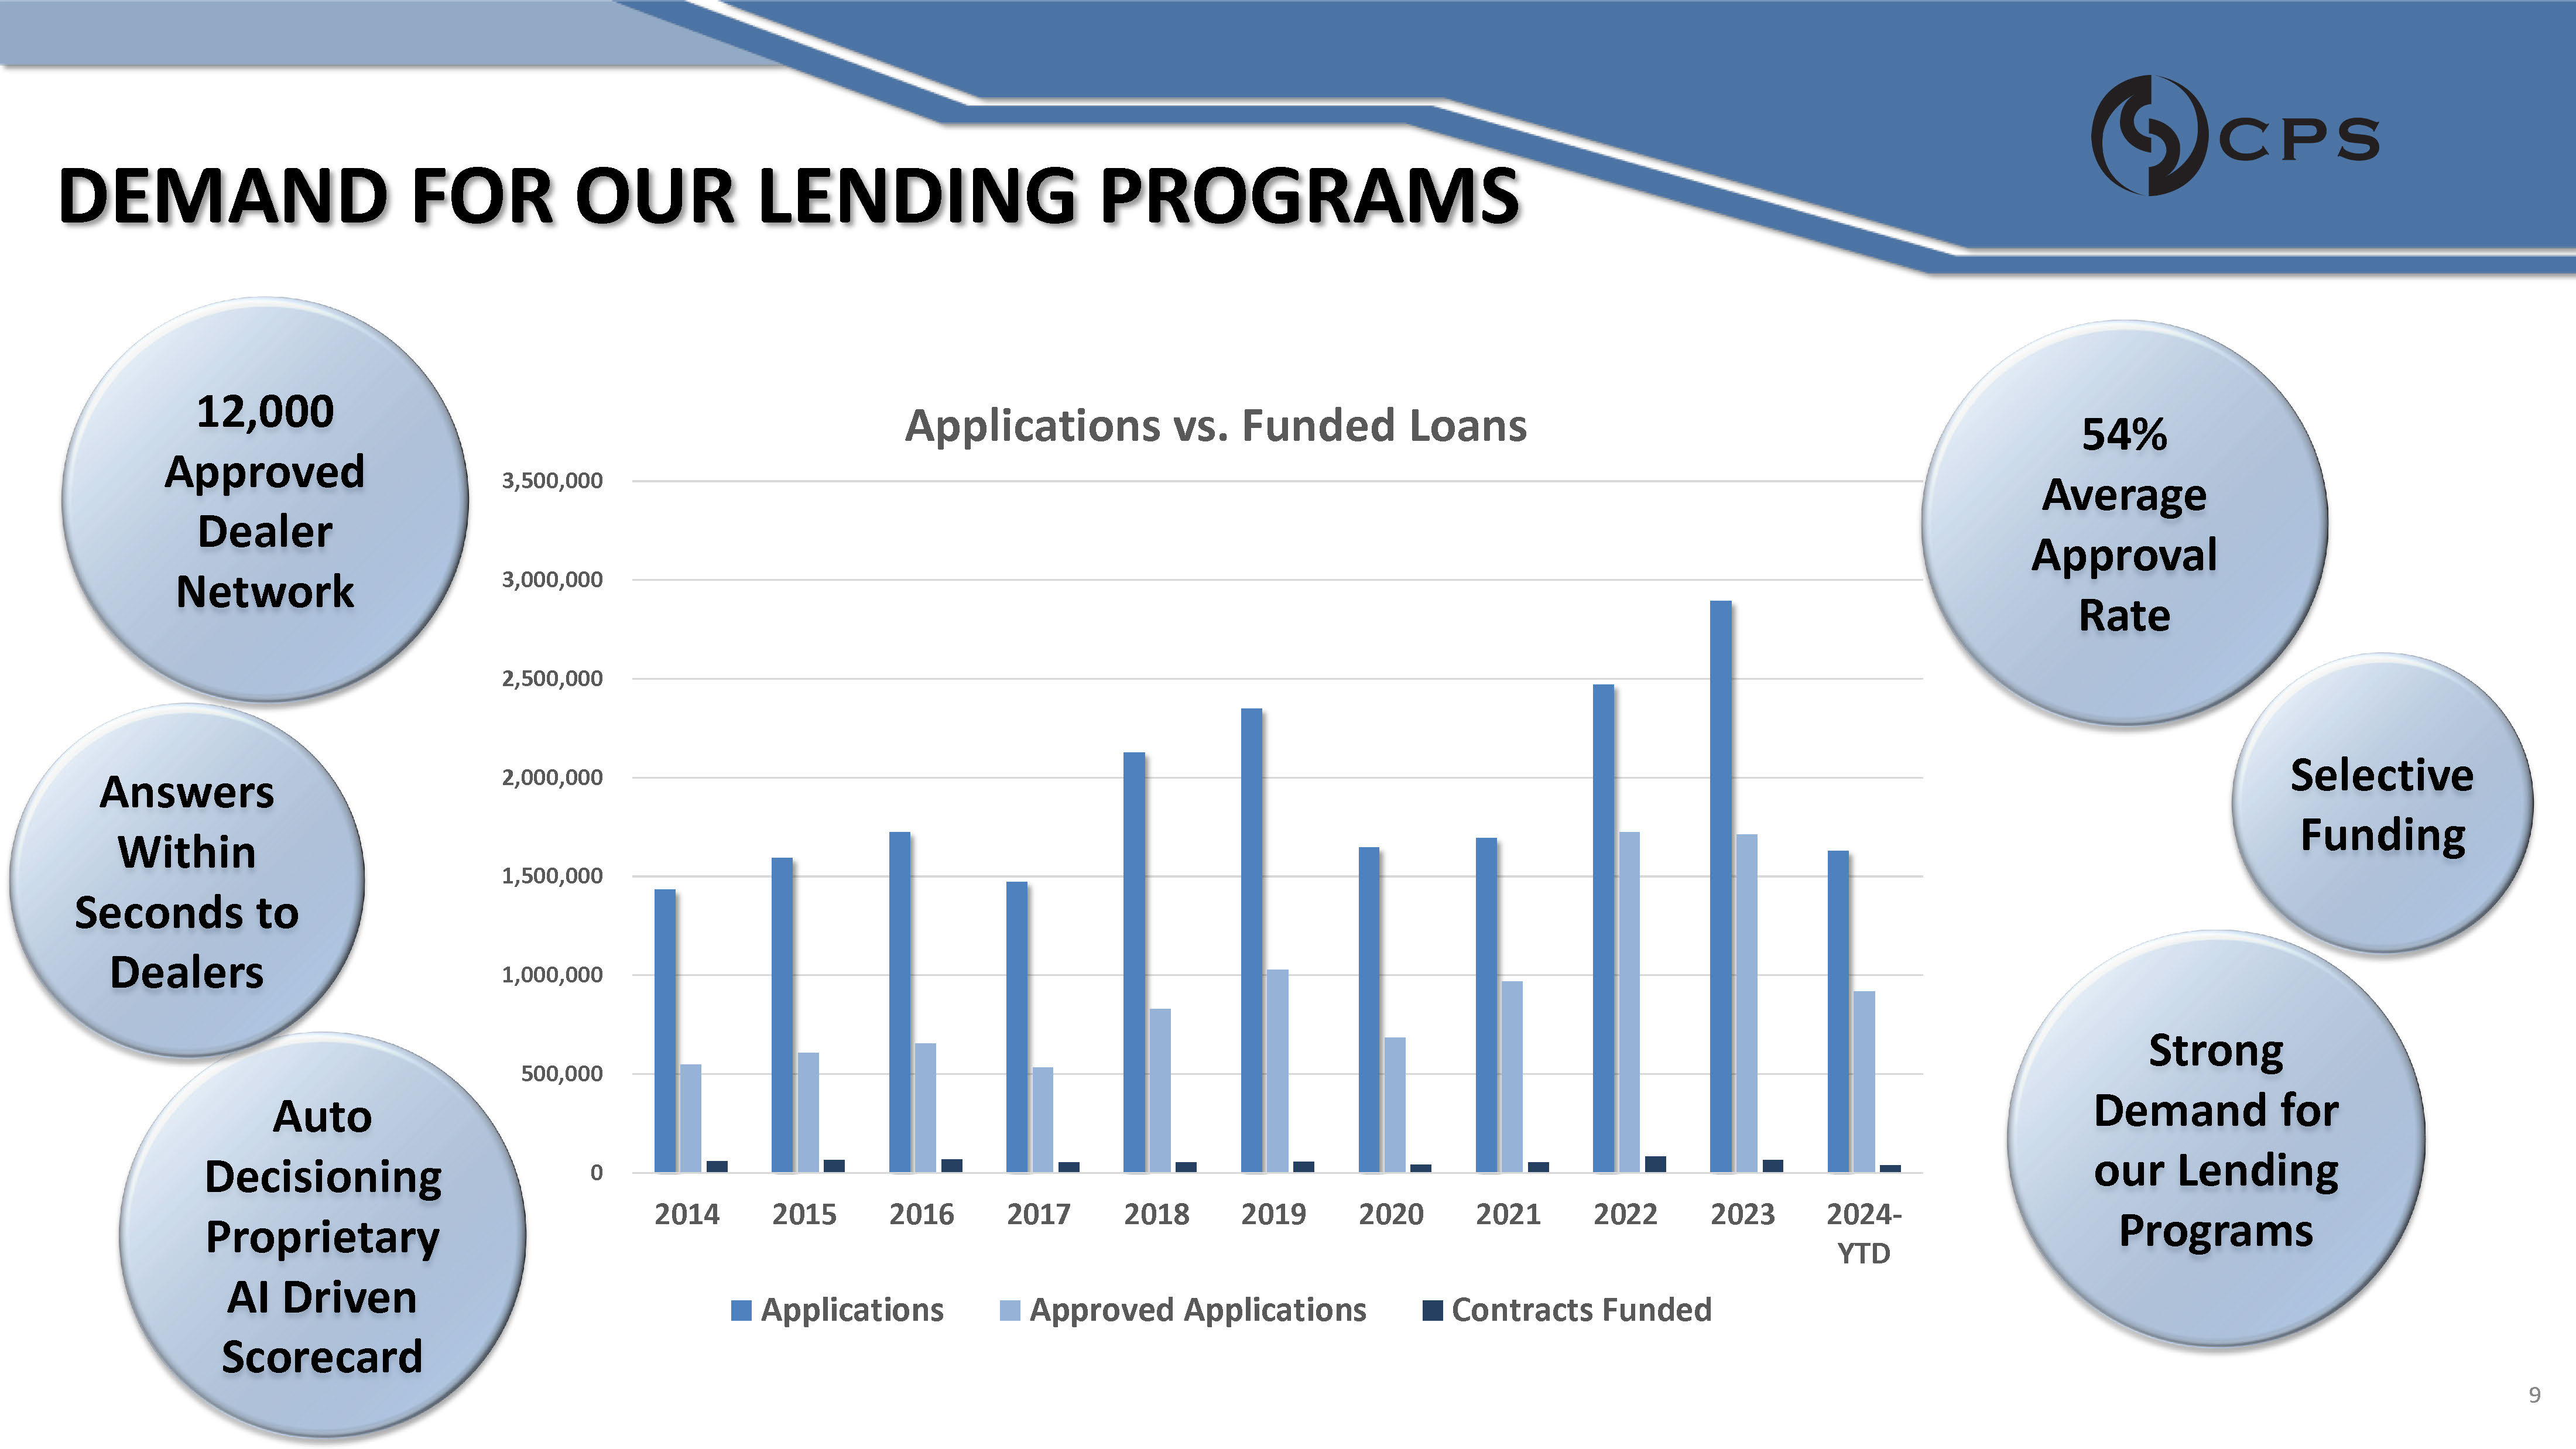
DEMAND FOR OUR LENDING PROGRAMS 0 500,000 1,000,000 1,500,000 2,000,000 2,500,000 3,000,000 3,500,000 Applications vs. Funded Loans Approved Applications 2014 2015 2016 2017 2018 2019 2020 2021 2022 2023 2024 - YTD Applications Contracts Funded 54% Average Approval Rate 12,000 Approved Dealer Network Strong Demand for our Lending Programs Auto Decisioning Proprietary AI Driven Scorecard Selective Funding Answers Within Seconds to Dealers 9
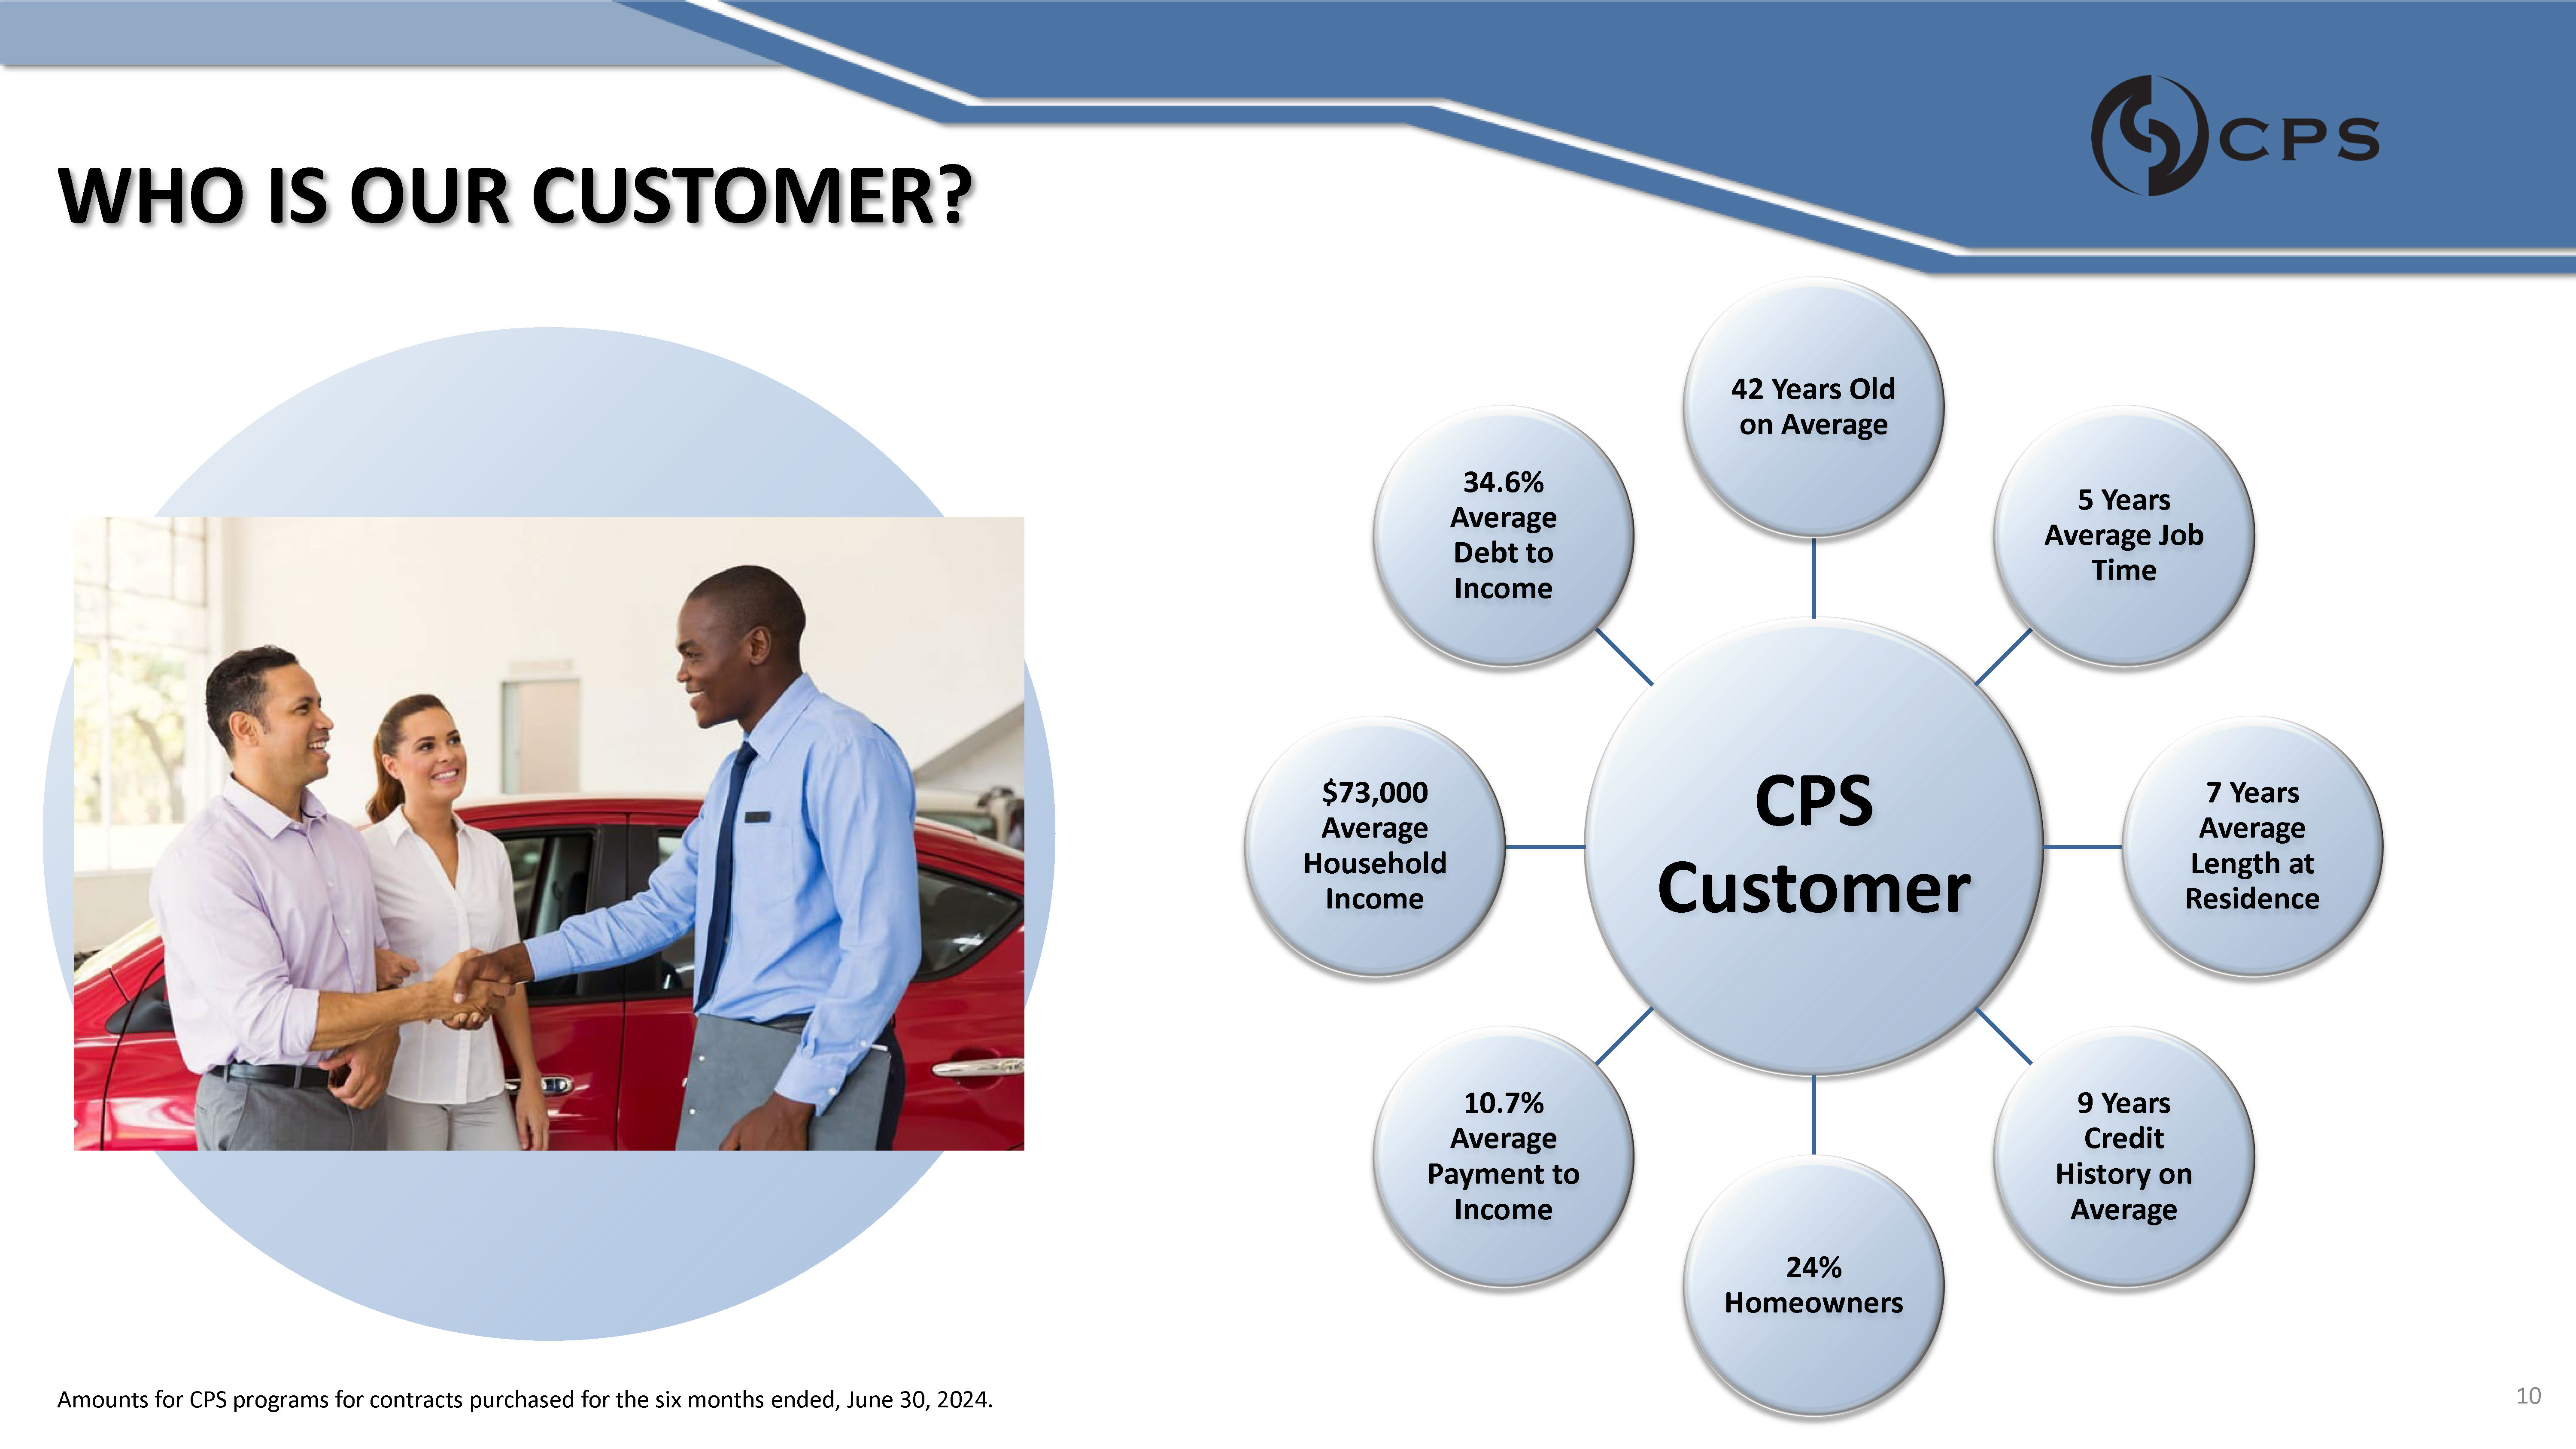
WHO IS OUR CUSTOMER? CPS Customer 42 Years Old on Average 5 Years Average Job Time 7 Years Average Length at Residence 9 Years Credit History on Average 24% Homeowners 10.7% Average Payment to Income $73,000 Average Household Income 34.6% Average Debt to Income 10 Amounts for CPS programs for contracts purchased for the six months ended, June 30, 2024.
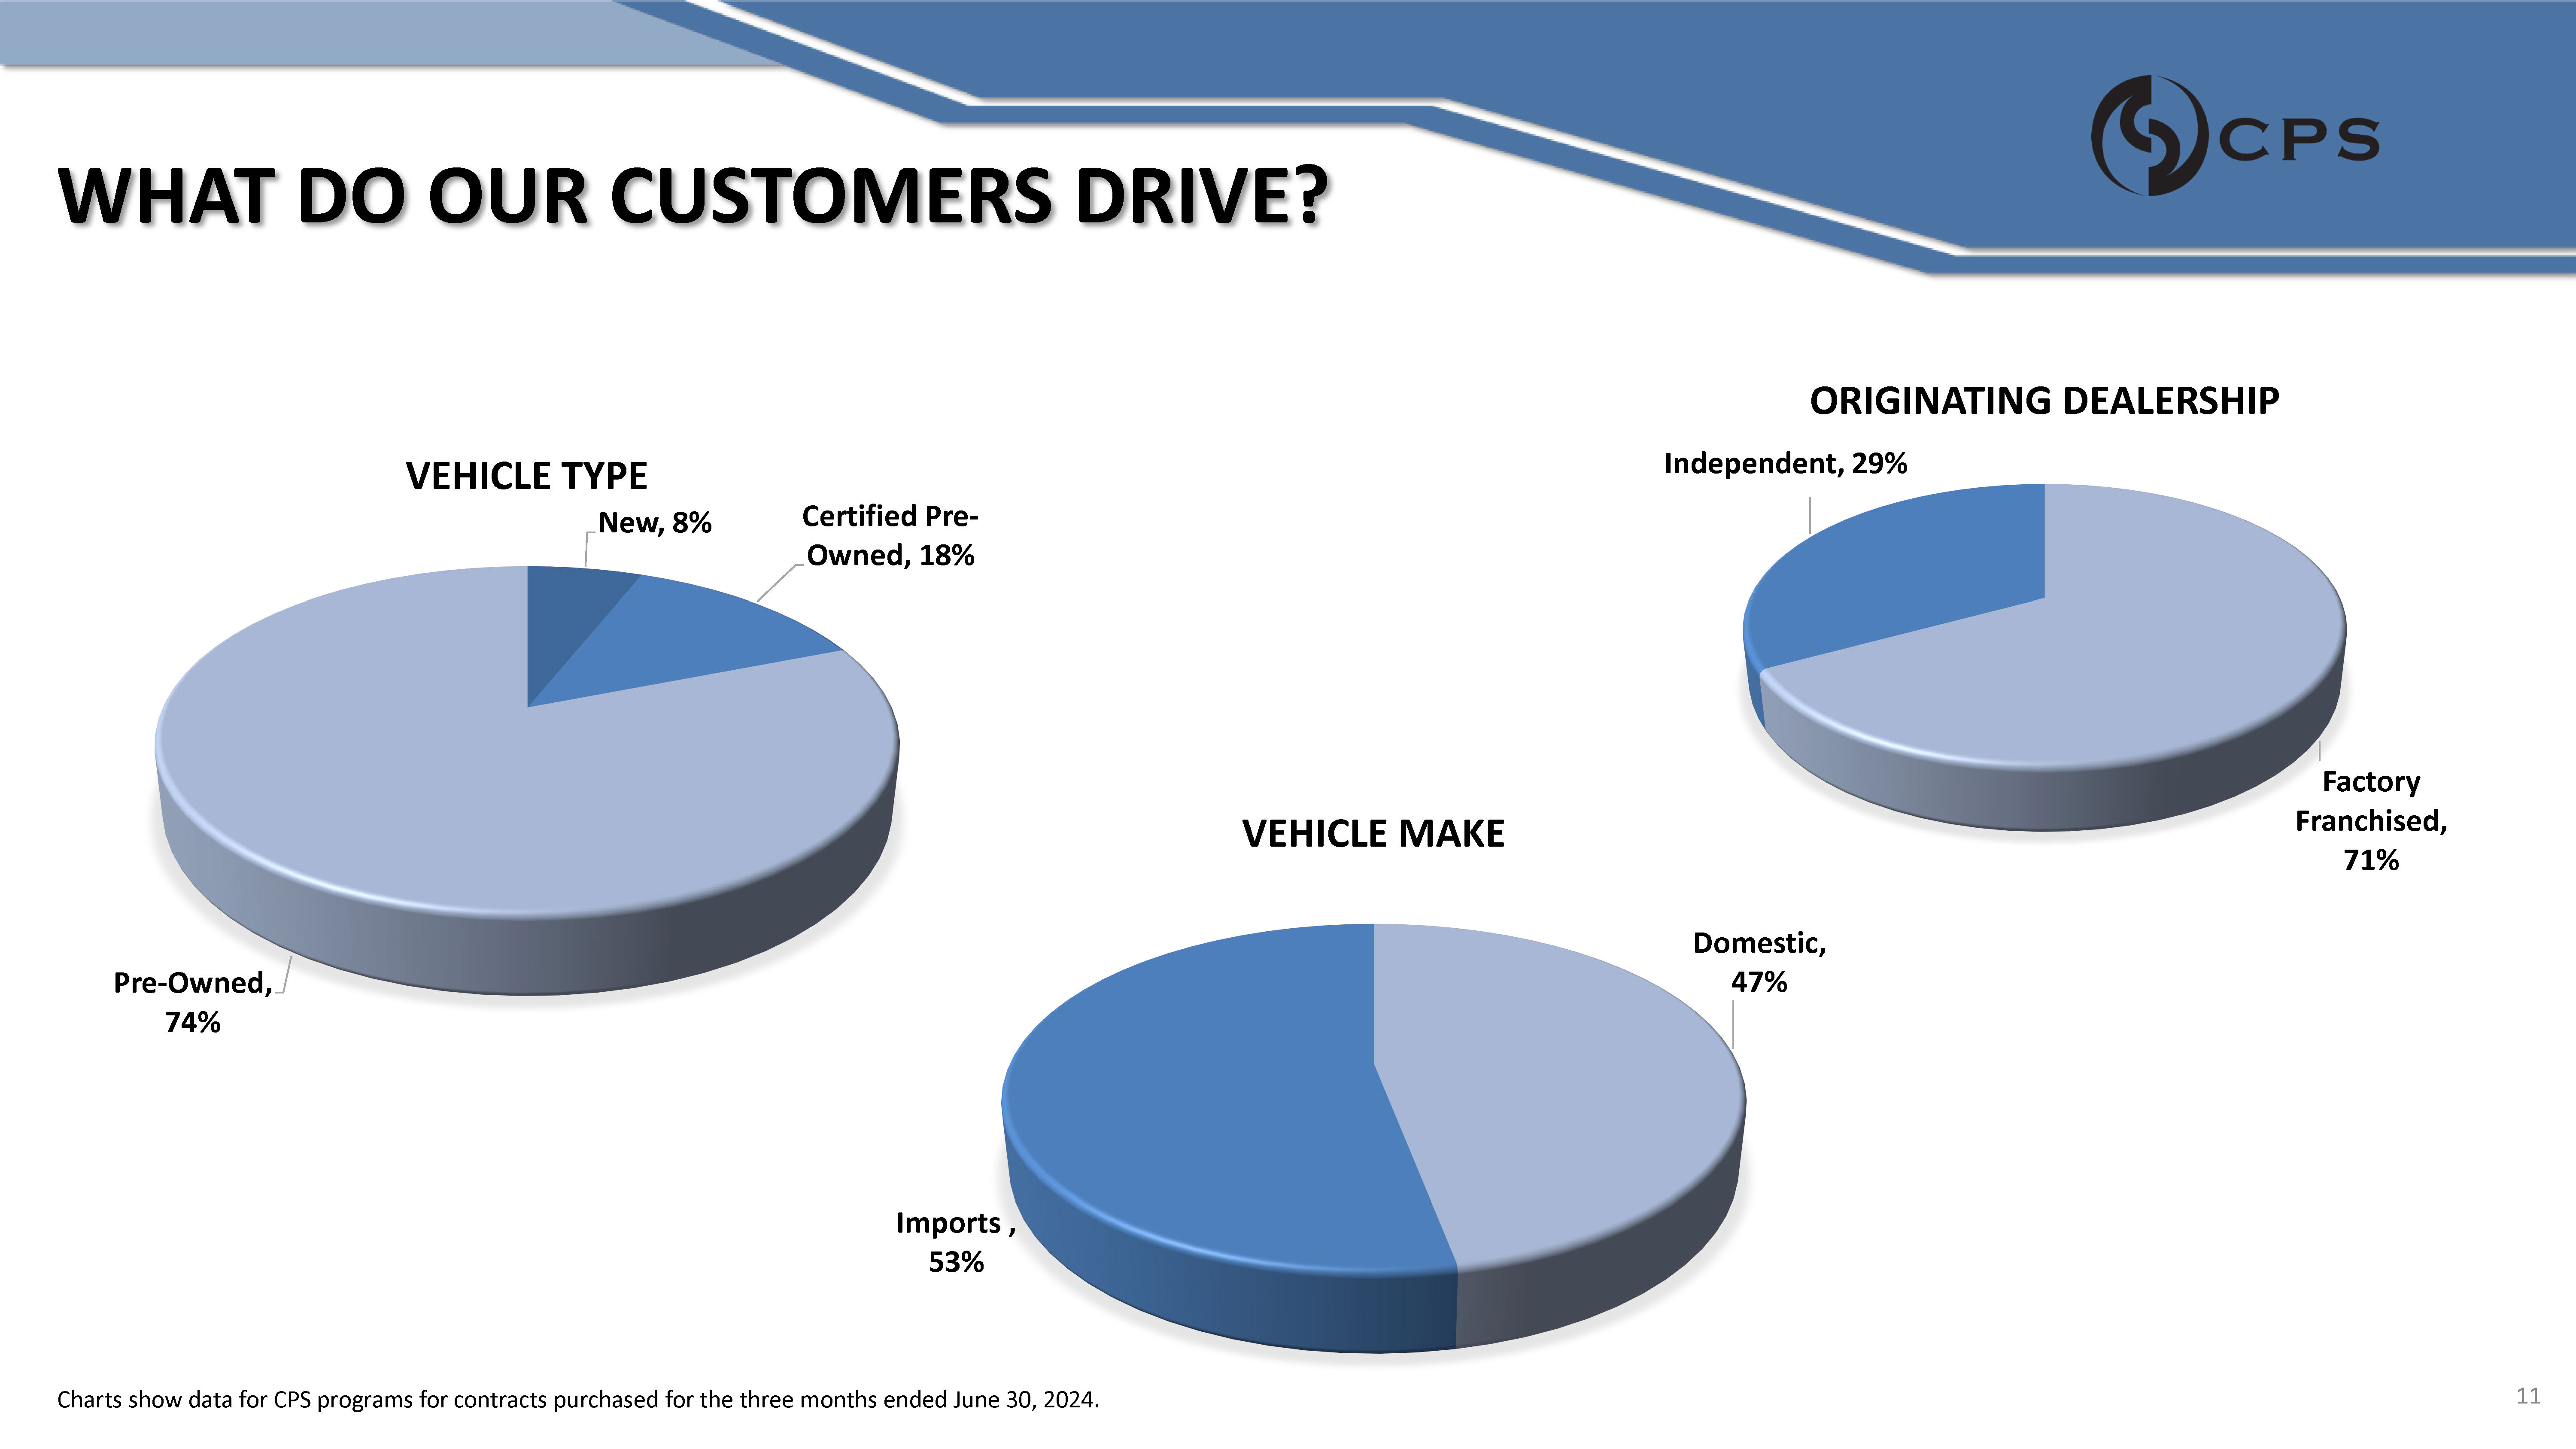
WHAT DO OUR CUSTOMERS DRIVE? Certified Pre - Owned, 18% Pre - Owned, 74% VEHICLE TYPE New, 8% Factory Franchised, 71% ORIGINATING DEALERSHIP Independent, 29% Domestic, 47% 11 Charts show data for CPS programs for contracts purchased for the three months ended June 30, 2024. Imports , 53% VEHICLE MAKE
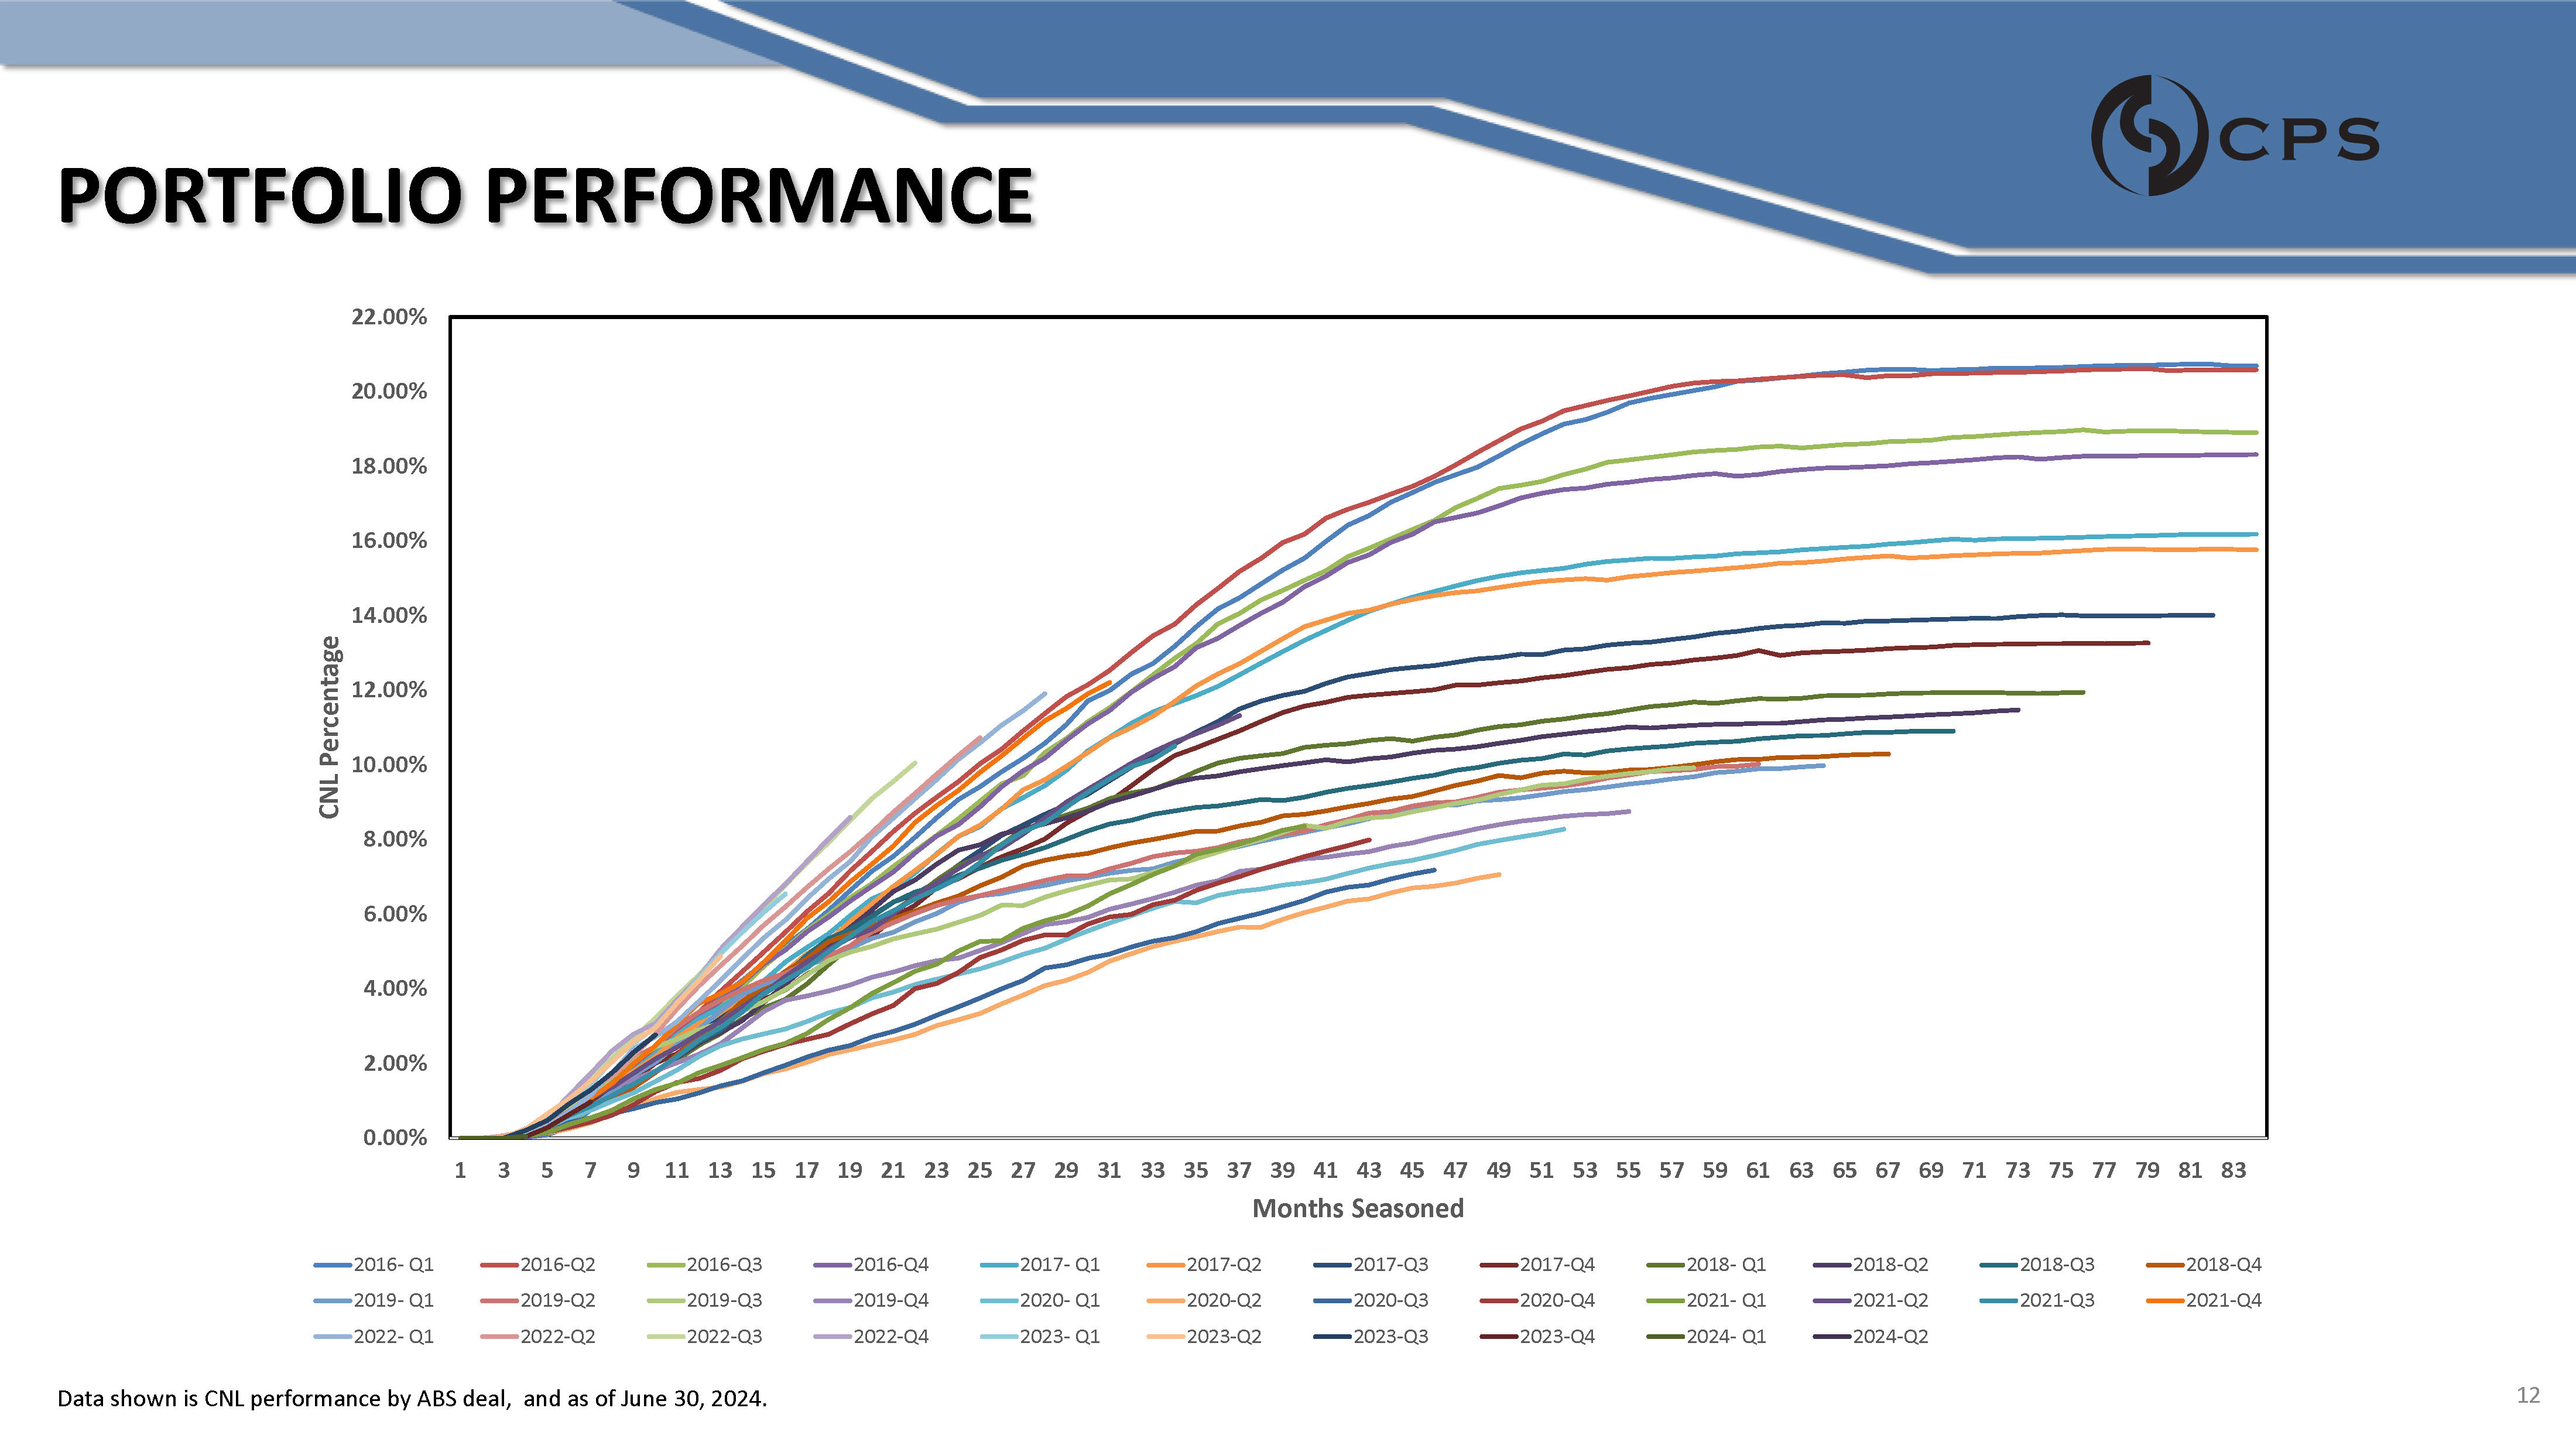
PORTFOLIO PERFORMANCE Data shown is CNL performance by ABS deal, and as of June 30, 2024. 12 22.00% 20.00% 18.00% 16.00% 14.00% 12.00% 10.00% 8.00% 6.00% 4.00% 2.00% 0.00% 1 3 5 7 9 11 13 15 17 19 21 23 25 27 29 31 33 35 37 39 41 43 45 47 49 51 53 55 57 59 61 63 65 67 69 71 73 75 77 79 81 83 Months Seasoned CNL Percentage 2016 - Q1 2019 - Q1 2022 - Q1 2016 - Q2 2019 - Q2 2022 - Q2 2016 - Q3 2019 - Q3 2022 - Q3 2016 - Q4 2019 - Q4 2022 - Q4 2017 - Q1 2020 - Q1 2023 - Q1 2017 - Q2 2020 - Q2 2023 - Q2 2017 - Q3 2020 - Q3 2023 - Q3 2017 - Q4 2020 - Q4 2023 - Q4 2018 - Q1 2021 - Q1 2024 - Q1 2018 - Q2 2021 - Q2 2024 - Q2 2018 - Q3 2021 - Q3 2018 - Q4 2021 - Q4
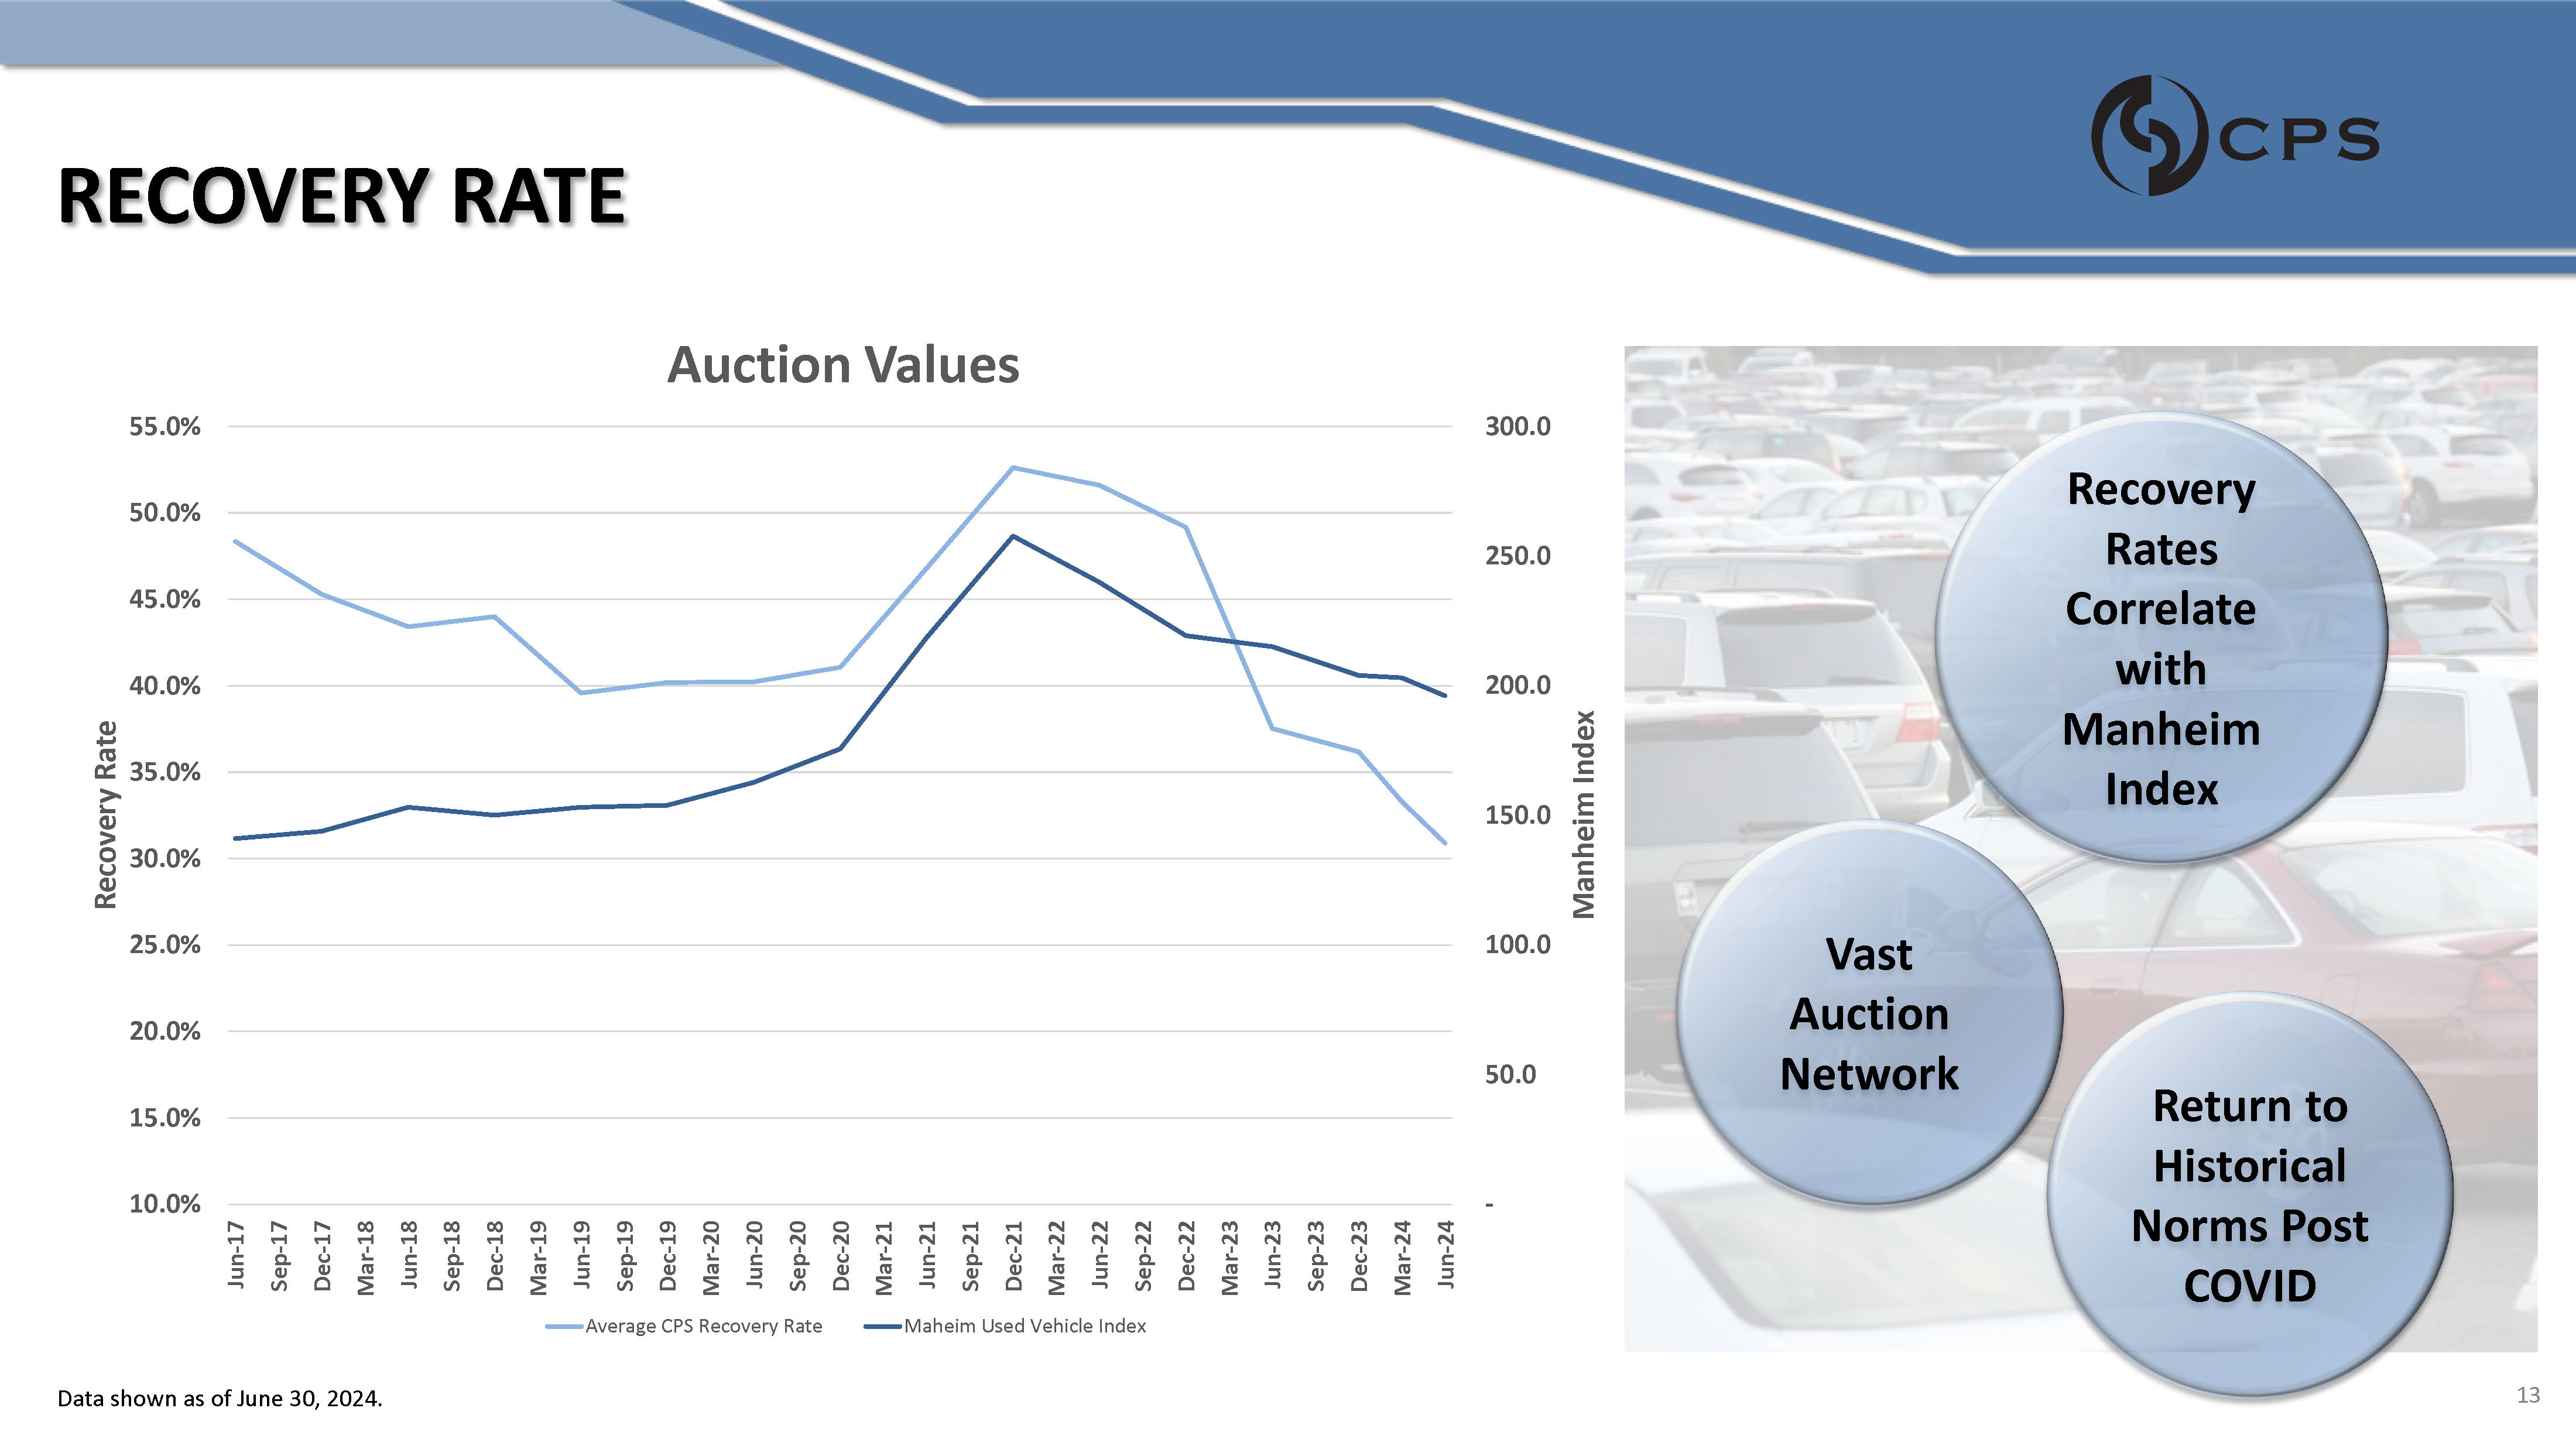
RECOVERY RATE Data shown as of June 30, 2024. - 50.0 100.0 150.0 200.0 250.0 300.0 10.0% 15.0% 20.0% 25.0% 30.0% 35.0% 40.0% 45.0% 50.0% 55.0% Jun - 17 Sep - 17 Dec - 17 Mar - 18 Jun - 18 Sep - 18 Dec - 18 Mar - 19 Jun - 19 Sep - 19 Dec - 19 Mar - 20 Jun - 20 Sep - 20 Dec - 20 Mar - 21 Jun - 21 Sep - 21 Dec - 21 Mar - 22 Jun - 22 Sep - 22 Dec - 22 Mar - 23 Jun - 23 Sep - 23 Dec - 23 Mar - 24 Jun - 24 Manheim Index Recovery Rate Auction Values Average CPS Recovery Rate Maheim Used Vehicle Index Recovery Rates Correlate with Manheim Index Return to Historical Norms Post COVID Vast Auction Network 13
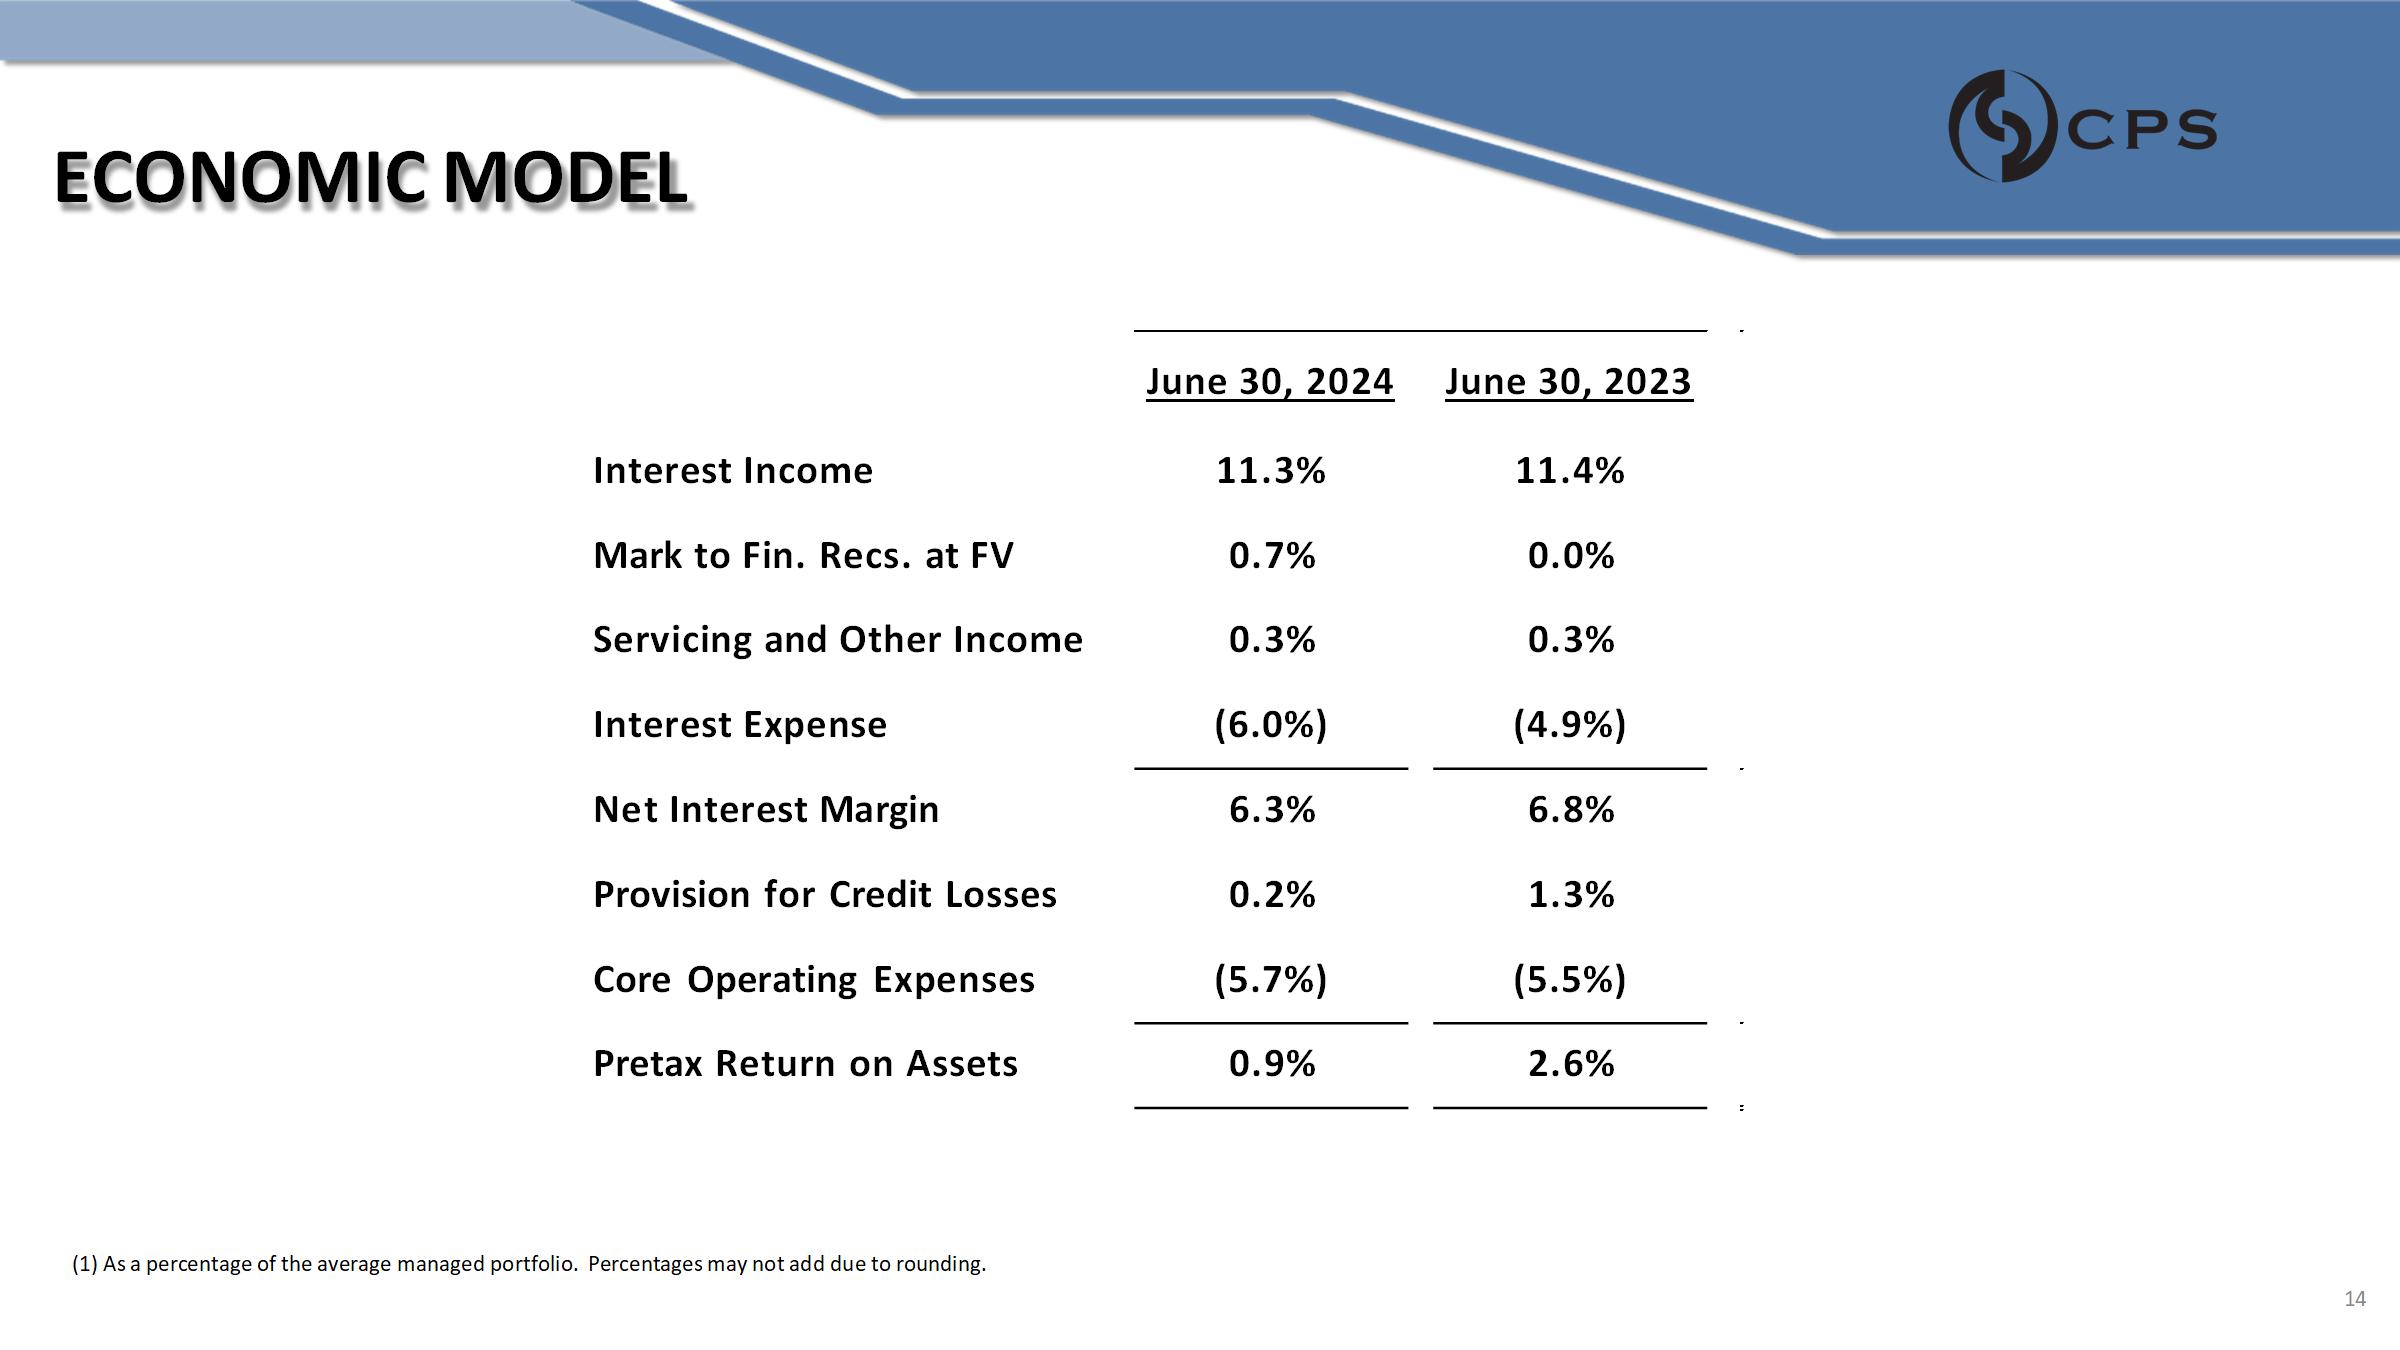
ECONOMIC MODEL June 30, 2023 June 30, 2024 11.4% 11.3% Interest Income 0.0% 0.7% Mark to Fin. Recs. at FV 0.3% 0.3% Servicing and Other Income (4.9%) (6.0%) Interest Expense 6.8% 6.3% Net Interest Margin 1.3% 0.2% Provision for Credit Losses (5.5%) (5.7%) Core Operating Expenses 2.6% 0.9% Pretax Return on Assets (1) As a percentage of the average managed portfolio. Percentages may not add due to rounding. 14
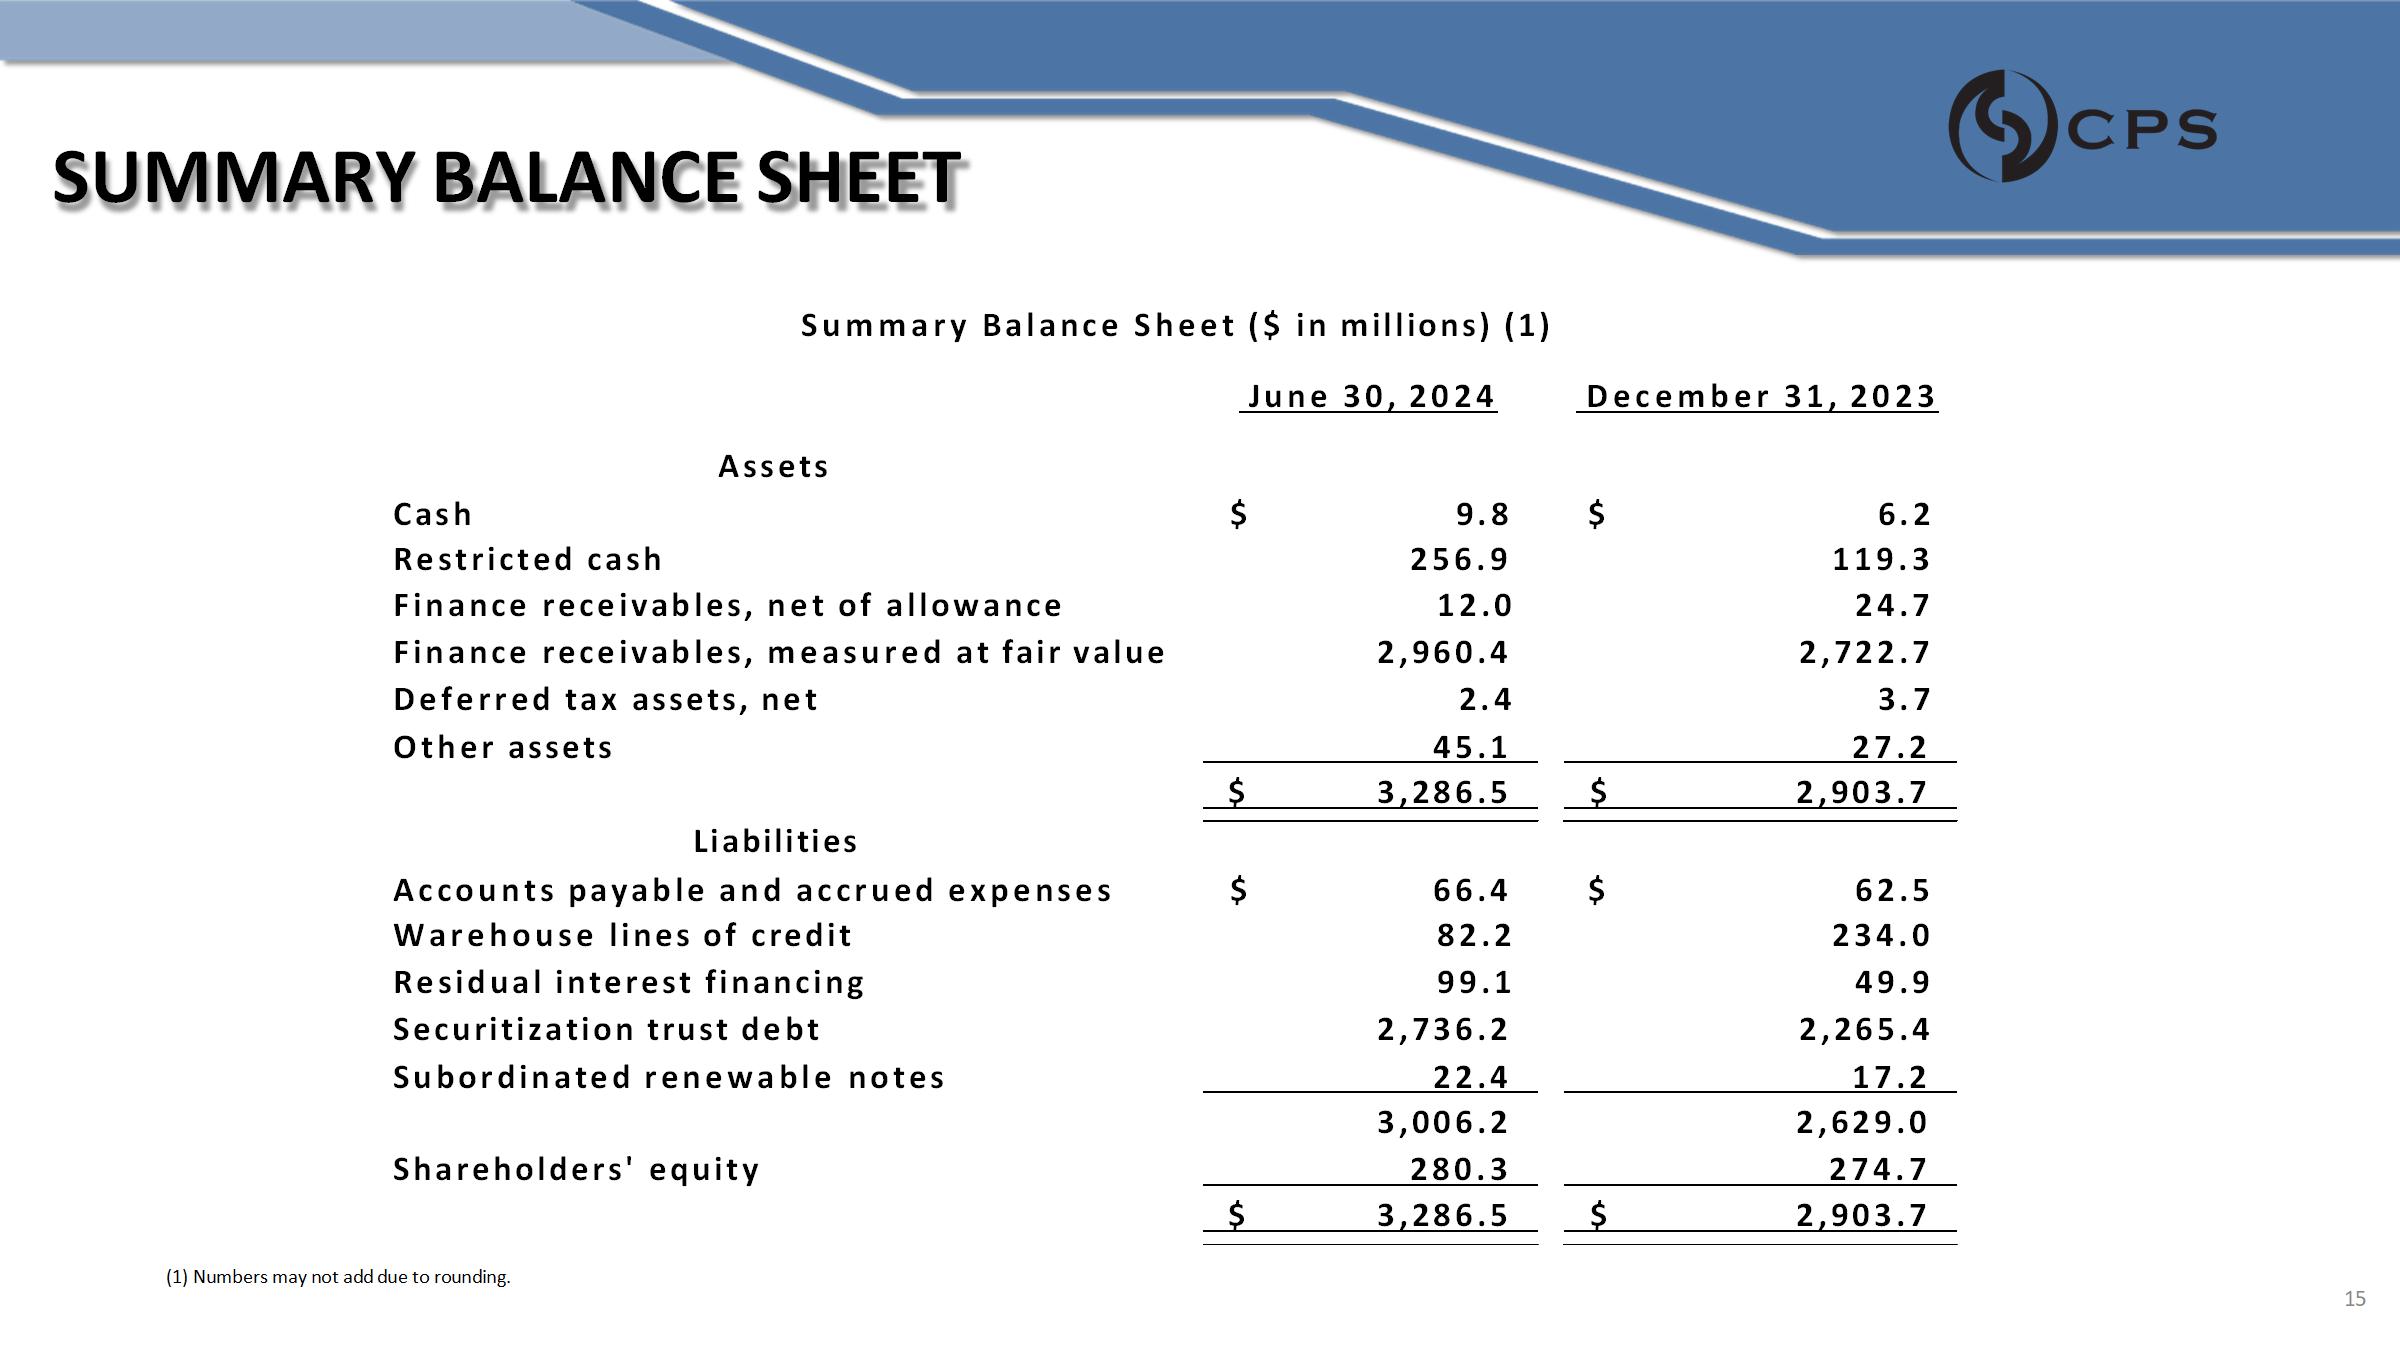
SUMMARY BALANCE SHEET June 30, 2024 December 31, 2023 Assets 6.2 $ $ 9.8 Cash 119.3 256.9 Restricted cash 24.7 12.0 Finance receivables, net of allowance 2,722.7 2,960.4 Finance receivables, measured at fair value 3.7 2.4 Deferred tax assets, net 27.2 45.1 Other assets $ 2,903.7 $ 3,286.5 Liabilities 62.5 $ $ 66.4 Accounts payable and accrued expenses 234.0 82.2 Warehouse lines of credit 49.9 99.1 Residual interest financing 2,265.4 2,736.2 Securitization trust debt 17.2 22.4 Subordinated renewable notes 2,629.0 3,006.2 274.7 280.3 Shareholders' equity $ 2,903.7 $ 3,286.5 Summary Balance Sheet ($ in millions) (1) (1) Numbers may not add due to rounding . 15
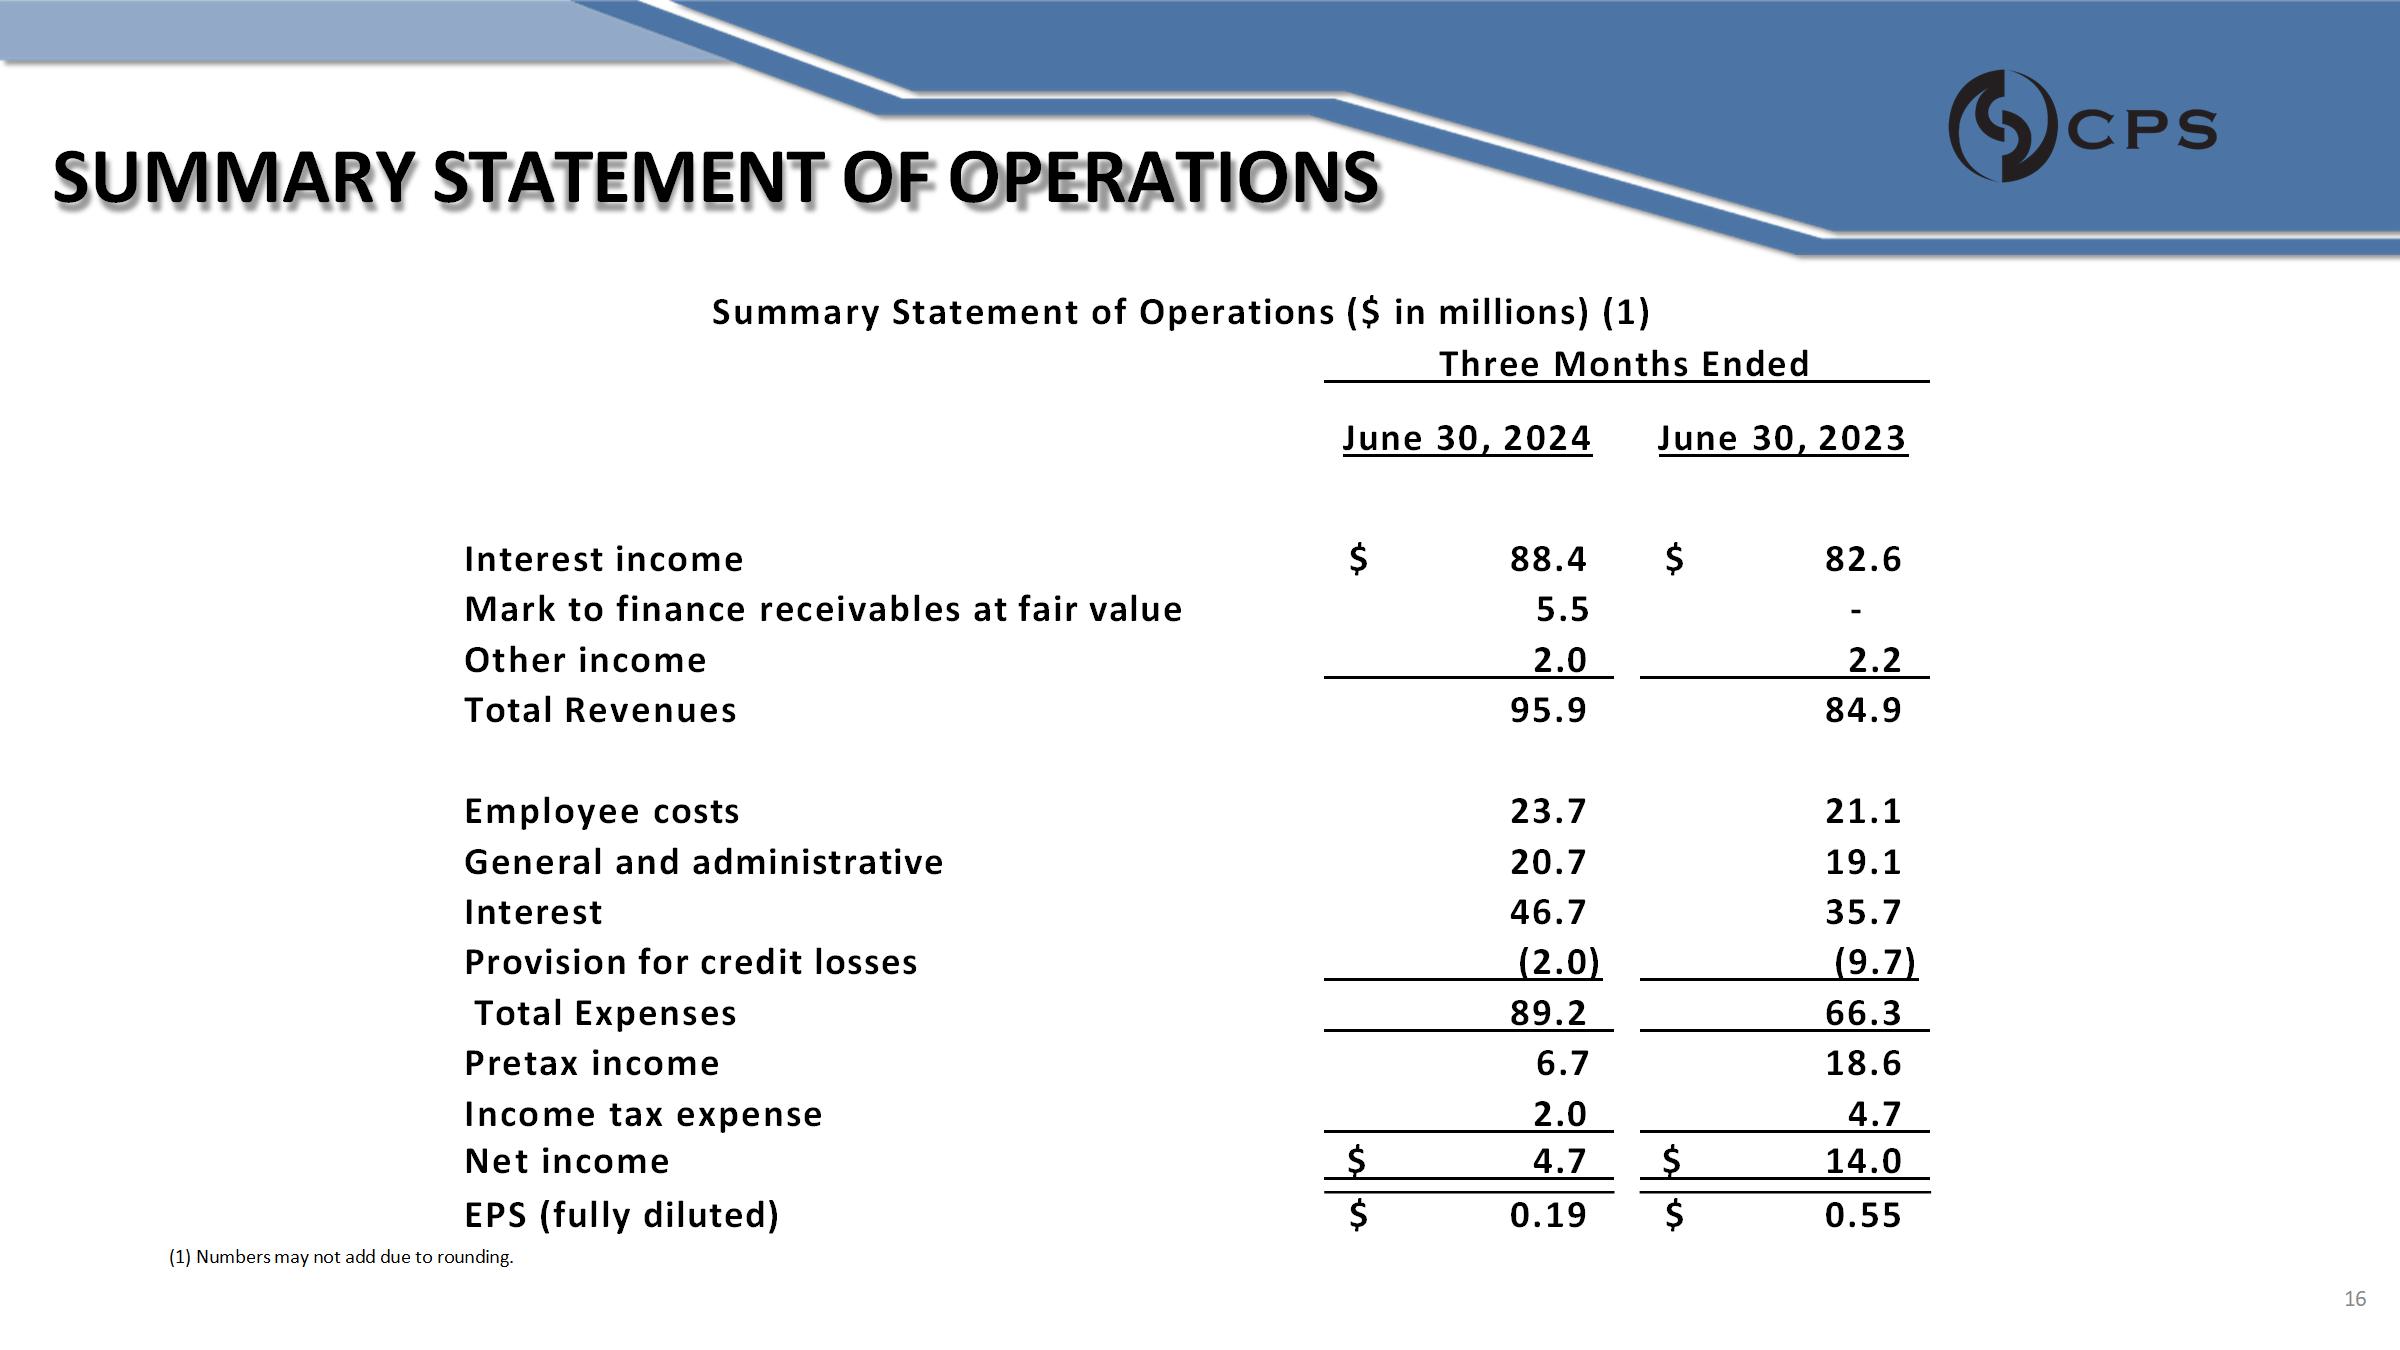
SUMMARY STATEMENT OF OPERATIONS (1) Numbers may not add due to rounding. 16 June 30, 2023 June 30, 2024 $ 82.6 $ 88.4 Interest income - 5.5 Mark to finance receivables at fair value 2.2 2.0 Other income 84.9 95.9 Total Revenues 21.1 23.7 Employee costs 19.1 20.7 General and administrative 35.7 46.7 Interest (9.7) (2.0) Provision for credit losses 66.3 89.2 Total Expenses 18.6 6.7 Pretax income 4.7 2.0 Income tax expense $ 14.0 $ 4.7 Net income $ 0.55 $ 0.19 EPS (fully diluted) Summary Statement of Operations ($ in millions) (1) Three Months Ended
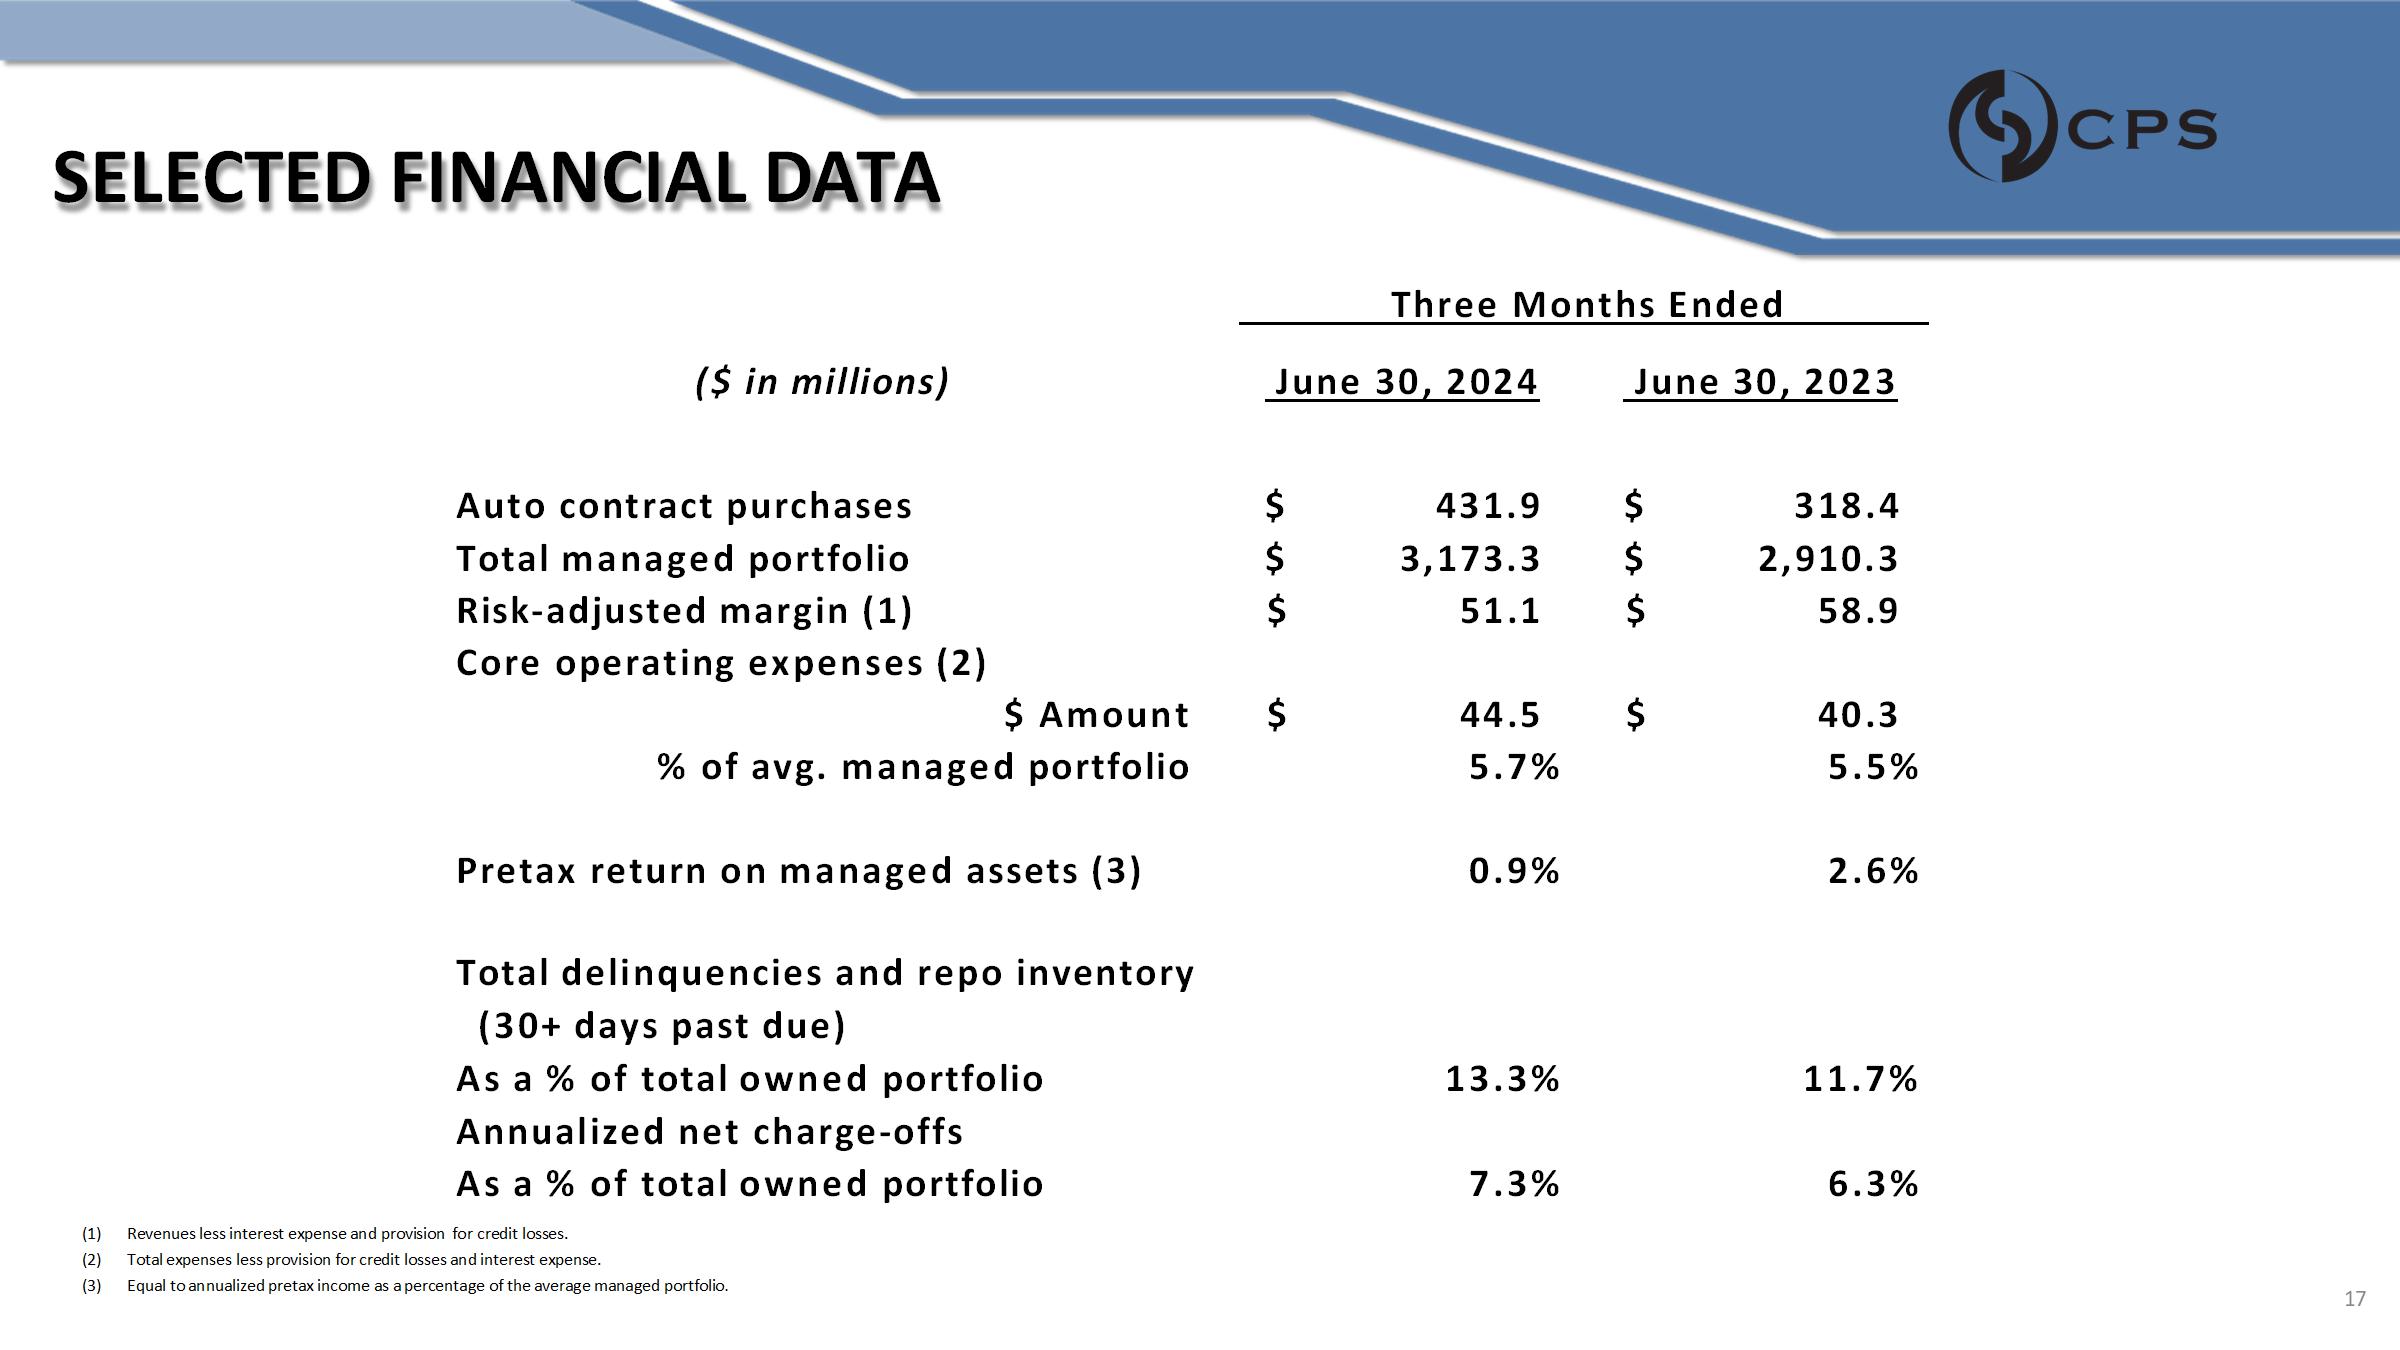
SELECTED FINANCIAL DATA June 30, 2023 June 30, 2024 ($ in millions) $ 318.4 $ 431.9 Auto contract purchases $ 2,910.3 $ 3,173.3 Total managed portfolio $ 58.9 $ 51.1 Risk - adjusted margin (1) Core operating expenses (2) $ 40.3 $ 44.5 $ Amount 5.5% 5.7% % of avg. managed portfolio 2.6% 0.9% Pretax return on managed assets (3) Total delinquencies and repo inventory (30+ days past due) 11.7% 13.3% As a % of total owned portfolio Annualized net charge - offs 6.3% 7.3% As a % of total owned portfolio for credit losses. 17 Three Months Ended (1) Revenues less interest expense and provision (2) Total expenses less provision for credit losses and interest expense. (3) Equal to annualized pretax income as a percentage of the average managed portfolio .
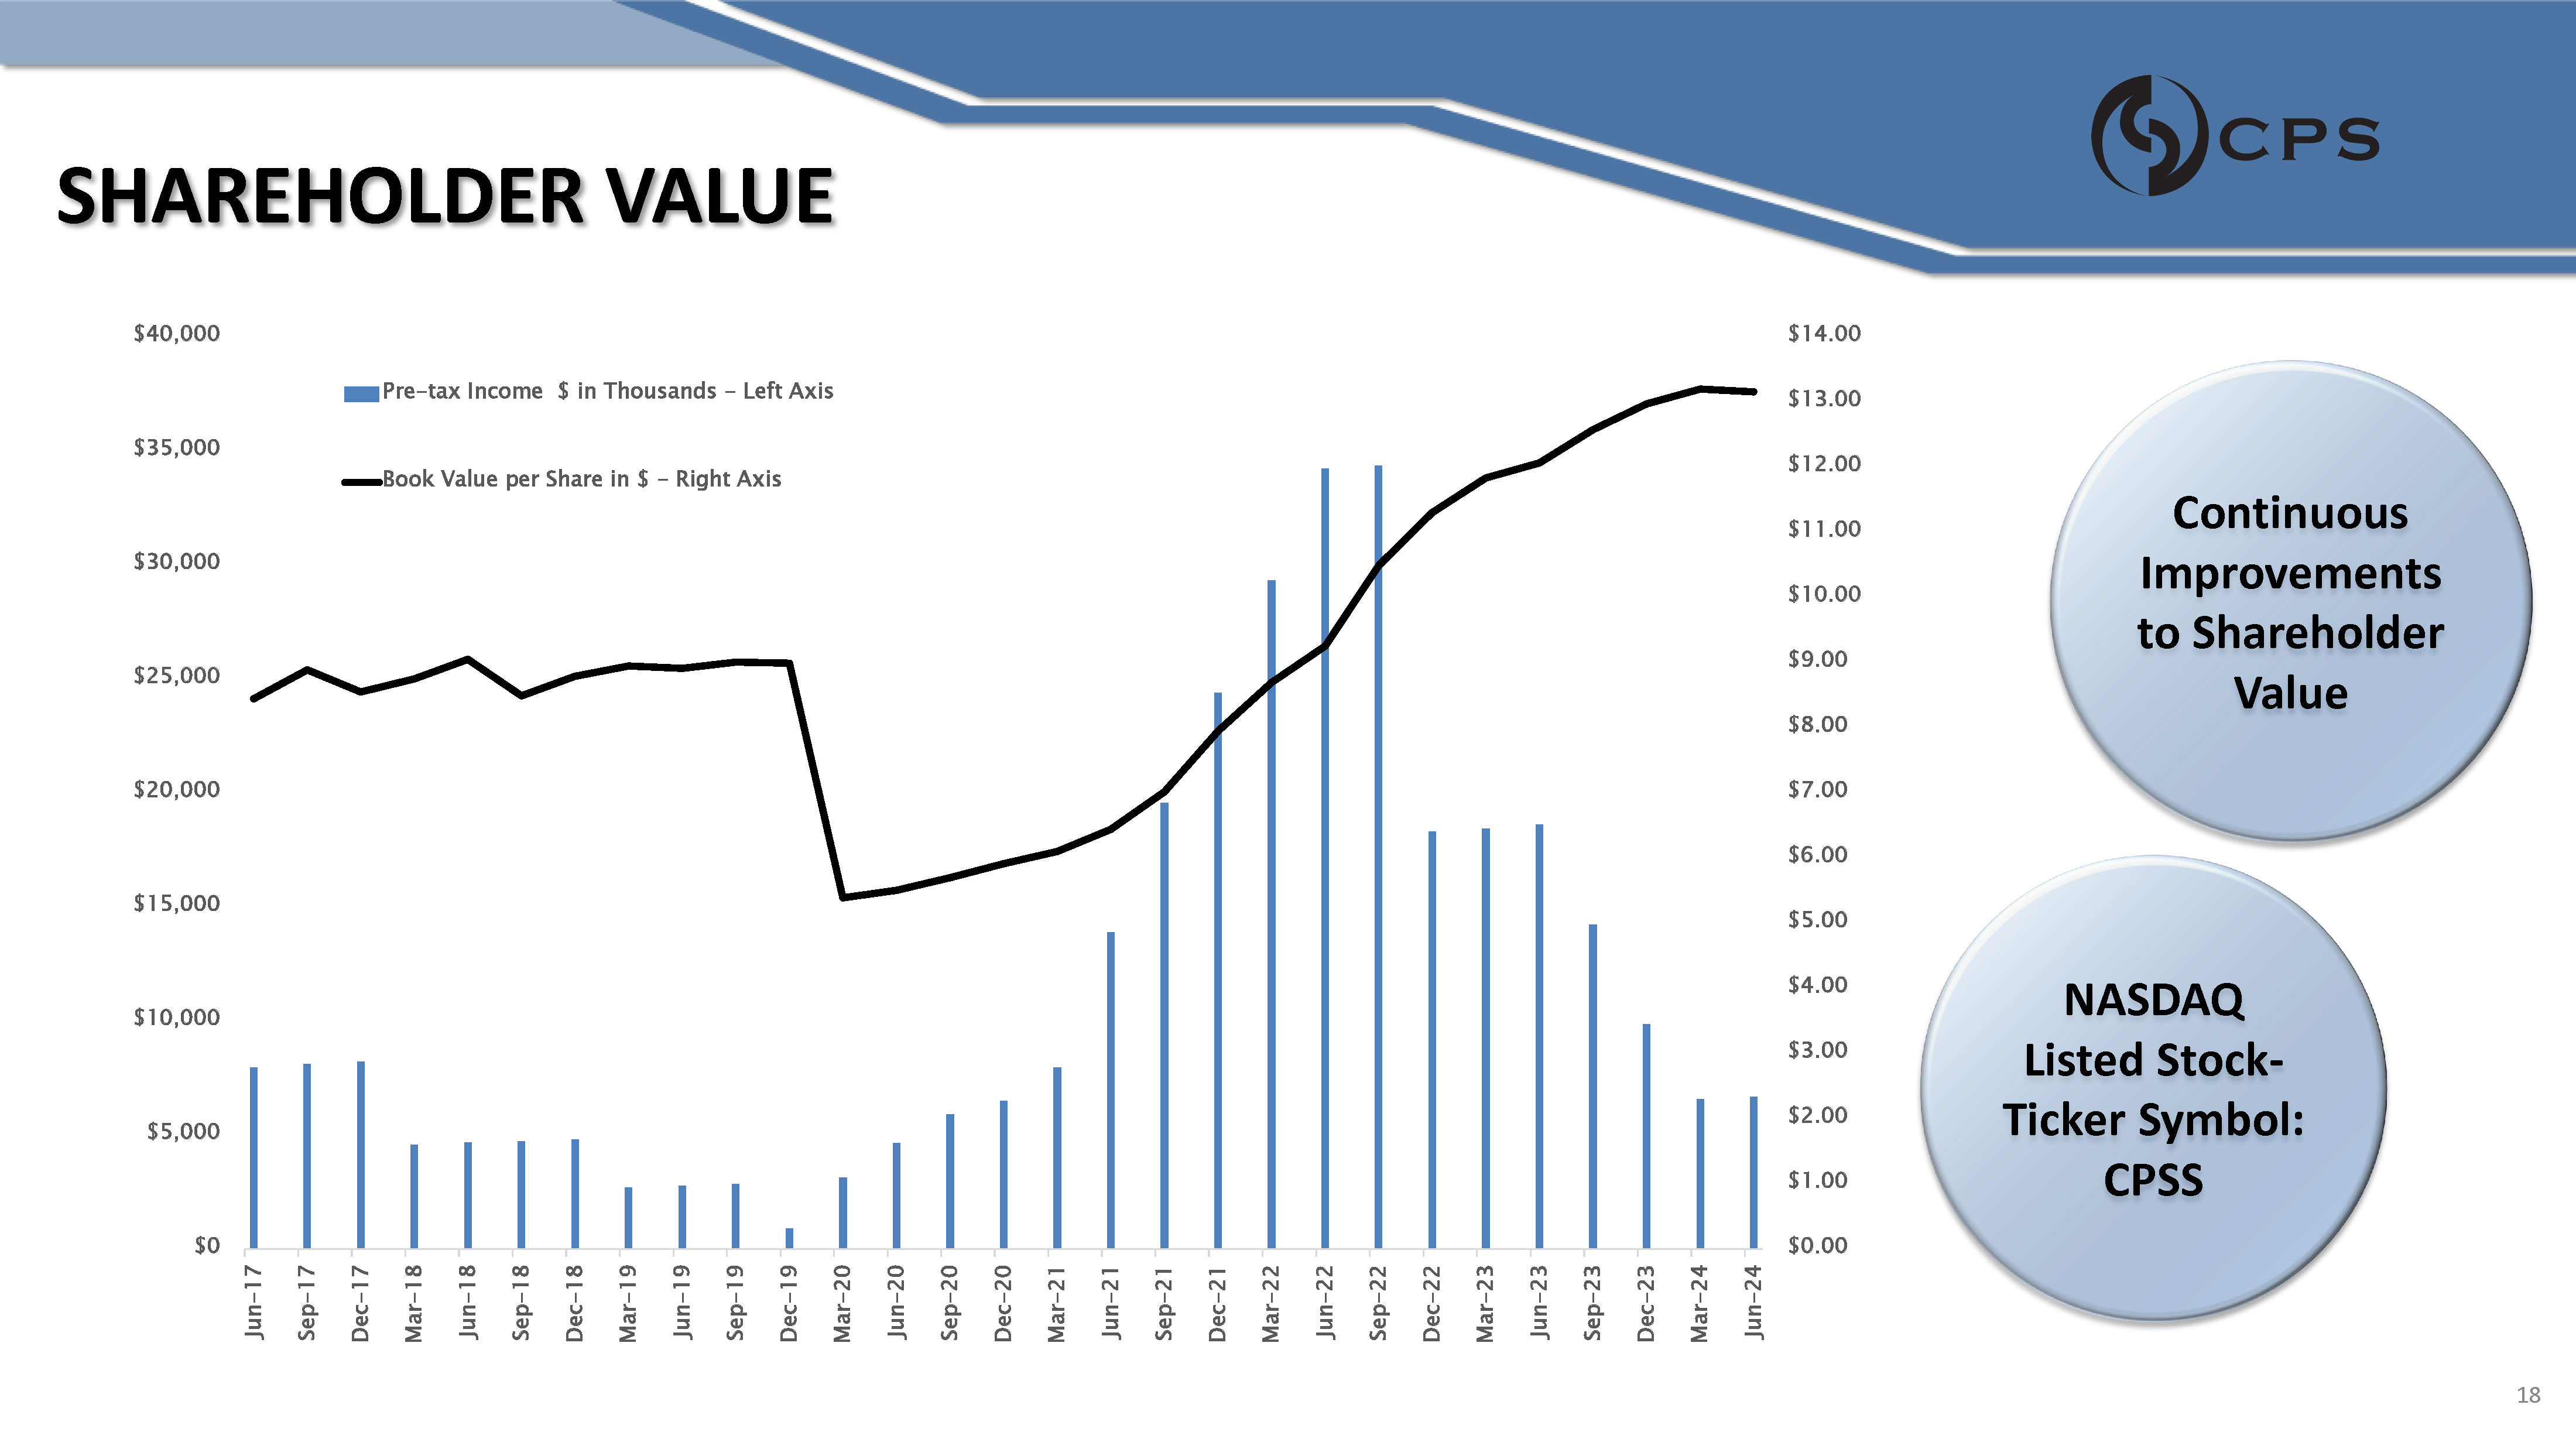
SHAREHOLDER VALUE $0 $5,000 $10,000 $15,000 $20,000 $25,000 $30,000 $35,000 $40,000 Jun - 17 Sep - 17 Dec - 17 Mar - 18 Jun - 18 Sep - 18 Dec - 18 Mar - 19 Jun - 19 Sep - 19 Dec - 19 Mar - 20 Jun - 20 Sep - 20 Dec - 20 Mar - 21 Jun - 21 Sep - 21 Dec - 21 Mar - 22 Jun - 22 Sep - 22 Dec - 22 Mar - 23 Jun - 23 Sep - 23 Dec - 23 Mar - 24 Jun - 24 $0.00 $1.00 $2.00 $3.00 $4.00 $5.00 $6.00 $7.00 $8.00 $9.00 $10.00 $11.00 $12.00 $13.00 $14.00 Pre - tax Income $ in Thousands - Left Axis Book Value per Share in $ - Right Axis Continuous Improvements to Shareholder Value NASDAQ Listed Stock - Ticker Symbol: CPSS 18
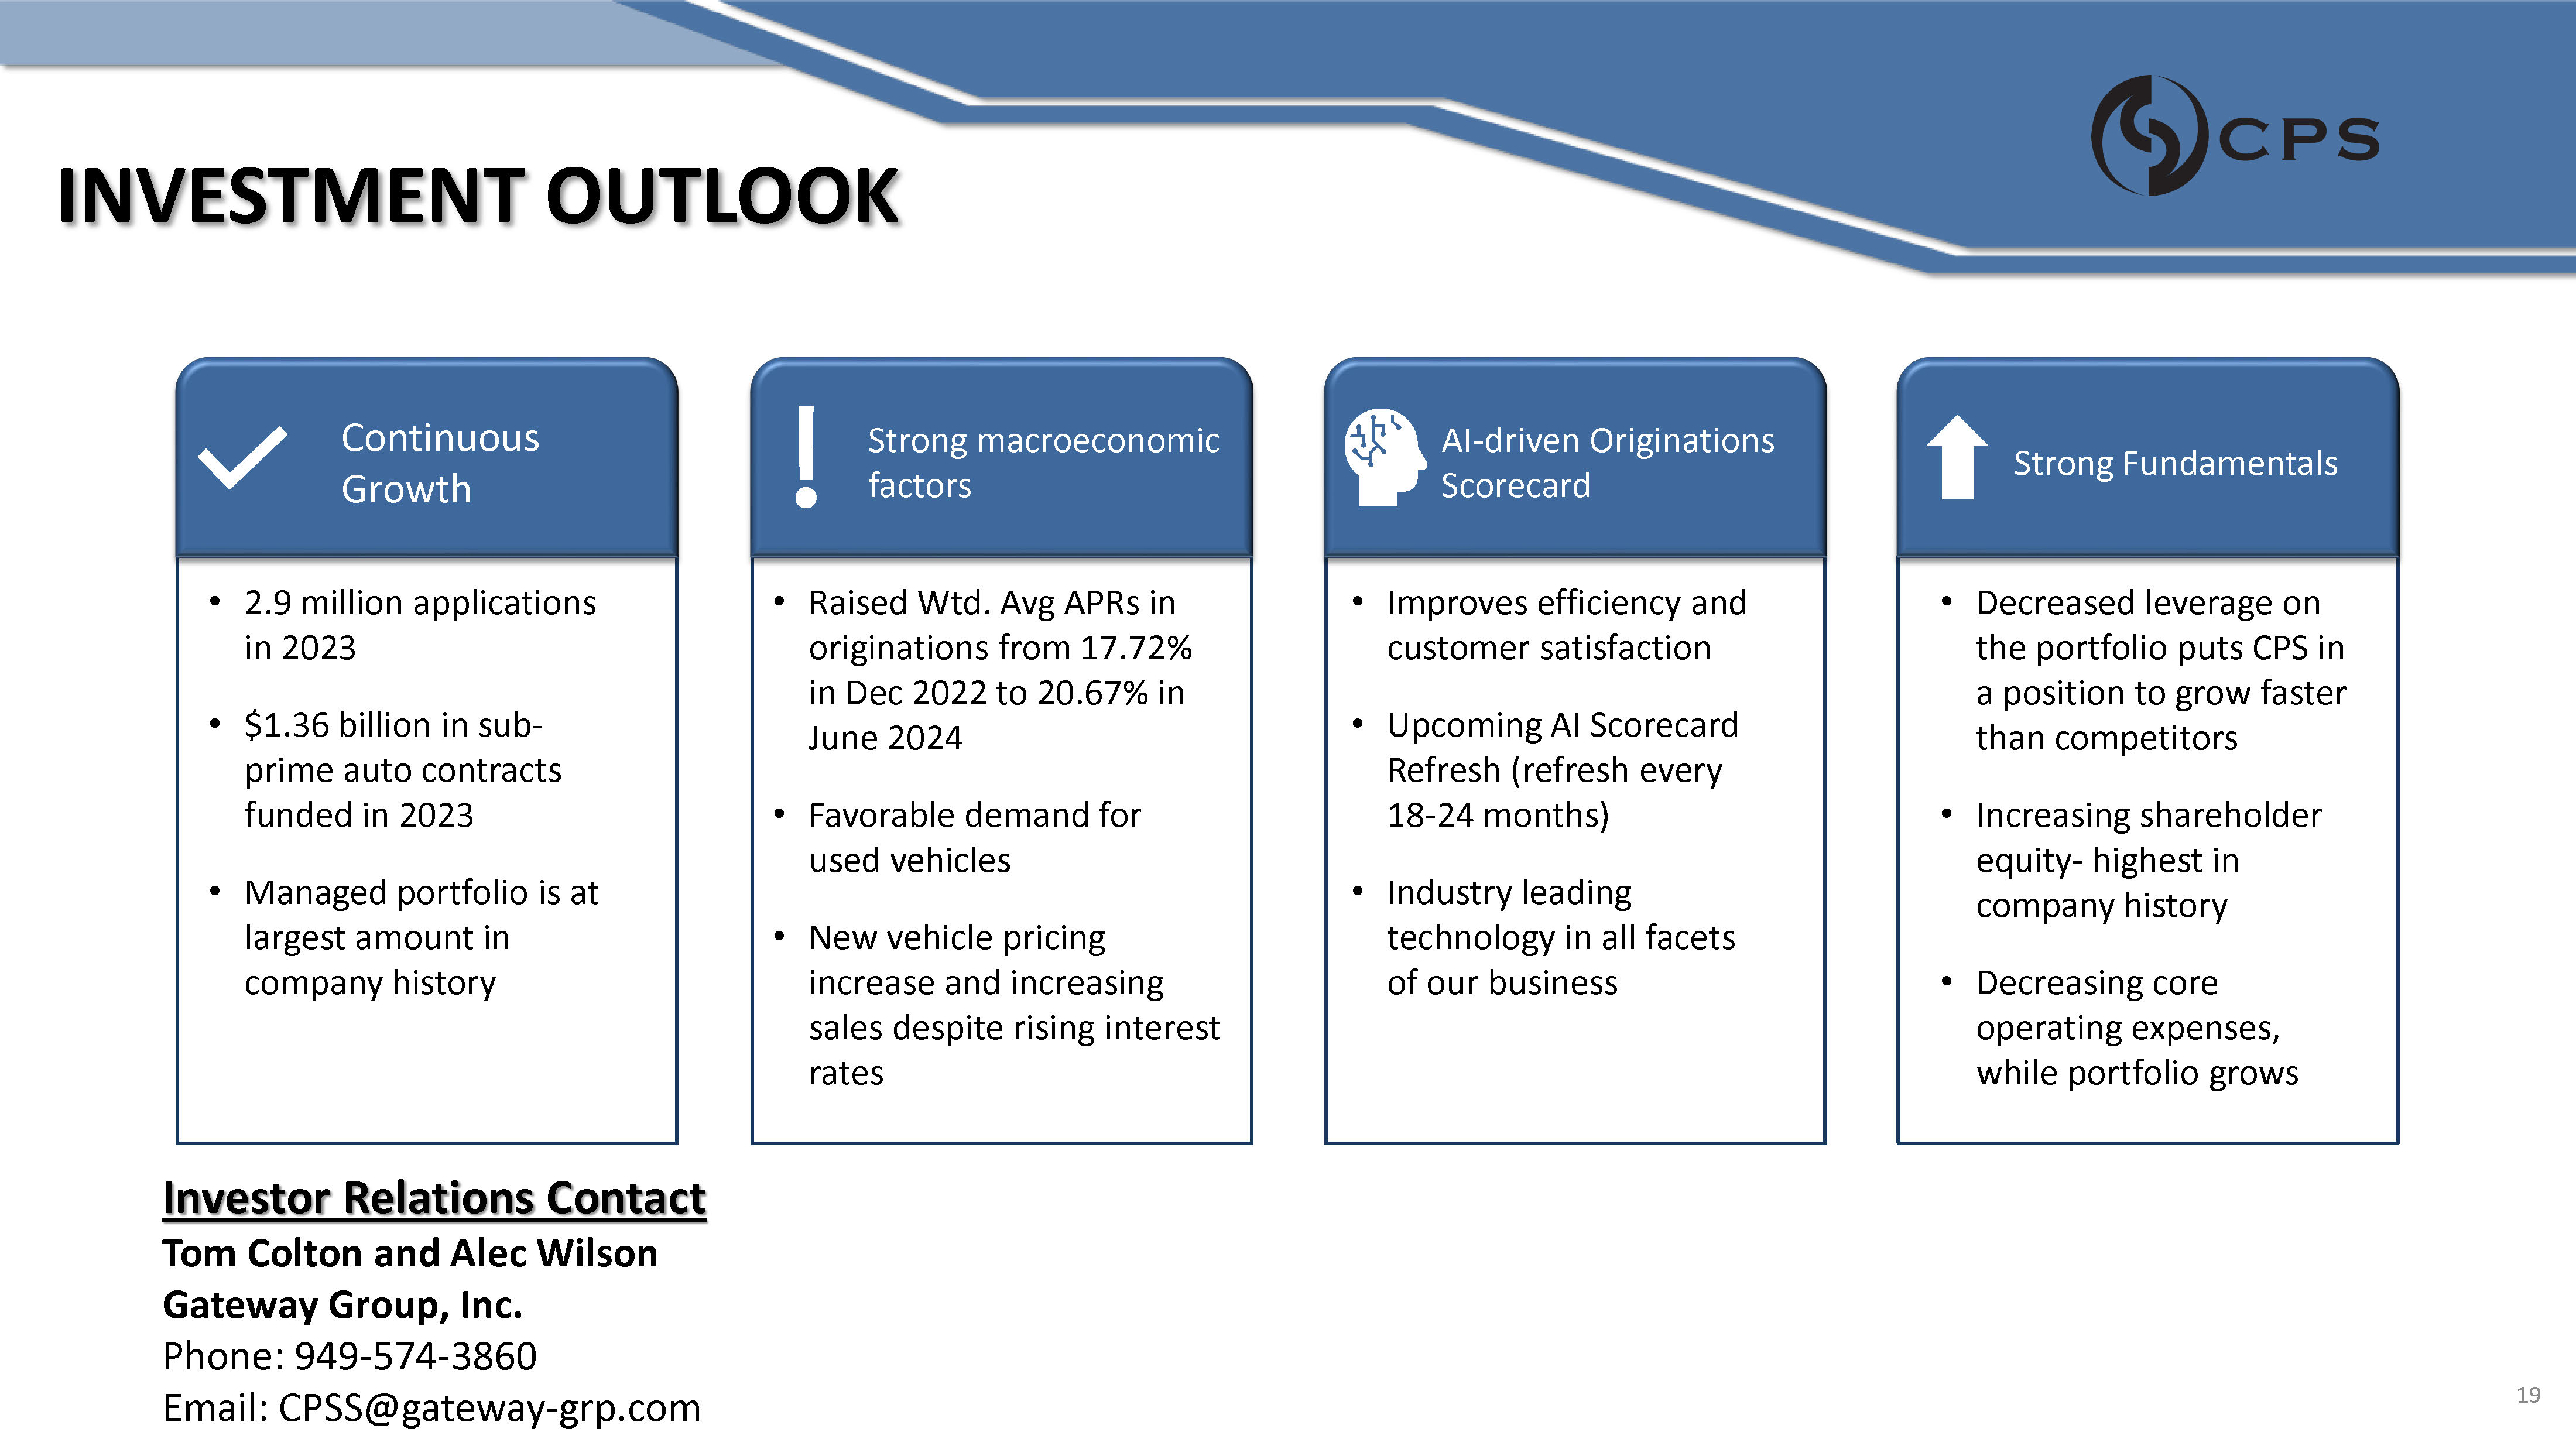
INVESTMENT OUTLOOK Continuous Growth Strong macroeconomic factors AI - driven Originations Scorecard Strong Fundamentals • 2.9 million applications in 2023 • $1.36 billion in sub - prime auto contracts funded in 2023 • Managed portfolio is at largest amount in company history • Raised Wtd. Avg APRs in originations from 17.72% in Dec 2022 to 20.67% in June 2024 • Favorable demand for used vehicles • New vehicle pricing increase and increasing sales despite rising interest rates • Improves efficiency and customer satisfaction • Upcoming AI Scorecard Refresh (refresh every 18 - 24 months) • Industry leading technology in all facets of our business • Decreased leverage on the portfolio puts CPS in a position to grow faster than competitors • Increasing shareholder equity - highest in company history • Decreasing core operating expenses, while portfolio grows Investor Relations Contact Tom Colton and Alec Wilson Gateway Group, Inc. Phone: 949 - 574 - 3860 Email: CPSS@gateway - grp.com 19
REFERENCE TO PUBLIC REPORTS Any person considering an investment in securities issued by CPS is urged to review the materials filed by CPS with the U.S. Securities and Exchange Commission ("Commission"). Such materials may be found by inquiring of the Commission‘s EDGAR search page www.sec.gov/edgar/searchedgar/companysearch.html using CPS's ticker symbol, which is "CPSS." Risk factors that should be considered are described in Item 1A, “Risk Factors," of CPS’s most recent annual report on Form 10 - K and subsequent reports on Form 10 - Q, which reports are on file with the Commission and available for review at the Commission's website. Such description of risk factors is incorporated herein by reference. 20
v3.24.2.u1
Cover
|
Aug. 09, 2024 |
| Cover [Abstract] |
|
| Document Type |
8-K
|
| Amendment Flag |
false
|
| Document Period End Date |
Aug. 09, 2024
|
| Entity File Number |
1-11416
|
| Entity Registrant Name |
CONSUMER PORTFOLIO SERVICES, INC.
|
| Entity Central Index Key |
0000889609
|
| Entity Tax Identification Number |
33-0459135
|
| Entity Incorporation, State or Country Code |
CA
|
| Entity Address, Address Line One |
3800 Howard Hughes Pkwy
|
| Entity Address, Address Line Two |
Suite 1400
|
| Entity Address, City or Town |
Las Vegas
|
| Entity Address, State or Province |
NV
|
| Entity Address, Postal Zip Code |
89169
|
| City Area Code |
949
|
| Local Phone Number |
753-6800
|
| Written Communications |
false
|
| Soliciting Material |
false
|
| Pre-commencement Tender Offer |
false
|
| Pre-commencement Issuer Tender Offer |
false
|
| Title of 12(b) Security |
Common Stock, no par value
|
| Trading Symbol |
CPSS
|
| Security Exchange Name |
NASDAQ
|
| Entity Emerging Growth Company |
false
|
| Entity Information, Former Legal or Registered Name |
Not Applicable
|
| X |
- DefinitionBoolean flag that is true when the XBRL content amends previously-filed or accepted submission.
| Name: |
dei_AmendmentFlag |
| Namespace Prefix: |
dei_ |
| Data Type: |
xbrli:booleanItemType |
| Balance Type: |
na |
| Period Type: |
duration |
|
| X |
- DefinitionFor the EDGAR submission types of Form 8-K: the date of the report, the date of the earliest event reported; for the EDGAR submission types of Form N-1A: the filing date; for all other submission types: the end of the reporting or transition period. The format of the date is YYYY-MM-DD.
| Name: |
dei_DocumentPeriodEndDate |
| Namespace Prefix: |
dei_ |
| Data Type: |
xbrli:dateItemType |
| Balance Type: |
na |
| Period Type: |
duration |
|
| X |
- DefinitionThe type of document being provided (such as 10-K, 10-Q, 485BPOS, etc). The document type is limited to the same value as the supporting SEC submission type, or the word 'Other'.
| Name: |
dei_DocumentType |
| Namespace Prefix: |
dei_ |
| Data Type: |
dei:submissionTypeItemType |
| Balance Type: |
na |
| Period Type: |
duration |
|
| X |
- DefinitionAddress Line 1 such as Attn, Building Name, Street Name
| Name: |
dei_EntityAddressAddressLine1 |
| Namespace Prefix: |
dei_ |
| Data Type: |
xbrli:normalizedStringItemType |
| Balance Type: |
na |
| Period Type: |
duration |
|
| X |
- DefinitionAddress Line 2 such as Street or Suite number
| Name: |
dei_EntityAddressAddressLine2 |
| Namespace Prefix: |
dei_ |
| Data Type: |
xbrli:normalizedStringItemType |
| Balance Type: |
na |
| Period Type: |
duration |
|
| X |
- Definition
+ References
+ Details
| Name: |
dei_EntityAddressCityOrTown |
| Namespace Prefix: |
dei_ |
| Data Type: |
xbrli:normalizedStringItemType |
| Balance Type: |
na |
| Period Type: |
duration |
|
| X |
- DefinitionCode for the postal or zip code
| Name: |
dei_EntityAddressPostalZipCode |
| Namespace Prefix: |
dei_ |
| Data Type: |
xbrli:normalizedStringItemType |
| Balance Type: |
na |
| Period Type: |
duration |
|
| X |
- DefinitionName of the state or province.
| Name: |
dei_EntityAddressStateOrProvince |
| Namespace Prefix: |
dei_ |
| Data Type: |
dei:stateOrProvinceItemType |
| Balance Type: |
na |
| Period Type: |
duration |
|
| X |
- DefinitionA unique 10-digit SEC-issued value to identify entities that have filed disclosures with the SEC. It is commonly abbreviated as CIK. Reference 1: http://www.xbrl.org/2003/role/presentationRef
-Publisher SEC
-Name Exchange Act
-Number 240
-Section 12
-Subsection b-2
| Name: |
dei_EntityCentralIndexKey |
| Namespace Prefix: |
dei_ |
| Data Type: |
dei:centralIndexKeyItemType |
| Balance Type: |
na |
| Period Type: |
duration |
|
| X |
- DefinitionIndicate if registrant meets the emerging growth company criteria. Reference 1: http://www.xbrl.org/2003/role/presentationRef
-Publisher SEC
-Name Exchange Act
-Number 240
-Section 12
-Subsection b-2
| Name: |
dei_EntityEmergingGrowthCompany |
| Namespace Prefix: |
dei_ |
| Data Type: |
xbrli:booleanItemType |
| Balance Type: |
na |
| Period Type: |
duration |
|
| X |
- DefinitionCommission file number. The field allows up to 17 characters. The prefix may contain 1-3 digits, the sequence number may contain 1-8 digits, the optional suffix may contain 1-4 characters, and the fields are separated with a hyphen.
| Name: |
dei_EntityFileNumber |
| Namespace Prefix: |
dei_ |
| Data Type: |
dei:fileNumberItemType |
| Balance Type: |
na |
| Period Type: |
duration |
|
| X |
- DefinitionTwo-character EDGAR code representing the state or country of incorporation.
| Name: |
dei_EntityIncorporationStateCountryCode |
| Namespace Prefix: |
dei_ |
| Data Type: |
dei:edgarStateCountryItemType |
| Balance Type: |
na |
| Period Type: |
duration |
|
| X |
- DefinitionThe exact name of the entity filing the report as specified in its charter, which is required by forms filed with the SEC. Reference 1: http://www.xbrl.org/2003/role/presentationRef
-Publisher SEC
-Name Exchange Act
-Number 240
-Section 12
-Subsection b-2
| Name: |
dei_EntityRegistrantName |
| Namespace Prefix: |
dei_ |
| Data Type: |
xbrli:normalizedStringItemType |
| Balance Type: |
na |
| Period Type: |
duration |
|
| X |
- DefinitionThe Tax Identification Number (TIN), also known as an Employer Identification Number (EIN), is a unique 9-digit value assigned by the IRS. Reference 1: http://www.xbrl.org/2003/role/presentationRef
-Publisher SEC
-Name Exchange Act
-Number 240
-Section 12
-Subsection b-2
| Name: |
dei_EntityTaxIdentificationNumber |
| Namespace Prefix: |
dei_ |
| Data Type: |
dei:employerIdItemType |
| Balance Type: |
na |
| Period Type: |
duration |
|
| X |
- DefinitionLocal phone number for entity.
| Name: |
dei_LocalPhoneNumber |
| Namespace Prefix: |
dei_ |
| Data Type: |
xbrli:normalizedStringItemType |
| Balance Type: |
na |
| Period Type: |
duration |
|
| X |
- DefinitionBoolean flag that is true when the Form 8-K filing is intended to satisfy the filing obligation of the registrant as pre-commencement communications pursuant to Rule 13e-4(c) under the Exchange Act. Reference 1: http://www.xbrl.org/2003/role/presentationRef
-Publisher SEC
-Name Exchange Act
-Number 240
-Section 13e
-Subsection 4c
| Name: |
dei_PreCommencementIssuerTenderOffer |
| Namespace Prefix: |
dei_ |
| Data Type: |
xbrli:booleanItemType |
| Balance Type: |
na |
| Period Type: |
duration |
|
| X |
- DefinitionBoolean flag that is true when the Form 8-K filing is intended to satisfy the filing obligation of the registrant as pre-commencement communications pursuant to Rule 14d-2(b) under the Exchange Act. Reference 1: http://www.xbrl.org/2003/role/presentationRef
-Publisher SEC
-Name Exchange Act
-Number 240
-Section 14d
-Subsection 2b
| Name: |
dei_PreCommencementTenderOffer |
| Namespace Prefix: |
dei_ |
| Data Type: |
xbrli:booleanItemType |
| Balance Type: |
na |
| Period Type: |
duration |
|
| X |
- DefinitionTitle of a 12(b) registered security. Reference 1: http://www.xbrl.org/2003/role/presentationRef
-Publisher SEC
-Name Exchange Act
-Number 240
-Section 12
-Subsection b
| Name: |
dei_Security12bTitle |
| Namespace Prefix: |
dei_ |
| Data Type: |
dei:securityTitleItemType |
| Balance Type: |
na |
| Period Type: |
duration |
|
| X |
- DefinitionName of the Exchange on which a security is registered. Reference 1: http://www.xbrl.org/2003/role/presentationRef
-Publisher SEC
-Name Exchange Act
-Number 240
-Section 12
-Subsection d1-1
| Name: |
dei_SecurityExchangeName |
| Namespace Prefix: |
dei_ |
| Data Type: |
dei:edgarExchangeCodeItemType |
| Balance Type: |
na |
| Period Type: |
duration |
|
| X |
- DefinitionBoolean flag that is true when the Form 8-K filing is intended to satisfy the filing obligation of the registrant as soliciting material pursuant to Rule 14a-12 under the Exchange Act. Reference 1: http://www.xbrl.org/2003/role/presentationRef
-Publisher SEC
-Name Exchange Act
-Number 240
-Section 14a
-Subsection 12
| Name: |
dei_SolicitingMaterial |
| Namespace Prefix: |
dei_ |
| Data Type: |
xbrli:booleanItemType |
| Balance Type: |
na |
| Period Type: |
duration |
|
| X |
- DefinitionTrading symbol of an instrument as listed on an exchange.
| Name: |
dei_TradingSymbol |
| Namespace Prefix: |
dei_ |
| Data Type: |
dei:tradingSymbolItemType |
| Balance Type: |
na |
| Period Type: |
duration |
|
| X |
- DefinitionBoolean flag that is true when the Form 8-K filing is intended to satisfy the filing obligation of the registrant as written communications pursuant to Rule 425 under the Securities Act. Reference 1: http://www.xbrl.org/2003/role/presentationRef
-Publisher SEC
-Name Securities Act
-Number 230
-Section 425
| Name: |
dei_WrittenCommunications |
| Namespace Prefix: |
dei_ |
| Data Type: |
xbrli:booleanItemType |
| Balance Type: |
na |
| Period Type: |
duration |
|
Consumer Portfolio Servi... (NASDAQ:CPSS)
Gráfica de Acción Histórica
De Jul 2024 a Ago 2024

Consumer Portfolio Servi... (NASDAQ:CPSS)
Gráfica de Acción Histórica
De Ago 2023 a Ago 2024
