UNITED STATES
SECURITIES AND EXCHANGE COMMISSION
Washington, D.C. 20549
FORM 6-K
REPORT OF FOREIGN
PRIVATE ISSUER PURSUANT TO RULE 13a-16 OR 15d-16 UNDER THE SECURITIES EXCHANGE ACT OF 1934
For the month of August 2023
Commission File
Number: 001-39938
Vinci Partners Investments Ltd.
(Exact name of registrant as specified in its
charter)
Av. Bartolomeu Mitre, 336
Leblon – Rio de Janeiro
Brazil 22431-002
+55 (21) 2159-6240
(Address of principal executive office)
Indicate by check mark whether the registrant files
or will file annual reports under cover of Form 20-F or Form 40-F:
Indicate by check mark if the registrant is submitting
the Form 6-K in paper as permitted by Regulation S-T Rule 101(b)(1):
Indicate by check mark if the registrant is submitting
the Form 6-K in paper as permitted by Regulation S-T Rule 101(b)(7):
TABLE OF CONTENTS
SIGNATURE
Pursuant to the requirements of the Securities
Exchange Act of 1934, the registrant has duly caused this report to be signed on its behalf by the undersigned, thereunto duly authorized.
| |
Vinci Partners Investments Ltd. |
| |
|
| |
|
| |
By: |
/s/ Sergio Passos Ribeiro |
| |
|
Name: |
Sergio Passos Ribeiro |
| |
|
Title: |
Chief Financial Officer |
Date: August 15, 2023
Exhibit 99.1
Investor Presentation August 2023

Disclaimer This presentation contains forward - looking statements that can be identified by the use of words such as “anticipate,” “believe,” “could,” “expect,” “should,” “plan,” “intend,” “estimate” and “potential,” among others . By their nature, forward - looking statements are necessarily subject to a high degree of uncertainty and involve known and unknown risks, uncertainties, assumptions and other factors because they relate to events and depend on circumstances that will occur in the future whether or not outside of our control . Such factors may cause actual results, performance or developments to differ materially from those expressed or implied by such forward - looking statements and there can be no assurance that such forward - looking statements will prove to be correct . Accordingly, you should not place undue reliance on forward - looking statements . The forward - looking statements included herein speak only as at the date of this presentation and we do not undertake any obligation to update these forward - looking statements . Past performance does not guarantee or predict future performance . Moreover, neither we nor our affiliates, officers, employees and agents undertake any obligation to review, update or confirm expectations or estimates or to release any revisions to any forward - looking statements to reflect events that occur or circumstances that arise in relation to the content of the presentation . Further information on these and other factors that could affect our financial results is included in filings we have made and will make with the U . S . Securities and Exchange Commission (the “SEC”) from time to time, including in the section titled “Risk Factors” in our latest fillings with the SEC . These documents are available on the SEC Filings section of the investor relations section of our website at : https : //ir . vincipartners . com/financials/sec - filings . We have prepared this presentation solely for informational purposes . The information in this presentation does not constitute or form part of, and should not be construed as, an offer or invitation to subscribe for, underwrite or otherwise acquire, any of our securities or securities of our subsidiaries or affiliates, not should it or any part of it form the basis of, or be relied on, in connection with any contract to purchase or subscribe for any of our securities or securities of any of our subsidiaries or affiliates, nor shall it or any part of it form the basis of, or be relied on, in connection with any contract or commitment whatsoever . This presentation also includes certain non - GAAP financial information . We believe that such information is meaningful and useful in understanding the activities and business metrics of our operations . We also believe that these non - GAAP financial measures reflect an additional way of viewing aspects of our business that, when viewed with our International Financial Reporting Standards (“IFRS”) results, as issued by the International Accounting Standards Board, provide a more complete understanding of factors and trends affecting our business . Further, investors regularly rely on non - GAAP financial measures to assess operating performance and such measures may highlight trends in our business that may not otherwise be apparent when relying on financial measures calculated in accordance with IFRS . We also believe that certain non - GAAP financial measures are frequently used by securities analysts, investors and other interested parties in the evaluation of public companies in our industry, many of which present these measures when reporting their results . The non - GAAP financial information is presented for informational purposes and to enhance understanding of the IFRS financial statements . The non - GAAP measures should be considered in addition to results prepared in accordance with IFRS, but not as a substitute for, or superior to, IFRS results . As other companies may determine or calculate this non - GAAP financial information differently, the usefulness of these measures for comparative purposes is limited . A reconciliation of such non - GAAP financial measures to the nearest GAAP measure is included in this presentation . 2

Business Overview
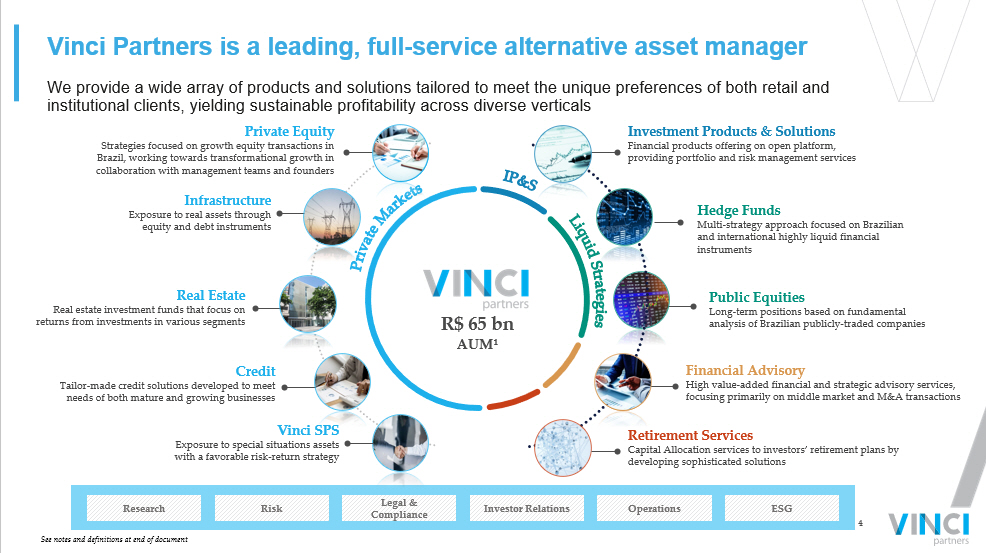
4 Investment Products & Solutions Financial products offering on open platform, providing portfolio and risk management services Vinci Partners is a leading, full - service alternative asset manager We provide a wide array of products and solutions tailored to meet the unique preferences of both retail and institutional clients, yielding sustainable profitability across diverse verticals Research Risk Legal & Compliance Investor Relations Operations ESG Public Equities Long - term positions based on fundamental analysis of Brazilian publicly - traded companies Financial Advisory High value - added financial and strategic advisory services, focusing primarily on middle market and M&A transactions Credit Tailor - made credit solutions developed to meet needs of both mature and growing businesses Infrastructure Exposure to real assets through equity and debt instruments Private Equity Strategies focused on growth equity transactions in Brazil, working towards transformational growth in collaboration with management teams and founders Real Estate Real estate investment funds that focus on returns from investments in various segments Hedge Funds Multi - strategy approach focused on Brazilian and international highly liquid financial instruments Vinci SPS Exposure to special situations assets with a f avorable risk - return strategy Retirement Services Capital Allocation services to investors’ retirement plans by developing sophisticated solutions R$ 65 bn AUM¹ See notes and definitions at end of document
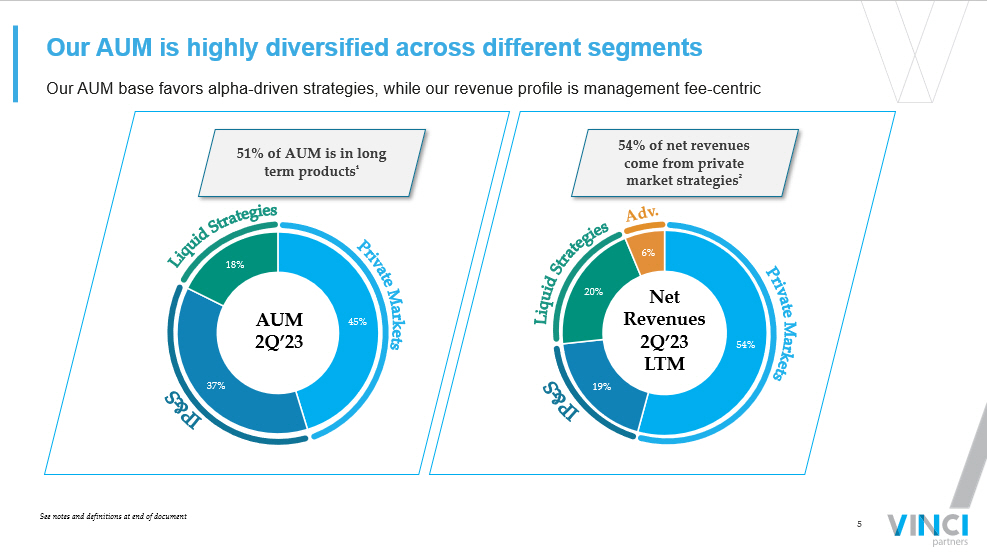
5 Our AUM is highly diversified across different segments Our AUM base favors alpha - driven strategies, while our revenue profile is management fee - centric See notes and definitions at end of document 54 % of net revenues come from private market strategies ² 51 % of AUM is in long term products ¹ Net Revenues 2Q’23 LTM AUM 2Q’23 45% 37% 18% 54% 19% 20% 6%
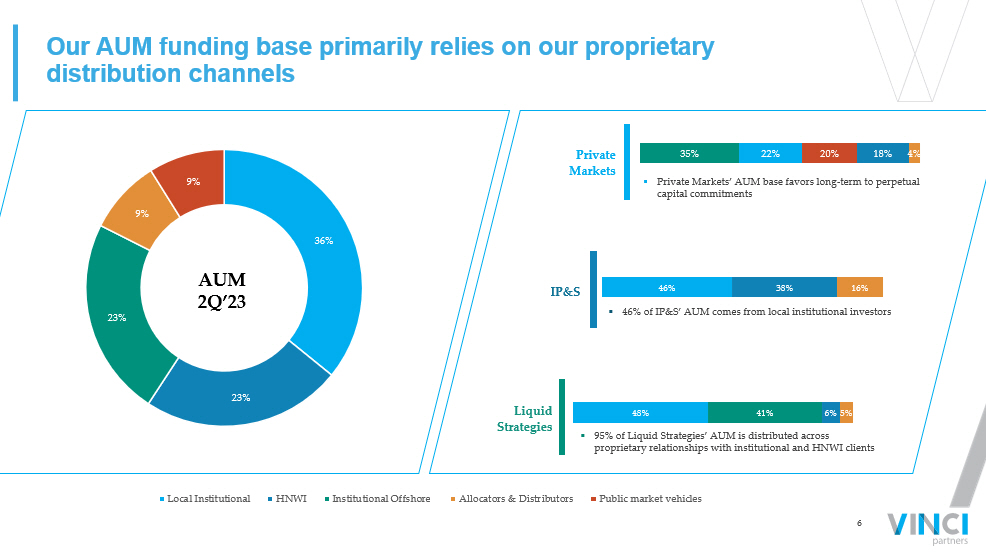
6 48% 41% 6% 5% 46% 38% 16% 35% 22% 20% 18% 4% 36% 23% 23% 9% 9% Local Institutional HNWI Institutional Offshore Allocators & Distributors Public market vehicles Liquid . Strategies . ▪ 95% of Liquid Strategies’ AUM is distributed across proprietary relationships with institutional and HNWI clients Our AUM funding base primarily relies on our proprietary distribution channels Private . Markets . ▪ Private Markets’ AUM base favors long - term to perpetual capital commitments IP&S . ▪ 46% of IP&S’ AUM comes from local institutional investors AUM 2Q’23
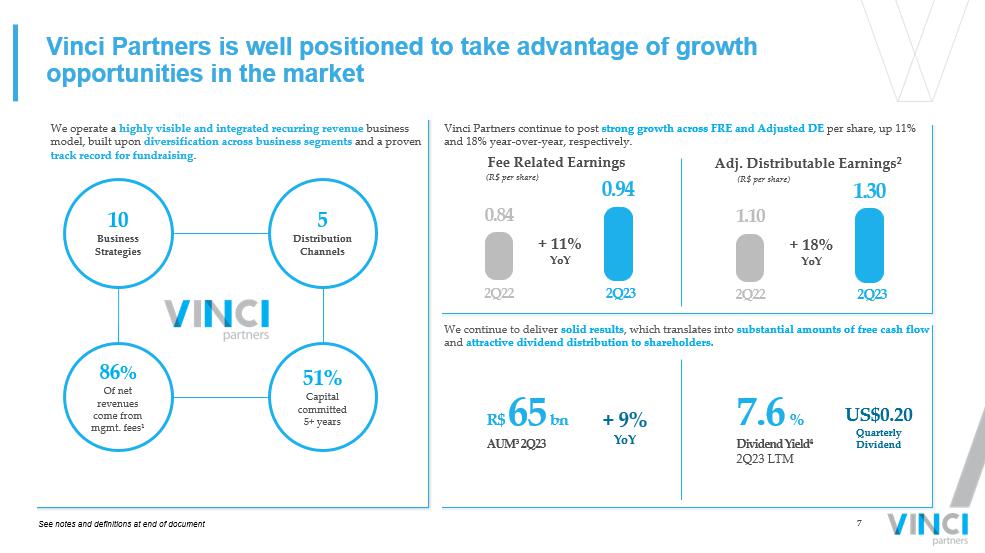
7 Vinci Partners is well positioned to take advantage of growth opportunities in the market See notes and definitions at end of document 10 Business Strategies 86 % Of net revenues come from mgmt. fees¹ We operate a highly visible and integrated recurring revenue business model, built upon diversification across business segments and a proven track record for fundraising . 51% Capital committed 5+ years Vinci Partners continue to post strong growth across FRE and Adjusted DE per share, up 11% and 18% year - over - year, respectively. 5 Distribution Channels + 11 % YoY Fee Related Earnings 7.6 % Dividend Yield 4 2Q23 LTM R$ 65 bn AUM 3 2Q23 (R$ per share) 2Q22 2Q23 0.84 0.94 + 18 % YoY Adj. Distributable Earnings 2 (R$ per share) 2Q22 2Q23 1.10 1.30 We continue to deliver solid results , which translates into substantial amounts of free cash flow and attractive dividend distribution to shareholders. + 9 % YoY US$0.20 Quarterly Dividend
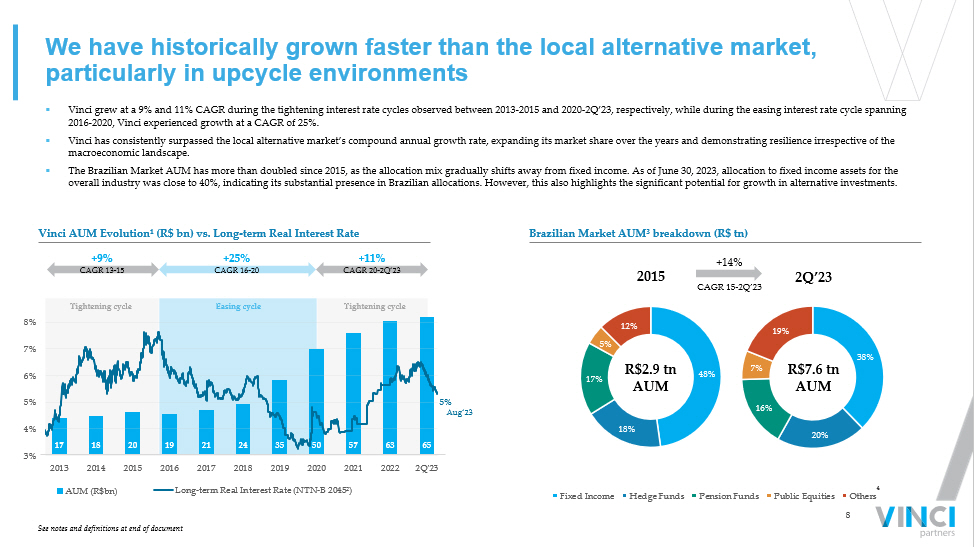
8 17 18 20 19 21 24 35 50 57 63 65 2013 2014 2015 2016 2017 2018 2019 2020 2021 2022 2Q'23 AUM (R$bn) 5% 3% 4% 5% 6% 7% 8% Long-term Real Interest Rate (NTN-B 2045²) 48% 18% 17% 5% 12% 2015 Fixed Income Hedge Funds Pension Funds Public Equities Others 38% 20% 16% 7% 19% 2Q’23 ▪ Vinci grew at a 9% and 11% CAGR during the tightening interest rate cycles observed between 2013 - 2015 and 2020 - 2Q’23, respective ly, while during the easing interest rate cycle spanning 2016 - 2020, Vinci experienced growth at a CAGR of 25%. ▪ Vinci has consistently surpassed the local alternative market’s compound annual growth rate, expanding its market share over the years and demonstrating resilience irrespective of the macroeconomic landscape. ▪ The Brazilian Market AUM has more than doubled since 2015, as the allocation mix gradually shifts away from fixed income. As of June 30, 2023, allocation to fixed income assets for the overall industry was close to 40%, indicating its substantial presence in Brazilian allocations. However, this also highlight s t he significant potential for growth in alternative investments. We have historically grown faster than the local alternative market, particularly in upcycle environments Vinci AUM Evolution¹ (R$ bn) vs. Long - term Real Interest Rate Brazilian Market AUM³ breakdown (R$ tn ) R$2.9 tn AUM R$7.6 tn AUM +14% CAGR 15 - 2Q’23 +9% CA GR 13 - 15 +25% CAGR 16 - 20 Aug’23 See notes and definitions at end of document Tightening cycle Tightening cycle Easing cycle 4 +11% CAGR 20 - 2Q’23
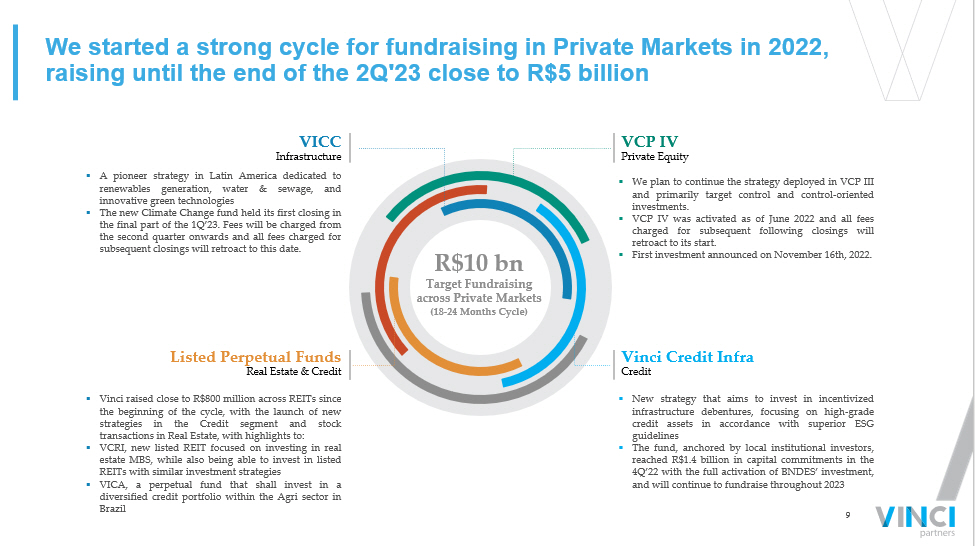
9 We started a strong cycle for fundraising in Private Markets in 2022, raising until the end of the 2Q'23 close to R$5 billion R$10 bn Target Fundraising across Private Markets (18 - 24 Months Cycle) VCP IV Private Equity Vinci Credit Infra Credit VICC Infrastructure Listed Perpetual Funds Real Estate & Credit ▪ We plan to continue the strategy deployed in VCP III and primarily target control and control - oriented investments . ▪ VCP IV was activated as of June 2022 and all fees charged for subsequent following closings will retroact to its start . ▪ First investment announced on November 16 th, 2022 . ▪ A pioneer strategy in Latin America dedicated to renewables generation, water & sewage, and innovative green technologies ▪ The new Climate Change fund held its first closing in the final part of the 1 Q’ 23 . Fees will be charged from the second quarter onwards and all fees charged for subsequent closings will retroact to this date . ▪ New strategy that aims to invest in incentivized infrastructure debentures, focusing on high - grade credit assets in accordance with superior ESG guidelines ▪ The fund, anchored by local institutional investors, reached R $ 1 . 4 billion in capital commitments in the 4 Q’ 22 with the full activation of BNDES’ investment, and will continue to fundraise throughout 2023 ▪ Vinci raised close to R $ 800 million across REITs since the beginning of the cycle, with the launch of new strategies in the Credit segment and stock transactions in Real Estate, with highlights to : ▪ VCRI, new listed REIT focused on investing in real estate MBS, while also being able to invest in listed REITs with similar investment strategies ▪ VICA, a perpetual fund that shall invest in a diversified credit portfolio within the Agri sector in Brazil
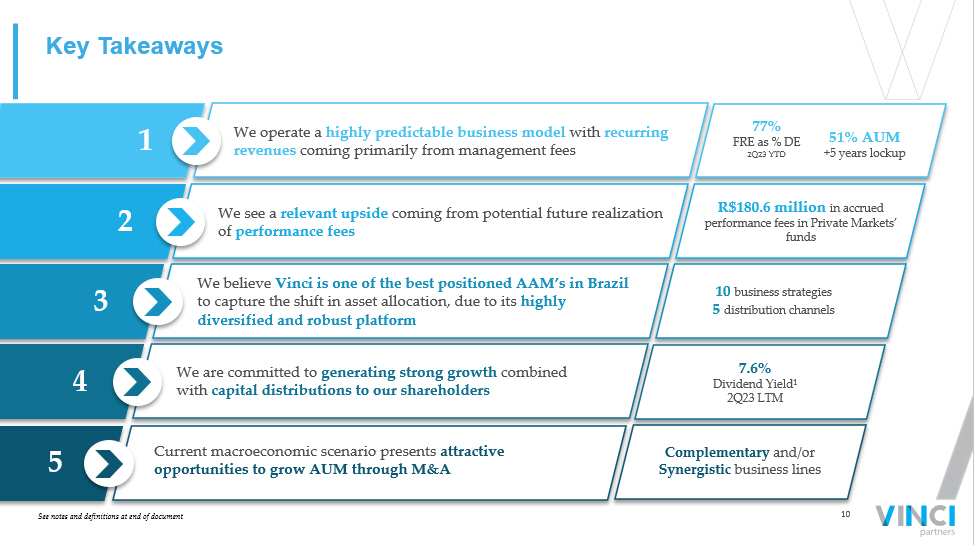
10 Key Takeaways See notes and definitions at end of document 77 % FRE as % DE 2 Q23 YTD We operate a highly predictable business model with recurring revenues coming primarily from management fees 1 We see a relevant upside coming from potential future realization of performance fees R$180.6 m illion in accrued performance fees in Private Markets’ funds 2 Current macroeconomic scenario presents attractive opportunities to grow AUM through M&A 5 3 We believe Vinci is one of the best positioned AAM’s in Brazil to capture the shift in asset allocation, due to its highly diversified and robust platform 10 business strategies 5 distribution channels 4 We are committed to generating strong growth combined with capital distributions to our shareholders 7.6 % Dividend Yield¹ 2Q23 LTM 51% AUM +5 years lockup Complementary and/or Synergistic business lines

Financial Highlights
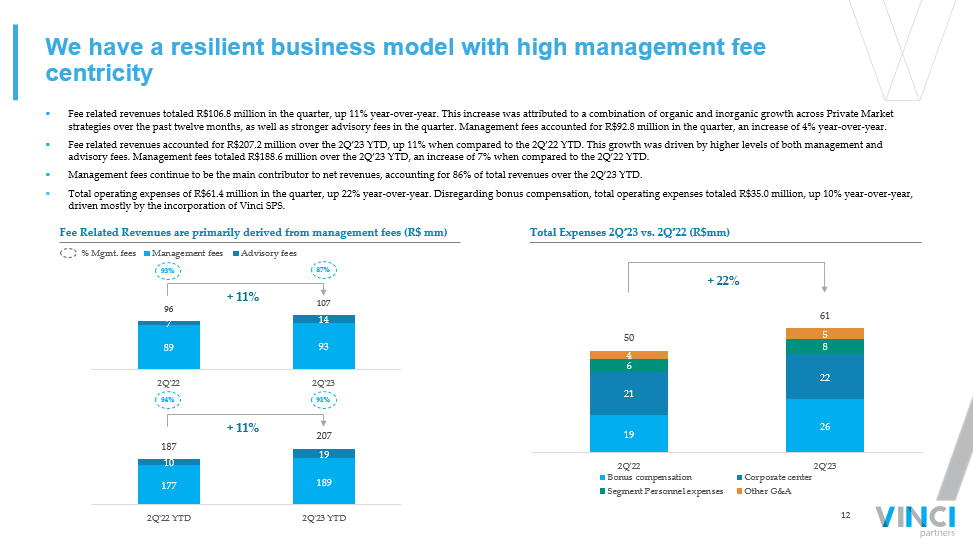
12 19 26 21 22 6 8 4 5 50 61 2Q'22 2Q'23 Bonus compensation Corporate center Segment Personnel expenses Other G&A 177 189 10 19 187 207 2Q'22 YTD 2Q'23 YTD 89 93 7 14 96 107 2Q'22 2Q'23 Management fees Advisory fees + 22% We have a resilient business model with high management fee centricity Fee Related Revenues are primarily derived from management fees (R$ mm) % Mgmt. fees ▪ Fee related revenues totaled R$106.8 million in the quarter, up 11% year - over - year. This increase was attributed to a combinatio n of organic and inorganic growth across Private Market strategies over the past twelve months, as well as stronger advisory fees in the quarter. Management fees accounted for R$92. 8 m illion in the quarter, an increase of 4% year - over - year. ▪ Fee related revenues accounted for R$207.2 million over the 2Q’23 YTD, up 11% when compared to the 2Q’22 YTD. This growth was dr iven by higher levels of both management and advisory fees. Management fees totaled R$188.6 million over the 2Q’23 YTD, an increase of 7% when compared to the 2Q’22 YTD. ▪ Management fees continue to be the main contributor to net revenues, accounting for 86% of total revenues over the 2Q’23 YTD. ▪ Total operating expenses of R$61.4 million in the quarter, up 22% year - over - year. Disregarding bonus compensation, total operati ng expenses totaled R$35.0 million, up 10% year - over - year, driven mostly by the incorporation of Vinci SPS. 93% 87% 91 % 94 % Total Expenses 2Q’23 vs. 2Q ’ 22 ( R$mm ) + 11% + 11%

13 91% 9% Private Equity Infrastructure Vinci holds a strong position for future realization of performance fees in private market funds… ▪ Performance fee receivable of R$180.6 million in the 2Q’23, up 16% quarter - over - quarter. ▪ The VCP strategy¹ in Private Equity accounted for R$161.4 million in accrued performance fees, or 89% of total performance fe es. ▪ Vinci Partners had, as of 2Q’23, R$12 billion in performance eligible AUM coming from Private Markets’ funds still within inv est ment period. ▪ Accrued performance fees coming from the Infrastructure strategy are the only fees booked as unrealized in the company's bala nce sheet as of the second quarter of 2023, following IFRS 15 rules. The outstanding accrued performance fees balance reflects the funds' most recent mark and are not booked in the company's bal anc e sheet yet. R$180.6 mm Accrued Performance Fees (R$ mm) Accrued Performance Fees by Strategy (%) Vinci Partners recognizes the performance revenue according to IFRS 15 . Unrealized performance fees are recognized only when is highly probable that the revenue will not be reversed in the Income Statement . The fund FIP Infra Transmissão in Infrastructure had R $ 15 . 5 million as of the end of the second quarter of 2023 booked as unrealized performance fees in the company ´ s balance sheet . Accrued performance fees shown for Private Equity funds of R $ 163 . 7 million and for the Infrastructure fund VIAS, of R $ 1 . 4 million, as of the end of the second quarter of 2023 have not been booked as unrealized performance fees in the company ´ s balance sheet . See notes and definitions at end of document
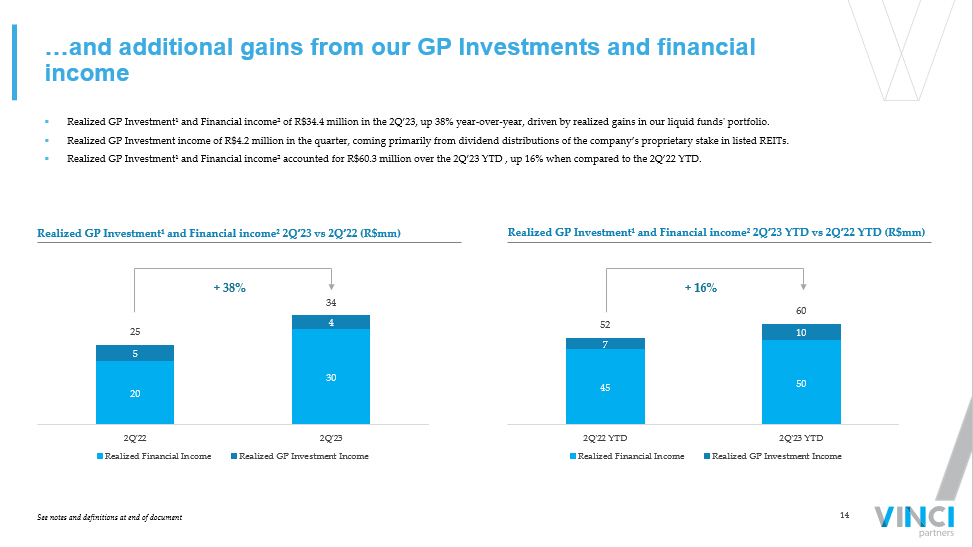
14 45 50 7 10 52 60 2Q'22 YTD 2Q'23 YTD Realized Financial Income Realized GP Investment Income 20 30 5 4 25 34 2Q'22 2Q'23 Realized Financial Income Realized GP Investment Income …and additional gains from our GP Investments and financial income ▪ Realized GP Investment¹ and Financial income² of R$34.4 million in the 2Q’23, up 38% year - over - year, driven by realized gains in our liquid funds' portfolio. ▪ Realized GP Investment income of R$4.2 million in the quarter, coming primarily from dividend distributions of the company’s pro prietary stake in listed REITs. ▪ Realized GP Investment¹ and Financial income² accounted for R$60.3 million over the 2Q’23 YTD , up 16% when compared to the 2 Q’2 2 YTD. See notes and definitions at end of document Realized GP Investment¹ and Financial income² 2Q’23 vs 2Q’22 ( R$mm ) + 16% Realized GP Investment¹ and Financial income² 2Q’23 YTD vs 2Q’22 YTD ( R$mm ) + 38%
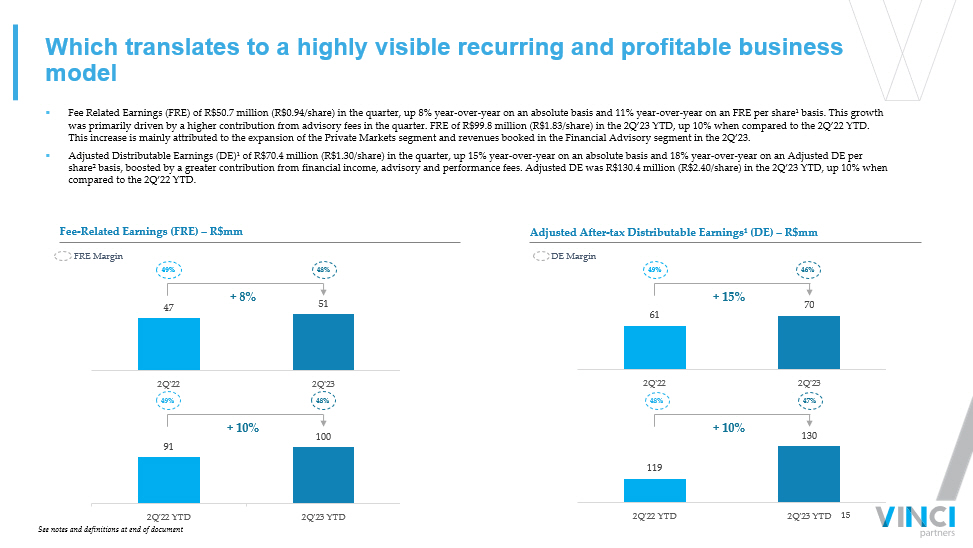
15 119 130 2Q'22 YTD 2Q'23 YTD 91 100 2Q'22 YTD 2Q'23 YTD Which translates to a highly visible recurring and profitable business model See notes and definitions at end of document DE Margin ▪ Fee Related Earnings (FRE) of R$50.7 million (R$0.94/share) in the quarter, up 8% year - over - year on an absolute basis and 11% ye ar - over - year on an FRE per share¹ basis. This growth was primarily driven by a higher contribution from advisory fees in the quarter. FRE of R$99.8 million (R$1.83/share) in the 2Q’ 23 YTD, up 10% when compared to the 2Q’22 YTD. This increase is mainly attributed to the expansion of the Private Markets segment and revenues booked in the Financial Advis ory segment in the 2Q’23. ▪ Adjusted Distributable Earnings (DE)¹ of R$70.4 million (R$1.30/share) in the quarter, up 15% year - over - year on an absolute basi s and 18% year - over - year on an Adjusted DE per share² basis, boosted by a greater contribution from financial income, advisory and performance fees. Adjusted DE was R$130.4 mi llion (R$2.40/share) in the 2Q’23 YTD, up 10% when compared to the 2Q’22 YTD. Fee - Related Earnings (FRE) – R$mm Adjusted After - tax Distributable Earnings¹ (DE) – R$mm FRE Margin 49% 46 % 48 % 47% 47 51 2Q'22 2Q'23 + 8% + 10% 49% 48 % 49% 48% 61 70 2Q'22 2Q'23 + 15% + 10%
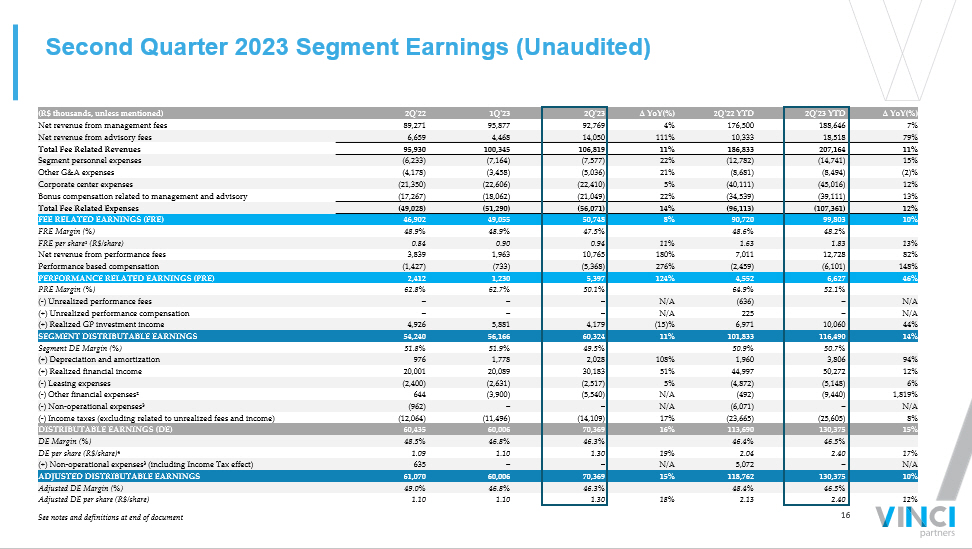
16 (R$ thousands, unless mentioned) 2Q'22 1Q'23 2Q'23 ∆ YoY(%) 2Q'22 YTD 2Q'23 YTD ∆ YoY(%) Net revenue from management fees 89,271 95,877 92,769 4% 176,500 188,646 7% Net revenue from advisory fees 6,659 4,468 14,050 111% 10,333 18,518 79% Total Fee Related Revenues 95,930 100,345 106,819 11% 186,833 207,164 11% Segment personnel expenses (6,233) (7,164) (7,577) 22% (12,782) (14,741) 15% Other G&A expenses (4,178) (3,458) (5,036) 21% (8,681) (8,494) (2)% Corporate center expenses (21,350) (22,606) (22,410) 5% (40,111) (45,016) 12% Bonus compensation related to management and advisory (17,267) (18,062) (21,049) 22% (34,539) (39,111) 13% Total Fee Related Expenses (49,028) (51,290) (56,071) 14% (96,113) (107,361) 12% FEE RELATED EARNINGS (FRE) 46,902 49,055 50,748 8% 90,720 99,803 10% FRE Margin (%) 48.9% 48.9% 47.5% 48.6% 48.2% FRE per share¹ (R$/share) 0.84 0.90 0.94 11% 1.63 1.83 13% Net revenue from performance fees 3,839 1,963 10,765 180% 7,011 12,728 82% Performance based compensation (1,427) (733) (5,368) 276% (2,459) (6,101) 148% PERFORMANCE RELATED EARNINGS (PRE) 2,412 1,230 5,397 124% 4,552 6,627 46% PRE Margin (%) 62.8% 62.7% 50.1% 64.9% 52.1% ( - ) Unrealized performance fees – – – N/A (636) – N/A (+) Unrealized performance compensation – – – N/A 225 – N/A (+) Realized GP investment income 4,926 5,881 4,179 (15)% 6,971 10,060 44% SEGMENT DISTRIBUTABLE EARNINGS 54,240 56,166 60,324 11% 101,833 116,490 14% Segment DE Margin (%) 51.8% 51.9% 49.5% 50.9% 50.7% (+) Depreciation and amortization 976 1,778 2,028 108% 1,960 3,806 94% (+) Realized financial income 20,001 20,089 30,183 51% 44,997 50,272 12% ( - ) Leasing expenses (2,400) (2,631) (2,517) 5% (4,872) (5,148) 6% ( - ) Other financial expenses² 644 (3,900) (5,540) N/A (492) (9,440) 1,819% ( - ) Non - operational expenses³ (962) – – N/A (6,071) – N/A ( - ) Income taxes (excluding related to unrealized fees and income) (12,064) (11,496) (14,109) 17% (23,665) (25,605) 8% DISTRIBUTABLE EARNINGS (DE) 60,435 60,006 70,369 16% 113,690 130,375 15% DE Margin (%) 48.5% 46.8% 46.3% 46.4% 46.5% DE per share (R$/share) 4 1.09 1.10 1.30 19% 2.04 2.40 17% (+) Non - operational expenses³ (including Income Tax effect) 635 – – N/A 5,072 – N/A ADJUSTED DISTRIBUTABLE EARNINGS 61,070 60,006 70,369 15% 118,762 130,375 10% Adjusted DE Margin (%) 49.0% 46.8% 46.3% 48.4% 46.5% Adjusted DE per share (R$/share) 1.10 1.10 1.30 18% 2.13 2.40 12% Second Quarter 2023 Segment Earnings (Unaudited) See notes and definitions at end of document

Appendix – I Business Overview

18 2 6 11 15 17 18 20 19 21 24 35 48 54 60 61 50 57 63 65 0 10 20 30 40 50 60 70 2009 2010 2011 2012 2013 2014 2015 2016 2017 2018 2019 2020 2021 2022 2Q'23 AUM (R$bn) AUM DC¹ (R$bn) Brazil Interest Rates We have scaled our platform significantly since our inception in 2009… See notes and definitions at end of document 2011 - 2013 Inception of Vinci Infrastructure & International strategy PE: Fundraising VCP II (R$2.2bn) Company becomes a signatory to PRI Real Estate, Credit, and Receivables strategy 2009 Establishment of Vinci Partners 2010 Public Equities: Association with “Gas” (Equities) 2014 - 2016 Vinci begins heavily investing in governance to set a growth platform for the exit of the recessionary market Credit: Fundraising of Vinci Credito Imobiliario I (VCI I) 2017 - 2019 Public Equities : Acquisition of Mosaico Capital Real Estate: IPO VISC, IPO VILG and VINO and follow ons VISC & VILG PE: Launch of VIR strategy and fundraising of VCP III Infra: Fundraising Vinci Infra II and IPO VIGT Credit : FIDC Energia Sustentavel funded by BNDES and fundraising of VCI II 2021 Vinci ´ s IPO at Nasdaq Private Equity: Final Closing of VIR IV Real Estate and Infra: Fundraising of VFDL and VIAS Follow Ons for VILG, VIGT and VISC IPO of VIUR 2020 Private Equity: First closing of VIR IV Real Estate: IPO of VIFI Follow o ns for VILG, VISC and VINO Public Equities: Dissociation with “Gas Investimentos” 2.0% 4.5% 6.5% 7.0% 13.8% 14.3% 11.8% 10.0% 7.3% 11.0% 10.8% 8.8% 2022 Acquisition of SPS Capital Activation of BNDES’ anchor investment across Vinci Credit Infra ( Credit ) and VICC ( Infra ) Private Equity: Start of fundraising for VCP IV Real Estate and Credit: First public offer for VICA Launch of Vinci Credit Infra with an anchor institutional investment 9.3% 13.8% Vinci Partners was founded in October 2009 by a group of seasoned and respected managers in the financial market 2023 Infra: First closing of VICC VRS: Product was officially launched 13.8%
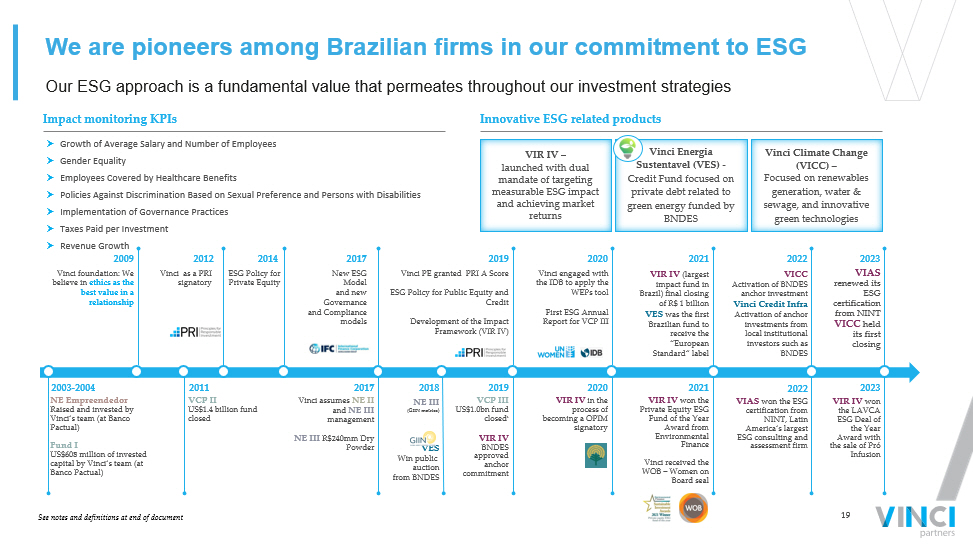
19 We are pioneers among Brazilian firms in our commitment to ESG Our ESG approach is a fundamental value that permeates throughout our investment strategies Vinci Energia Sustentavel (VES) - Credit Fund focused on private debt related to green energy funded by BNDES VIR IV – launched with dual mandate of targeting measurable ESG impact and achieving market returns Impact monitoring KPIs Innovative ESG related products Growth of Average Salary and Number of Employees Gender Equality Employees Covered by Healthcare Benefits Policies Against Discrimination Based on Sexual Preference and Persons with Disabilities Implementation of Governance Practices Taxes Paid per Investment Revenue Growth Vinci foundation: We believe in ethics as the best value in a relationship 2009 2011 New ESG Model and new Governance and Compliance models 2017 ESG Policy for Private Equity 2014 NE III ( GIIN metrics) VES Win public auction from BNDES 2018 Vinci PE granted PRI A Score ESG Policy for Public Equity and Credit Development of the Impact Framework (VIR IV) 2019 NE Empreendedor Raised and invested by Vinci’s team (at Banco Pactual) Fund I US$608 million of invested capital by Vinci’s team (at Banco Pactual) 2003 - 2004 Vinci as a PRI signatory 2012 VCP II US$1.4 billion fund closed 2017 Vinci assumes NE II and NE III management NE III R$240mm Dry Powder 2019 VCP III US$1.0bn fund closed ¹ VIR IV BNDES approved anchor commitment Vinci engaged with the IDB to apply the WEPs tool First ESG Annual Report for VCP III 2020 2020 VIR IV in the process of becoming a OPIM signatory 2021 VIR IV (largest impact fund in Brazil) final closing of R$ 1 billion VES was the first Brazilian fund to receive the “European Standard” label 2021 VIR IV won the Private Equity ESG Fund of the Year Award from Environmental Finance Vinci received the WOB – Women on B oard seal 2022 VICC Activation of BNDES anchor investment Vinci Credit Infra Activation of anchor investments from local institutional investors such as BNDES 2022 VIAS won the ESG certification from NINT, Latin America’s largest ESG consulting and assessment firm 2023 VIAS renewed its ESG certification from NINT VICC held its first closing 2023 VIR IV won the LAVCA ESG Deal of the Year Award with the sale of Pró Infusion See notes and definitions at end of document Vinci Climate Change (VICC) – Focused on renewables generation, water & sewage, and innovative green technologies
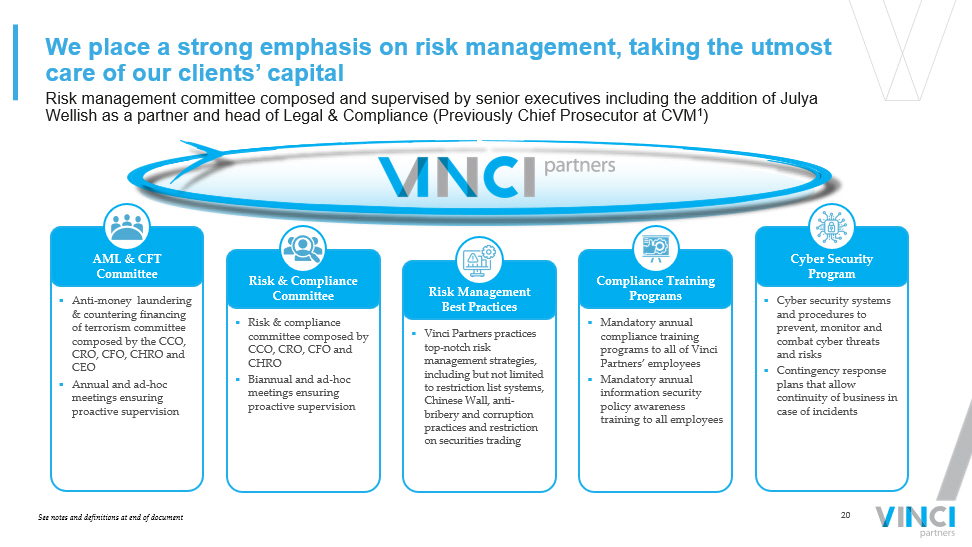
20 Risk management committee composed and supervised by senior executives including the addition of Julya Wellish as a partner and head of Legal & Compliance (Previously Chief Prosecutor at CVM 1 ) We place a strong emphasis on risk management, taking the utmost care of our clients ’ capital ▪ Mandatory annual compliance training programs to all of Vinci Partners’ employees ▪ Mandatory annual information security policy awareness training to all employees ▪ Vinci Partners practices top - notch risk management strategies, including but not limited to restriction list systems, Chinese Wall, anti - bribery and corruption practices and restriction on securities trading ▪ Risk & compliance committee composed by CCO, CRO, CFO and CHRO ▪ Biannual and ad - hoc meetings ensuring proactive supervision ▪ Anti - money laundering & countering financing of terrorism committee composed by the CCO, CRO, CFO, CHRO and CEO ▪ Annual and ad - hoc meetings ensuring proactive supervision ▪ Cyber security systems and procedures to prevent, monitor and combat cyber threats and risks ▪ Contingency response plans that allow continuity of business in case of incidents Compliance Training Programs Risk & Compliance Committee AML & CFT Committee Cyber Security Program Risk Management Best Practices See notes and definitions at end of document
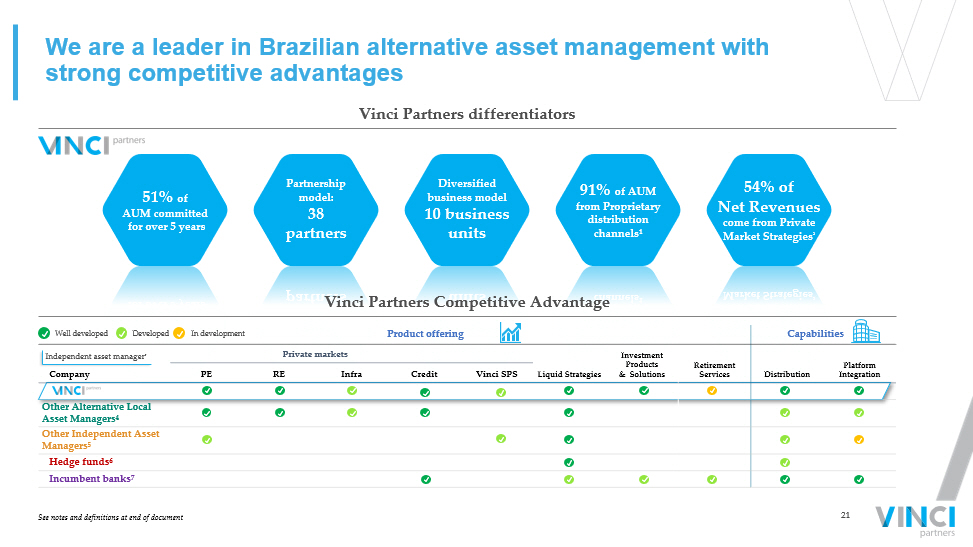
21 We are a leader in Brazilian alternative asset management with strong competitive advantages 91% of AUM from Proprietary distribution channels¹ 54% of Net Revenues come from Private Market Strategies ² 51% of AUM committed for over 5 years Diversified business model 10 business units Partnership model: 38 partners Vinci Partners differentiators Vinci Partners Competitive Advantage Product offering Capabilities Company Private markets Liquid Strategies Investment Products & Solutions Retirement Services Distribution Platform Integration PE RE Infra Credit Vinci SPS Other Alternative Local Asset Managers 4 Other Independent Asset Managers 5 Hedge funds 6 Incumbent banks 7 In development Well developed Developed Independent asset manager ³ See notes and definitions at end of document

Appendix – II Segment summaries
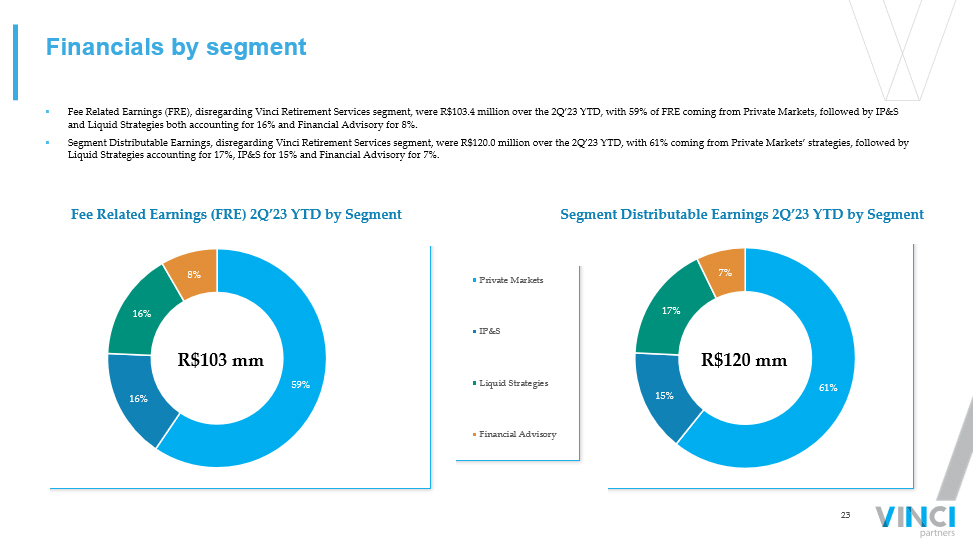
23 61% 15% 17% 7% Private Markets IP&S Liquid Strategies Financial Advisory 59% 16% 16% 8% Financials by segment ▪ Fee Related Earnings (FRE), disregarding Vinci Retirement Services segment, were R$103.4 million over the 2Q’23 YTD, with 59% of FRE coming from Private Markets, followed by IP&S and Liquid Strategies both accounting for 16% and Financial Advisory for 8%. ▪ Segment Distributable Earnings, disregarding Vinci Retirement Services segment, were R$120.0 million over the 2Q’23 YTD, with 61 % coming from Private Markets’ strategies, followed by Liquid Strategies accounting for 17%, IP&S for 15% and Financial Advisory for 7%. Segment Distributable Earnings 2Q’23 YTD by Segment Fee Related Earnings (FRE) 2Q’23 YTD by Segment R$103 mm R$120 mm
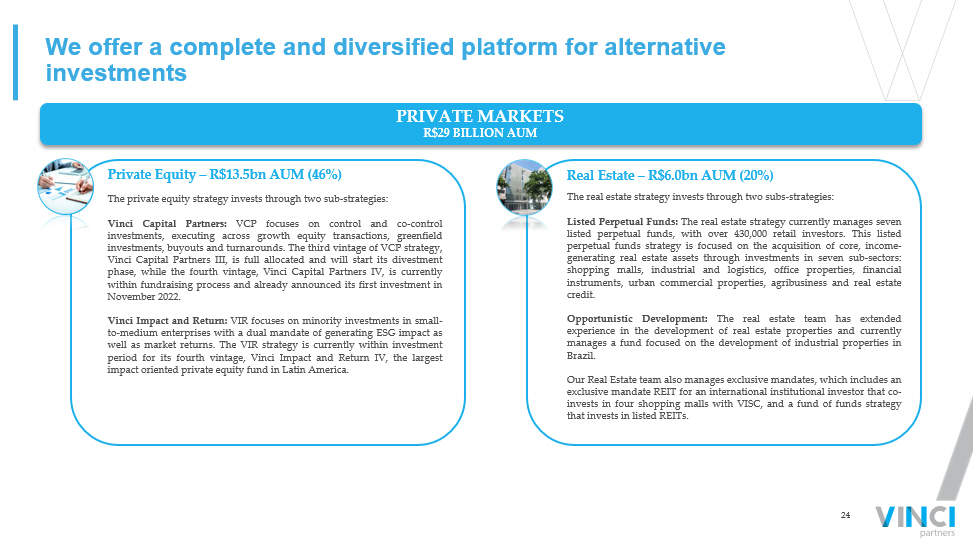
24 We offer a complete and diversified platform for alternative investments Private Equity – R$13.5bn AUM (46%) Real Estate – R$6.0bn AUM (20%) PRIVATE MARKETS R$29 BILLION AUM The real estate strategy invests through two subs - strategies : Listed Perpetual Funds : The real estate strategy currently manages seven listed perpetual funds, with over 430 , 000 retail investors . This listed perpetual funds strategy is focused on the acquisition of core, income - generating real estate assets through investments in seven sub - sectors : shopping malls, industrial and logistics, office properties, financial instruments, urban commercial properties, agribusiness and real estate credit . Opportunistic Development : The real estate team has extended experience in the development of real estate properties and currently manages a fund focused on the development of industrial properties in Brazil . Our Real Estate team also manages exclusive mandates, which includes an exclusive mandate REIT for an international institutional investor that co - invests in four shopping malls with VISC, and a fund of funds strategy that invests in listed REITs . The private equity strategy invests through two sub - strategies : Vinci Capital Partners : VCP focuses on control and co - control investments, executing across growth equity transactions, greenfield investments, buyouts and turnarounds . The third vintage of VCP strategy, Vinci Capital Partners III, is full allocated and will start its divestment phase, while the fourth vintage, Vinci Capital Partners IV, is currently within fundraising process and already announced its first investment in November 2022 . Vinci Impact and Return : VIR focuses on minority investments in small - to - medium enterprises with a dual mandate of generating ESG impact as well as market returns . The VIR strategy is currently within investment period for its fourth vintage, Vinci Impact and Return IV, the largest impact oriented private equity fund in Latin America .

25 Infrastructure – R$2.4bn AUM (8%) Vinci SPS – R$2.1bn AUM (7%) The Vinci SPS strategy invests across five core sub - strategies : Primary Market Funding : New money provided through structured credit solutions . Downside protection through collateral and other mechanisms . Borrowers credit profile range from distressed to high yield . Secondary Market Funding : Acquisition of assets from creditors . Illiquid assets, with different credit profiles . Superior returns obtained through discounted prices combined with improved recovery strategies . Claims : Acquisition of judicial assets against public and private entities . Litigation Finance : Financing of litigation claims where one party has a legit plea but lacks the resources to maintain a typically long and costly judicial dispute . Credit Platforms : Scattered operations (retail) scalable through intense use of technology in their origination and processing workflows . We offer a complete and diversified platform for alternative investments PRIVATE MARKETS R$29 BILLION AUM The Infrastructure strategy invests across two core sub - strategies : Sector - focused funds : The Infrastructure team manages closed - end funds as its flagship strategy, seeking exposure to real assets related to physical infrastructure, through investments in the privatization of state - owned companies and concessions that provide water and sewage services, development of greenfield projects, and core transmission assets . The team also manages a public market vehicle, listed on the Brazilian stock exchange, VIGT, focused on the acquisition of yield - generating power transmission assets . Structured Credit : The team also has exposure to fixed assets through debt investments in infrastructure projects across different sectors . Credit – R$5.3bn AUM (18%) The Credit strategy invests across five core sub - strategies : Infrastructure Credit : The team manages two group of funds with similar strategies, but of different vintages, namely Vinci Energia Sustentável , or VES, and Vinci Credit Infra . The funds essentially invest in senior secured debentures, focused on renewable energy, such as wind, solar, and hydro power generation, in line with our strict ESG guidelines . Real Estate Credit : Investment opportunities in senior secured loans/securities in the form of debentures or MBS, backed by underlying real estate loans and/or receivables . Multi - strategy/Structured Credit : Comprises a group funds, including open - ended funds and managed accounts, investing in senior secured loans and short - term receivables . Exclusive Mandates : Mandates with customized investment policy and client - driven . Agribusiness : Focused on bilateral senior secured credit transactions, which are originated and structured in - house

26 Private Equity 46% Real Estate 21% Credit 18% Infrastructure 8% Vinci SPS 7% Private Markets' AUM (R$ thousands, unless mentioned) 2Q'22 1Q'23 2Q'23 ∆ YoY (%) 2Q'22 YTD 2Q'23 YTD ∆ YoY (%) Net revenue from management fees 47,654 58,432 57,842 21% 94,413 116,274 23% Net revenue from advisory fees 275 275 275 – 741 549 (26)% Total Fee Related Revenues 47,929 58,706 58,117 21% 95,154 116,823 23% Segment personnel expenses (2,923) (3,509) (3,719) 27% (5,659) (7,228) 28% Other G&A expenses (2,411) (1,438) (2,540) 5% (5,166) (3,978) (23)% Corporate center expenses (10,827) (13,018) (13,205) 22% (20,381) (26,223) 29% Bonus compensation related to management and advisory (7,426) (9,111) (8,817) 19% (14,733) (17,928) 22% Total Fee Related Expenses (23,587) (27,076) (28,281) 20% (45,939) (55,357) 21% FEE RELATED EARNINGS (FRE) 24,342 31,630 29,836 23% 49,215 61,466 25% FRE Margin (%) 50.8% 53.9% 51.3% 51.7% 52.6% Net revenue from performance fees 1,719 7 2,528 47% 2,359 2,535 7% Realized performance fees 1,719 7 2,528 47% 1,723 2,535 47% Unrealized performance fees – – – N/A 636 – N/A Performance based compensation (609) (3) (1,118) 84% (835) (1,121) 34% PERFORMANCE RELATED EARNINGS (PRE) 1,110 5 1,410 27% 1,524 1,414 (7)% PRE Margin (%) 64.6% 64.6% 55.8% 64.6% 55.8% ( - ) Unrealized performance fees – – – N/A (636) – N/A (+) Unrealized performance compensation – – – N/A 225 – N/A (+) Realized GP investment income 4,926 5,881 4,179 (15)% 6,971 10,060 44% SEGMENT DISTRIBUTABLE EARNINGS 30,377 37,516 35,425 17% 57,299 72,940 27% Segment DE Margin (%) 55.7% 58.1% 56.9% 56.1% 57.5% ASSETS UNDER MANAGEMENT (AUM R$millions) 23,998 28,198 29,367 22% 23,998 29,367 22% FEE EARNING ASSETS UNDER MANAGEMENT (FEAUM R$ millions) 20,722 24,825 26,076 26% 20,722 26,076 26% AVERAGE MANAGEMENT FEE RATE (%) 0.90% 0.87% 0.85% 0.91% 0.86% Private Markets R$29 bn AUM ▪ Fee related earnings (FRE) of R$29.8 million in the quarter, up 23% year - over - year, a combination of strong fundraising efforts over the last twelve months and the acquisition of Vinci SPS. In the 1Q’23, management fees received a boost from retroactive fees coming from commitments signed for VCP IV, which did not oc cur in the 2Q’23. This effect was partially offset by the commitments signed for VICC that started to contribute to management fees in the 2Q’23. ▪ FRE was R$61.5 million over the 2Q’23 YTD, an increase of 25% when compared to the 2Q’22 YTD. ▪ Segment Distributable Earnings of R$35.4 million in the quarter, up 17% year - over - year. Segment DE was R$72.9 million over the 2 Q’23 YTD, an increase of 27% when compared to the 2Q’22 YTD, boosted by growth in FRE. ▪ Total AUM of R$29.4 billion in the quarter, an increase of 22% year - over - year, driven by strong fundraising across Private Equit y, Credit, Infrastructure and the acquisition of Vinci SPS.

27 Commingled Funds – R$2.2bn AUM (9%) Our focused commingled funds are owned by multiple clients, from retail to institutional investors, and deploy capital in specific asset classes within defined investment strategies . Our flagship strategies are Vinci Valorem, focusing on fixed income assets, foreign exchange currency and derivatives, and Vinci Selection Equities, which invests in other public equities funds seeking to beat the Ibovespa . Pension Plans – R$3.1bn AUM (13%) Within our IP&S segment, we manage PGBL and VGBL pension plan funds, owned by retail clients, which provide tax and succession benefits . Our flagship strategy, “Vinci Equilíbrio”, seeks investments in specific asset classes, such as fixed income, foreign exchange currency, public equities, derivatives and other funds. We are market leaders in providing investment solutions to our clients INVESTMENT PRODUCTS & SOLUTIONS R$24 BILLION AUM In our separate exclusive mandates, we provide investment solutions to institutional investors, such as small to medium - sized foundations, pension funds and financial institutions in Brazil, and high net worth individuals . Our asset allocation team seeks tailored made and distinctive portfolio construction solutions, addressing the clients’ specific portfolio objectives and restraints regarding targeted return, risk tolerance, diversification, asset class and liquidity . Separate Exclusive Mandates – R$16.6bn AUM (69%) International – R$2.1bn AUM (9%) Within our IP&S segment we have an offshore allocation service, or international exclusive mandates, managed by a team in our New York office . We provide tailored made investment solutions for local institutional investors and nigh net worth individuals that are seeking risk diversification by allocating part of their portfolios outside Brazil .
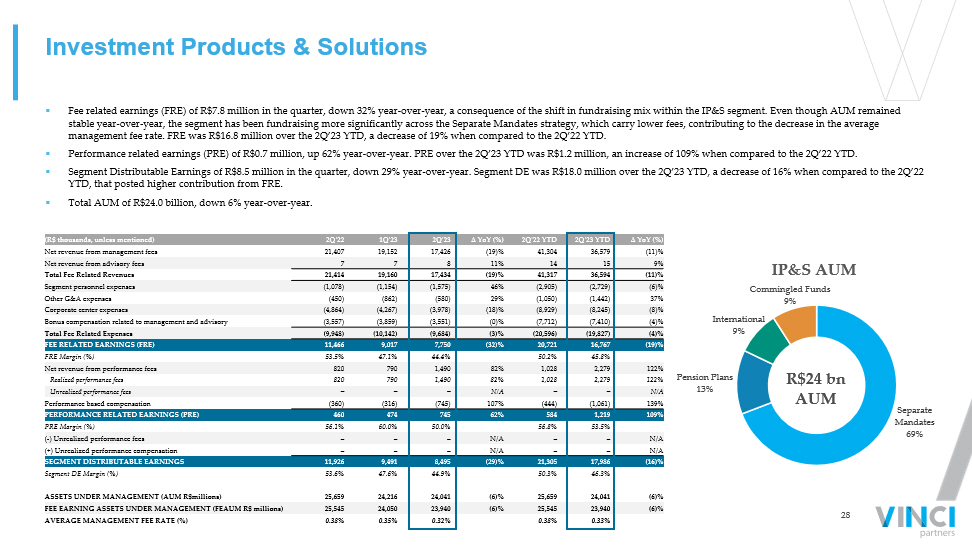
28 Separate Mandates 69% Pension Plans 13% International 9% Commingled Funds 9% IP&S AUM (R$ thousands, unless mentioned) 2Q'22 1Q'23 2Q'23 ∆ YoY (%) 2Q'22 YTD 2Q'23 YTD ∆ YoY (%) Net revenue from management fees 21,407 19,152 17,426 (19)% 41,304 36,579 (11)% Net revenue from advisory fees 7 7 8 11% 14 15 9% Total Fee Related Revenues 21,414 19,160 17,434 (19)% 41,317 36,594 (11)% Segment personnel expenses (1,078) (1,154) (1,575) 46% (2,905) (2,729) (6)% Other G&A expenses (450) (862) (580) 29% (1,050) (1,442) 37% Corporate center expenses (4,864) (4,267) (3,978) (18)% (8,929) (8,245) (8)% Bonus compensation related to management and advisory (3,557) (3,859) (3,551) (0)% (7,712) (7,410) (4)% Total Fee Related Expenses (9,948) (10,142) (9,684) (3)% (20,596) (19,827) (4)% FEE RELATED EARNINGS (FRE) 11,466 9,017 7,750 (32)% 20,721 16,767 (19)% FRE Margin (%) 53.5% 47.1% 44.4% 50.2% 45.8% Net revenue from performance fees 820 790 1,490 82% 1,028 2,279 122% Realized performance fees 820 790 1,490 82% 1,028 2,279 122% Unrealized performance fees – – – N/A – – N/A Performance based compensation (360) (316) (745) 107% (444) (1,061) 139% PERFORMANCE RELATED EARNINGS (PRE) 460 474 745 62% 584 1,219 109% PRE Margin (%) 56.1% 60.0% 50.0% 56.8% 53.5% ( - ) Unrealized performance fees – – – N/A – – N/A (+) Unrealized performance compensation – – – N/A – – N/A SEGMENT DISTRIBUTABLE EARNINGS 11,926 9,491 8,495 (29)% 21,305 17,986 (16)% Segment DE Margin (%) 53.6% 47.6% 44.9% 50.3% 46.3% ASSETS UNDER MANAGEMENT (AUM R$millions) 25,659 24,216 24,041 (6)% 25,659 24,041 (6)% FEE EARNING ASSETS UNDER MANAGEMENT (FEAUM R$ millions) 25,545 24,050 23,940 (6)% 25,545 23,940 (6)% AVERAGE MANAGEMENT FEE RATE (%) 0.38% 0.35% 0.32% 0.38% 0.33% Investment Products & Solutions ▪ Fee related earnings (FRE) of R$7.8 million in the quarter, down 32% year - over - year, a consequence of the shift in fundraising m ix within the IP&S segment. Even though AUM remained stable year - over - year, the segment has been fundraising more significantly across the Separate Mandates strategy, which carry lo wer fees, contributing to the decrease in the average management fee rate. FRE was R$16.8 million over the 2Q’23 YTD, a decrease of 19% when compared to the 2Q’22 YTD. ▪ Performance related earnings (PRE) of R$0.7 million, up 62% year - over - year. PRE over the 2Q’23 YTD was R$1.2 million, an increas e of 109% when compared to the 2Q’22 YTD. ▪ Segment Distributable Earnings of R$8.5 million in the quarter, down 29% year - over - year. Segment DE was R$18.0 million over the 2Q’23 YTD, a decrease of 16% when compared to the 2Q’22 YTD, that posted higher contribution from FRE. ▪ Total AUM of R$24.0 billion, down 6% year - over - year. R$24 bn AUM
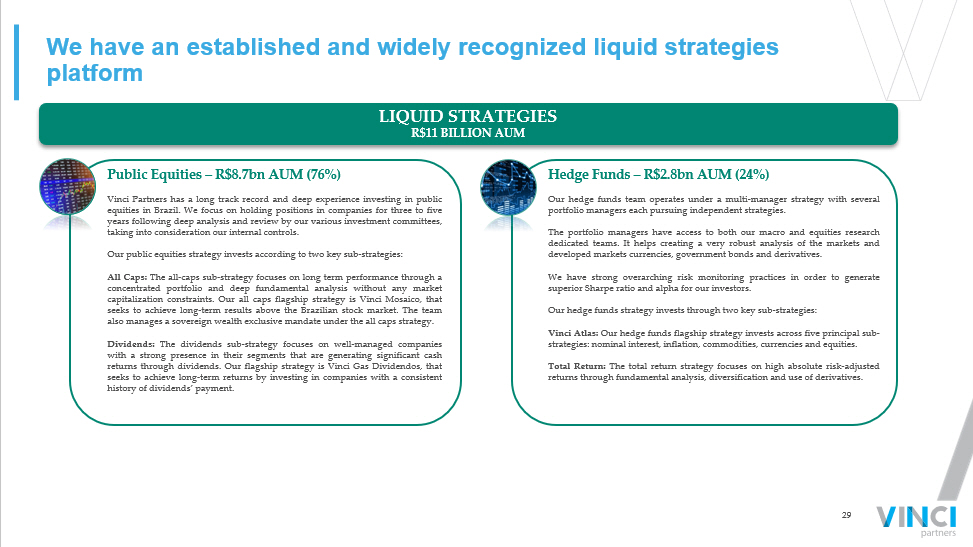
29 We have an established and widely recognized liquid strategies platform LIQUID STRATEGIES R$11 BILLION AUM Vinci Partners has a long track record and deep experience investing in public equities in Brazil . We focus on holding positions in companies for three to five years following deep analysis and review by our various investment committees, taking into consideration our internal controls . Our public equities strategy invests according to two key sub - strategies : All Caps : The all - caps sub - strategy focuses on long term performance through a concentrated portfolio and deep fundamental analysis without any market capitalization constraints . Our all caps flagship strategy is Vinci Mosaico , that seeks to achieve long - term results above the Brazilian stock market . The team also manages a sovereign wealth exclusive mandate under the all caps strategy . Dividends : The dividends sub - strategy focuses on well - managed companies with a strong presence in their segments that are generating significant cash returns through dividends . Our flagship strategy is Vinci Gas Dividendos , that seeks to achieve long - term returns by investing in companies with a consistent history of dividends’ payment . Public Equities – R$8.7bn AUM (76%) Our hedge funds team operates under a multi - manager strategy with several portfolio managers each pursuing independent strategies . The portfolio managers have access to both our macro and equities research dedicated teams . It helps creating a very robust analysis of the markets and developed markets currencies, government bonds and derivatives . We have strong overarching risk monitoring practices in order to generate superior Sharpe ratio and alpha for our investors . Our hedge funds strategy invests through two key sub - strategies : Vinci Atlas : Our hedge funds flagship strategy invests across five principal sub - strategies : nominal interest, inflation, commodities, currencies and equities . Total Return : The total return strategy focuses on high absolute risk - adjusted returns through fundamental analysis, diversification and use of derivatives . Hedge Funds – R$2.8bn AUM (24%)
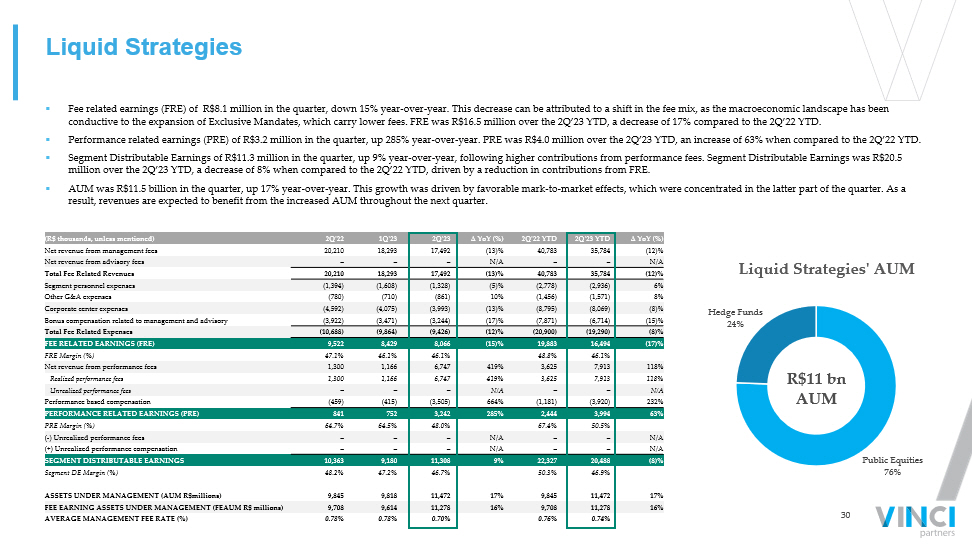
30 Public Equities 76% Hedge Funds 24% Liquid Strategies' AUM (R$ thousands, unless mentioned) 2Q'22 1Q'23 2Q'23 ∆ YoY (%) 2Q'22 YTD 2Q'23 YTD ∆ YoY (%) Net revenue from management fees 20,210 18,293 17,492 (13)% 40,783 35,784 (12)% Net revenue from advisory fees – – – N/A – – N/A Total Fee Related Revenues 20,210 18,293 17,492 (13)% 40,783 35,784 (12)% Segment personnel expenses (1,394) (1,608) (1,328) (5)% (2,778) (2,936) 6% Other G&A expenses (780) (710) (861) 10% (1,456) (1,571) 8% Corporate center expenses (4,592) (4,075) (3,993) (13)% (8,795) (8,069) (8)% Bonus compensation related to management and advisory (3,922) (3,471) (3,244) (17)% (7,871) (6,714) (15)% Total Fee Related Expenses (10,688) (9,864) (9,426) (12)% (20,900) (19,290) (8)% FEE RELATED EARNINGS (FRE) 9,522 8,429 8,066 (15)% 19,883 16,494 (17)% FRE Margin (%) 47.1% 46.1% 46.1% 48.8% 46.1% Net revenue from performance fees 1,300 1,166 6,747 419% 3,625 7,913 118% Realized performance fees 1,300 1,166 6,747 419% 3,625 7,913 118% Unrealized performance fees – – – N/A – – N/A Performance based compensation (459) (415) (3,505) 664% (1,181) (3,920) 232% PERFORMANCE RELATED EARNINGS (PRE) 841 752 3,242 285% 2,444 3,994 63% PRE Margin (%) 64.7% 64.5% 48.0% 67.4% 50.5% ( - ) Unrealized performance fees – – – N/A – – N/A (+) Unrealized performance compensation – – – N/A – – N/A SEGMENT DISTRIBUTABLE EARNINGS 10,363 9,180 11,308 9% 22,327 20,488 (8)% Segment DE Margin (%) 48.2% 47.2% 46.7% 50.3% 46.9% ASSETS UNDER MANAGEMENT (AUM R$millions) 9,845 9,818 11,472 17% 9,845 11,472 17% FEE EARNING ASSETS UNDER MANAGEMENT (FEAUM R$ millions) 9,708 9,614 11,278 16% 9,708 11,278 16% AVERAGE MANAGEMENT FEE RATE (%) 0.78% 0.78% 0.70% 0.76% 0.74% Liquid Strategies ▪ Fee related earnings (FRE) of R$8.1 million in the quarter, down 15% year - over - year. This decrease can be attributed to a shift in the fee mix, as the macroeconomic landscape has been conductive to the expansion of Exclusive Mandates, which carry lower fees. FRE was R$16.5 million over the 2Q’23 YTD, a decre ase of 17% compared to the 2Q’22 YTD. ▪ Performance related earnings (PRE) of R$3.2 million in the quarter, up 285% year - over - year. PRE was R$4.0 million over the 2Q’23 YTD, an increase of 63% when compared to the 2Q’22 YTD. ▪ Segment Distributable Earnings of R$11.3 million in the quarter, up 9% year - over - year, following higher contributions from perfo rmance fees. Segment Distributable Earnings was R$20.5 million over the 2Q’23 YTD, a decrease of 8% when compared to the 2Q’22 YTD, driven by a reduction in contributions from FRE. ▪ AUM was R$11.5 billion in the quarter, up 17% year - over - year. This growth was driven by favorable mark - to - market effects, which were concentrated in the latter part of the quarter. As a result, revenues are expected to benefit from the increased AUM throughout the next quarter. R$11 bn AUM
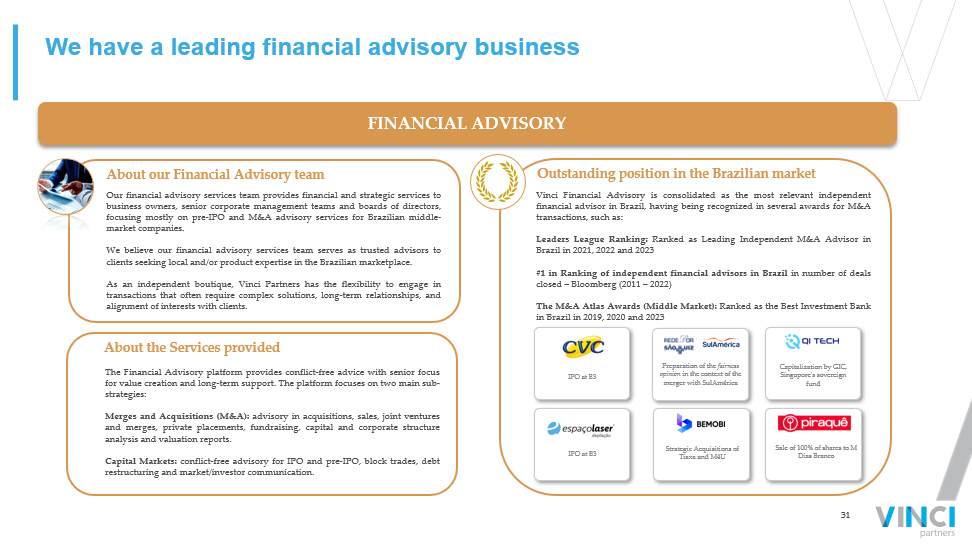
31 We have a leading financial advisory business About our Financial Advisory team Our financial advisory services team provides financial and strategic services to business owners, senior corporate management teams and boards of directors, focusing mostly on pre - IPO and M&A advisory services for Brazilian middle - market companies . We believe our financial advisory services team serves as trusted advisors to clients seeking local and/or product expertise in the Brazilian marketplace . As an independent boutique, Vinci Partners has the flexibility to engage in transactions that often require complex solutions, long - term relationships, and alignment of interests with clients . About the Services provided Outstanding position in the Brazilian market FINANCIAL ADVISORY The Financial Advisory platform provides conflict - free advice with senior focus for value creation and long - term support . The platform focuses on two main sub - strategies : Merges and Acquisitions (M&A) : advisory in acquisitions, sales, joint ventures and merges, private placements, fundraising, capital and corporate structure analysis and valuation reports . Capital Markets : conflict - free advisory for IPO and pre - IPO, block trades, debt restructuring and market/investor communication . Vinci Financial Advisory is consolidated as the most relevant independent financial advisor in Brazil, having being recognized in several awards for M&A transactions, such as : Leaders League Ranking : Ranked as Leading Independent M&A Advisor in Brazil in 2021 , 2022 and 2023 # 1 in Ranking of independent financial advisors in Brazil in number of deals closed – Bloomberg ( 2011 – 2022 ) The M&A Atlas Awards (Middle Market) : Ranked as the Best Investment Bank in Brazil in 2019 , 2020 and 2023 Sale of 100% of shares to M Dias Branco Strategic Acquisitions of Tiaxa and M4U Preparation of the fairness opinion in the context of the merger with SulAmérica Capitalization by GIC, Singapore's sovereign fund IPO at B3 IPO at B3
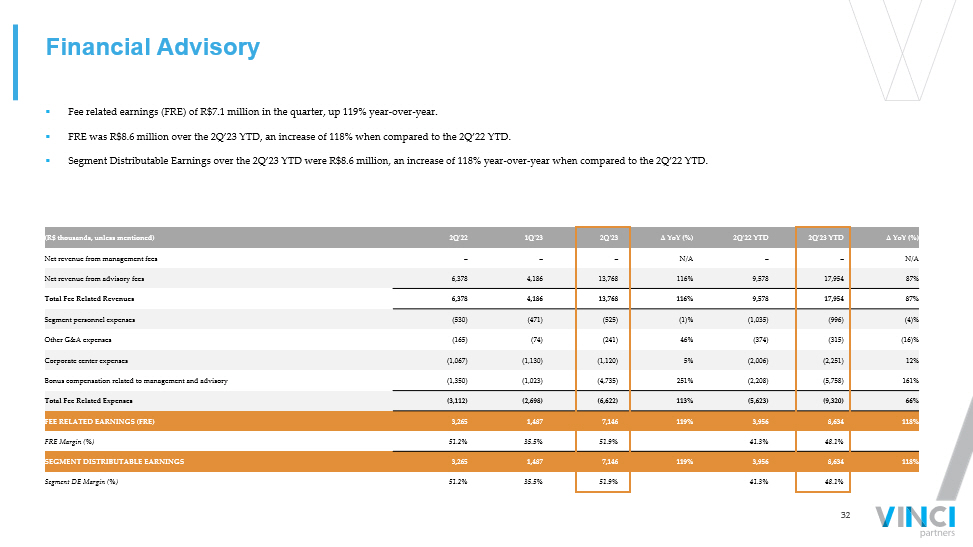
32 Financial Advisory ▪ Fee related earnings (FRE) of R$7.1 million in the quarter, up 119% year - over - year. ▪ FRE was R$8.6 million over the 2Q’23 YTD, an increase of 118% when compared to the 2Q’22 YTD. ▪ Segment Distributable Earnings over the 2Q’23 YTD were R$8.6 million, an increase of 118% year - over - year when compared to the 2Q ’22 YTD. (R$ thousands, unless mentioned) 2Q'22 1Q'23 2Q'23 ∆ YoY (%) 2Q'22 YTD 2Q'23 YTD ∆ YoY (%) Net revenue from management fees – – – N/A – – N/A Net revenue from advisory fees 6,378 4,186 13,768 116% 9,578 17,954 87% Total Fee Related Revenues 6,378 4,186 13,768 116% 9,578 17,954 87% Segment personnel expenses (530) (471) (525) (1)% (1,035) (996) (4)% Other G&A expenses (165) (74) (241) 46% (374) (315) (16)% Corporate center expenses (1,067) (1,130) (1,120) 5% (2,006) (2,251) 12% Bonus compensation related to management and advisory (1,350) (1,023) (4,735) 251% (2,208) (5,758) 161% Total Fee Related Expenses (3,112) (2,698) (6,622) 113% (5,623) (9,320) 66% FEE RELATED EARNINGS (FRE) 3,265 1,487 7,146 119% 3,956 8,634 118% FRE Margin (%) 51.2% 35.5% 51.9% 41.3% 48.1% SEGMENT DISTRIBUTABLE EARNINGS 3,265 1,487 7,146 119% 3,956 8,634 118% Segment DE Margin (%) 51.2% 35.5% 51.9% 41.3% 48.1%
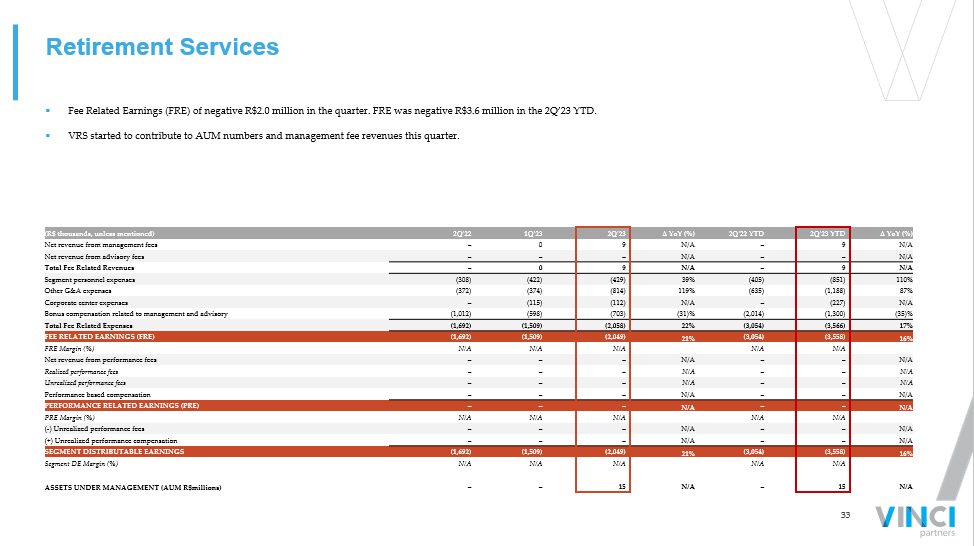
33 (R$ thousands, unless mentioned) 2Q'22 1Q'23 2Q'23 ∆ YoY (%) 2Q'22 YTD 2Q'23 YTD ∆ YoY (%) Net revenue from management fees – 0 9 N/A – 9 N/A Net revenue from advisory fees – – – N/A – – N/A Total Fee Related Revenues – 0 9 N/A – 9 N/A Segment personnel expenses (308) (422) (429) 39% (405) (851) 110% Other G&A expenses (372) (374) (814) 119% (635) (1,188) 87% Corporate center expenses – (115) (112) N/A – (227) N/A Bonus compensation related to management and advisory (1,012) (598) (703) (31)% (2,014) (1,300) (35)% Total Fee Related Expenses (1,692) (1,509) (2,058) 22% (3,054) (3,566) 17% FEE RELATED EARNINGS (FRE) (1,692) (1,509) (2,049) 21% (3,054) (3,558) 16% FRE Margin (%) N/A N/A N/A N/A N/A Net revenue from performance fees – – – N/A – – N/A Realized performance fees – – – N/A – – N/A Unrealized performance fees – – – N/A – – N/A Performance based compensation – – – N/A – – N/A PERFORMANCE RELATED EARNINGS (PRE) – – – N/A – – N/A PRE Margin (%) N/A N/A N/A N/A N/A ( - ) Unrealized performance fees – – – N/A – – N/A (+) Unrealized performance compensation – – – N/A – – N/A SEGMENT DISTRIBUTABLE EARNINGS (1,692) (1,509) (2,049) 21% (3,054) (3,558) 16% Segment DE Margin (%) N/A N/A N/A N/A N/A ASSETS UNDER MANAGEMENT (AUM R$millions) – – 15 N/A – 15 N/A Retirement Services ▪ Fee Related Earnings (FRE) of negative R$2.0 million in the quarter. FRE was negative R$3.6 million in the 2Q’23 YTD. ▪ VRS started to contribute to AUM numbers and management fee revenues this quarter.

Appendix – III Financial statements

35 How to analyze Vinci Partners’ financial model Fee Related Earnings (FRE) (+) Management fees: our main source of revenues, derived from fees charged over our Fee - Earning AUM (+) Advisory fees: fees charged over advisory services provided by our financial advisory and management teams ( - ) Operating expenses: includes all G&A, personnel and profit - sharing expenses (related to mgmt. and adv. fees) Performance Related Earnings (PRE) (+) Performance fees: derived from fees charged over our Performance - Eligible AUM. In most of our LS and IP&S segments, performance fees are charged over a hurdle rate once the fund’s return exceeds its benchmark. In our Private Market strategies most of the funds charge performance over the fund’s absolute return once it surpasses its preferred rate. ( - ) Performance compensation: compensation allocated to the management teams linked to generated performance fees Distributable Earnings (DE) (+) FRE (+) Cash PRE: PRE less unrealized performance fees and unrealized performance compensation (+) Realized GP Investment Income: realized income derived from our GP Investments in our Private Market funds (+) Realized Financial Income: realized income derived from the company’s cash allocations (+) D&A: non - cash expense that is added back to our Distributable Earnings calculation ( - ) Cash Income taxes: income taxes calculated over realized revenues
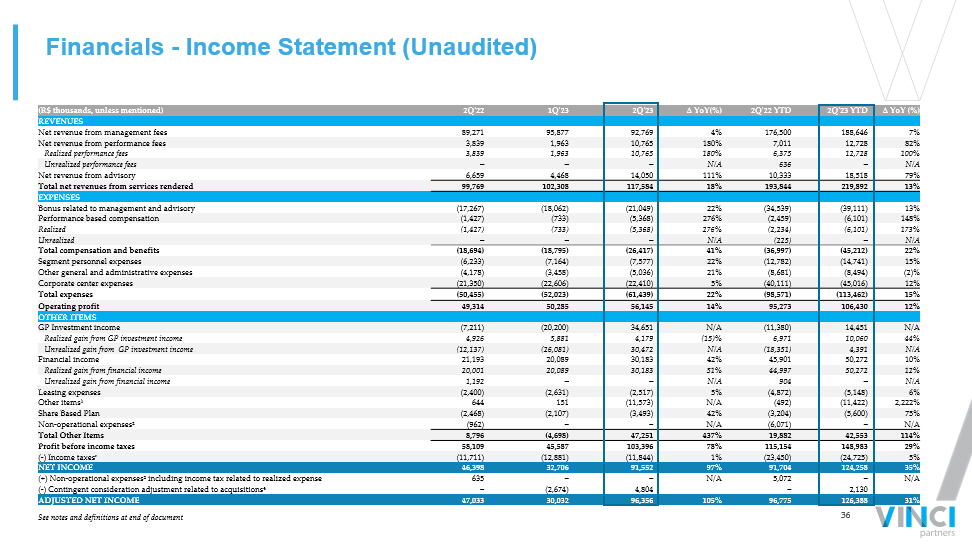
36 (R$ thousands, unless mentioned) 2Q'22 1Q'23 2Q'23 ∆ YoY(%) 2Q'22 YTD 2Q'23 YTD ∆ YoY (%) REVENUES Net revenue from management fees 89,271 95,877 92,769 4% 176,500 188,646 7% Net revenue from performance fees 3,839 1,963 10,765 180% 7,011 12,728 82% Realized performance fees 3,839 1,963 10,765 180% 6,375 12,728 100% Unrealized performance fees – – – N/A 636 – N/A Net revenue from advisory 6,659 4,468 14,050 111% 10,333 18,518 79% Total net revenues from services rendered 99,769 102,308 117,584 18% 193,844 219,892 13% EXPENSES Bonus related to management and advisory (17,267) (18,062) (21,049) 22% (34,539) (39,111) 13% Performance based compensation (1,427) (733) (5,368) 276% (2,459) (6,101) 148% Realized (1,427) (733) (5,368) 276% (2,234) (6,101) 173% Unrealized – – – N/A (225) – N/A Total compensation and benefits (18,694) (18,795) (26,417) 41% (36,997) (45,212) 22% Segment personnel expenses (6,233) (7,164) (7,577) 22% (12,782) (14,741) 15% Other general and administrative expenses (4,178) (3,458) (5,036) 21% (8,681) (8,494) (2)% Corporate center expenses (21,350) (22,606) (22,410) 5% (40,111) (45,016) 12% Total expenses (50,455) (52,023) (61,439) 22% (98,571) (113,462) 15% Operating profit 49,314 50,285 56,145 14% 95,273 106,430 12% OTHER ITEMS GP Investment income (7,211) (20,200) 34,651 N/A (11,380) 14,451 N/A Realized gain from GP investment income 4,926 5,881 4,179 (15)% 6,971 10,060 44% Unrealized gain from GP investment income (12,137) (26,081) 30,472 N/A (18,351) 4,391 N/A Financial income 21,193 20,089 30,183 42% 45,901 50,272 10% Realized gain from financial income 20,001 20,089 30,183 51% 44,997 50,272 12% Unrealized gain from financial income 1,192 – – N/A 904 – N/A Leasing expenses (2,400) (2,631) (2,517) 5% (4,872) (5,148) 6% Other items¹ 644 151 (11,573) N/A (492) (11,422) 2,222% Share Based Plan (2,468) (2,107) (3,493) 42% (3,204) (5,600) 75% Non - operational expenses² (962) – – N/A (6,071) – N/A Total Other Items 8,796 (4,698) 47,251 437% 19,882 42,553 114% Profit before income taxes 58,109 45,587 103,396 78% 115,154 148,983 29% ( - ) Income taxes ³ (11,711) (12,881) (11,844) 1% (23,450) (24,725) 5% NET INCOME 46,398 32,706 91,552 97% 91,704 124,258 35% (+) Non - operational expenses² including income tax related to realized expense 635 – – N/A 5,072 – N/A ( - ) Contingent consideration adjustment related to acquisitions 4 – (2,674) 4,804 – 2,130 ADJUSTED NET INCOME 47,033 30,032 96,356 105% 96,775 126,388 31% Financials - Income Statement (Unaudited) See notes and definitions at end of document
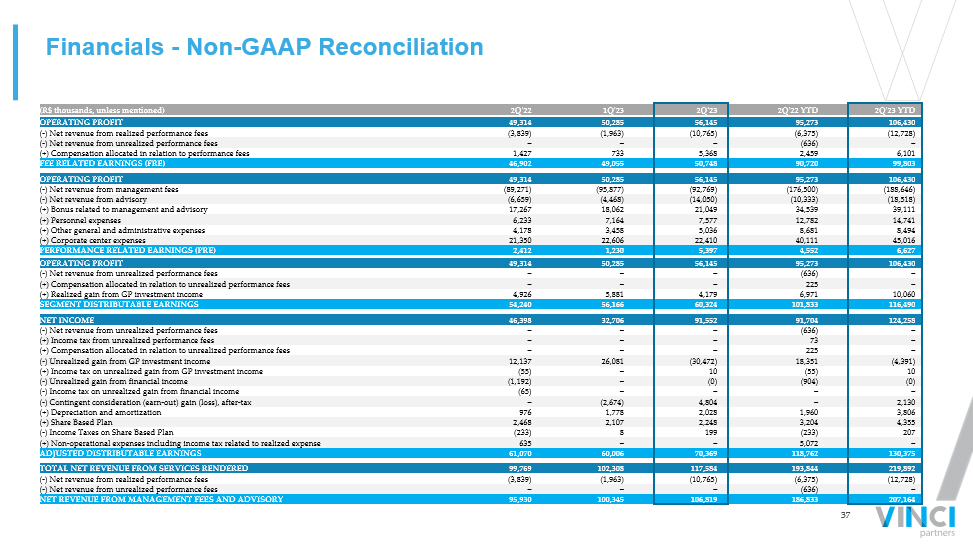
37 (R$ thousands, unless mentioned) 2Q'22 1Q'23 2Q'23 2Q'22 YTD 2Q'23 YTD OPERATING PROFIT 49,314 50,285 56,145 95,273 106,430 ( - ) Net revenue from realized performance fees (3,839) (1,963) (10,765) (6,375) (12,728) ( - ) Net revenue from unrealized performance fees – – – (636) – (+) Compensation allocated in relation to performance fees 1,427 733 5,368 2,459 6,101 FEE RELATED EARNINGS (FRE) 46,902 49,055 50,748 90,720 99,803 OPERATING PROFIT 49,314 50,285 56,145 95,273 106,430 ( - ) Net revenue from management fees (89,271) (95,877) (92,769) (176,500) (188,646) ( - ) Net revenue from advisory (6,659) (4,468) (14,050) (10,333) (18,518) (+) Bonus related to management and advisory 17,267 18,062 21,049 34,539 39,111 (+) Personnel expenses 6,233 7,164 7,577 12,782 14,741 (+) Other general and administrative expenses 4,178 3,458 5,036 8,681 8,494 (+) Corporate center expenses 21,350 22,606 22,410 40,111 45,016 PERFORMANCE RELATED EARNINGS (PRE) 2,412 1,230 5,397 4,552 6,627 OPERATING PROFIT 49,314 50,285 56,145 95,273 106,430 ( - ) Net revenue from unrealized performance fees – – – (636) – (+) Compensation allocated in relation to unrealized performance fees – – – 225 – (+) Realized gain from GP investment income 4,926 5,881 4,179 6,971 10,060 SEGMENT DISTRIBUTABLE EARNINGS 54,240 56,166 60,324 101,833 116,490 NET INCOME 46,398 32,706 91,552 91,704 124,258 ( - ) Net revenue from unrealized performance fees – – – (636) – (+) Income tax from unrealized performance fees – – – 73 – (+) Compensation allocated in relation to unrealized performance fees – – – 225 – ( - ) Unrealized gain from GP investment income 12,137 26,081 (30,472) 18,351 (4,391) (+) Income tax on unrealized gain from GP investment income (55) – 10 (55) 10 ( - ) Unrealized gain from financial income (1,192) – (0) (904) (0) ( - ) Income tax on unrealized gain from financial income (65) – – – – ( - ) Contingent consideration (earn - out) gain (loss), after - tax – (2,674) 4,804 – 2,130 (+) Depreciation and amortization 976 1,778 2,028 1,960 3,806 (+) Share Based Plan 2,468 2,107 2,248 3,204 4,355 ( - ) Income Taxes on Share Based Plan (233) 8 199 (233) 207 (+) Non - operational expenses including income tax related to realized expense 635 – – 5,072 – ADJUSTED DISTRIBUTABLE EARNINGS 61,070 60,006 70,369 118,762 130,375 TOTAL NET REVENUE FROM SERVICES RENDERED 99,769 102,308 117,584 193,844 219,892 ( - ) Net revenue from realized performance fees (3,839) (1,963) (10,765) (6,375) (12,728) ( - ) Net revenue from unrealized performance fees – – – (636) – NET REVENUE FROM MANAGEMENT FEES AND ADVISORY 95,930 100,345 106,819 186,833 207,164 Financials - Non - GAAP Reconciliation

38 Effective tax rate reconciliation See notes and definitions at end of document (R$ thousands, unless mentioned) 2Q'22 2Q'23 2Q'22 YTD 2Q'23 YTD Profit (loss) before income taxes 58,109 103,396 115,154 148,983 Combined statutory income taxes rate - % 34% 34% 34% 34% Income tax benefit (Expense) at statutory rates (19,757) (35,154) (39,152) (50,654) Reconciliation adjustments: Expenses not deductible (9) (2) (27) (64) Tax benefits 30 7 65 42 Share based payments (70) (224) (156) (253) Effect of presumed profit of subsidiaries¹ and offshore subsidiaries 7,951 23,410 15,665 26,072 Other additions (exclusions), net 144 119 155 132 Income taxes expenses (11,711) (11,844) (23,450) (24,725) Current (12,886) (14,605) (25,557) (27,122) Deferred 1,175 2,761 2,107 2,397 Effective tax rate 20% 11% 20% 17%
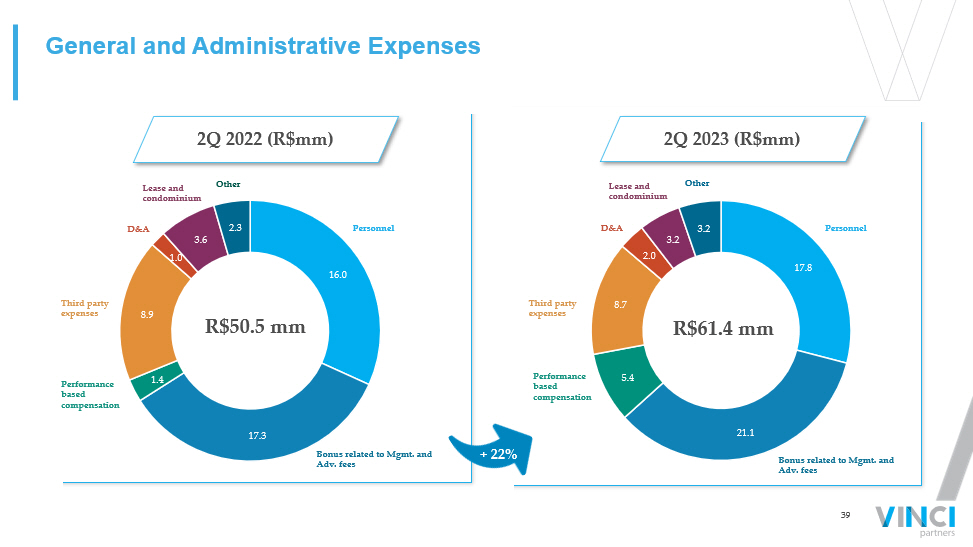
39 17.8 21.1 5.4 8.7 2.0 3.2 3.2 16.0 17.3 1.4 8.9 1.0 3.6 2.3 General and Administrative Expenses 2Q 2022 (R$mm) 2Q 2023 (R$mm) Lease and condominium Other Personnel Bonus related to Mgmt. and Adv. fees Performance based compensation Third party expenses D&A R$50.5 mm Personnel Bonus related to Mgmt. and Adv. fees Performance based compensation Third party expenses D&A Lease and condominium Other R$61.4 mm + 22%
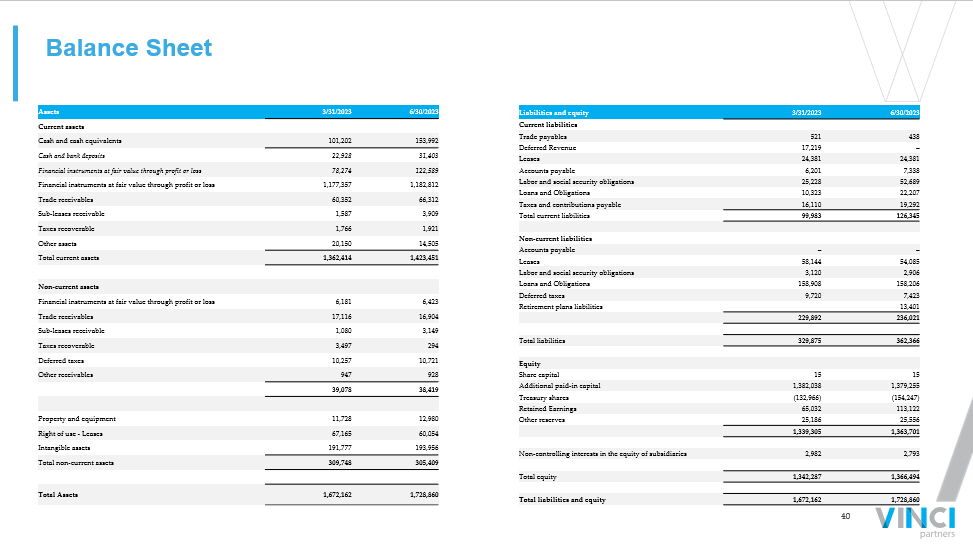
40 Liabilities and equity 3/31/2023 6/30/2023 Current liabilities Trade payables 521 438 Deferred Revenue 17,219 – Leases 24,381 24,381 Accounts payable 6,201 7,338 Labor and social security obligations 25,228 52,689 Loans and Obligations 10,323 22,207 Taxes and contributions payable 16,110 19,292 Total current liabilities 99,983 126,345 Non - current liabilities Accounts payable – – Leases 58,144 54,085 Labor and social security obligations 3,120 2,906 Loans and Obligations 158,908 158,206 Deferred taxes 9,720 7,423 Retirement plans liabilities 13,401 229,892 236,021 Total liabilities 329,875 362,366 Equity Share capital 15 15 Additional paid - in capital 1,382,038 1,379,255 Treasury shares (132,966) (154,247) Retained Earnings 65,032 113,122 Other reserves 25,186 25,556 1,339,305 1,363,701 Non - controlling interests in the equity of subsidiaries 2,982 2,793 Total equity 1,342,287 1,366,494 Total liabilities and equity 1,672,162 1,728,860 Balance Sheet Assets 3/31/2023 6/30/2023 Current assets Cash and cash equivalents 101,202 153,992 Cash and bank deposits 22,928 31,403 Financial instruments at fair value through profit or loss 78,274 122,589 Financial instruments at fair value through profit or loss 1,177,357 1,182,812 Trade receivables 60,352 66,312 Sub - leases receivable 1,587 3,909 Taxes recoverable 1,766 1,921 Other assets 20,150 14,505 Total current assets 1,362,414 1,423,451 Non - current assets Financial instruments at fair value through profit or loss 6,181 6,423 Trade receivables 17,116 16,904 Sub - leases receivable 1,080 3,149 Taxes recoverable 3,497 294 Deferred taxes 10,257 10,721 Other receivables 947 928 39,078 38,419 Property and equipment 11,728 12,980 Right of use - Leases 67,165 60,054 Intangible assets 191,777 193,956 Total non - current assets 309,748 305,409 Total Assets 1,672,162 1,728,860

Supplement Details
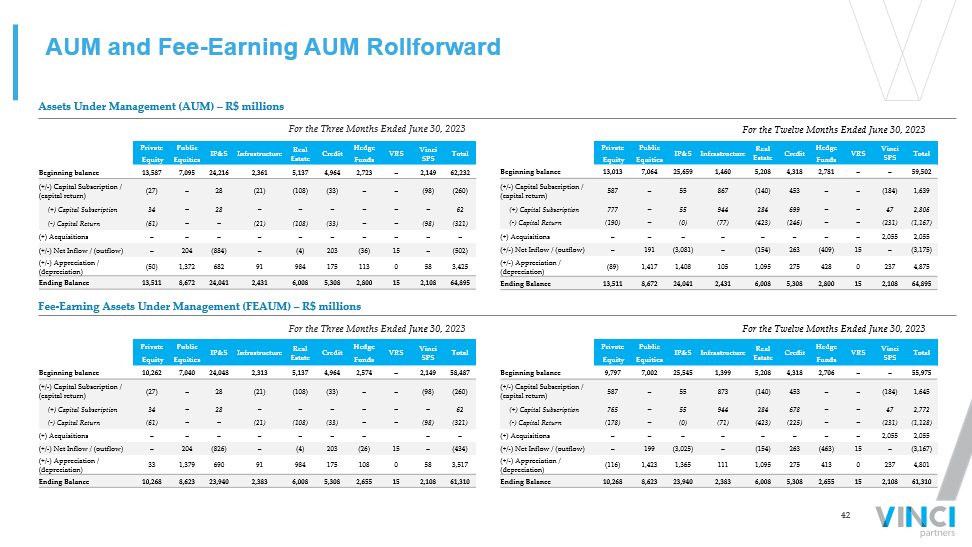
42 AUM and Fee - Earning AUM Rollforward Assets Under Management (AUM) – R$ millions Fee - Earning Assets Under Management (FEAUM) – R$ millions For the Three Months Ended June 30, 2023 For the Three Months Ended June 30 , 2023 For the Twelve Months Ended June 30, 2023 For the Twelve Months Ended June 30, 2023 Private Public IP&S Infrastructure Real Estate Credit Hedge VRS Vinci SPS Total Equity Equities Funds Beginning balance 13,587 7,095 24,216 2,361 5,137 4,964 2,723 – 2,149 62,232 (+/ - ) Capital Subscription / (capital return) (27) – 28 (21) (108) (33) – – (98) (260) (+) Capital Subscription 34 – 28 – – – – – – 62 ( - ) Capital Return (61) – – (21) (108) (33) – – (98) (321) (+) Acquisitions – – – – – – – – – – (+/ - ) Net Inflow / (outflow) – 204 (884) – (4) 203 (36) 15 – (502) (+/ - ) Appreciation / (depreciation) (50) 1,372 682 91 984 175 113 0 58 3,425 Ending Balance 13,511 8,672 24,041 2,431 6,008 5,308 2,800 15 2,108 64,895 Private Public IP&S Infrastructure Real Estate Credit Hedge VRS Vinci SPS Total Equity Equities Funds Beginning balance 13,013 7,064 25,659 1,460 5,208 4,318 2,781 – – 59,502 (+/ - ) Capital Subscription / (capital return) 587 – 55 867 (140) 453 – – (184) 1,639 (+) Capital Subscription 777 – 55 944 284 699 – – 47 2,806 ( - ) Capital Return (190) – (0) (77) (423) (246) – – (231) (1,167) (+) Acquisitions – – – – – – – – 2,055 2,055 (+/ - ) Net Inflow / (outflow) – 191 (3,081) – (154) 263 (409) 15 – (3,175) (+/ - ) Appreciation / (depreciation) (89) 1,417 1,408 105 1,095 275 428 0 237 4,875 Ending Balance 13,511 8,672 24,041 2,431 6,008 5,308 2,800 15 2,108 64,895 Private Public IP&S Infrastructure Real Estate Credit Hedge VRS Vinci SPS Total Equity Equities Funds Beginning balance 10,262 7,040 24,048 2,313 5,137 4,964 2,574 – 2,149 58,487 (+/ - ) Capital Subscription / (capital return) (27) – 28 (21) (108) (33) – – (98) (260) (+) Capital Subscription 34 – 28 – – – – – – 62 ( - ) Capital Return (61) – – (21) (108) (33) – – (98) (321) (+) Acquisitions – – – – – – – – – (+/ - ) Net Inflow / (outflow) – 204 (826) – (4) 203 (26) 15 – (434) (+/ - ) Appreciation / (depreciation) 33 1,379 690 91 984 175 108 0 58 3,517 Ending Balance 10,268 8,623 23,940 2,383 6,008 5,308 2,655 15 2,108 61,310 Private Public IP&S Infrastructure Real Estate Credit Hedge VRS Vinci SPS Total Equity Equities Funds Beginning balance 9,797 7,002 25,545 1,399 5,208 4,318 2,706 – – 55,975 (+/ - ) Capital Subscription / (capital return) 587 – 55 873 (140) 453 – – (184) 1,645 (+) Capital Subscription 765 – 55 944 284 678 – – 47 2,772 ( - ) Capital Return (178) – (0) (71) (423) (225) – – (231) (1,128) (+) Acquisitions – – – – – – – – 2,055 2,055 (+/ - ) Net Inflow / (outflow) – 199 (3,025) – (154) 263 (463) 15 – (3,167) (+/ - ) Appreciation / (depreciation) (116) 1,423 1,365 111 1,095 275 413 0 237 4,801 Ending Balance 10,268 8,623 23,940 2,383 6,008 5,308 2,655 15 2,108 61,310

43 Fund Segment NAV¹ (R$ millions) 2Q’23 YTD 12 M 24 M Market Comparison Index Rate Vinci Multiestratégia FIM Hedge Funds 304.0 3.9% 7.3% 13.9% 22.8% CDI 4 CDI 4 Atlas Strategy² Hedge Funds 384.8 3.9% 5.1% 8.5% 8.9% CDI 4 CDI 4 Vinci Total Return Hedge Funds 241.7 19.1% 16.0% 25.4% 12.3% IPCA 6 + Yield IMA - B 7 IPCA 6 + Yield IMA - B 7 Mosaico Strategy Public Equities 896.1 19.3% 11.4% 16.6% (12.1)% IBOV 5 IBOV 5 Vinci Gas Dividendos FIA Public Equities 506.7 15.0% 7.3% 18.0% (0.3)% IBOV 5 IBOV 5 Vinci Valorem FIM IP&S 1,734.1 3.6% 7.9% 10.4% 21.2% IMA - B 5 7 IMA - B 5 7 Equilibrio Strategy³ IP&S 2,787.6 3.7% 7.4% 9.9% 19.0% IPCA 6 - Vinci Retorno Real FIM IP&S 219.4 5.1% 10.5% 12.7% 26.2% IMA - B 7 IMA - B 7 Vinci Crédito Imobiliário I Credit 110.9 2.1% 5.8% 10.1% 18.7% IPCA 6 IPCA 6 +7.785% Vinci Crédito Imobiliário II Credit 841.6 6.6% 11.0% 13.9% 23.0% IPCA 6 IPCA 6 + 6% Vinci Crédito Estruturado Mult . Plus FIC FIM Credit 124.3 3.6% 5.3% 13.0% 25.4% CDI 4 CDI 4 Vinci Energia Sustentável Credit 605.5 6.1% 8.4% 8.9% 17.6% IPCA 6 IPCA 6 + 6% Vinci Crédito Multiestratégia Credit 344.4 5.8% 4.5% 8.1% 22.1% CDI 4 IPCA 6 + 5% VISC11 Real Estate (listed REIT) 2,209.5 20.1% 18.0% 29.3% 31.7% IFIX 8 IPCA 6 + 6% VILG11 Real Estate (listed REIT) 1,654.2 28.0% 15.8% 26.4% 19.7% IFIX 8 IPCA 6 + 6% VINO11 Real Estate (listed REIT) 772.9 21.8% 3.1% 16.1% (4.3)% IFIX 8 IPCA 6 + 6% VIFI11 Real Estate / Credit (listed REIT) 64.8 23.6% 22.3% 29.6% 17.5% IFIX 8 IFIX 8 VIUR11 Real Estate (listed REIT) 223.9 42.1% 12.5% 31.5% 14.9% IFIX 8 IPCA 6 + 6% VCRI11 Real Estate / Credit (listed REIT) 153.1 9.6% 4.1% 8.6% 5.1% IFIX 8 IPCA 6 + X 9 % VICA11 Real Estate / Credit (REIT) 374.5 0.0% (0.3)% 1.3% 1.3% IFIX 8 CDI 4 + 1% VINCI FOF IMOBILIARIO FIM CP Real Estate (REIT) 59.3 12.7% 12.6% 14.9% 26.8% IFIX 8 IFIX 8 VIGT11 Infrastructure (listed) 656.0 16.4% 15.9% 25.3% 20.2% - - Investment records – IP&S, Liquid Strategies, Credit and Listed Funds Benchmark 2Q’23 YTD 12 M 24 M IBOV 5 15.9% 7.6% 19.8% (6.9)% CDI 4 3.1% 6.5% 13.5% 23.4% IMA - B 5 7 2.5% 7.0% 10.2% 21.3% IPCA 6 + Yield IMA - B 7 2.5% 6.2% 10.1% 29.5% IPCA 6 0.8% 2.9% 3.2% 15.4% IFIX 8 14.3% 10.1% 12.9% 14.5% See notes and definitions at end of document
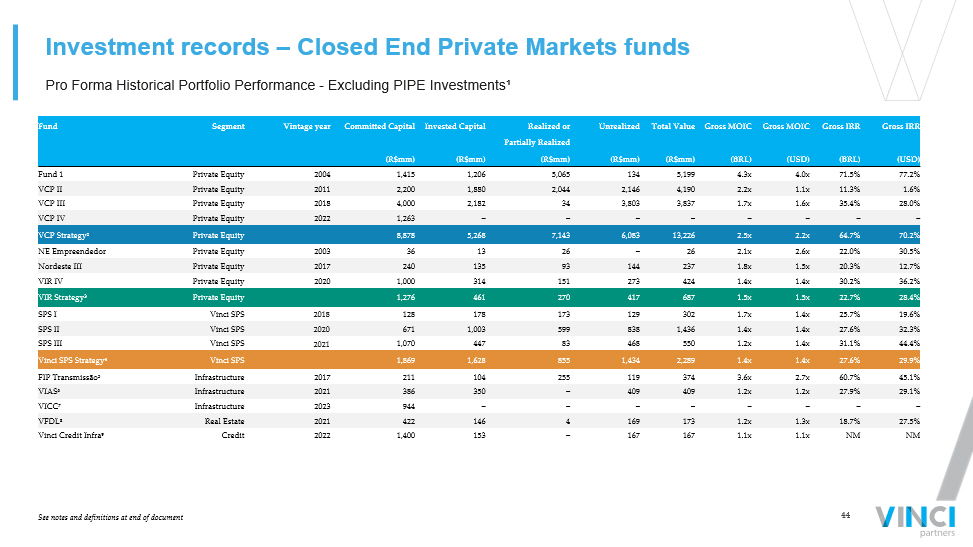
44 Fund Segment Vintage year Committed Capital Invested Capital Realized or Unrealized Total Value Gross MOIC Gross MOIC Gross IRR Gross IRR Partially Realized (R$mm) (R$mm) (R$mm) (R$mm) (R$mm) (BRL) (USD) (BRL) (USD) Fund 1 Private Equity 2004 1,415 1,206 5,065 134 5,199 4.3x 4.0x 71.5% 77.2% VCP II Private Equity 2011 2,200 1,880 2,044 2,146 4,190 2.2x 1.1x 11.3% 1.6% VCP III Private Equity 2018 4,000 2,182 34 3,803 3,837 1.7x 1.6x 35.4% 28.0% VCP IV Private Equity 2022 1,263 – – – – – – – – VCP Strategy² Private Equity 8,878 5,268 7,143 6,083 13,226 2.5x 2.2x 64.7% 70.2% NE Empreendedor Private Equity 2003 36 13 26 – 26 2.1x 2.6x 22.0% 30.5% Nordeste III Private Equity 2017 240 135 93 144 237 1.8x 1.5x 20.3% 12.7% VIR IV Private Equity 2020 1,000 314 151 273 424 1.4x 1.4x 30.2% 36.2% VIR Strategy³ Private Equity 1,276 461 270 417 687 1.5x 1.5x 22.7% 28.4% SPS I Vinci SPS 2018 128 178 173 129 302 1.7x 1.4x 25.7% 19.6% SPS II Vinci SPS 2020 671 1,003 599 838 1,436 1.4x 1.4x 27.6% 32.3% SPS III Vinci SPS 2021 1,070 447 83 468 550 1.2x 1.4x 31.1% 44.4% Vinci SPS Strategy 4 Vinci SPS 1,869 1,628 855 1,434 2,289 1.4x 1.4x 27.6% 29.9% FIP Transmissão 5 Infrastructure 2017 211 104 255 119 374 3.6x 2.7x 60.7% 45.1% VIAS 6 Infrastructure 2021 386 350 – 409 409 1.2x 1.2x 27.9% 29.1% VICC 7 Infrastructure 2023 944 – – – – – – – – VFDL 8 Real Estate 2021 422 146 4 169 173 1.2x 1.3x 18.7% 27.5% Vinci Credit Infra 9 Credit 2022 1,400 153 – 167 167 1.1x 1.1x NM NM Pro Forma Historical Portfolio Performance - Excluding PIPE Investments¹ Investment records – Closed End Private Markets funds See notes and definitions at end of document

45 Shareholder Dividends ($ in thousands) 1H21 3Q ' 21 4Q'21 1Q'22 2Q'22 3Q’22 4Q’22 1Q’23 2Q’23 Distributable Earnings (R$) 101,976 61,743 68,515 53,255 60,435 72,842 55,792 60,006 70,369 Distributable Earnings (US$)¹ 19,397 11,377 13,637 10,615 11,795 14,281 10,618 11,994 14,290 DE per Common Share (US$)² 0.34 0.20 0.24 0.19 0.21 0.26 0.19 0.22 0.26 Actual Dividend per Common Share³ 0.30 0.16 0.20 0.17 0.17 0.20 0.17 0.16 0.20 Record Date Sep 01, 2021 Dec 01, 2021 Mar 10, 2022 May 24, 2022 Aug 25, 2022 Nov 23, 2022 Mar 01, 2023 May 25, 2023 Aug 24, 2023 Payable Date Sep 16, 2021 Dec 16, 2021 Mar 24, 2022 Jun 08, 2022 Sep 09, 2022 Dec 08, 2022 Mar 15, 2023 Jun 09, 2023 Sep 08, 2023 ▪ Vinci Partners generated R$1.30 or US$0.26¹ of Distributable Earnings per common share for the second quarter of 2023. ▪ The company declared a quarterly dividend of US$0.20² per common share to record holders as of August 24, 2023; payable on Se pte mber 08 , 2023. See notes and definitions at end of document
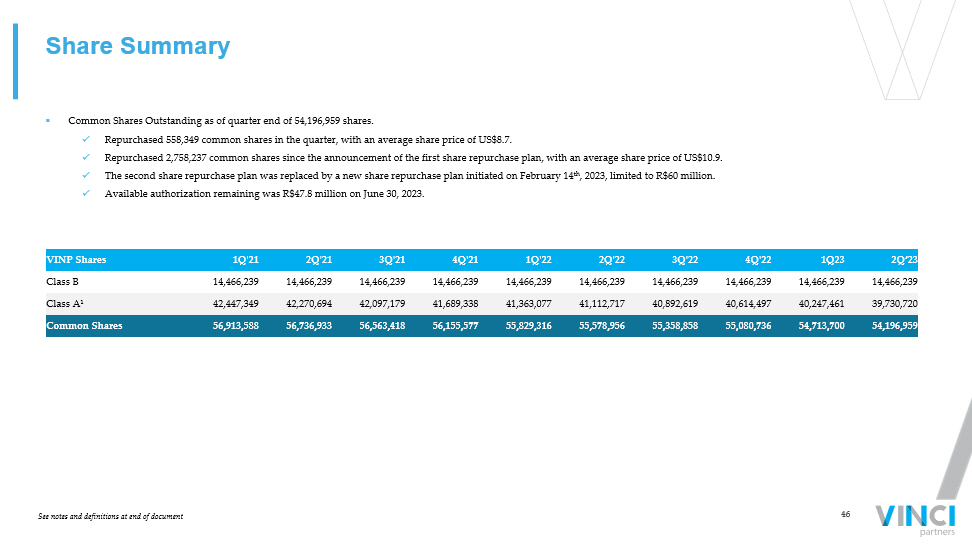
46 Share Summary ▪ Common Shares Outstanding as of quarter end of 54,196,959 shares. x Repurchased 558,349 common shares in the quarter, with an average share price of US$8.7. x Repurchased 2,758,237 common shares since the announcement of the first share repurchase plan, with an average share price of US $10.9. x The second share repurchase plan was replaced by a new share repurchase plan initiated on February 14 th , 2023, limited to R$60 million. x Available authorization remaining was R$47.8 million on June 30, 2023. VINP Shares 1Q ' 21 2Q ' 21 3Q ' 21 4Q'21 1Q'22 2Q'22 3Q'22 4Q'22 1Q23 2Q’23 Class B 14,466,239 14,466,239 14,466,239 14,466,239 14,466,239 14,466,239 14,466,239 14,466,239 14,466,239 14,466,239 Class A¹ 42,447,349 42,270,694 42,097,179 41,689,338 41,363,077 41,112,717 40,892,619 40,614,497 40,247,461 39,730,720 Common Shares 56,913,588 56,736,933 56,563,418 56,155,577 55,829,316 55,578,956 55,358,858 55,080,736 54,713,700 54,196,959 See notes and definitions at end of document
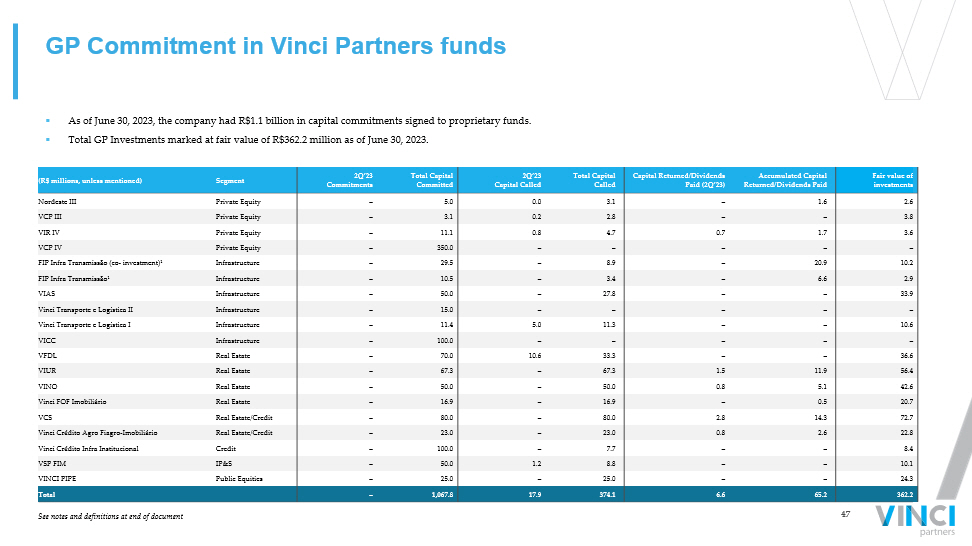
47 (R$ millions, unless mentioned) Segment 2Q’23 Commitments Total Capital Committed 2Q’23 Capital Called Total Capital Called Capital Returned/Dividends Paid (2Q’23) Accumulated Capital Returned/Dividends Paid Fair value of investments Nordeste III Private Equity – 5.0 0.0 3.1 – 1.6 2.6 VCP III Private Equity – 3.1 0.2 2.8 – – 3.8 VIR IV Private Equity – 11.1 0.8 4.7 0.7 1.7 3.6 VCP IV Private Equity – 350.0 – – – – – FIP Infra Transmissão ( co - investment)¹ Infrastructure – 29.5 – 8.9 – 20.9 10.2 FIP Infra Transmissão¹ Infrastructure – 10.5 – 3.4 – 6.6 2.9 VIAS Infrastructure – 50.0 – 27.8 – – 33.9 Vinci Transporte e Logística II Infrastructure – 15.0 – – – – – Vinci Transporte e Logística I Infrastructure – 11.4 5.0 11.3 – – 10.6 VICC Infrastructure – 100.0 – – – – – VFDL Real Estate – 70.0 10.6 33.3 – – 36.6 VIUR Real Estate – 67.3 – 67.3 1.5 11.9 56.4 VINO Real Estate – 50.0 – 50.0 0.8 5.1 42.6 Vinci FOF Imobiliário Real Estate – 16.9 – 16.9 – 0.5 20.7 VCS Real Estate/Credit – 80.0 – 80.0 2.8 14.3 72.7 Vinci Crédito Agro Fiagro - Imobiliário Real Estate/Credit – 23.0 – 23.0 0.8 2.6 22.8 Vinci Crédito Infra Institucional Credit – 100.0 – 7.7 – – 8.4 VSP FIM IP&S – 50.0 1.2 8.8 – – 10.1 VINCI PIPE Public Equities – 25.0 – 25.0 – – 24.3 Total – 1,067.8 17.9 374.1 6.6 65.2 362.2 GP Commitment in Vinci Partners funds ▪ As of June 30, 2023, the company had R$1.1 billion in capital commitments signed to proprietary funds. ▪ Total GP Investments marked at fair value of R$362.2 million as of June 30, 2023. See notes and definitions at end of document
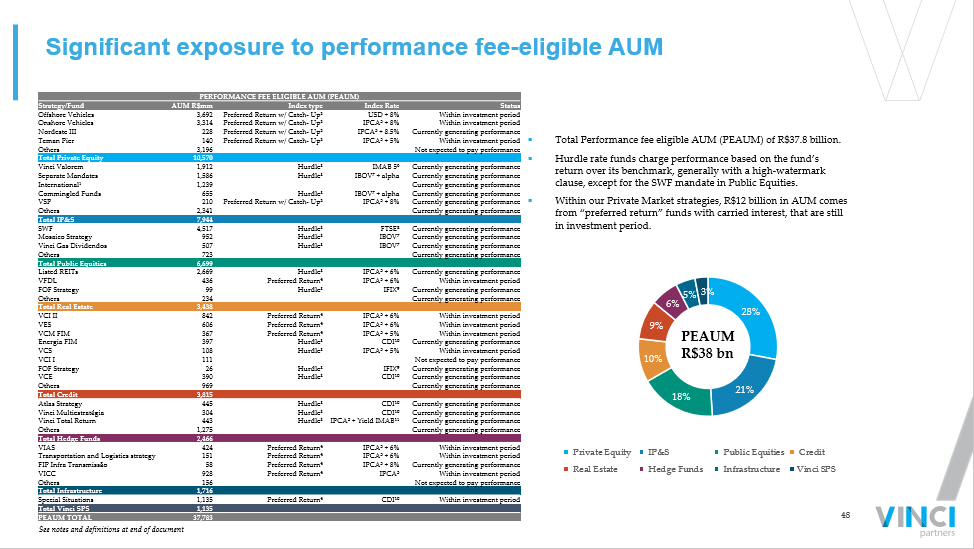
48 28% 21% 18% 10% 9% 6% 5% 3% Private Equity IP&S Public Equities Credit Real Estate Hedge Funds Infrastructure Vinci SPS PERFORMANCE FEE ELIGIBLE AUM (PEAUM) Strategy/Fund AUM R$mm Index type Index Rate Status Offshore Vehicles 3,692 Preferred Return w/ Catch - Up² USD + 8% Within investment period Onshore Vehicles 3,314 Preferred Return w/ Catch - Up² IPCA 5 + 8% Within investment period Nordeste III 228 Preferred Return w/ Catch - Up² IPCA 5 + 8.5% Currently generating performance Teman Pier 140 Preferred Return w/ Catch - Up² IPCA 5 + 5% Within investment period Others 3,196 Not expected to pay performance Total Private Equity 10,570 Vinci Valorem 1,912 Hurdle³ IMAB 5 6 Currently generating performance Separate Mandates 1,586 Hurdle³ IBOV 7 + alpha Currently generating performance International¹ 1,239 Currently generating performance Commingled Funds 655 Hurdle³ IBOV 7 + alpha Currently generating performance VSP 210 Preferred Return w/ Catch - Up² IPCA 5 + 8% Currently generating performance Others 2,341 Currently generating performance Total IP&S 7,944 SWF 4,517 Hurdle³ FTSE 8 Currently generating performance Mosaico Strategy 952 Hurdle³ IBOV 7 Currently generating performance Vinci Gas Dividendos 507 Hurdle³ IBOV 7 Currently generating performance Others 723 Currently generating performance Total Public Equities 6,699 Listed REITs 2,669 Hurdle³ IPCA 5 + 6% Currently generating performance VFDL 436 Preferred Return 4 IPCA 5 + 6% Within investment period FOF Strategy 99 Hurdle³ IFIX 9 Currently generating performance Others 234 Currently generating performance Total Real Estate 3,438 VCI II 842 Preferred Return 4 IPCA 5 + 6% Within investment period VES 606 Preferred Return 4 IPCA 5 + 6% Within investment period VCM FIM 367 Preferred Return 4 IPCA 5 + 5% Within investment period Energia FIM 397 Hurdle³ CDI 10 Currently generating performance VCS 108 Hurdle³ IPCA 5 + 5% Within investment period VCI I 111 Not expected to pay performance FOF Strategy 26 Hurdle³ IFIX 9 Currently generating performance VCE 390 Hurdle³ CDI 10 Currently generating performance Others 969 Currently generating performance Total Credit 3,815 Atlas Strategy 445 Hurdle³ CDI 10 Currently generating performance Vinci Multiestratégia 304 Hurdle³ CDI 10 Currently generating performance Vinci Total Return 443 Hurdle³ IPCA 5 + Yield IMAB 11 Currently generating performance Others 1,275 Currently generating performance Total Hedge Funds 2,466 VIAS 424 Preferred Return 4 IPCA 5 + 6% Within investment period Transportation and Logistics strategy 151 Preferred Return 4 IPCA 5 + 6% Within investment period FIP Infra Transmissão 58 Preferred Return 4 IPCA 5 + 8% Currently generating performance VICC 928 Preferred Return 4 IPCA 5 Within investment period Others 156 Not expected to pay performance Total Infrastructure 1,716 Special Situations 1,135 Preferred Return 4 CDI 10 Within investment period Total Vinci SPS 1,135 PEAUM TOTAL 37,783 Significant exposure to performance fee - eligible AUM ▪ Total Performance fee eligible AUM (PEAUM) of R$37.8 billion. ▪ Hurdle rate funds charge performance based on the fund’s return over its benchmark, generally with a high - watermark clause, except for the SWF mandate in Public Equities. ▪ Within our Private Market strategies, R$12 billion in AUM comes from “preferred return” funds with carried interest, that are still in investment period. PEAUM R$38 bn See notes and definitions at end of document
49 Notes and Definitions ▪ Notes to page 4 (1) As of June 30, 2023. AUM is calculated as consolidated with double counting, due to funds from one segment investing in o the r segments and it ´ s eliminated on consolidation and excluding double counting from co - managed funds between our segments. ▪ Notes to page 5 (1) Long term products include funds with former lockups superior to five years. (2) Private markets strategies include Private Equity, Real Estate, Credit, Vinci SPS and Infrastructure. ▪ Notes to page 7 (1) As of 2Q’23 YTD. (2) Adjusted Distributable Earnings per share is calculated as Distributable Earnings excluding non - operational expenses, consid ering the number of outstanding shares at the end of each quarter. (3) AUM is calculated as consolidated with double counting, due to funds from one segment investing in other segments and it ´ s eliminated on consolidation and excluding double counting from co - managed funds between our segments. (4) LTM Dividend Yield is calculated considering 0.73 dividend/share distributed over the last twelve months and a price clos e o f US$9.65/share as of August 14 th , 2023. ▪ Notes to page 8 (1) Starting from 2020, our official AUM is calculated on a consolidated basis, accounting for double counting resulting from fu nds from one segment investing in other segments and excluding double counting from co - managed funds between our segments. For periods preceding 2020, CAGR calculation utilizes AUM figure without double counting. (2) Source Bloomberg. (3) Source ANBIMA. (4) As of June 30, 2023, others include Private Equity (10%), Credit rights investment funds (5%), REITs (3%), Offshore (1%) and ETFs (1%). ▪ Notes to page 10 (1) LTM Dividend Yield is calculated considering 0.73 dividend/share distributed over the last twelve months and a price close US $9. 65/share as of August 14 th , 2023. ▪ Notes to page 13 (1) Accrued performance fees for the VCP offshore are as of 1Q’23. This occurs due to the 60 days timeline of the quarterly m ark up to be disclosed by the fund’s administrator.
50 Notes and Definitions (cont’d) ▪ Notes to page 14 (1) GP investment income comes from proprietary investments made by Vinci Partners in its own Private Markets’ funds and othe r c losed - end funds across Liquid Strategies and IP&S segments with long - term lockups. (2) Financial income is income generated through investments made with our cash and cash equivalents in cash and bank deposit s, certificate of deposits and proprietary investments in Vinci Partners’ Liquid Funds, including funds from Public Equities, Hedge Funds, Real Estate and Credit. ▪ Notes to page 15 (1) Adjusted after tax Distributable Earnings is calculated as Distributable Earnings excluding non - operational expenses. ▪ Notes to page 16 (1) FRE per share is calculated considering the number of outstanding shares at the end of the current quarter. Year - to - date val ues are calculated as the sum of the last two quarters. (2) Other financial expenses include the interest related to Vinci SPS’ acquisition. (3) Non - operational expenses are comprised of expenses related to professional services rendered in connection with acquisitions and our international corporate organization. (4) DE per share is calculated considering the number of outstanding shares at the end of the current quarter. Year - to - date valu es are calculated as the sum of the last two quarters. ▪ Notes to page 18 (1) AUM is calculated as consolidated with double counting, due to funds from one segment investing in other segments and it ´ s eliminated on consolidation and excluding double counting from co - managed funds between our segments. ▪ Notes to page 19 (1) Fund commitment and related co - investments. ▪ Notes to page 20 (1) CVM ( Comissão de Valores Mobiliários ) is the Brazilian equivalent to the SEC. ▪ Notes to page 21 (1) Including our public market vehicles. (2) As of 2Q’23 LTM. (3) Independent asset manager classification excludes any managers that are either affiliated with a bank franchise, global a sse t manager franchise, or a FoFs .
51 Notes and Definitions (cont’d) (4) Other alternative local asset managers include Patria and Kinea . (5) Other independent asset managers include Gavea , SPX and Jive Investments. (6) Hedge funds include JPG, Bahia, Verde and others. (7) Incumbent banks include Banco do Brasil, ITAU Unibanco , Bradesco, Santander, and Caixa. ▪ Notes to page 36 (1) Other items comprise the income/(loss) generated by contingent consideration adjustment and financial expenses related to ac quisitions. (2) Non - operational expenses are comprised of expenses related to professional services rendered in connection with acquisitions and our international corporate organization. (3) Income taxes are comprised of taxes calculated over our corporate income tax and social contribution taxes. We are taxed on an actual taxable profit regime, while part of our subsidiaries are taxed based on deemed profit. (4) Contingent consideration adjustment (after - tax) related to Vinci SPS’ acquisition, reflects the change in the earn out’s fai r value to be paid in 2027. On June 30, 2023, Vinci revaluated the fair value of the obligation based on the economic conditions at the date, resulting in an increase of the contingent consideratio n f air value. The variation was recognized as a loss in the financial result. ▪ Notes to page 38 (1) Brazilian tax law establishes that companies that generate gross revenues of up to R$ 78,000.00 in the prior fiscal year may calculate income taxes as a percentage of gross revenue, using the presumed profit income tax regime. The Entity's subsidiaries adopted this tax regime and the effect of the presumed profit of su bsidiaries represents the difference between the taxation based on this method and the amount that would be due based on the statutory rate applied to the taxable profit of the subsidiaries. ▪ Notes to page 43 (1) NAV is the net asset value of each fund. For listed vehicles, the NAV represents the Market valuation of the fund. (2) Atlas strategy includes the funds Atlas FIC FIM and Atlas Institucional FIC FIM. (3) Equilibrio Strategy incudes the IP&S Family of pension plans. (4) CDI is an average of interbank overnight rates in Brazil (daily average for the period). (5) Brazil stock market most relevant index. (6) IPCA is a broad consumer price index measured by the IBGE. (7) IMAB is composed by government bonds indexed to IPCA. IMAB 5 also includes government bonds indexed to IPCA with up to 5 Yea rs in duration.
52 Notes and Definitions (cont’d) (8) IFIX is an index composed by listed REITs in the Brazilian stock Market. (9) If IMAB 5 Average is: i . less or equal to 2%, X=3% per year; ii. between 2% - 4%, X= Average IMAB 5+1% per year; iii. Between 4% - 5%, X=5% per year; IV. g reater or equal to 5%, X= IMAB 5 Average ▪ Notes to page 44 (1) Track record information is presented throughout this presentation on a pro forma basis and in local currency, excluding PIP E investments, a strategy that will be discontinued in VCP III. (2) Total commitments for VCP III include R$1.3 billion in co - investments. Track record presented for the VCP strategy as of 1Q’ 23, due to fund’s administrator timeline to disclose the quarterly markup of the fund. (3) Track record for VIR strategy is presented as of 1Q’23, due to fund’s administrator timeline to disclose the quarterly ma rku p of the fund. (4) Track record for Vinci SPS strategy is presented as of 2Q’23. (5) Track record for FIP Infra is presented as of 1Q’23. (6) Track record for VIAS is presented as of 1Q’23. (7) Track record for VICC is presented as of 1Q’23. (8) Track record for VFDL is presented as of 2Q’23. (9) Track record for Vinci Credit Infra is presented as of 2Q’23. ▪ Notes to page 45 (1) US$ Distributable Earnings was calculated considering the exchange rate from USD to BRL of 4.9245, as of August 08, 2023, wh en dividends were approved by our Board of Directors. (2) Per Share calculations are based on end of period Participating Common Shares. (3) Actual dividends per common share are calculated considering the share count as of the applicable record date. ▪ Notes to page 46 (1) As of June 30, 2023, Public Float was comprised of 12,809,281 Class A common shares. ▪ Notes to page 47 (1) The remaining capital committed in FIP Infra Transmissão and FIP Infra Transmissão co - investment will not be called by the fund, which is already in divestment period.
53 Notes and Definitions (cont’d) ▪ Notes to page 48 (1) International mandates have several different benchmarks across its vehicles. (2) The preferred return w/ catch - up rule applies to funds for which the vehicle must pay back its limited partners 100% of the invested capital corrected by the preferred return rate so it can charge performance fees. Once the preferred return rate is achieved, due to the catch - up clause, performance fees are charged ov er the absolute return of the fund instead of the excess return over the preferred rate. (3) Hurdle Rate is the minimum return the fund must achieve before it can charge performance fees. In most cases, funds with hur dle rate also are under a high - water mark clause. (4) Funds with preferred return must return 100% of invested capital corrected by the preferred return rate to its limited pa rtn ers in order to charge performance fees. (5) IPCA is a broad consumer price index measured by the IBGE. (6) IMAB 5 is composed by government bonds indexed to IPCA with up to 5 years in duration. (7) IBOV is the Brazilian stock market's most relevant index; (8) FTSE is London's stock market most relevant index. (9) IFIX is an index composed by listed REITs in the Brazilian stock exchange. (10) The CDI rate is a result of the average interbank overnight rates in Brazil (daily average for the period). (11) IMAB is composed by government bonds indexed to IPCA (inflation rate) plus a fixed interest rate.
54 Notes and Definitions (cont’d.) ▪ “Fee related earnings”, or “FRE”, is a metric to monitor the baseline performance of, and trends in, our business, in a manne r t hat does not include performance fees or investment income. We calculate FRE as operating profit less (a) net revenue from realized performance fees, less (b) net revenue from unrealized p erf ormance fees, plus (c) compensation allocated in relation to performance fees. ▪ “FRE Margin” is calculated as FRE over total net management and advisory fees. ▪ “Distributable Earnings”, or “DE”, is used as a reference point by our board of directors for determining the amount of earni ngs available to distribute to shareholders as dividends. Distributable Earnings is calculated as profit for the year, less (a) net revenue from unrealized performance fees, plus (b) inc ome taxes from unrealized performance fees, plus (c) compensation allocated in relation to unrealized performance fees, less (d) unrealized gain from GP investment income, less (e) unrealized ga in from financial income, plus (f) income taxes on unrealized gain from GP investment income, plus (g) income taxes on unrealized gain from financial income. ▪ “DE Margin” is calculated as DE over the sum of management and advisory fee related revenues, realized performance revenue, r eal ized GP investment income and realized financial income, net of revenue tax. ▪ “Performance Related Earnings”, or “PRE”, is a performance measure that we use to assess our ability to generate profits from re venue that relies on outcome from funds above their respective benchmarks. We calculate PRE as operating profit, less (a) net revenue from fund management and advisory, less (b) operating exp enses, such as segment personnel, G&A, corporate center and bonus related to management and advisory. ▪ “Segment Distributable Earnings” is Vinci Partners’ segment profitability measure used to make operating decisions and assess pe rformance across the company’s four segments (Private Markets, Liquid Strategies, Investment Products and Solutions and Financial Advisory). Segment Distributable Earnings is calc ula ted as operating profit less (a) net revenue from unrealized performance fees, plus (b) compensation allocated in relation to unrealized performance fees, plus (c) realized gain from GP inv estment income. ▪ “AUM” refers to assets under management. Our assets under management equal the sum of: (1) the fair market value of the inves tme nts held by funds plus the capital that we are entitled to call from investors in those funds pursuant to the terms of their capital commitments to those funds (plus the fair market va lue of co - investments arranged by us that were made or could be made by limited partners of our corporate private equity funds and portfolio companies of such funds); (2) the net asset valu e o f our public equity funds, hedge funds and closed - end mutual funds; and (3) the amount of capital raised for our credit funds. AUM includes double counting related to funds from one segm ent that invest in funds from another segment. Those cases occur mainly due to (a) fund of funds of investment products and solutions segment, and (b) investment funds in general that inv est part of their cash in credit segment and hedge fund segment funds in order to maintain liquidity and provide for returns on cash. Such amounts are eliminated on consolidation. T he bylaws of the relevant funds prohibit double - charging fees on AUM across segments. Therefore, while our AUM by segment may double - count funds from one segment that invest in funds from anoth er segment, the revenues for any given segment do not include revenue in respect of assets managed by another segment, which means there are no intercompany eliminations on re ven ues in our results of operations. ▪ Net Cash and Investments include cash and cash equivalents and the fair value of investments in liquid funds and GP Fund Inve stm ents. Cash and cash equivalents include cash, certificate of deposits, which are issued by Banco Bradesco (credit rating AAA evaluated by Fitch Ratings) with interest rates from 99.5% to 10 1% of CDI.
55 Notes and Definitions (cont’d.) ▪ “Net revenue from Fund Management and Advisory” is a performance measure that we use to assess our ability to generate profit s f rom our fund management and advisory business without measuring for the outcomes from funds above their respective benchmarks. We calculate Net Revenue from Fund Management and Ad vis ory as net revenue from services rendered less (a) net revenue from realized performance fees and less (b) net revenue from unrealized performance fees. ▪ “Total compensation and benefits” is the result of the profit sharing paid to our employees as (a) bonus compensation related to management advisory and (b) performance - based compensation. ▪ “Segment personnel expenses” are composed of the salary - part compensation paid to employees and partners of our funds’ managemen t teams. ▪ “Corporate center expenses” are composed by the salary - compensation paid to employees and other general and administrative expen ses related to our support teams, such as research, risk, legal & compliance, investor relations, operations and ESG. ▪ “Other general and administrative expenses” is made up of third - party expenses, depreciation and amortization, travel and repres entation, marketing expenses, administrative fees, non - operating taxes, third - party consultants’ fees, such as legal and accounting, and office consumables. ▪ “GP investment income” is income from proprietary investments made by us in our own Private Markets’ funds, used as GP Commit men ts. ▪ “Financial income” is income generated through the investments made with our cash and cash equivalents in cash and bank depos its , certificate of deposits and proprietary investments in our Liquid Funds from our public equities and hedge funds’ segments and listed REITs from our real estate segment. ▪ “Leasing expenses” include costs from the company’s sub - leasing activities. ▪ “Income taxes” is comprised of taxes on our corporate income tax and social contribution taxes. We are taxed on an actual tax abl e profit regime, while part of our subsidiaries are taxed based on deemed profit. ▪ “Capital Subscription / (capital return)” represents the net capital commitments and capital returns from our Private Markets ’ c losed end and listed funds. ▪ “Net Inflows / (outflows)” represent the net inflows and outflows from our liquid funds from our liquid strategies, IP&S and cre dit segments. ▪ “Appreciation / (depreciation)” represents the net capital appreciation/depreciation from our funds, which refers to the incr eas e or decrease of the funds’ investment’s value. ▪ “MOIC” means multiple on invested capital, a ratio intended to represent how much value an investment has returned, and is ca lcu lated as realized value plus unrealized value, divided by the total amount invested, gross of expenses and fees. ▪ “IRR” means the internal rate of return, which is a discount rate that makes the net present value of all cash flows equal to ze ro in a discounted cash flow analysis.
56 Funds/strategies’ descriptions ▪ Vinci Multiestratégia : The fund seeks to achieve long - term returns by investing in fixed income assets, through strategies that imply interest rates and currency risks. ▪ Vinci Atlas: The fund seeks to achieve long - term returns by investing across all strategies within fixed income, equities, curre ncy, derivatives, commodities and other investment funds with no obligation of any class concentration. ▪ Vinci Mosaico FIA: Public Equities’ long only flagship strategy. The strategy seeks to achieve long - term returns above Brazilian equities mar ket ( Ibovespa ) based on a fundamental analysis. ▪ Vinci Gas Dividendos : Public Equities’ dividends flagship strategy. The strategy seeks to achieve long - term returns by investing in companies with a consistent history of paying dividends in the Brazilian stock market. ▪ Vinci Total Return: The fund seeks to achieve medium and long - term returns by investing most of its capital in the Brazilian sto ck market, through bottom up and top - down strategies. ▪ Vinci Valorem: IP&S flagship commingled fund with exposure to fixed income assets, foreign exchange currency and derivatives. ▪ Equilibrio Strategy: IP&S family of pension plan funds. The strategy seeks to achieve long - term returns by investing across all strategies within fixed income, equities, currency, derivatives, commodities and other investment funds, respecting limitations in regulation. ▪ Vinci Selection Equities: The fund seeks to beat the Brazilian stock market index by investing in other funds that invest in Bra zilian public equities. ▪ Vinci Crédito Imobiliário I: The fund seeks to achieve long - term returns by investing in real estate mortgage - backed credit security bonds. ▪ Vinci Crédito Estruturado Multiestratégia PLUS FIC FIM: The fund seeks to achieve consistent returns by investing in private structured credit bonds. ▪ VISC11: Shopping malls listed REIT, focused on acquiring income - generating shopping malls in Brazil. ▪ VILG11: Industrial listed REIT focused on acquiring mature income - generating industrial properties in Brazil. ▪ VINO11: Listed REIT focused on acquiring mature income - generating boutique office real estate assets in Brazil. ▪ VIF11: Listed REIT that invests in other listed REITs and real estate mortgage - backed credit security bonds. ▪ VIUR11: perpetual capital listed REIT, focused on income generation to its quota holders through the acquisition of urban com mer cial properties in Brazil, such as street retail, grocery, healthcare, and educational focused real estate properties. ▪ VCRI11: Listed REIT that aims to invest in MBS, while also being able to invest in listed REITs with similar investment strat egi es. ▪ VICA11: VICA is a perpetual capital fund that shall invest in a diversified credit portfolio within the Agri sector in Brazil . ▪ Vinci FOF Imobiliário : Fund of Funds that invests in other listed REITs, combining income with capital gain.
Rio de Janeiro 55 21 2159 6000 Av. Bartolomeu Mitre, 336 Leblon - 22431 - 002 São Paulo 55 11 3572 3700 Av. Brigadeiro Faria Lima, 2.277 14 o andar Jardim Paulistano - 01452 - 000 Recife 55 81 3204 6811 Av. República do Líbano, 251 - Sala 301 Torre A - Pina - 51110 - 160 Nova York 1 646 559 8000 780 Third Avenue, 25 th Floor - 10017 Rio de Janeiro 55 21 2159 6000 Av. Bartolomeu Mitre, 336 Leblon – 22431 - 002 São Paulo 55 11 3572 3700 Av. Brigadeiro Faria Lima, 2.277 – 14 o andar Jardim Paulistano – 01452 - 000 55 11 3230 2541 | Vinci SPS Rua Iguatemi , 448 – CJ 601 Itaim Bibi – 01451 - 010 55 16 2101 4641 | Ribeirão Preto Av. Presidente Vargas, 2.121 – Sala 106 Jardim América – 14020 - 260 Recife 55 81 3204 6811 Av. República do Libano , 251 – Sala 301 – Torre A Pina – 51110 - 160 New York 1 646 559 8000 780 Third Avenue, 25 th Floor 10017
Vinci Partners Investments (NASDAQ:VINP)
Gráfica de Acción Histórica
De Abr 2024 a May 2024

Vinci Partners Investments (NASDAQ:VINP)
Gráfica de Acción Histórica
De May 2023 a May 2024
