UNITED STATES
SECURITIES AND EXCHANGE COMMISSION
Washington, D.C. 20549
FORM 6-K
REPORT OF FOREIGN
PRIVATE ISSUER PURSUANT TO RULE 13a-16 OR 15d-16 UNDER THE SECURITIES EXCHANGE ACT OF 1934
For the month of May 2024
Commission File
Number: 001-39938
Vinci Partners Investments Ltd.
(Exact name of registrant as specified in its
charter)
Av. Bartolomeu Mitre, 336
Leblon – Rio de Janeiro
Brazil 22431-002
+55 (21) 2159-6240
(Address of principal executive office)
Indicate by check mark whether the registrant files
or will file annual reports under cover of Form 20-F or Form 40-F:
TABLE OF CONTENTS
SIGNATURE
Pursuant to the requirements of the Securities
Exchange Act of 1934, the registrant has duly caused this report to be signed on its behalf by the undersigned, thereunto duly authorized.
| |
|
Vinci Partners Investments Ltd. |
| |
|
|
| |
|
|
| |
|
|
By: |
/s/ Sergio Passos Ribeiro |
| |
|
|
|
Name: |
Sergio Passos Ribeiro |
| |
|
|
|
Title: |
Chief Financial Officer |
Date: May 9, 2024
Exhibit 99.1

First Quarter 2024 Earnings Presentation May 09, 2024
Disclaimer This presentation contains forward - looking statements that can be identified by the use of words such as “anticipate,” “believe,” “could,” “expect,” “should,” “plan,” “intend,” “estimate” and “potential,” among others . By their nature, forward - looking statements are necessarily subject to a high degree of uncertainty and involve known and unknown risks, uncertainties, assumptions and other factors because they relate to events and depend on circumstances that will occur in the future whether or not outside of our control . Such factors may cause actual results, performance or developments to differ materially from those expressed or implied by such forward - looking statements and there can be no assurance that such forward - looking statements will prove to be correct . Accordingly, you should not place undue reliance on forward - looking statements . The forward - looking statements included herein speak only as at the date of this presentation and we do not undertake any obligation to update these forward - looking statements . Past performance does not guarantee or predict future performance . Moreover, neither we nor our affiliates, officers, employees and agents undertake any obligation to review, update or confirm expectations or estimates or to release any revisions to any forward - looking statements to reflect events that occur or circumstances that arise in relation to the content of the presentation . Further information on these and other factors that could affect our financial results is included in filings we have made and will make with the U . S . Securities and Exchange Commission (the “SEC”) from time to time, including in the section titled “Risk Factors” in our latest fillings with the SEC . These documents are available on the SEC Filings section of the investor relations section of our website at : https : //ir . vincipartners . com/financials/sec - filings . We have prepared this presentation solely for informational purposes . The information in this presentation does not constitute or form part of, and should not be construed as, an offer or invitation to subscribe for, underwrite or otherwise acquire, any of our securities or securities of our subsidiaries or affiliates, not should it or any part of it form the basis of, or be relied on, in connection with any contract to purchase or subscribe for any of our securities or securities of any of our subsidiaries or affiliates, nor shall it or any part of it form the basis of, or be relied on, in connection with any contract or commitment whatsoever . This presentation also includes certain non - GAAP financial information . We believe that such information is meaningful and useful in understanding the activities and business metrics of our operations . We also believe that these non - GAAP financial measures reflect an additional way of viewing aspects of our business that, when viewed with our International Financial Reporting Standards (“IFRS”) results, as issued by the International Accounting Standards Board, provide a more complete understanding of factors and trends affecting our business . Further, investors regularly rely on non - GAAP financial measures to assess operating performance and such measures may highlight trends in our business that may not otherwise be apparent when relying on financial measures calculated in accordance with IFRS . We also believe that certain non - GAAP financial measures are frequently used by securities analysts, investors and other interested parties in the evaluation of public companies in our industry, many of which present these measures when reporting their results . The non - GAAP financial information is presented for informational purposes and to enhance understanding of the IFRS financial statements . The non - GAAP measures should be considered in addition to results prepared in accordance with IFRS, but not as a substitute for, or superior to, IFRS results . As other companies may determine or calculate this non - GAAP financial information differently, the usefulness of these measures for comparative purposes is limited . A reconciliation of such non - GAAP financial measures to the nearest GAAP measure is included in this presentation . 2

3 Presenters Alessandro Horta Chief Executive Officer Sergio Passos Chief Operating Officer & Chief Financial Officer Bruno Zaremba Private Equity Chairman & Head of Investor Relations

Opening Remarks

5 R$ 4.3 bn Capital Subscriptions 1Q’24 LTM 6 6 6 6 6 Vinci Partners First Quarter 2024 Highlights See notes and definitions at end of document Vinci Partners ended the first quarter with R$69 bn in AUM¹, a 11% growth year - over - year, led by R$4.3 billion in capital subscriptions over the last twelve months across Private Markets funds. Fee Related Earnings (FRE) totaled R$54 million in the quarter, or R$1.01 per share² , up 12% year - over - year on a per share basis . Vinci announced a quarterly distribution of US$0.17 per common share. US$ 0.17 Quarterly Dividend Vinci Partners announced in March the business combination with Compass, creating the gateway to alternative asset management in Latin America. Combined AUM³ of +US$50 bn and strong diversification effect through complementary products and solutions with broader geographic coverage and funding Transaction to expand Vinci’s geographic footprint into a true Pan - regional platform Enhance the distribution of Vinci’s products in Latin America through Compass’ unmatched platform Mindset and cultural alignment between partners and senior management catalyzing superior execution Immediately accretive to FRE/Share R$ 69 bn AUM 1Q’24 + 11 % YoY R$ 54 mm (R$1.01/share) FRE 1Q’24 + 12 % YoY
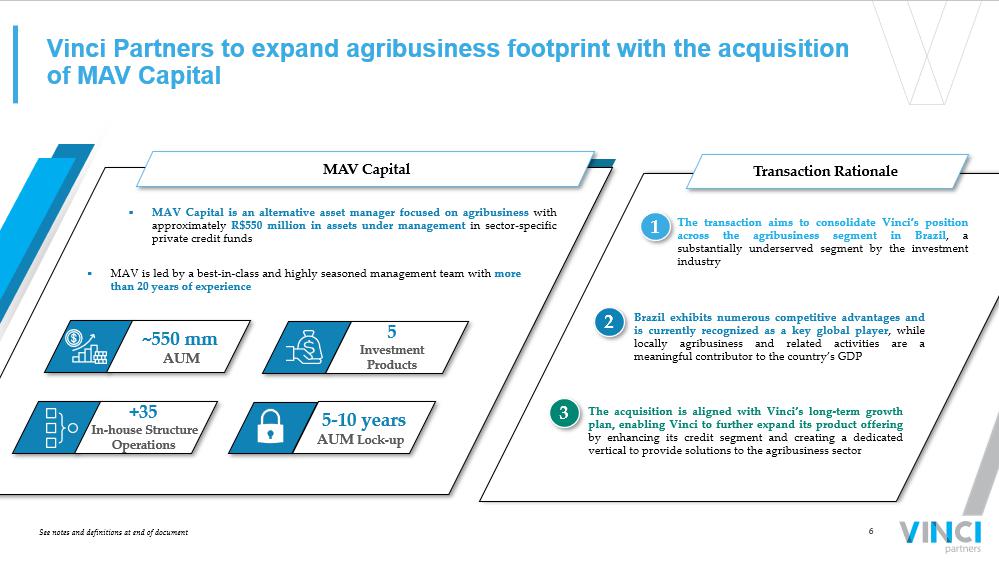
6 Vinci Partners to expand agribusiness footprint with the acquisition of MAV Capital See notes and definitions at end of document Vinci brand recognition MAV Capital Transaction Rationale ▪ MAV Capital is an alternative asset manager focused on agribusiness with approximately R $ 550 million in assets under management in sector - specific private credit funds ▪ MAV is led by a best - in - class and highly seasoned management team with more than 20 years of experience ▪ The transaction aims to consolidate Vinci’s position across the agribusiness segment in Brazil , a substantially underserved segment by the investment industry ▪ Brazil exhibits numerous competitive advantages and is currently recognized as a key global player , while locally agribusiness and related activities are a meaningful contributor to the country’s GDP ▪ The acquisition is aligned with Vinci’s long - term growth plan, enabling Vinci to further expand its product offering by enhancing its credit segment and creating a dedicated vertical to provide solutions to the agribusiness sector 1 2 3 +35 In - house Structure Operations 5 Investment Products ~550 mm AUM 5 - 10 years AUM Lock - up

7 2024 Unlocking Growth: We are focused on delivering growth through strategic partnerships and acquisitions 2021 2022 Acquisition of SPS Capital A new chapter in our product offering capabilities with the expansion into Opportunistic Capital Solutions, a sizable addressable market in Brazil. 2024 + US$ 37 bn AUM¹ 2023 + R$550 mm AUM + R$2 bn AUM Strategic Partnership with Ares Forming a strategic partnership to accelerate growth of Vinci’s platform in Latin America. + US$100 mm Investment Combination with Compass Consolidating Vinci’s position as the gateway to alternative investments in Latin America. A natural step to expand Vinci’s geographic footprint into a Pan - regional platform. 2024 - 2025 What will drive future growth? Vinci continues to explore inorganic growth opportunities, both in Brazil and in Latam , in order to complete its product offering and geographic positioning. Acquisition of MAV Capital The transaction reinforces Vinci's position across the Agribusiness sector, an underserved segment by the Investment Industry in Brazil. Vinci Partners’ IPO

Financial Highlights
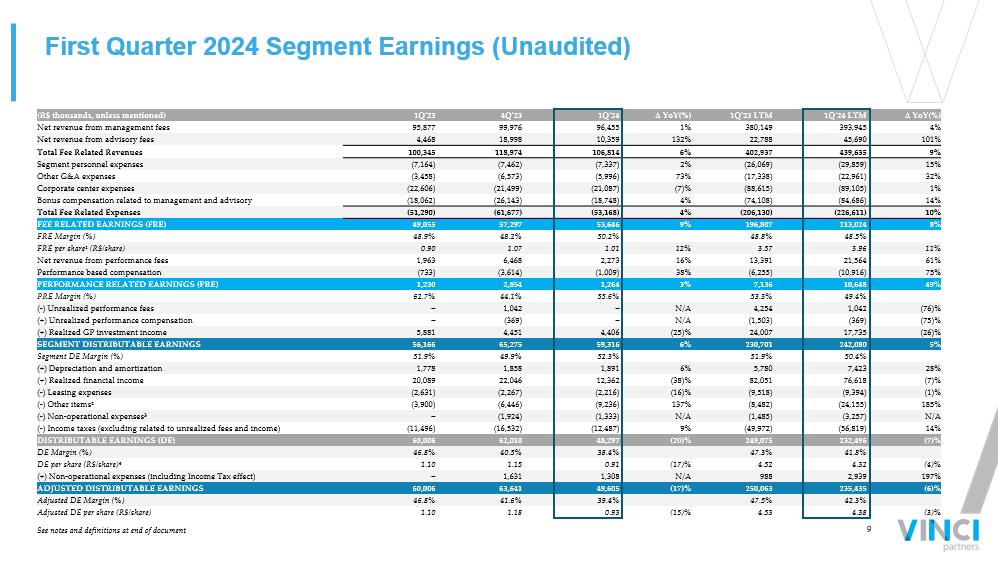
9 First Quarter 2024 Segment Earnings (Unaudited) See notes and definitions at end of document ∆ YoY(%) 1Q'24 LTM 1Q'23 LTM ∆ YoY(%) 1Q'24 4Q'23 1Q'23 (R$ thousands, unless mentioned) 4% 393,945 380,149 1% 96,455 99,976 95,877 Net revenue from management fees 101% 45,690 22,788 132% 10,359 18,998 4,468 Net revenue from advisory fees 9% 439,635 402,937 6% 106,814 118,974 100,345 Total Fee Related Revenues 15% (29,859) (26,069) 2% (7,337) (7,462) (7,164) Segment personnel expenses 32% (22,961) (17,338) 73% (5,996) (6,573) (3,458) Other G&A expenses 1% (89,105) (88,615) (7)% (21,087) (21,499) (22,606) Corporate center expenses 14% (84,686) (74,108) 4% (18,748) (26,143) (18,062) Bonus compensation related to management and advisory 10% (226,611) (206,130) 4% (53,168) (61,677) (51,290) Total Fee Related Expenses 8% 213,024 196,807 9% 53,646 57,297 49,055 FEE RELATED EARNINGS (FRE) 48.5% 48.8% 50.2% 48.2% 48.9% FRE Margin (%) 11% 3.96 3.57 12% 1.01 1.07 0.90 FRE per share¹ (R$/share) 61% 21,564 13,391 16% 2,273 6,468 1,963 Net revenue from performance fees 75% (10,916) (6,255) 38% (1,009) (3,614) (733) Performance based compensation 49% 10,648 7,136 3% 1,264 2,854 1,230 PERFORMANCE RELATED EARNINGS (PRE) 49.4% 53.3% 55.6% 44.1% 62.7% PRE Margin (%) (76)% 1,042 4,254 N/A – 1,042 – ( - ) Unrealized performance fees (75)% (369) (1,503) N/A – (369) – (+) Unrealized performance compensation (26)% 17,735 24,007 (25)% 4,406 4,451 5,881 (+) Realized GP investment income 5% 242,080 230,701 6% 59,316 65,275 56,166 SEGMENT DISTRIBUTABLE EARNINGS 50.4% 51.9% 52.3% 49.9% 51.9% Segment DE Margin (%) 28% 7,423 5,780 6% 1,891 1,858 1,778 (+) Depreciation and amortization (7)% 76,618 82,051 (38)% 12,362 22,046 20,089 (+) Realized financial income (1)% (9,394) (9,518) (16)% (2,216) (2,267) (2,631) ( - ) Leasing expenses 185% (24,155) (8,482) 137% (9,236) (6,446) (3,900) ( - ) Other items² N/A (3,257) (1,485) N/A (1,333) (1,924) – ( - ) Non - operational expenses³ 14% (56,819) (49,972) 9% (12,487) (16,532) (11,496) ( - ) Income taxes (excluding related to unrealized fees and income) (7)% 232,496 249,075 (20)% 48,297 62,010 60,006 DISTRIBUTABLE EARNINGS (DE) 41.8% 47.3% 38.4% 40.5% 46.8% DE Margin (%) (4)% 4.32 4.52 (17)% 0.91 1.15 1.10 DE per share (R$/share)⁴ 197% 2,939 988 N/A 1,308 1,631 – (+) Non - operational expenses (including Income Tax effect) (6)% 235,435 250,063 (17)% 49,605 63,641 60,006 ADJUSTED DISTRIBUTABLE EARNINGS 42.3% 47.5% 39.4% 41.6% 46.8% Adjusted DE Margin (%) (3)% 4.38 4.53 (15)% 0.93 1.18 1.10 Adjusted DE per share (R$/share)
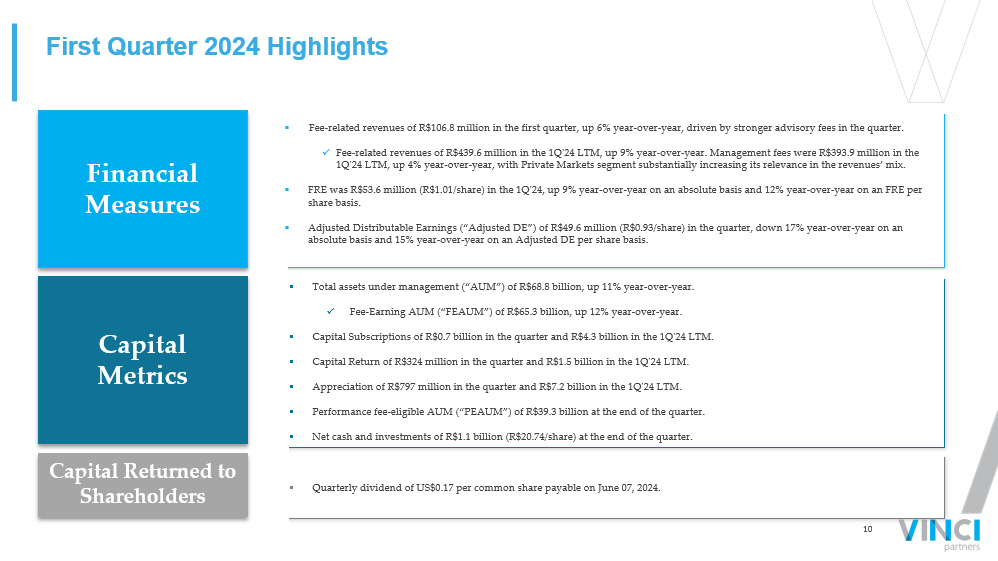
10 ▪ Fee - related revenues of R$1 06 .8 million in the first quarter, up 6 % year - over - year, driven by stronger advisory fees in the quarter. x Fee - related revenues of R$439.6 million in the 1Q'24 LTM, up 9% year - over - year. Management fees were R$393.9 million in the 1Q'24 LTM, up 4% year - over - year, with Private Markets segment substantially increasing its relevance in the revenues’ mix. ▪ FRE was R$ 53 . 6 million (R$1.01/share) in the 1 Q'24, up 9 % year - over - year on an absolute basis and 12% year - over - year on an FRE per share basis. ▪ Adjusted Distributable Earnings (“Adjusted DE”) of R$49.6 million (R$0.93/share) in the quarter, down 17% year - over - year on an absolute basis and 15% year - over - year on an Adjusted DE per share basis. ▪ Total assets under management (“AUM”) of R$68.8 billion, up 11 % year - over - year. x Fee - Earning AUM (“FEAUM”) of R$65.3 billion, up 12% year - over - year. ▪ Capital Subscriptions of R$0.7 billion in the quarter and R$4.3 billion in the 1Q'24 LTM . ▪ Capital Return of R$324 million in the quarter and R$1.5 billion in the 1Q'24 LTM . ▪ Appreciation of R$797 million in the quarter and R$7.2 billion in the 1Q'24 LTM . ▪ Performance fee - eligible AUM (“PEAUM”) of R$39.3 billion at the end of the quarter. ▪ Net cash and investments of R$1.1 billion (R$20.74/share) at the end of the quarter. First Quarter 2024 Highlights Financial Measures Capital Metrics Capital Returned to Shareholders ▪ Quarterly dividend of US$0.17 per common share payable on June 07, 2024.

11 25 30 26 26 7 10 58 65 1Q'23 1Q'24 Private Markets IP&S Public Equities 28 33 27 26 7 10 62 69 1Q'23 1Q'24 Private Markets IP&S Public Equities AUM 1Q’24 vs 1Q’23 ( R$bn ) Long - Term AUM¹ 1Q’24 vs 1Q’23 ( R$bn ) Fee - Earning AUM 1Q’24 vs 1Q’23 ( R$bn ) We continue to see AUM expansion across the platform, with highlight to long - term products ▪ Total assets under management (AUM) of R$69 billion, up 11% year - over - year, driven by a combination of R$4.3 billion of new capi tal subscriptions in Private Markets funds and AUM appreciation across Public Equities and IP&S funds. This growth was partially offset by outflows from our IP&S segment, comin g m ostly from open - ended products in the Pension Plan strategy. ▪ Total Fee - Earning AUM (FEAUM) of R$65.3 billion, up 12% year - over - year. ▪ Total Long - Term AUM of R$37.9 billion in the 1Q’24, up 21% year - over - year. Long - term AUM currently represents 55% of Vinci’s tot al AUM and has been growing at a faster pace, driven by fundraisings across private market funds that carry longer lockups. + 11% + 12% + 21% See notes and definitions at end of document 22 25 3 4 7 9 31 38 1Q'23 1Q'24 5-10 Years 10+ Years Perpetual or quasi-perpetual

12 57% 18% 15% 9% 48% 38% 14% AUM 1Q’24 Our AUM base favors alpha - driven strategies, while our revenue profile is management fee - centric Our platform is highly diversified across different strategies and clients 57 % of net revenues come from private market strategies ² 55 % of AUM is in long term products¹ AUM diversified across five different distribution channels AUM 1Q’24 Net Revenues 1Q'24 LTM See notes and definitions at end of document 4 5 6 7 38% 21% 20% 11% 10% Local Institutional³ HNWI Institutional Offshore Allocators & Distributors Public market vehicles

13 84% 7% 9% Private Equity Infrastructure Vinci SPS Vinci holds a strong long - term upside from realization of performance fees in private market funds Gross Accrued Performance Fees – Private Market Funds ▪ Accrued performance fees receivable of R$294.4 million in the 1Q’24, up 6% quarter - over - quarter. ▪ The VCP strategy¹ in Private Equity accounted for R$240.8 million in accrued performance fees, or 82% of total accrued perfor man ce fees. ▪ Vinci Partners had, as of 1Q’24, R$7 billion in performance eligible AUM coming from Private Markets’ funds still within inve stm ent period. ▪ Accrued performance fees coming from the Infrastructure strategy are the only fees booked as unrealized in the company's bala nce sheet as of the first quarter of 2024, following IFRS 15 rules. The outstanding accrued performance fees balance reflects the funds' most recent mark and are not booked in the company's bal anc e sheet yet. R$294 mm Accrued Performance Fees (R$ mm) Accrued Performance Fees by Strategy (%) Vinci Partners recognizes the performance revenue according to IFRS 15 . Unrealized performance fees are recognized only when is highly probable that the revenue will not be reversed in the Income Statement . The fund FIP Infra Transmissão in Infrastructure had R $ 14 . 4 million as of the end of the first quarter of 2024 booked as unrealized performance fees in the company ´ s balance sheet . Accrued performance fees shown for Private Equity funds of R $ 245 . 7 million and for the Infrastructure fund VIAS, of R $ 6 . 6 million, as of the end of the first quarter of 2024 have not been booked as unrealized performance fees in the company ´ s balance sheet . See notes and definitions at end of document

14 Our GP Commitments are a long - term strong value creator ▪ As of 1Q’24, Vinci Partners had R$1.1 billion in capital commitments signed to proprietary funds mostly across Private Equity , I nfrastructure, Credit and Real Estate. ▪ Realized investment gains are recognized quarterly as GP Investment Income in our Segment Earnings and we believe will be a r ele vant contributor to our Distributable Earnings as the funds enter their divestment periods. ▪ Vinci Partners had R$4.4 million in Realized GP Investment Income in the quarter, or R$0.08 per share, coming from dividend d ist ributions across our GP Commitments in REITs. Fair Value of Investment (R$ mm) GP Commitments Overview See notes and definitions at end of document Per share R$9.30 R$7.94 Total Capital Committed R$1.1 billion Total Capital Called R$495 million Accum. Capital Returned R$81 million ~R$12 million, or R$0.23 per share, after - tax Distributable Earnings Impact if Realized at Fair Value. Fair Value of Investments R$495 million Principal and Capital Gain

15 Fee Related Revenues Management fees remain the main contributor to revenues, accounting for 85% of total revenues over the 1Q'24 LTM. ▪ Fee related revenues totaled R$440 million in the 1Q'24 LTM, up 9% when compared to the 1Q'23 LTM, driven by strong fundraisi ng across Private Markets' products and a higher level of advisory fees. ▪ Management fees for the quarter remained flat on a year - over - year basis. Although Private Markets revenues continue to grow and push FRE for the platform, IP&S have suffered headwinds caused by tougher macro conditions. ▪ Advisory fees accounted for R$10 million in the quarter. Over the past twelve months, advisory fees totaled R$46 million, up 101 % year - over - year, driven by a pickup in deal activity. Fee Related Revenues 1Q’24 vs. 1Q’23 ( R$mm ) Fee Related Revenues 1Q'24 LTM vs. 1Q'23 LTM (R$mm) + 9% + 6% 380 394 23 46 403 440 1Q'23 LTM 1Q'24 LTM Management fees Advisory fees 96 96 4 10 100 107 1Q'23 1Q'24 Management fees Advisory fees
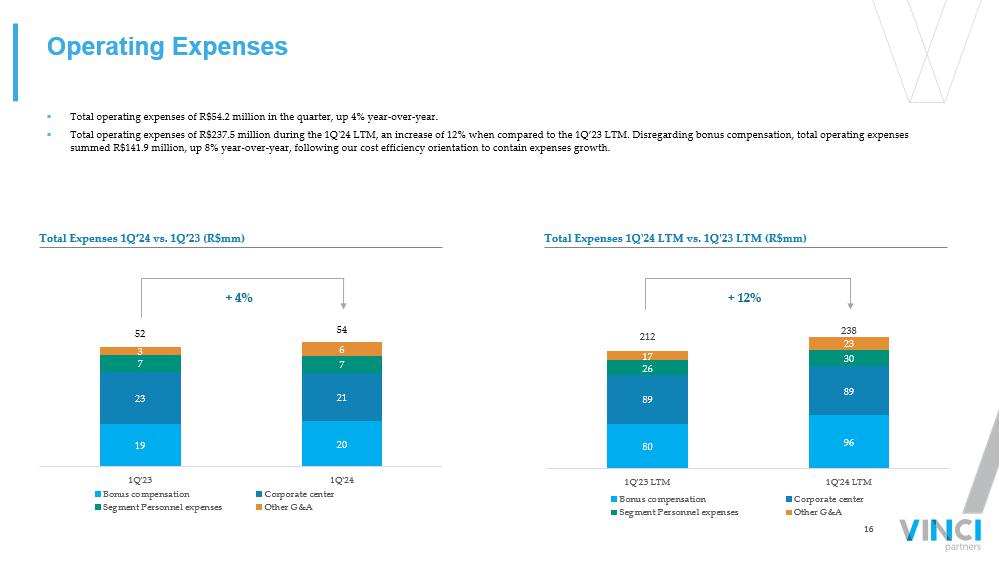
16 Operating Expenses ▪ Total operating expenses of R$54.2 million in the quarter, up 4% year - over - year. ▪ Total operating expenses of R$237.5 million during the 1Q'24 LTM, an increase of 12% when compared to the 1Q’23 LTM. Disregar din g bonus compensation, total operating expenses summed R$141.9 million, up 8% year - over - year, following our cost efficiency orientation to contain expenses growth. Total Expenses 1Q'24 LTM vs. 1Q'23 LTM ( R$mm ) + 12% + 4% Total Expenses 1Q’24 vs. 1Q’23 ( R$mm ) 80 96 89 89 26 30 17 23 212 238 1Q'23 LTM 1Q'24 LTM Bonus compensation Corporate center Segment Personnel expenses Other G&A 19 20 23 21 7 7 3 6 52 54 1Q'23 1Q'24 Bonus compensation Corporate center Segment Personnel expenses Other G&A
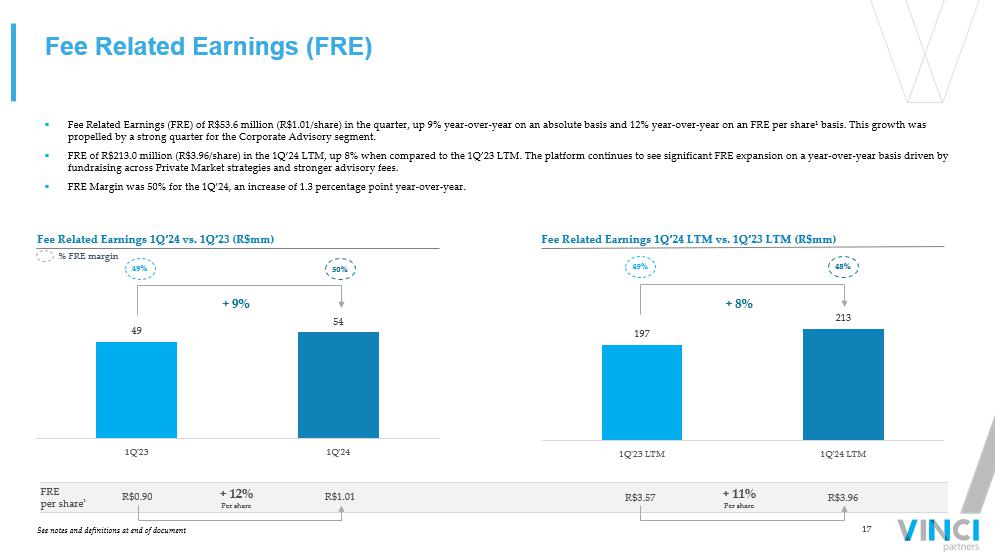
17 Fee Related Earnings (FRE) ▪ Fee Related Earnings (FRE) of R$53.6 million (R$1.01/share) in the quarter, up 9% year - over - year on an absolute basis and 12% ye ar - over - year on an FRE per share¹ basis. This growth was propelled by a strong quarter for the Corporate Advisory segment. ▪ FRE of R$213.0 million (R$3.96/share) in the 1Q’24 LTM, up 8% when compared to the 1Q’23 LTM. The platform continues to see s ign ificant FRE expansion on a year - over - year basis driven by fundraising across Private Market strategies and stronger advisory fees. ▪ FRE Margin was 50% for the 1Q’24, an increase of 1.3 percentage point year - over - year. See notes and definitions at end of document FRE per share ¹ R$1.01 R$0.90 R$3.96 R$3.57 48 % 49% Fee Related Earnings 1Q’24 vs. 1Q’23 ( R$mm ) Fee Related Earnings 1Q’24 LTM vs. 1Q’23 LTM ( R $mm) % FRE margin + 9% 50% 49% + 12% Per share + 11% Per share 49 54 1Q'23 1Q'24 197 213 1Q'23 LTM 1Q'24 LTM + 8%
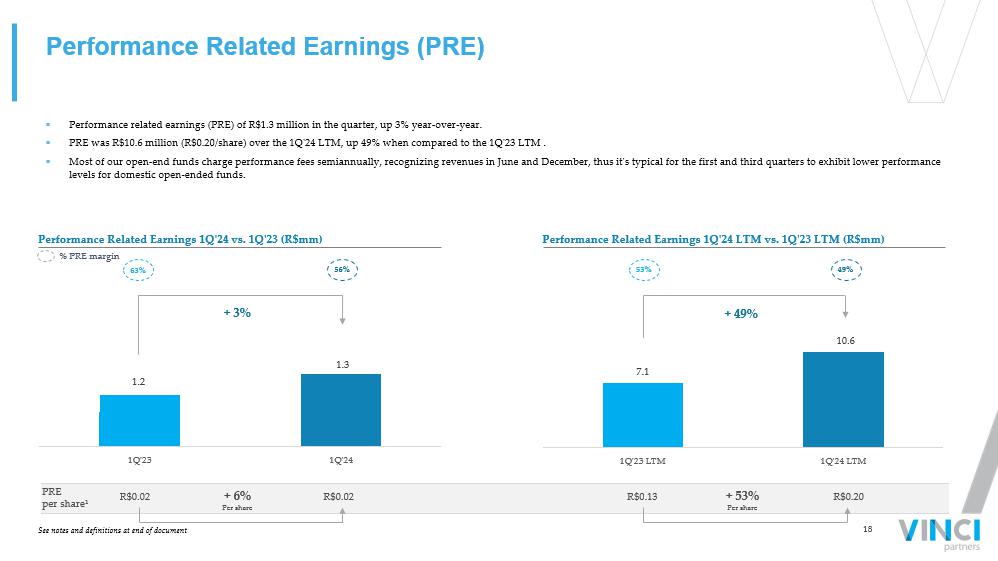
18 Performance Related Earnings (PRE) ▪ Performance related earnings (PRE) of R$1.3 million in the quarter, up 3% year - over - year. ▪ PRE was R$10.6 million (R$0.20/share) over the 1Q'24 LTM, up 49% when compared to the 1Q'23 LTM . ▪ Most of our open - end funds charge performance fees semiannually, recognizing revenues in June and December, thus it's typical fo r the first and third quarters to exhibit lower performance levels for domestic open - ended funds. Performance Related Earnings 1Q'24 vs. 1Q'23 ( R$mm ) Performance Related Earnings 1Q'24 LTM vs. 1Q'23 LTM ( R$mm ) % PRE margin 49% 53% R$0.02 R$0.02 R$0.13 R$0.20 See notes and definitions at end of document 56% 63% + 6% Per share + 53% Per share PRE per share¹ + 3% + 49% 1 .2 1.3 1Q'23 1Q'24 7.1 10.6 1Q'23 LTM 1Q'24 LTM

19 Realized GP Investment and Financial income ▪ Realized GP Investment¹ and Financial income² of R$16.8 million in the 1Q'24, a 35% decrease compared to the previous year. T he global macroeconomic uncertainty adversely affected local markets during the quarter, consequently impacting the portfolio of liquid funds. ▪ Realized GP Investment¹ income of R$4.4 million in the quarter, stemming from dividend distributions of the company’s proprie tar y stake in listed REITs. ▪ Realized GP Investment¹ and Financial income² accounted for R$94.4 million over the 1Q'24 LTM, down 11% when compared to the 1Q' 23 LTM. See notes and definitions at end of document Realized GP Investment¹ and Financial income² 1Q'24 vs. 1Q'23 ( R$mm ) (11)% Realized GP Investment¹ and Financial income² 1Q'24 LTM vs. 1Q'23 LTM ( R$mm ) (35)% 20 12 6 4 26 17 1Q'23 1Q'24 Realized Financial Income Realized GP Investment Income 82 77 24 18 106 94 1Q'23 LTM 1Q'24 LTM Realized Financial Income Realized GP Investment Income
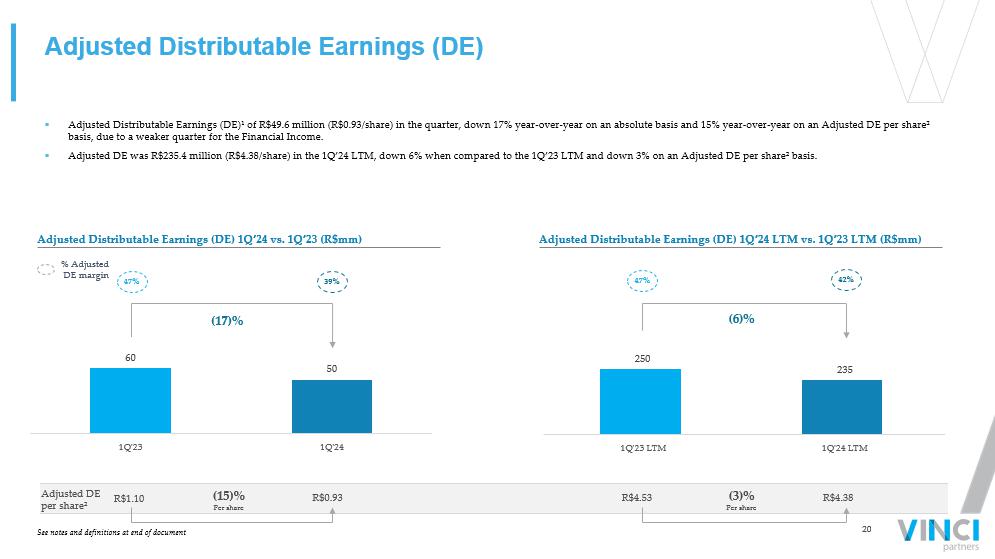
20 Adjusted Distributable Earnings (DE) ▪ Adjusted Distributable Earnings (DE)¹ of R$49.6 million (R$0.93/share) in the quarter, down 17% year - over - year on an absolute ba sis and 15% year - over - year on an Adjusted DE per share² basis, due to a weaker quarter for the Financial Income. ▪ Adjusted DE was R$235.4 million (R$4.38/share) in the 1Q’24 LTM, down 6% when compared to the 1Q’23 LTM and down 3% on an Adj ust ed DE per share² basis. Adjusted Distributable Earnings (DE) 1Q’24 vs. 1Q’23 ( R$mm ) Adjusted Distributable Earnings (DE) 1Q’24 LTM vs. 1Q’23 LTM ( R$mm ) (17)% % Adjusted DE margin R$1.10 R$0.93 (6)% 42 % 47% R$4.53 R$4.38 See notes and definitions at end of document 39% 47% (15)% Per share (3)% Per share Adjusted DE per share² 60 50 1Q'23 1Q'24 250 235 1Q'23 LTM 1Q'24 LTM

21 1Q'24 4Q'23 Share Repurchase Activity (in R$ million, unless mentioned) 533,981 93,249 Total Shares Repurchased (number of shares) 28.0 5.0 Total Capital Used for Share Repurchases 32.0 0.0 Remaining Share Repurchase Plan Authorization 10.6 10.5 Average Price Paid Per Share (US$) 1Q'24 4Q'23 (in R$ millions, unless mentioned) 532.0 660.3 Cash and cash equivalents¹ 1,134.8 1,175.5 Net Investments 639.8 748.5 Liquid funds² 495.0 427.0 GP Fund Investments³ (562.5) (552.7) Debt obligations 4 1,104.4 1,283.1 Net Cash and Investments 20.74 23.86 Net Cash and Net Investments per share⁵ (R$/share) Balance Sheet Highlights ▪ As of March 28, 2024, Vinci Partners had R$1.1 billion (R$20.74/share) in total net cash and investments, that comprise cash, ca sh equivalents and investments (liquid funds and GP fund investments at fair value) net of debt obligations. ▪ The fourth buyback program was approved in February, limited to R$60 million. Vinci Partners repurchased 533,981 shares in th e q uarter with an average share price of US$10.6. See notes and definitions at end of document 23.86 20.74 4Q'23 1Q'24 Net Cash and Investments per share (R$/share)

Segment Highlights

23 61% 14% 15% 9% R$224 mm 62% 14% 15% 8% Private Markets IP&S Public Equities Corporate Advisory Financials by segment ▪ Fee Related Earnings (FRE), disregarding Vinci Retirement Services segment, were R$224.0 million in the 1Q'24 LTM, with 61% o f F RE coming from Private Markets, followed by Public Equities with 15%, IP&S accounting for 14% and Corporate Advisory for 9%. ▪ Segment Distributable Earnings, disregarding Vinci Retirement Services segment, were R$253.1 million in the 1Q’24 LTM, with 6 2% coming from Private Markets’ strategies, followed by Public Equities accounting for 16%, IP&S for 13% and Corporate Advisory for 8%. R$253 mm Fee Related Earnings (FRE) 1Q'24 LTM by Segment Segment Distributable Earnings 1Q'24 LTM by Segment

24 Private Markets R$33 bn AUM ▪ Fee related earnings (FRE) of R$35.0 million in the quarter, up 9% year - over - year. This growth was driven by the strong fundrais ing in 2023 across Private Equity, Infrastructure and Real Estate. ▪ FRE was R$137.1 million in the 1Q'24 LTM, a 18% increase comparing to the 1Q’23 LTM. FRE Margin has been positively impacted by the fundraising environment, demonstrating a consistent increase over the quarters. ▪ Segment Distributable Earnings of R$39.0 million in the quarter, up 4% year - over - year. Segment DE was R$158.2 million in the 1Q' 24 LTM, an increase of 9% comparing to the 1Q’23 LTM. ▪ Total AUM of R$33.0 billion in the quarter, a 17% year - over - year increase propelled by robust fundraising across VCP IV, in Priv ate Equity, VICC, in Infrastructure and VISC, in Real Estate. ∆ YoY (%) 1Q'24 LTM 1Q'23 LTM ∆ YoY (%) 1Q'24 4Q'23 1Q'23 (R$ thousands, unless mentioned) 17% 255,046 218,734 7% 62,519 66,363 58,432 Net revenue from management fees (4)% 2,751 2,865 102% 554 1,648 275 Net revenue from advisory fees 16% 257,798 221,598 7% 63,073 68,011 58,706 Total Fee Related Revenues 17% (14,727) (12,630) 6% (3,707) (3,616) (3,509) Segment personnel expenses 23% (10,609) (8,592) 99% (2,856) (2,378) (1,438) Other G&A expenses 14% (54,511) (47,922) (1)% (12,937) (13,502) (13,018) Corporate center expenses 14% (40,867) (35,955) (1)% (8,978) (12,963) (9,111) Bonus compensation related to management and advisory 15% (120,714) (105,100) 5% (28,478) (32,459) (27,076) Total Fee Related Expenses 18% 137,084 116,499 9% 34,595 35,552 31,630 FEE RELATED EARNINGS (FRE) 53.2% 52.6% 54.8% 52.3% 53.9% FRE Margin (%) 76% 4,983 2,826 8% 8 1,983 7 Net revenue from performance fees (15)% 6,024 7,080 8% 8 3,025 7 Realized performance fees (76)% (1,042) (4,254) N/A – (1,042) – Unrealized performance fees 97% (2,297) (1,165) 34% (3) (970) (3) Performance based compensation 62% 2,686 1,661 (7)% 4 1,014 5 PERFORMANCE RELATED EARNINGS (PRE) 53.9% 58.8% 55.8% 51.1% 64.6% PRE Margin (%) (76)% 1,042 4,254 N/A – 1,042 – ( - ) Unrealized performance fees (75)% (369) (1,503) N/A – (369) – (+) Unrealized performance compensation (26)% 17,735 24,007 (25)% 4,406 4,451 5,881 (+) Realized GP investment income 9% 158,178 144,918 4% 39,005 41,689 37,516 SEGMENT DISTRIBUTABLE EARNINGS 56.2% 57.4% 57.8% 55.2% 58.1% Segment DE Margin (%) 17% 33,018 28,198 17% 33,018 32,956 28,198 ASSETS UNDER MANAGEMENT (AUM R$millions) 20% 29,763 24,825 20% 29,763 29,706 24,825 FEE EARNING ASSETS UNDER MANAGEMENT (FEAUM R$millions) 0.88% 0.88% 0.80% 0.89% 0.87% AVERAGE MANAGEMENT FEE RATE (%) Private Equity 44% Real Estate 21% Credit 17% Infrastructure 12% Vinci SPS 6% Private Markets' AUM

25 See notes and definitions at end of document Separate Mandates 73% Pension Plans 11% International 6% Commingled Funds 11% IP&S' AUM ∆ YoY (%) 1Q'24 LTM PF¹ 1Q'23 LTM PF¹ ∆ YoY (%) 1Q'24 4Q'23 PF¹ 1Q'23 PF¹ (R$ thousands, unless mentioned) (18)% 80,451 98,635 (13)% 19,814 19,349 22,817 Net revenue from management fees 14% 32 28 13% 8 8 7 Net revenue from advisory fees (18)% 80,483 98,664 (13)% 19,822 19,357 22,825 Total Fee Related Revenues 10% (7,244) (6,614) (11)% (1,627) (1,801) (1,832) Segment personnel expenses 1% (4,972) (4,916) (22)% (1,008) (1,816) (1,292) Other G&A expenses (21)% (17,241) (21,951) (19)% (4,100) (3,937) (5,084) Corporate center expenses (20)% (17,371) (21,774) (25)% (3,952) (4,011) (5,255) Bonus compensation related to management and advisory (15)% (46,826) (55,253) (21)% (10,687) (11,564) (13,462) Total Fee Related Expenses (22)% 33,657 43,410 (2)% 9,135 7,793 9,362 FEE RELATED EARNINGS (FRE) 41.8% 44.0% 46.1% 40.3% 41.0% FRE Margin (%) (38)% 3,913 6,334 (99)% 9 1,995 790 Net revenue from performance fees (38)% 3,913 6,334 (99)% 9 1,995 790 Realized performance fees N/A – – N/A – – – Unrealized performance fees (40)% (1,948) (3,244) (99)% (4) (994) (316) Performance based compensation (36)% 1,965 3,089 (99)% 4 1,001 474 PERFORMANCE RELATED EARNINGS (PRE) 50.2% 48.8% 50.0% 50.2% 60.0% PRE Margin (%) N/A – – N/A – – – ( - ) Unrealized performance fees N/A – – N/A – – – (+) Unrealized performance compensation (23)% 35,621 46,500 (7)% 9,139 8,793 9,837 SEGMENT DISTRIBUTABLE EARNINGS 42.2% 44.3% 46.1% 41.2% 41.7% Segment DE Margin (%) (3)% 25,756 26,599 (3)% 25,756 25,426 26,599 ASSETS UNDER MANAGEMENT (AUM R$millions) (3)% 25,507 26,288 (3)% 25,507 25,179 26,288 FEE EARNING ASSETS UNDER MANAGEMENT (FEAUM R$millions) 0.34% 0.40% 0.34% 0.33% 0.37% AVERAGE MANAGEMENT FEE RATE (%) Investment Products & Solutions ▪ This quarter, we executed a strategic realignment across our segments. In response to the evolving dynamics of our funds and the strategic vision of our management team, we reassigned a portion of our Hedge Funds business to IP&S (R$2.3 billion). ▪ Fee related earnings (FRE) of R$9.1 million in the quarter, down 2% year - over - year. FRE was R$33.6 million in the 1Q'24 LTM Pro Forma¹, a 22% decrease comparing to the 1Q’23 LTM Pro Forma¹, due to outflows especially within our pension funds strategy, which carries higher fees. ▪ Segment Distributable Earnings of R$9.1 million in the quarter, down 7% year - over - year. Segment DE was R$35.6 million in the 1Q' 24 LTM Pro Forma¹, a decrease of 23% when compared to the 1Q’23 LTM Pro Forma¹, that posted higher contributions from FRE. ▪ Total AUM of R$25.8 billion, down 3% year - over - year. R$26 bn AUM

26 Mosaico Strategy 61% Dividends Strategy 33% Total Return 5% Others 1% Public Equities' AUM ∆ YoY (%) 1Q'24 LTM PF¹ 1Q'23 LTM PF¹ ∆ YoY (%) 1Q'24 4Q'23 PF¹ 1Q'23 PF¹ (R$ thousands, unless mentioned)¹ (7)% 58,124 62,780 (5)% 13,964 14,145 14,628 Net revenue from management fees N/A – – N/A – – – Net revenue from advisory fees (7)% 58,124 62,780 (5)% 13,964 14,145 14,628 Total Fee Related Revenues 5% (3,576) (3,401) (4)% (889) (875) (931) Segment personnel expenses (16)% (1,430) (1,695) 23% (344) (315) (280) Other G&A expenses (11)% (12,454) (13,972) (11)% (2,890) (2,878) (3,259) Corporate center expenses (15)% (8,263) (9,703) (3)% (2,004) (1,798) (2,074) Bonus compensation related to management and advisory (11)% (25,722) (28,771) (6)% (6,126) (5,866) (6,544) Total Fee Related Expenses (5)% 32,403 34,008 (3)% 7,838 8,279 8,084 FEE RELATED EARNINGS (FRE) 55.7% 54.2% 56.1% 58.5% 55.3% FRE Margin (%) 199% 12,670 4,232 94% 2,257 2,491 1,166 Net revenue from performance fees 199% 12,670 4,232 94% 2,257 2,491 1,166 Realized performance fees N/A – – N/A – – – Unrealized performance fees 262% (6,672) (1,845) 141% (1,001) (1,651) (415) Performance based compensation 151% 5,997 2,386 67% 1,255 840 751 PERFORMANCE RELATED EARNINGS (PRE) 47.3% 56.4% 55.6% 33.7% 64.4% PRE Margin (%) N/A – – N/A – – – ( - ) Unrealized performance fees N/A – – N/A – – – (+) Unrealized performance compensation 6% 38,398 36,395 3% 9,093 9,119 8,835 SEGMENT DISTRIBUTABLE EARNINGS 54.2% 54.3% 56.1% 54.8% 55.9% Segment DE Margin (%) 33% 9,910 7,434 33% 9,910 10,055 7,434 ASSETS UNDER MANAGEMENT (AUM R$millions) 34% 9,859 7,374 34% 9,859 10,005 7,374 FEE EARNING ASSETS UNDER MANAGEMENT (FEAUM R$millions) 0.68% 0.84% 0.60% 0.64% 0.83% AVERAGE MANAGEMENT FEE RATE (%) Public Equities ▪ This quarter, we executed a strategic realignment across our segments. In response to the evolving dynamics of our funds and the strategic vision of our management team, we reassigned a portion of our Hedge Funds business to Public Equities (R$ 533.6 million). ▪ Fee related earnings (FRE) of R$7.8 million in the quarter, down 3% year - over - year, following volatile markets across the globe over the last quarters. FRE was R$32.4 million in the 1Q'24 LTM Pro Forma¹, a decrease of 5% compared to the 1Q’23 LTM Pro Forma¹. ▪ Segment Distributable Earnings of R$9.1 million in the quarter, up 3% year - over - year. Segment Distributable Earnings was R$38.4 million in the 1Q'24 LTM Pro Forma¹, an increase of 6% when compared to the 1Q’23 LTM Pro Forma¹, driven by an increase in contributions from realized performance fees. ▪ Total AUM of R$9.9 billion in the quarter, up 33% year - over - year. See notes and definitions at end of document R$10 bn AUM
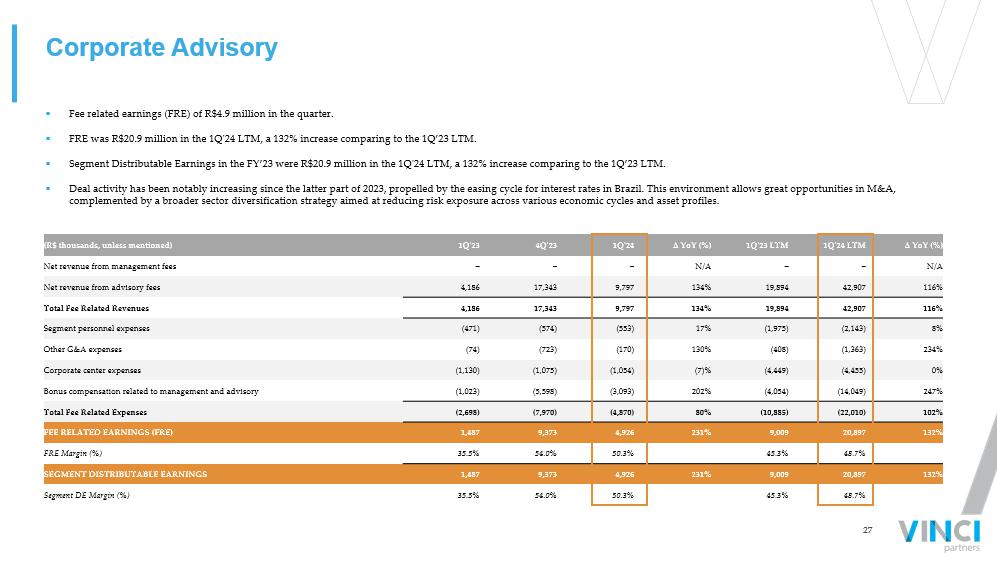
27 ∆ YoY (%) 1Q'24 LTM 1Q'23 LTM ∆ YoY (%) 1Q'24 4Q'23 1Q'23 (R$ thousands, unless mentioned) N/A – – N/A – – – Net revenue from management fees 116% 42,907 19,894 134% 9,797 17,343 4,186 Net revenue from advisory fees 116% 42,907 19,894 134% 9,797 17,343 4,186 Total Fee Related Revenues 8% (2,143) (1,975) 17% (553) (574) (471) Segment personnel expenses 234% (1,363) (408) 130% (170) (723) (74) Other G&A expenses 0% (4,455) (4,449) (7)% (1,054) (1,075) (1,130) Corporate center expenses 247% (14,049) (4,054) 202% (3,093) (5,598) (1,023) Bonus compensation related to management and advisory 102% (22,010) (10,885) 80% (4,870) (7,970) (2,698) Total Fee Related Expenses 132% 20,897 9,009 231% 4,926 9,373 1,487 FEE RELATED EARNINGS (FRE) 48.7% 45.3% 50.3% 54.0% 35.5% FRE Margin (%) 132% 20,897 9,009 231% 4,926 9,373 1,487 SEGMENT DISTRIBUTABLE EARNINGS 48.7% 45.3% 50.3% 54.0% 35.5% Segment DE Margin (%) Corporate Advisory ▪ Fee related earnings (FRE) of R$4.9 million in the quarter. ▪ FRE was R$20.9 million in the 1Q'24 LTM, a 132% increase comparing to the 1Q’23 LTM. ▪ Segment Distributable Earnings in the FY’23 were R$20.9 million in the 1Q'24 LTM, a 132% increase comparing to the 1Q’23 LTM. ▪ Deal activity has been notably increasing since the latter part of 2023, propelled by the easing cycle for interest rates in Bra zil. This environment allows great opportunities in M&A, complemented by a broader sector diversification strategy aimed at reducing risk exposure across various economic cycles and ass et profiles.

28 ∆ YoY (%) 1Q'24 LTM 1Q'23 LTM ∆ YoY (%) 1Q'24 4Q'23 1Q'23 (R$ thousands, unless mentioned) N/A 324 – N/A 158 119 – Net revenue from management fees N/A – – N/A – – – Net revenue from advisory fees N/A 324 – N/A 158 119 – Total Fee Related Revenues 50% (2,168) (1,450) 33% (561) (596) (422) Segment personnel expenses 166% (4,589) (1,724) 333% (1,618) (1,341) (374) Other G&A expenses 38% (446) (322) (8)% (105) (107) (115) Corporate center expenses 58% (4,136) (2,622) 21% (721) (1,773) (598) Bonus compensation related to management and advisory 85% (11,338) (6,119) 99% (3,006) (3,818) (1,509) Total Fee Related Expenses 80% (11,014) (6,119) 89% (2,847) (3,699) (1,509) FEE RELATED EARNINGS (FRE) N/A N/A N/A N/A N/A FRE Margin (%) N/A – – N/A – – – Net revenue from performance fees N/A – – N/A – – – Realized performance fees N/A – – N/A – – – Unrealized performance fees N/A – – N/A – – – Performance based compensation N/A – – N/A – – – PERFORMANCE RELATED EARNINGS (PRE) N/A N/A N/A N/A N/A PRE Margin (%) N/A – – N/A – – – ( - ) Unrealized performance fees N/A – – N/A – – – (+) Unrealized performance compensation 80% (11,014) (6,119) 89% (2,847) (3,699) (1,509) SEGMENT DISTRIBUTABLE EARNINGS N/A N/A N/A N/A N/A Segment DE Margin (%) N/A 147 – N/A 147 88 – ASSETS UNDER MANAGEMENT (AUM R$millions) N/A 0.86% – N/A 0.58% 0.72% – AVERAGE MANAGEMENT FEE RATE (%) ▪ Fee Related Earnings (FRE) of negative R$2.8 million in the quarter. FRE was negative R$11.0 million in the 1Q'24 LTM. ▪ VRS started to contribute to AUM numbers and management fee revenues in 2023. In February, VRS was officially presented to th e g eneral public with an article in a major newspaper in Brazil. The product is now fully accessible to the public through dedicated apps and website and prepared to accept allocatio ns from all investors through our newly launched platform called Mio. ▪ VRS reached close to R$ 150.0 million in AUM by the end of the first quarter. Retirement Services

Supplement Details
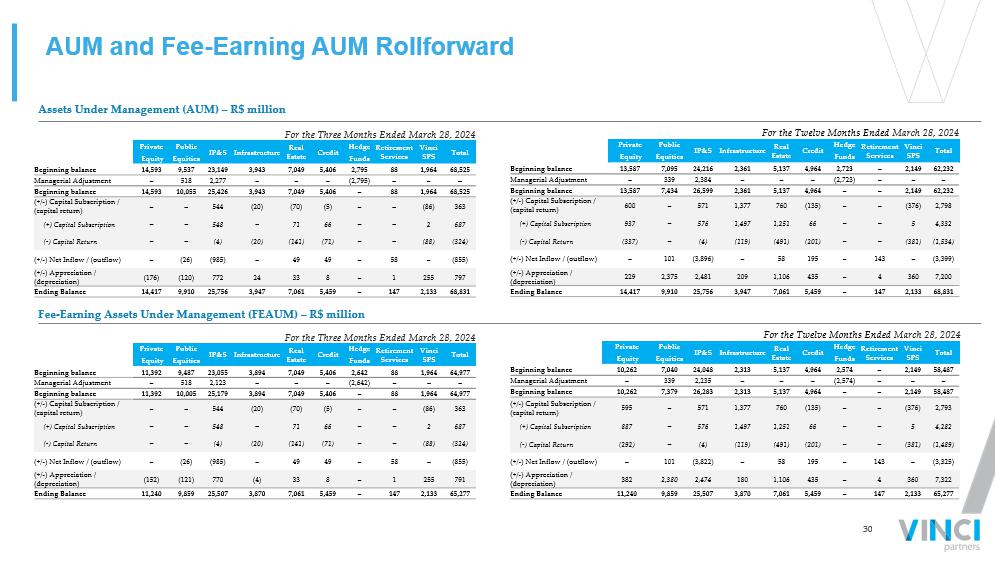
30 Total Vinci SPS Retirement Services Hedge Credit Real Estate Infrastructure IP&S Public Private Funds Equities Equity 58,487 2,149 – 2,574 4,964 5,137 2,313 24,048 7,040 10,262 Beginning balance – – – (2,574) – – – 2,235 339 – Managerial Adjustment 58,487 2,149 – – 4,964 5,137 2,313 26,283 7,379 10,262 Beginning balance 2,793 (376) – – (135) 760 1,377 571 – 595 (+/ - ) Capital Subscription / (capital return) 4,282 5 – – 66 1,251 1,497 576 – 887 (+) Capital Subscription (1,489) (381) – – (201) (491) (119) (4) – (292) ( - ) Capital Return (3,325) – 143 – 195 58 – (3,822) 101 – (+/ - ) Net Inflow / (outflow) 7,322 360 4 – 435 1,106 180 2,474 2,380 382 (+/ - ) Appreciation / (depreciation) 65,277 2,133 147 – 5,459 7,061 3,870 25,507 9,859 11,240 Ending Balance Total Vinci SPS Retirement Services Hedge Credit Real Estate Infrastructure IP&S Public Private Funds Equities Equity 62,232 2,149 – 2,723 4,964 5,137 2,361 24,216 7,095 13,587 Beginning balance – – – (2,723) – – – 2,384 339 – Managerial Adjustment 62,232 2,149 – – 4,964 5,137 2,361 26,599 7,434 13,587 Beginning balance 2,798 (376) – – (135) 760 1,377 571 – 600 (+/ - ) Capital Subscription / (capital return) 4,332 5 – – 66 1,251 1,497 576 – 937 (+) Capital Subscription (1,534) (381) – – (201) (491) (119) (4) – (337) ( - ) Capital Return (3,399) – 143 – 195 58 – (3,896) 101 – (+/ - ) Net Inflow / (outflow) 7,200 360 4 – 435 1,106 209 2,481 2,375 229 (+/ - ) Appreciation / (depreciation) 68,831 2,133 147 – 5,459 7,061 3,947 25,756 9,910 14,417 Ending Balance Total Vinci SPS Retirement Services Hedge Credit Real Estate Infrastructure IP&S Public Private Funds Equities Equity 64,977 1,964 88 2,642 5,406 7,049 3,894 23,055 9,487 11,392 Beginning balance – – – (2,642) – – – 2,123 518 – Managerial Adjustment 64,977 1,964 88 – 5,406 7,049 3,894 25,179 10,005 11,392 Beginning balance 363 (86) – – (5) (70) (20) 544 – – (+/ - ) Capital Subscription / (capital return) 687 2 – – 66 71 – 548 – – (+) Capital Subscription (324) (88) – – (71) (141) (20) (4) – – ( - ) Capital Return (855) – 58 – 49 49 – (985) (26) – (+/ - ) Net Inflow / (outflow) 791 255 1 – 8 33 (4) 770 (121) (152) (+/ - ) Appreciation / (depreciation) 65,277 2,133 147 – 5,459 7,061 3,870 25,507 9,859 11,240 Ending Balance Total Vinci SPS Retirement Services Hedge Credit Real Estate Infrastructure IP&S Public Private Funds Equities Equity 68,525 1,964 88 2,795 5,406 7,049 3,943 23,149 9,537 14,593 Beginning balance – – – (2,795) – – – 2,277 518 – Managerial Adjustment 68,525 1,964 88 – 5,406 7,049 3,943 25,426 10,055 14,593 Beginning balance 363 (86) – – (5) (70) (20) 544 – – (+/ - ) Capital Subscription / (capital return) 687 2 – – 66 71 – 548 – – (+) Capital Subscription (324) (88) – – (71) (141) (20) (4) – – ( - ) Capital Return (855) – 58 – 49 49 – (985) (26) – (+/ - ) Net Inflow / (outflow) 797 255 1 – 8 33 24 772 (120) (176) (+/ - ) Appreciation / (depreciation) 68,831 2,133 147 – 5,459 7,061 3,947 25,756 9,910 14,417 Ending Balance AUM and Fee - Earning AUM Rollforward Assets Under Management (AUM) – R$ million Fee - Earning Assets Under Management (FEAUM) – R$ million For the Three Months Ended March 28, 2024 For the Three Months Ended March 28, 2024 For the Twelve Months Ended March 28, 2024 For the Twelve Months Ended March 28, 2024
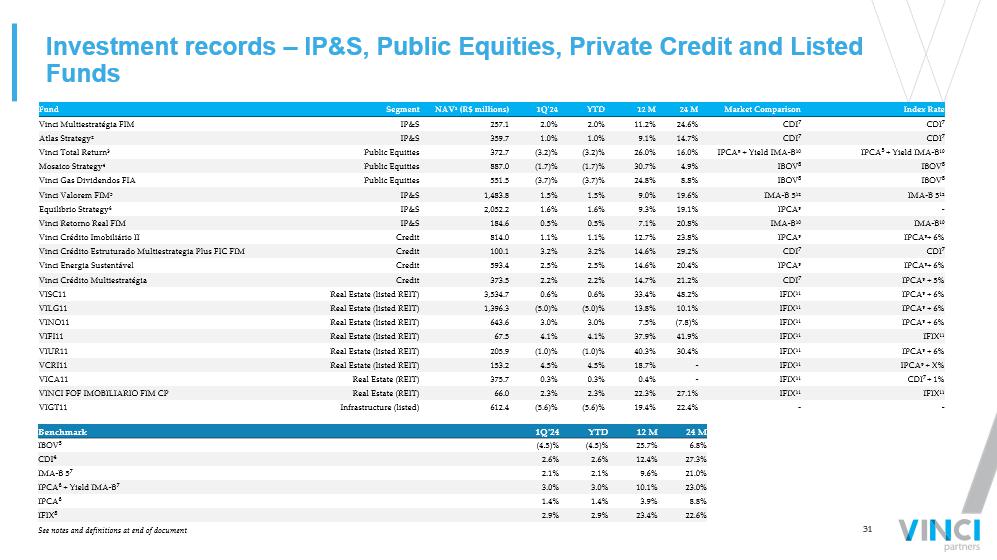
31 Investment records – IP&S, Public Equities, Private Credit and Listed Funds See notes and definitions at end of document Index Rate Market Comparison 24 M 12 M YTD 1Q'24 NAV¹ (R$ millions) Segment Fund CDI 7 CDI 7 24.6% 11.2% 2.0% 2.0% 257.1 IP&S Vinci Multiestratégia FIM CDI 7 CDI 7 14.7% 9.1% 1.0% 1.0% 359.7 IP&S Atlas Strategy² IPCA 5 + Yield IMA - B¹⁰ IPCA⁹ + Yield IMA - B¹⁰ 16.0% 26.0% (3.2)% (3.2)% 372.7 Public Equities Vinci Total Return³ IBOV 8 IBOV 8 4.9% 30.7% (1.7)% (1.7)% 887.0 Public Equities Mosaico Strategy⁴ IBOV 8 IBOV 8 8.8% 24.8% (3.7)% (3.7)% 551.5 Public Equities Vinci Gas Dividendos FIA IMA - B 5¹² IMA - B 5¹² 19.6% 9.0% 1.5% 1.5% 1,483.8 IP&S Vinci Valorem FIM⁵ - IPCA⁹ 19.1% 9.3% 1.6% 1.6% 2,052.2 IP&S Equilibrio Strategy⁶ IMA - B¹⁰ IMA - B¹⁰ 20.8% 7.1% 0.5% 0.5% 184.6 IP&S Vinci Retorno Real FIM IPCA⁹+ 6% IPCA⁹ 23.8% 12.7% 1.1% 1.1% 814.0 Credit Vinci Crédito Imobiliário II CDI 7 CDI 7 29.2% 14.6% 3.2% 3.2% 100.1 Credit Vinci Crédito Estruturado Multiestrategia Plus FIC FIM IPCA⁹+ 6% IPCA⁹ 20.4% 14.6% 2.5% 2.5% 593.4 Credit Vinci Energia Sustentável IPCA⁹ + 5% CDI 7 21.2% 14.7% 2.2% 2.2% 373.5 Credit Vinci Crédito Multiestratégia IPCA⁹ + 6% IFIX¹¹ 48.2% 33.4% 0.6% 0.6% 3,534.7 Real Estate (listed REIT) VISC11 IPCA⁹ + 6% IFIX¹¹ 10.1% 13.8% (5.0)% (5.0)% 1,396.3 Real Estate (listed REIT) VILG11 IPCA⁹ + 6% IFIX¹¹ (7.8)% 7.5% 3.0% 3.0% 643.6 Real Estate (listed REIT) VINO11 IFIX¹¹ IFIX¹¹ 41.9% 37.9% 4.1% 4.1% 67.5 Real Estate (listed REIT) VIFI11 IPCA⁹ + 6% IFIX¹¹ 30.4% 40.3% (1.0)% (1.0)% 205.9 Real Estate (listed REIT) VIUR11 IPCA⁹ + X% IFIX¹¹ - 18.7% 4.5% 4.5% 153.2 Real Estate (listed REIT) VCRI11 CDI 7 + 1% IFIX¹¹ - 0.4% 0.3% 0.3% 375.7 Real Estate (REIT) VICA11 IFIX¹¹ IFIX¹¹ 27.1% 22.3% 2.3% 2.3% 66.0 Real Estate (REIT) VINCI FOF IMOBILIARIO FIM CP - - 22.4% 19.4% (5.6)% (5.6)% 612.4 Infrastructure (listed) VIGT11 24 M 12 M YTD 1Q'24 Benchmark 6.8% 25.7% (4.5)% (4.5)% IBOV 5 27.3% 12.4% 2.6% 2.6% CDI 4 21.0% 9.6% 2.1% 2.1% IMA - B 5 7 23.0% 10.1% 3.0% 3.0% IPCA 6 + Yield IMA - B 7 8.8% 3.9% 1.4% 1.4% IPCA 6 22.6% 23.4% 2.9% 2.9% IFIX 8
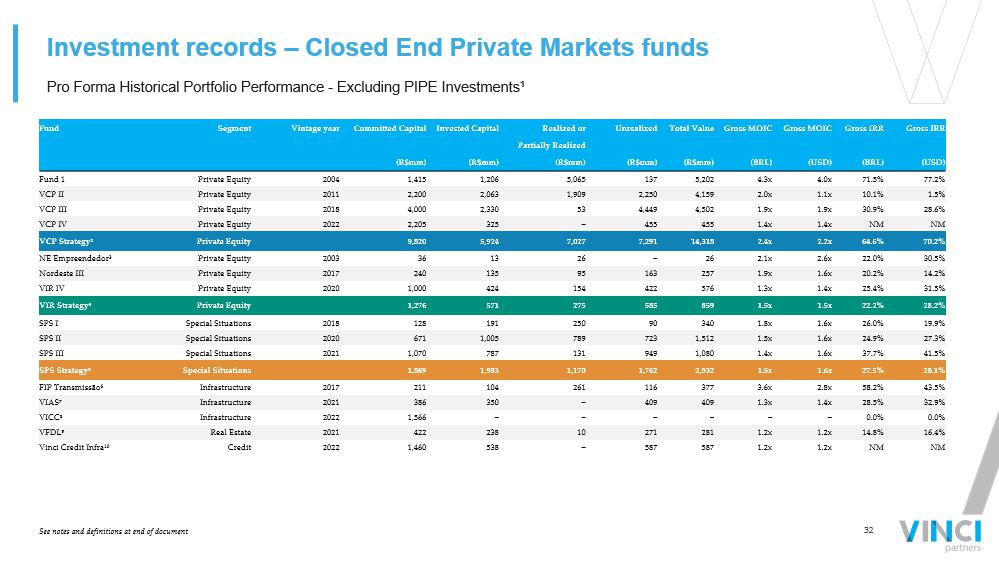
32 Gross IRR Gross IRR Gross MOIC Gross MOIC Total Value Unrealized Realized or Invested Capital Committed Capital Vintage year Segment Fund Partially Realized (USD) (BRL) (USD) (BRL) ( R$mm ) ( R$mm ) ( R$mm ) ( R$mm ) (R$mm) 77.2% 71.5% 4.0x 4.3x 5,202 137 5,065 1,206 1,415 2004 Private Equity Fund 1 1.5% 10.1% 1.1x 2.0x 4,159 2,250 1,909 2,063 2,200 2011 Private Equity VCP II 28.6% 30.9% 1.9x 1.9x 4,502 4,449 53 2,330 4,000 2018 Private Equity VCP III NM NM 1.4x 1.4x 455 455 – 325 2,205 2022 Private Equity VCP IV 70.2% 64.6% 2.2x 2.4x 14,318 7,291 7,027 5,924 9,820 Private Equity VCP Strategy² 30.5% 22.0% 2.6x 2.1x 26 – 26 13 36 2003 Private Equity NE Empreendedor³ 14.2% 20.2% 1.6x 1.9x 257 163 95 135 240 2017 Private Equity Nordeste III 31.5% 25.4% 1.4x 1.3x 576 422 154 424 1,000 2020 Private Equity VIR IV 28.2% 22.2% 1.5x 1.5x 859 585 275 571 1,276 Private Equity VIR Strategy⁴ 19.9% 26.0% 1.6x 1.8x 340 90 250 191 128 2018 Special Situations SPS I 27.3% 24.9% 1.6x 1.5x 1,512 723 789 1,005 671 2020 Special Situations SPS II 41.5% 37.7% 1.6x 1.4x 1,080 949 131 787 1,070 2021 Special Situations SPS III 28.1% 27.5% 1.6x 1.5x 2,932 1,762 1,170 1,983 1,869 Special Situations SPS Strategy⁵ 43.5% 58.2% 2.8x 3.6x 377 116 261 104 211 2017 Infrastructure FIP Transmissão ⁶ 32.9% 28.5% 1.4x 1.3x 409 409 – 350 386 2021 Infrastructure VIAS⁷ 0.0% 0.0% – – – – – – 1,566 2022 Infrastructure VICC⁸ 16.4% 14.8% 1.2x 1.2x 281 271 10 238 422 2021 Real Estate VFDL⁹ NM NM 1.2x 1.2x 587 587 – 538 1,460 2022 Credit Vinci Credit Infra¹⁰ Pro Forma Historical Portfolio Performance - Excluding PIPE Investments¹ Investment records – Closed End Private Markets funds See notes and definitions at end of document
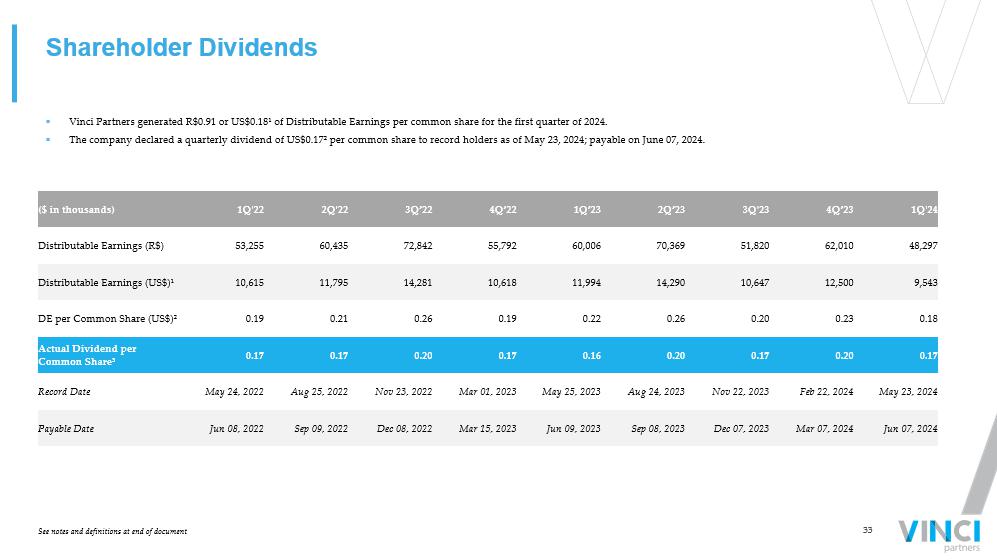
33 Shareholder Dividends 1Q'24 4Q’23 3Q'23 2Q’23 1Q’23 4Q’22 3Q’22 2Q'22 1Q'22 ($ in thousands) 48,297 62,010 51,820 70,369 60,006 55,792 72,842 60,435 53,255 Distributable Earnings (R$) 9,543 12,500 10,647 14,290 11,994 10,618 14,281 11,795 10,615 Distributable Earnings (US$)¹ 0.18 0.23 0.20 0.26 0.22 0.19 0.26 0.21 0.19 DE per Common Share (US$)² 0.17 0.20 0.17 0.20 0.16 0.17 0.20 0.17 0.17 Actual Dividend per Common Share³ May 23, 2024 Feb 22, 2024 Nov 22, 2023 Aug 24, 2023 May 25, 2023 Mar 01, 2023 Nov 23, 2022 Aug 25, 2022 May 24, 2022 Record Date Jun 07, 2024 Mar 07, 2024 Dec 07, 2023 Sep 08, 2023 Jun 09, 2023 Mar 15, 2023 Dec 08, 2022 Sep 09, 2022 Jun 08, 2022 Payable Date ▪ Vinci Partners generated R$0.91 or US$0.18¹ of Distributable Earnings per common share for the first quarter of 2024. ▪ The company declared a quarterly dividend of US$0.17² per common share to record holders as of May 23, 2024; payable on June 07 , 2024. See notes and definitions at end of document

34 Share Summary ▪ Common Shares Outstanding as of quarter end of 53,244,836 shares. x Repurchased 533,981 common shares in the quarter, with an average share price of US$10.6. x Repurchased 4,090,985 common shares since the announcement of the first share repurchase plan, with an average share price of US $10.7. x A new share repurchase plan was approved on February 07, 2024, to buy back up to R$60.0 million of the company’s outstanding sha res. 1Q'24 4Q’23 3Q'23 2Q’23 1Q23 4Q'22 3Q'22 2Q'22 1Q'22 VINP Shares 14,466,239 14,466,239 14,466,239 14,466,239 14,466,239 14,466,239 14,466,239 14,466,239 14,466,239 Class B 38,778,597 39,312,578 39,405,827 39,730,720 40,247,461 40,614,497 40,892,619 41,112,717 41,363,077 Class A¹ 53,244,836 53,778,817 53,872,066 54,196,959 54,713,700 55,080,736 55,358,858 55,578,956 55,829,316 Common Shares See notes and definitions at end of document
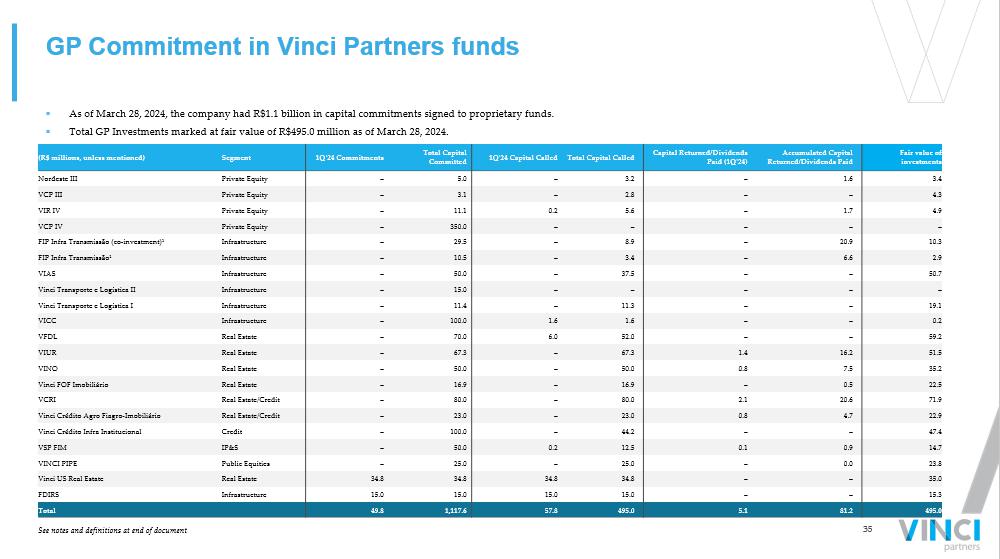
35 GP Commitment in Vinci Partners funds ▪ As of March 28, 2024, the company had R$1.1 billion in capital commitments signed to proprietary funds. ▪ Total GP Investments marked at fair value of R$495.0 million as of March 28, 2024. See notes and definitions at end of document Fair value of investments Accumulated Capital Returned/Dividends Paid Capital Returned/Dividends Paid (1Q'24) Total Capital Called 1Q'24 Capital Called Total Capital Committed 1Q'24 Commitments Segment (R$ millions, unless mentioned) 3.4 1.6 – 3.2 – 5.0 – Private Equity Nordeste III 4.3 – – 2.8 – 3.1 – Private Equity VCP III 4.9 1.7 – 5.6 0.2 11.1 – Private Equity VIR IV – – – – – 350.0 – Private Equity VCP IV 10.3 20.9 – 8.9 – 29.5 – Infrastructure FIP Infra Transmissão ( co - investment )¹ 2.9 6.6 – 3.4 – 10.5 – Infrastructure FIP Infra Transmissão¹ 50.7 – – 37.5 – 50.0 – Infrastructure VIAS – – – – – 15.0 – Infrastructure Vinci Transporte e Logística II 19.1 – – 11.3 – 11.4 – Infrastructure Vinci Transporte e Logística I 0.2 – – 1.6 1.6 100.0 – Infrastructure VICC 59.2 – – 52.0 6.0 70.0 – Real Estate VFDL 51.5 16.2 1.4 67.3 – 67.3 – Real Estate VIUR 35.2 7.5 0.8 50.0 – 50.0 – Real Estate VINO 22.5 0.5 – 16.9 – 16.9 – Real Estate Vinci FOF Imobiliário 71.9 20.6 2.1 80.0 – 80.0 – Real Estate/Credit VCRI 22.9 4.7 0.8 23.0 – 23.0 – Real Estate/Credit Vinci Crédito Agro Fiagro - Imobiliário 47.4 – – 44.2 – 100.0 – Credit Vinci Crédito Infra Institucional 14.7 0.9 0.1 12.5 0.2 50.0 – IP&S VSP FIM 23.8 0.0 – 25.0 – 25.0 – Public Equities VINCI PIPE 35.0 – – 34.8 34.8 34.8 34.8 Real Estate Vinci US Real Estate 15.3 – – 15.0 15.0 15.0 15.0 Infrastructure FDIRS 495.0 81.2 5.1 495.0 57.8 1,117.6 49.8 Total
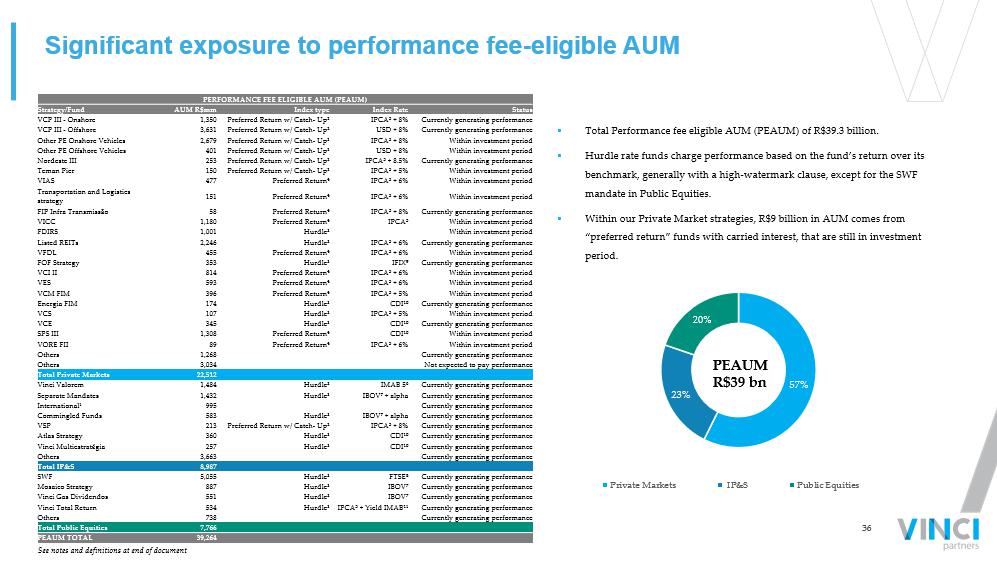
36 57% 23% 20% Private Markets IP&S Public Equities Significant exposure to performance fee - eligible AUM ▪ Total Performance fee eligible AUM (PEAUM) of R$39.3 billion. ▪ Hurdle rate funds charge performance based on the fund’s return over its benchmark, generally with a high - watermark clause, except for the SWF mandate in Public Equities. ▪ Within our Private Market strategies, R$9 billion in AUM comes from “preferred return” funds with carried interest, that are still in investment period. See notes and definitions at end of document PERFORMANCE FEE ELIGIBLE AUM (PEAUM) Status Index Rate Index type AUM R$mm Strategy/Fund Currently generating performance IPCA 5 + 8% Preferred Return w/ Catch - Up² 1,350 VCP III - Onshore Currently generating performance USD + 8% Preferred Return w/ Catch - Up² 3,631 VCP III - Offshore Within investment period IPCA 5 + 8% Preferred Return w/ Catch - Up² 2,679 Other PE Onshore Vehicles Within investment period USD + 8% Preferred Return w/ Catch - Up² 401 Other PE Offshore Vehicles Currently generating performance IPCA 5 + 8.5% Preferred Return w/ Catch - Up² 253 Nordeste III Within investment period IPCA 5 + 5% Preferred Return w/ Catch - Up² 150 Teman Pier Within investment period IPCA 5 + 6% Preferred Return 4 477 VIAS Within investment period IPCA 5 + 6% Preferred Return 4 151 Transportation and Logistics strategy Currently generating performance IPCA 5 + 8% Preferred Return 4 58 FIP Infra Transmissão Within investment period IPCA 5 Preferred Return 4 1,180 VICC Within investment period Hurdle³ 1,001 FDIRS Currently generating performance IPCA 5 + 6% Hurdle³ 2,246 Listed REITs Within investment period IPCA 5 + 6% Preferred Return 4 455 VFDL Currently generating performance IFIX 9 Hurdle³ 353 FOF Strategy Within investment period IPCA 5 + 6% Preferred Return 4 814 VCI II Within investment period IPCA 5 + 6% Preferred Return 4 593 VES Within investment period IPCA 5 + 5% Preferred Return 4 396 VCM FIM Currently generating performance CDI 10 Hurdle³ 174 Energia FIM Within investment period IPCA 5 + 5% Hurdle³ 107 VCS Currently generating performance CDI 10 Hurdle³ 345 VCE Within investment period CDI 10 Preferred Return 4 1,308 SPS III Within investment period IPCA 5 + 6% Preferred Return 4 89 VORE FII Currently generating performance 1,268 Others Not expected to pay performance 3,034 Others 22,512 Total Private Markets Currently generating performance IMAB 5 6 Hurdle³ 1,484 Vinci Valorem Currently generating performance IBOV 7 + alpha Hurdle³ 1,432 Separate Mandates Currently generating performance 995 International¹ Currently generating performance IBOV 7 + alpha Hurdle³ 583 Commingled Funds Currently generating performance IPCA 5 + 8% Preferred Return w/ Catch - Up² 213 VSP Currently generating performance CDI 10 Hurdle³ 360 Atlas Strategy Currently generating performance CDI 10 Hurdle³ 257 Vinci Multiestratégia Currently generating performance 3,663 Others 8,987 Total IP&S Currently generating performance FTSE 8 Hurdle³ 5,055 SWF Currently generating performance IBOV 7 Hurdle³ 887 Mosaico Strategy Currently generating performance IBOV 7 Hurdle³ 551 Vinci Gas Dividendos Currently generating performance IPCA 5 + Yield IMAB 11 Hurdle³ 534 Vinci Total Return Currently generating performance 738 Others 7,766 Total Public Equities 39,264 PEAUM TOTAL PEAUM R$39 bn

Reconciliations and Disclosures

38 Financials - Income Statement See notes and definitions at end of document ∆ LTM (%) 1Q'24 LTM 1Q'23 LTM ∆ YoY (%) 1Q'24 4Q'23 1Q'23 (R$ thousands, unless mentioned) REVENUES 4% 393,945 380,149 1% 96,455 99,976 95,877 Net revenue from management fees 61% 21,564 13,391 16% 2,273 6,468 1,963 Net revenue from performance fees 28% 22,606 17,645 16% 2,273 7,510 1,963 Realized performance fees (76)% (1,042) (4,254) N/A – (1,042) – Unrealized performance fees 101% 45,690 22,788 132% 10,359 18,998 4,468 Net revenue from advisory 11% 461,199 416,328 7% 109,087 125,442 102,308 Total net revenues from services rendered EXPENSES 14% (84,686) (74,108) 4% (18,748) (26,143) (18,062) Bonus related to management and advisory 75% (10,916) (6,255) 38% (1,009) (3,614) (733) Performance based compensation 45% (11,285) (7,759) 38% (1,009) (3,983) (733) Realized (75)% 369 1,503 N/A – 369 – Unrealized 19% (95,602) (80,363) 5% (19,757) (29,757) (18,795) Total compensation and benefits 15% (29,859) (26,069) 2% (7,337) (7,462) (7,164) Segment personnel expenses 32% (22,961) (17,338) 73% (5,996) (6,573) (3,458) Other general and administrative expenses 1% (89,106) (88,615) (7)% (21,087) (21,499) (22,606) Corporate center expenses 12% (237,527) (212,385) 4% (54,177) (65,291) (52,023) Total expenses 10% 223,672 203,943 9% 54,910 60,151 50,285 Operating profit OTHER ITEMS N/A 59,727 (9,727) N/A 13,509 14,914 (20,200) GP Investment income (26)% 17,735 24,007 (25)% 4,406 4,451 5,881 Realized gain from GP investment income N/A 41,992 (33,734) N/A 9,103 10,463 (26,081) Unrealized gain from GP investment income (8)% 76,618 83,251 (38)% 12,362 22,046 20,089 Financial income (7)% 76,618 82,051 (38)% 12,362 22,046 20,089 Realized gain from financial income N/A (0) 1,200 N/A – – – Unrealized gain from financial income (1)% (9,394) (9,518) (16)% (2,216) (2,267) (2,631) Leasing expenses N/A (48,468) 9,540 N/A (14,992) (10,461) 151 Other items¹ 21% (19,008) (15,647) 192% (6,148) (4,249) (2,107) Share Based Plan 119% (3,257) (1,485) N/A (1,333) (1,924) – Non - operational expenses² (0)% 56,218 56,414 N/A 1,182 18,059 (4,698) Total Other Items 8% 279,890 260,356 23% 56,092 78,210 45,587 Profit before income taxes (11)% (47,429) (53,555) (19)% (10,384) (14,826) (12,881) ( - ) Income taxes ³ 12% 232,461 206,801 40% 45,708 63,384 32,706 NET INCOME 197% 2,939 988 N/A 1,308 1,631 – (+) Non - operational expenses (including Income Tax effect) N/A 16,949 (11,895) N/A 3,799 2,691 (2,674) ( - ) Contingent consideration adjustment related to acquisitions 4 29% 252,349 195,894 69% 50,815 67,706 30,032 ADJUSTE NET INCOME
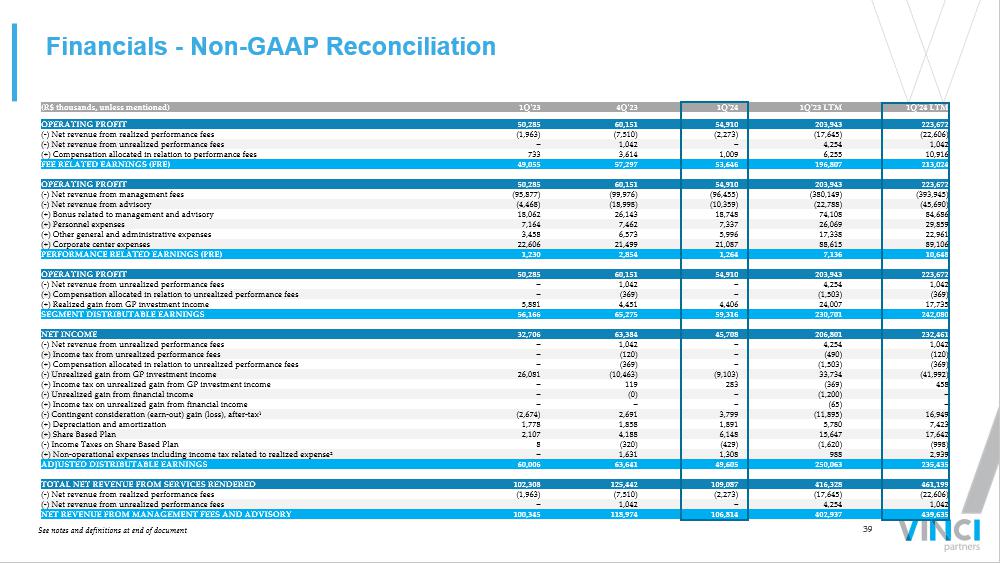
39 Financials - Non - GAAP Reconciliation 1Q'24 LTM 1Q'23 LTM 1Q'24 4Q'23 1Q'23 (R$ thousands, unless mentioned) 223,672 203,943 54,910 60,151 50,285 OPERATING PROFIT (22,606) (17,645) (2,273) (7,510) (1,963) ( - ) Net revenue from realized performance fees 1,042 4,254 – 1,042 – ( - ) Net revenue from unrealized performance fees 10,916 6,255 1,009 3,614 733 (+) Compensation allocated in relation to performance fees 213,024 196,807 53,646 57,297 49,055 FEE RELATED EARNINGS (FRE) 223,672 203,943 54,910 60,151 50,285 OPERATING PROFIT (393,945) (380,149) (96,455) (99,976) (95,877) ( - ) Net revenue from management fees (45,690) (22,788) (10,359) (18,998) (4,468) ( - ) Net revenue from advisory 84,686 74,108 18,748 26,143 18,062 (+) Bonus related to management and advisory 29,859 26,069 7,337 7,462 7,164 (+) Personnel expenses 22,961 17,338 5,996 6,573 3,458 (+) Other general and administrative expenses 89,106 88,615 21,087 21,499 22,606 (+) Corporate center expenses 10,648 7,136 1,264 2,854 1,230 PERFORMANCE RELATED EARNINGS (PRE) 223,672 203,943 54,910 60,151 50,285 OPERATING PROFIT 1,042 4,254 – 1,042 – ( - ) Net revenue from unrealized performance fees (369) (1,503) – (369) – (+) Compensation allocated in relation to unrealized performance fees 17,735 24,007 4,406 4,451 5,881 (+) Realized gain from GP investment income 242,080 230,701 59,316 65,275 56,166 SEGMENT DISTRIBUTABLE EARNINGS 232,461 206,801 45,708 63,384 32,706 NET INCOME 1,042 4,254 – 1,042 – ( - ) Net revenue from unrealized performance fees (120) (490) – (120) – (+) Income tax from unrealized performance fees (369) (1,503) – (369) – (+) Compensation allocated in relation to unrealized performance fees (41,992) 33,734 (9,103) (10,463) 26,081 ( - ) Unrealized gain from GP investment income 458 (369) 283 119 – (+) Income tax on unrealized gain from GP investment income – (1,200) – (0) – ( - ) Unrealized gain from financial income – (65) – – – (+) Income tax on unrealized gain from financial income 16,949 (11,895) 3,799 2,691 (2,674) ( - ) Contingent consideration (earn - out) gain (loss), after - tax¹ 7,423 5,780 1,891 1,858 1,778 (+) Depreciation and amortization 17,642 15,647 6,148 4,188 2,107 (+) Share Based Plan (998) (1,620) (429) (320) 8 ( - ) Income Taxes on Share Based Plan 2,939 988 1,308 1,631 – (+) Non - operational expenses including income tax related to realized expense² 235,435 250,063 49,605 63,641 60,006 ADJUSTED DISTRIBUTABLE EARNINGS 461,199 416,328 109,087 125,442 102,308 TOTAL NET REVENUE FROM SERVICES RENDERED (22,606) (17,645) (2,273) (7,510) (1,963) ( - ) Net revenue from realized performance fees 1,042 4,254 – 1,042 – ( - ) Net revenue from unrealized performance fees 439,635 402,937 106,814 118,974 100,345 NET REVENUE FROM MANAGEMENT FEES AND ADVISORY See notes and definitions at end of document
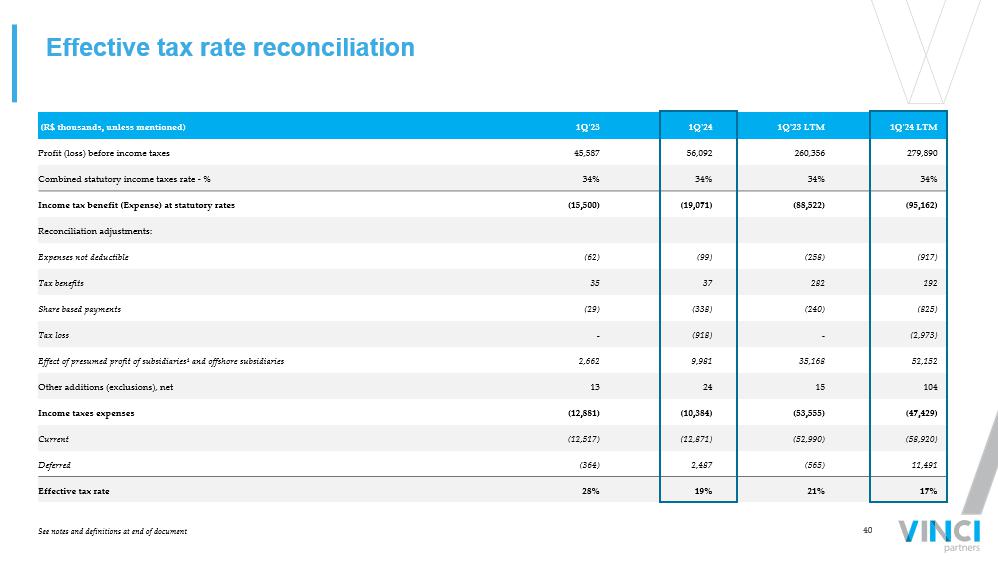
40 1Q'24 LTM 1Q'23 LTM 1Q'24 1Q'23 (R$ thousands, unless mentioned) 279,890 260,356 56,092 45,587 Profit (loss) before income taxes 34% 34% 34% 34% Combined statutory income taxes rate - % (95,162) (88,522) (19,071) (15,500) Income tax benefit (Expense) at statutory rates Reconciliation adjustments: (917) (258) (99) (62) Expenses not deductible 192 282 37 35 Tax benefits (825) (240) (338) (29) Share based payments (2,973) - (918) - Tax loss 52,152 35,168 9,981 2,662 Effect of presumed profit of subsidiaries¹ and offshore subsidiaries 104 15 24 13 Other additions (exclusions), net (47,429) (53,555) (10,384) (12,881) Income taxes expenses (58,920) (52,990) (12,871) (12,517) Current 11,491 (565) 2,487 (364) Deferred 17% 21% 19% 28% Effective tax rate Effective tax rate reconciliation See notes and definitions at end of document
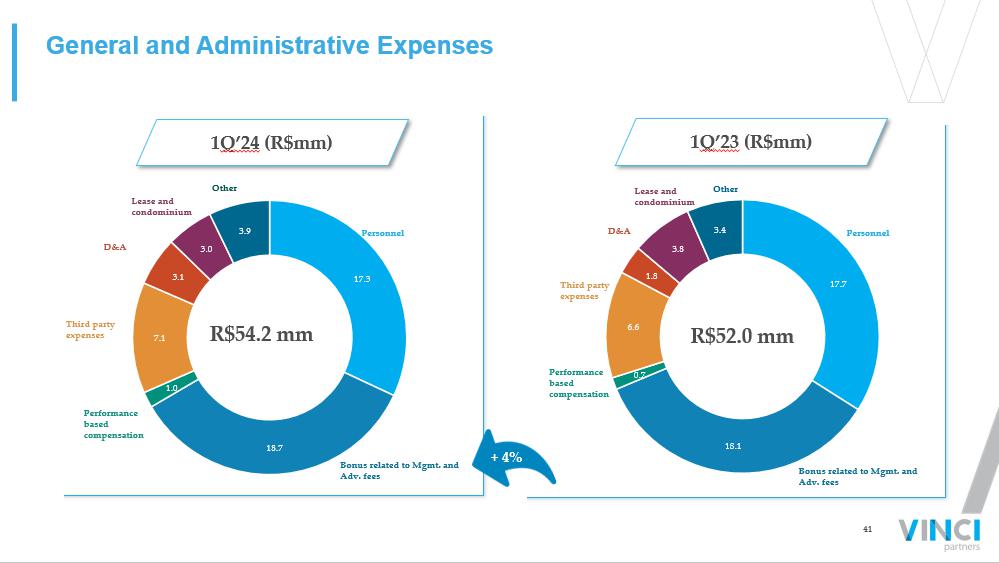
41 General and Administrative Expenses 1 Q’24 ( R$mm ) 1 Q’23 ( R$mm ) Lease and condominium Other Personnel Bonus related to Mgmt. and Adv. fees Performance based compensation Third party expenses D&A Personnel Bonus related to Mgmt. and Adv. fees Performance based compensation Third party expenses D&A Lease and condominium Other R$52.0 mm + 4% R$54.2 mm 17.7 18.1 0.7 6.6 1.8 3.8 3.4 17.3 18.7 1.0 7.1 3.1 3.0 3.9
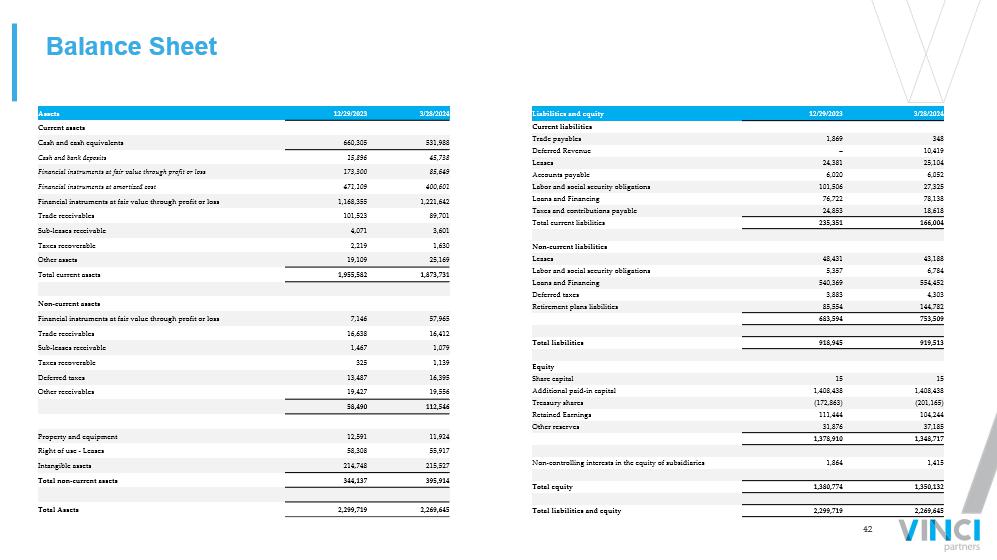
42 3/28/2024 12/29/2023 Assets Current assets 531,988 660,305 Cash and cash equivalents 45,738 15,896 Cash and bank deposits 85,649 173,300 Financial instruments at fair value through profit or loss 400,601 471,109 Financial instruments at amortized cost 1,221,642 1,168,355 Financial instruments at fair value through profit or loss 89,701 101,523 Trade receivables 3,601 4,071 Sub - leases receivable 1,630 2,219 Taxes recoverable 25,169 19,109 Other assets 1,873,731 1,955,582 Total current assets Non - current assets 57,965 7,146 Financial instruments at fair value through profit or loss 16,412 16,638 Trade receivables 1,079 1,467 Sub - leases receivable 1,139 325 Taxes recoverable 16,395 13,487 Deferred taxes 19,556 19,427 Other receivables 112,546 58,490 11,924 12,591 Property and equipment 55,917 58,308 Right of use - Leases 215,527 214,748 Intangible assets 395,914 344,137 Total non - current assets 2,269,645 2,299,719 Total Assets 3/28/2024 12/29/2023 Liabilities and equity Current liabilities 348 1,869 Trade payables 10,419 – Deferred Revenue 25,104 24,381 Leases 6,052 6,020 Accounts payable 27,325 101,506 Labor and social security obligations 78,138 76,722 Loans and Financing 18,618 24,853 Taxes and contributions payable 166,004 235,351 Total current liabilities Non - current liabilities 43,188 48,431 Leases 6,784 5,357 Labor and social security obligations 554,452 540,369 Loans and Financing 4,303 3,883 Deferred taxes 144,782 85,554 Retirement plans liabilities 753,509 683,594 919,513 918,945 Total liabilities Equity 15 15 Share capital 1,408,438 1,408,438 Additional paid - in capital (201,165) (172,863) Treasury shares 104,244 111,444 Retained Earnings 37,185 31,876 Other reserves 1,348,717 1,378,910 1,415 1,864 Non - controlling interests in the equity of subsidiaries 1,350,132 1,380,774 Total equity 2,269,645 2,299,719 Total liabilities and equity Balance Sheet
43 Notes and Definitions ▪ Notes to page 5 (1) AUM is calculated as consolidated with double counting, due to funds from one segment investing in other segments and it ´ s eliminated on consolidation and excluding double counting from co - managed funds between our segments. (2) FRE per share is calculated considering the number of outstanding shares at the end of the current quarter. Last twelve m ont hs values are calculated as the sum of the last four quarters. (3) Considers assets under management and advisory as of March 2024. ▪ Notes to page 7 (1) Considers assets under management and advisory as of March 2024. ▪ Notes to page 9 (1) FRE per share is calculated considering the number of outstanding shares at the end of the current quarter. Last twelve m ont hs values are calculated as the sum of the last four quarters. (2) Other items comprise the income/(loss) generated by financial income/(expenses) related to SPS acquisition and Ares inves tme nt and other financial expenses. (3) Non - operational expenses are comprised of expenses related to professional services rendered in connection with acquisitions . (4) DE per share is calculated considering the number of outstanding shares at the end of the current quarter. Last twelve mo nth s values are calculated as the sum of the last four quarters. ▪ Notes to page 11 (1) Long - term AUM includes funds with lockups for at least five years to quasi - perpetual capital commitments. ▪ Notes to page 12 (1) Long term products include funds with former lockups superior to five years. (2) Private markets strategies include Private Equity, Real Estate, Private Credit, Infrastructure and Vinci SPS. (3) Local Institutional covers Brazilian pension funds (public and private), insurance companies, large and mid - size corporation s and the government. (4) HNWI is comprised of clients which we consider to have potential to invest at least R$30 million. (5) Institutional Offshore covers offshore pension funds, endowments, sovereign funds, fund of funds, asset managers, family off ices, and others. (6) Allocators & Distributors include banks (private, mass affluent and retail sectors), multi - family offices, or MFOs, and dist ribution platforms. (7) Public Market Vehicles of our listed funds. ▪ Notes to page 13 (1) Accrued performance fees for the VCP offshore are as of 4Q’23. This occurs due to the 60 days timeline of the quarterly m ark up to be disclosed by the fund’s administrator. ▪ Notes to page 17 (1) FRE per share is calculated considering the number of outstanding shares at the end of the current quarter. Last twelve m ont hs values are calculated as the sum of the last four quarters.
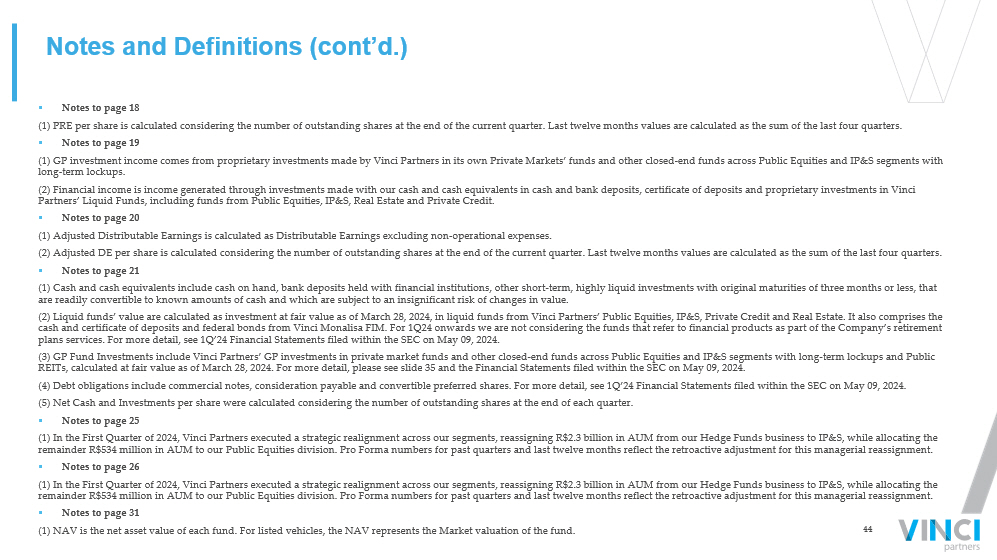
44 Notes and Definitions (cont’d.) ▪ Notes to page 18 (1) PRE per share is calculated considering the number of outstanding shares at the end of the current quarter. Last twelve m ont hs values are calculated as the sum of the last four quarters. ▪ Notes to page 19 (1) GP investment income comes from proprietary investments made by Vinci Partners in its own Private Markets’ funds and othe r c losed - end funds across Public Equities and IP&S segments with long - term lockups. (2) Financial income is income generated through investments made with our cash and cash equivalents in cash and bank deposit s, certificate of deposits and proprietary investments in Vinci Partners’ Liquid Funds, including funds from Public Equities, IP&S, Real Estate and Private Credit. ▪ Notes to page 20 (1) Adjusted Distributable Earnings is calculated as Distributable Earnings excluding non - operational expenses. (2) Adjusted DE per share is calculated considering the number of outstanding shares at the end of the current quarter. Last twe lve months values are calculated as the sum of the last four quarters. ▪ Notes to page 21 (1) Cash and cash equivalents include cash on hand, bank deposits held with financial institutions, other short - term, highly liq uid investments with original maturities of three months or less, that are readily convertible to known amounts of cash and which are subject to an insignificant risk of changes in value. (2) Liquid funds’ value are calculated as investment at fair value as of March 28, 2024, in liquid funds from Vinci Partners’ Pu blic Equities, IP&S, Private Credit and Real Estate. It also comprises the cash and certificate of deposits and federal bonds from Vinci Monalisa FIM. For 1Q24 onwards we are not considering the funds th at refer to financial products as part of the Company’s retirement plans services. For more detail, see 1Q’24 Financial Statements filed within the SEC on May 09, 2024. (3) GP Fund Investments include Vinci Partners’ GP investments in private market funds and other closed - end funds across Public Equities and IP&S segments with long - term lockups and Public REITs, calculated at fair value as of March 28, 2024. For more detail, please see slide 35 and the Financial Statements filed wi thin the SEC on May 09, 2024. (4) Debt obligations include commercial notes, consideration payable and convertible preferred shares. For more detail, see 1 Q’2 4 Financial Statements filed within the SEC on May 09, 2024. (5) Net Cash and Investments per share were calculated considering the number of outstanding shares at the end of each quarte r. ▪ Notes to page 25 (1) In the First Quarter of 2024, Vinci Partners executed a strategic realignment across our segments, reassigning R$2.3 bill ion in AUM from our Hedge Funds business to IP&S, while allocating the remainder R$534 million in AUM to our Public Equities division. Pro Forma numbers for past quarters and last twelve months re fle ct the retroactive adjustment for this managerial reassignment. ▪ Notes to page 26 (1) In the First Quarter of 2024, Vinci Partners executed a strategic realignment across our segments, reassigning R$2.3 bill ion in AUM from our Hedge Funds business to IP&S, while allocating the remainder R$534 million in AUM to our Public Equities division. Pro Forma numbers for past quarters and last twelve months re fle ct the retroactive adjustment for this managerial reassignment. ▪ Notes to page 31 (1) NAV is the net asset value of each fund. For listed vehicles, the NAV represents the Market valuation of the fund.
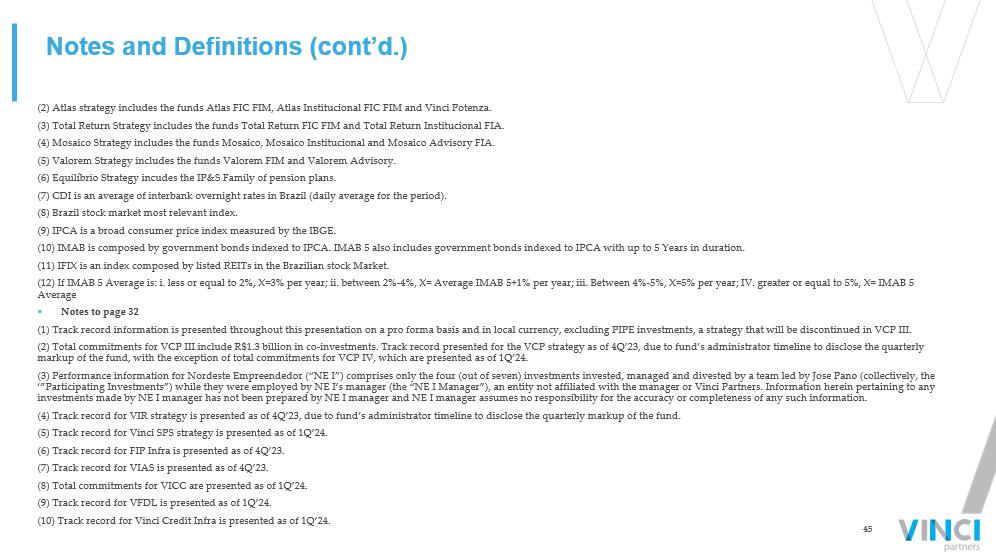
45 Notes and Definitions (cont’d.) (2) Atlas strategy includes the funds Atlas FIC FIM, Atlas Institucional FIC FIM and Vinci Potenza. (3) Total Return Strategy includes the funds Total Return FIC FIM and Total Return Institucional FIA. (4) Mosaico Strategy includes the funds Mosaico, Mosaico Institucional and Mosaico Advisory FIA. (5) Valorem Strategy includes the funds Valorem FIM and Valorem Advisory. (6) Equilíbrio Strategy incudes the IP&S Family of pension plans. (7) CDI is an average of interbank overnight rates in Brazil (daily average for the period). (8) Brazil stock market most relevant index. (9) IPCA is a broad consumer price index measured by the IBGE. (10) IMAB is composed by government bonds indexed to IPCA. IMAB 5 also includes government bonds indexed to IPCA with up to 5 Ye ars in duration. (11) IFIX is an index composed by listed REITs in the Brazilian stock Market. (12) If IMAB 5 Average is: i. less or equal to 2%, X=3% per year; ii. between 2% - 4%, X= Average IMAB 5+1% per year; iii. Between 4% - 5%, X=5% per year; IV. greater or equal to 5%, X= IMAB 5 Average ▪ Notes to page 32 (1) Track record information is presented throughout this presentation on a pro forma basis and in local currency, excluding PIP E investments, a strategy that will be discontinued in VCP III. (2) Total commitments for VCP III include R$1.3 billion in co - investments. Track record presented for the VCP strategy as of 4Q’ 23, due to fund’s administrator timeline to disclose the quarterly markup of the fund, with the exception of total commitments for VCP IV, which are presented as of 1Q’24. (3) Performance information for Nordeste Empreendedor (“NE I”) comprises only the four (out of seven) investments invested, managed and divested by a team led by Jose Pano (collec ti vely, the ‘”Participating Investments”) while they were employed by NE I’s manager (the “NE I Manager”), an entity not affiliated with the manager or Vinci Partners. Information herein pertaining to any investments made by NE I manager has not been prepared by NE I manager and NE I manager assumes no responsibility for the acc ura cy or completeness of any such information. (4) Track record for VIR strategy is presented as of 4Q’23, due to fund’s administrator timeline to disclose the quarterly ma rku p of the fund. (5) Track record for Vinci SPS strategy is presented as of 1Q’24. (6) Track record for FIP Infra is presented as of 4Q’23. (7) Track record for VIAS is presented as of 4Q’23. (8) Total commitments for VICC are presented as of 1Q’24. (9) Track record for VFDL is presented as of 1Q’24. (10) Track record for Vinci Credit Infra is presented as of 1Q’24.

46 Notes and Definitions (cont’d.) ▪ Notes to page 33 (1) US$ Distributable Earnings was calculated considering the exchange rate from USD to BRL of 5.0610, as of May 07, 2024, wh en dividends were approved by our Board of Directors. (2) Per Share calculations are based on end of period Participating Common Shares. (3) Actual dividends per common share are calculated considering the share count as of the applicable record date. ▪ Notes to page 34 (1) As of March 28, 2024, Public Float was comprised of 12,510,083 Class A common shares. ▪ Notes to page 35 (1) The remaining capital committed in FIP Infra Transmissão and FIP Infra Transmissão co - investment will not be called by the fund, which is already in divestment period. ▪ Notes to page 36 (1) International mandates have several different benchmarks across its vehicles. (2) The preferred return w/ catch - up rule applies to funds for which the vehicle must pay back its limited partners 100% of the invested capital corrected by the preferred return rate so it can charge performance fees. Once the preferred return rate is achieved, due to the catch - up clause, performance fees are charged over the absolute return of the fund instead of the excess return over the preferred rate. (3) Hurdle Rate is the minimum return the fund must achieve before it can charge performance fees. In most cases, funds with hur dle rate also are under a high - water mark clause . (4) Funds with preferred return must return 100% of invested capital corrected by the preferred return rate to its limited pa rtn ers in order to charge performance fees. (5) IPCA is a broad consumer price index measured by the IBGE. (6) IMAB 5 is composed by government bonds indexed to IPCA with up to 5 years in duration. (7) IBOV is the Brazilian stock market's most relevant index; (8) FTSE is London's stock market most relevant index; (9) IFIX is an index composed by listed REITs in the Brazilian stock exchange. (10) The CDI rate is a result of the average interbank overnight rates in Brazil (daily average for the period). (11) IMAB is composed by government bonds indexed to IPCA (inflation rate) plus a fixed interest rate. ▪ Notes to page 38 (1) Other items comprise the income/(loss) generated by contingent consideration adjustment and financial income/(expenses) r ela ted to SPS acquisition and Ares investment. (2) Non - operational expenses are comprised of expenses related to professional services rendered in connection with acquisitions .

47 Notes and Definitions (cont’d.) ( 3) Income taxes are comprised of taxes calculated over our corporate income tax and social contribution taxes. We are taxed o n a n actual taxable profit regime, while part of our subsidiaries are taxed based on deemed profit. (4) Contingent consideration adjustment (after - tax) related to Vinci SPS’ acquisition, reflects the change in the earn out’s fai r value to be paid in 2027. On March 28, 2024, Vinci revaluated the fair value of the obligation based on the economic conditions at the date, resulting in an increase of the contingent consideratio n f air value. The variation was recognized as a loss in the financial result. ▪ Notes to page 39 (1) Contingent consideration adjustment (after - tax) related to Vinci SPS’ acquisition, reflects the change in the earn out’s fai r value to be paid in 2027. On March 28, 2024, Vinci revaluated the fair value of the obligation based on the economic conditions at the date, resulting in an increase of the contingent consideratio n f air value. The variation was recognized as a loss in the financial result. (2) Non - operational expenses are comprised of expenses related to professional services rendered in connection with acquisitions . ▪ Notes to page 40 (1) Brazilian tax law establishes that companies that generate gross revenues of up to R$ 78,000.00 in the prior fiscal year may calculate income taxes as a percentage of gross revenue, using the presumed profit income tax regime. The Entity's subsidiaries adopted this tax regime and the effect of the presumed profit of su bsidiaries represents the difference between the taxation based on this method and the amount that would be due based on the statutory rate applied to the taxable profit of the subsidiaries.

48 Notes and Definitions (cont’d.) ▪ “Fee related earnings”, or “FRE”, is a metric to monitor the baseline performance of, and trends in, our business, in a manne r t hat does not include performance fees, investment income and expenses that do not arise from our normal course of operations. FRE is calculated as operating profit, less (a) net revenue fro m realized performance fees, less (b) net revenue from unrealized performance fees, plus (c) share - based payments, plus (d) compensation allocated in relation to performance fees, plus (e) non - o perational expenses, which are comprised of expenses relating to professional services rendered in connection with acquisitions and our international corporate organization. ▪ “FRE Margin” is calculated as FRE divided by the sum of net revenue from fund management and net revenue from advisory servic es. ▪ “Distributable Earnings”, or “DE”, is used as a reference point by our board of directors to assess our performance and capab ili ties to distribute dividends to our shareholders. Distributable Earnings is calculated as profit for the year, less (a) net revenue from unrealized performance fees, plus (b) income taxes f rom unrealized performance fees, plus (c) compensation allocated in relation to unrealized performance fees, less (d) unrealized gain from investment income, plus (e) income taxes on unrealized ga in from investment income, plus (f) share - based payments, plus (g) income taxes on share - based payments, plus (h) depreciation and amortization, except for depreciation and amortization relat ing to each segment’s investments, less (i) contingent consideration (earn - out) gain (loss) (after tax). ▪ “DE Margin” is calculated as Distributable Earnings divided by sum of net revenue from fund management, net revenue from perf orm ance fees, net revenue from advisory services and realized gain from investment income. ▪ “Performance Related Earnings”, or “PRE”, is a performance measure that we use to assess our ability to generate profits from re venue that relies on outcome from funds above their respective benchmarks. We calculate PRE as operating profit less (a) net revenue from fund management, less (b) net revenue from advisor y s ervices, plus (c) personnel and profit - sharing expenses, plus (d) other general and administrative expenses, less (e) compensation in relation to performance fees. ▪ “Segment Distributable Earnings” is Vinci Partners’ segment profitability measure used to make operating decisions and assess pe rformance across the company’s five segments (Private Markets, Public Equities, Investment Products and Solutions, Retirement Services and Corporate Advisory). Segment Distributab le Earnings is calculated as operating profit less (a) net revenue from unrealized performance fees, plus (b) compensation allocated in relation to unrealized performance fees, plus (c) realiz ed gain from GP investment income. ▪ “AUM” refers to assets under management. Our AUM equals the sum of: (1) the fair market value of all funds and management acc oun ts managed by Vinci Partners, across Private Equity, Real Estate, Infrastructure, Vinci SPS, Credit, IP&S, Public Equities and Retirement Services; (2) the capital that we are en tit led to call from investors in funds pursuant to the terms of their capital commitments to those funds; and (3) the fair market value of co - investments arranged by us that were made or could be ma de by limited partners of our corporate private equity funds and portfolio companies of such funds. AUM includes double counting related to funds from one segment that invest in funds fr om another segment. Those cases occur mainly due to (a) fund, of funds of investment products and solutions segment, and (b) investment funds in general that invest part of their cash in cre dit segment and hedge fund segment funds in order to maintain liquidity and provide for returns on cash. Such amounts are eliminated on consolidation. The bylaws of the relevant funds pro hib it double - charging fees on AUM across segments. Therefore, while our AUM by segment may double - count funds from one segment that invest in funds from another segment, the revenues for any given segment do not include revenue in respect of assets managed by another segment, which means there are no intercompany eliminations on revenues in our results of operation s. ▪ Net Cash and Investments include cash and cash equivalents and the fair value of investments in liquid funds and GP Fund Inve stm ents. Cash and cash equivalents include cash, certificate of deposits, which are issued by Banco Bradesco (credit rating AAA evaluated by Fitch Ratings) with interest rates from 99.5% to 10 1% of CDI.
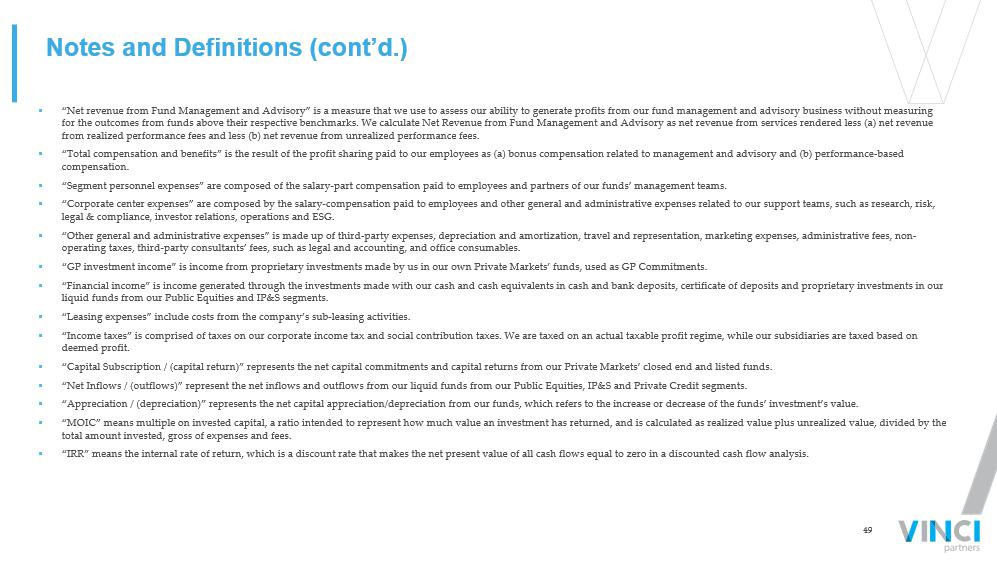
49 ▪ “Net revenue from Fund Management and Advisory” is a measure that we use to assess our ability to generate profits from our f und management and advisory business without measuring for the outcomes from funds above their respective benchmarks. We calculate Net Revenue from Fund Management and Advisory as net revenue from services rendered less (a) net revenue from realized performance fees and less (b) net revenue from unrealized performance fees. ▪ “Total compensation and benefits” is the result of the profit sharing paid to our employees as (a) bonus compensation related to management and advisory and (b) performance - based compensation. ▪ “Segment personnel expenses” are composed of the salary - part compensation paid to employees and partners of our funds’ managemen t teams. ▪ “Corporate center expenses” are composed by the salary - compensation paid to employees and other general and administrative expen ses related to our support teams, such as research, risk, legal & compliance, investor relations, operations and ESG. ▪ “Other general and administrative expenses” is made up of third - party expenses, depreciation and amortization, travel and repres entation, marketing expenses, administrative fees, non - operating taxes, third - party consultants’ fees, such as legal and accounting, and office consumables. ▪ “GP investment income” is income from proprietary investments made by us in our own Private Markets’ funds, used as GP Commit men ts. ▪ “Financial income” is income generated through the investments made with our cash and cash equivalents in cash and bank depos its , certificate of deposits and proprietary investments in our liquid funds from our Public Equities and IP&S segments. ▪ “Leasing expenses” include costs from the company’s sub - leasing activities. ▪ “Income taxes” is comprised of taxes on our corporate income tax and social contribution taxes. We are taxed on an actual tax abl e profit regime, while our subsidiaries are taxed based on deemed profit. ▪ “Capital Subscription / (capital return)” represents the net capital commitments and capital returns from our Private Markets ’ c losed end and listed funds. ▪ “Net Inflows / (outflows)” represent the net inflows and outflows from our liquid funds from our Public Equities, IP&S and Pr iva te Credit segments. ▪ “Appreciation / (depreciation)” represents the net capital appreciation/depreciation from our funds, which refers to the incr eas e or decrease of the funds’ investment’s value. ▪ “MOIC” means multiple on invested capital, a ratio intended to represent how much value an investment has returned, and is ca lcu lated as realized value plus unrealized value, divided by the total amount invested, gross of expenses and fees. ▪ “IRR” means the internal rate of return, which is a discount rate that makes the net present value of all cash flows equal to ze ro in a discounted cash flow analysis.

50 Funds/strategies’ descriptions ▪ Vinci Multiestratégia : The fund seeks to achieve long - term returns by investing in fixed income assets, through strategies that imply interest rates and currency risks. ▪ Vinci Atlas: The fund seeks to achieve long - term returns by investing across all strategies within fixed income, equities, curre ncy, derivatives, commodities and other investment funds with no obligation of any class concentration. ▪ Vinci Mosaico FIA: Public Equities’ long only flagship strategy. The strategy seeks to achieve long - term returns above Brazilian equities market (Ibovespa) based on a fundamental analysis. ▪ Vinci Gas Dividendos : Public Equities’ dividends flagship strategy. The strategy seeks to achieve long - term returns by investing in companies with a consistent history of paying dividends in the Brazilian stock market. ▪ Vinci Total Return: The fund seeks to achieve medium and long - term returns by investing most of its capital in the Brazilian sto ck market, through bottom up and top - down strategies. ▪ Vinci Valorem: IP&S flagship commingled fund with exposure to fixed income assets, foreign exchange currency and derivatives. ▪ Equilibrio Strategy: IP&S family of pension plan funds. The strategy seeks to achieve long - term returns by investing across all strategies within fixed income, equities, currency, derivatives, commodities and other investment funds, respecting limitations in regulation. ▪ Vinci Selection Equities: The fund seeks to beat the Brazilian stock market index by investing in other funds that invest in Bra zilian public equities. ▪ Vinci Crédito Imobiliário I: The fund seeks to achieve long - term returns by investing in real estate mortgage - backed credit secu rity bonds. ▪ Vinci Crédito Estruturado Multiestratégia PLUS FIC FIM: The fund seeks to achieve consistent returns by investing in private structured credit bonds. ▪ VISC11: Shopping malls listed REIT, focused on acquiring income - generating shopping malls in Brazil. ▪ VILG11: Industrial listed REIT focused on acquiring mature income - generating industrial properties in Brazil. ▪ VINO11: Listed REIT focused on acquiring mature income - generating boutique office real estate assets in Brazil. ▪ VIFI11: Listed REIT that invests in other listed REITs and real estate mortgage - backed credit security bonds. ▪ VIUR11: perpetual capital listed REIT, focused on income generation to its quota holders through the acquisition of urban com mer cial properties in Brazil, such as street retail, grocery, healthcare, and educational focused real estate properties. ▪ VCRI11: Listed REIT that aims to invest in MBS, while also being able to invest in listed REITs with similar investment strat egi es. ▪ VICA11: VICA is a perpetual capital fund that shall invest in a diversified credit portfolio within the Agri sector in Brazil . ▪ Vinci FOF Imobiliário: Fund of Funds that invests in other listed REITs, combining income with capital gain.

Rio de Janeiro 55 21 2159 6000 Av. Bartolomeu Mitre, 336 Leblon - 22431 - 002 São Paulo 55 11 3572 3700 Av. Brigadeiro Faria Lima, 2.277 14 o andar Jardim Paulistano - 01452 - 000 Recife 55 81 3204 6811 Av. República do Líbano, 251 - Sala 301 Torre A - Pina - 51110 - 160 Nova York 1 646 559 8000 780 Third Avenue, 25 th Floor - 10017 New York
Exhibit 99.2


Vinci Partners Reports First Quarter 2024 Results
Alessandro Horta, Chief Executive Officer, stated,
“Vinci posted another quarter with double digit growth in Fee Related Earnings, pushed by strong fundraising across Private Markets
products over the last twelve months and advisory fees in the first quarter. Despite the challenges posed by a turbulent global market,
marked by uncertainties in interest rates impacting asset performance and fundraising opportunities across various strategies, we have
demonstrated resilience and patience, performing well across the board."
Dividend
Vinci Partners has declared a quarterly dividend
of US$0.17 per share to record holders of common stock at the close of business on May 23, 2024. This dividend will be paid on June 07,
2024.
First Quarter 2024 Highlights
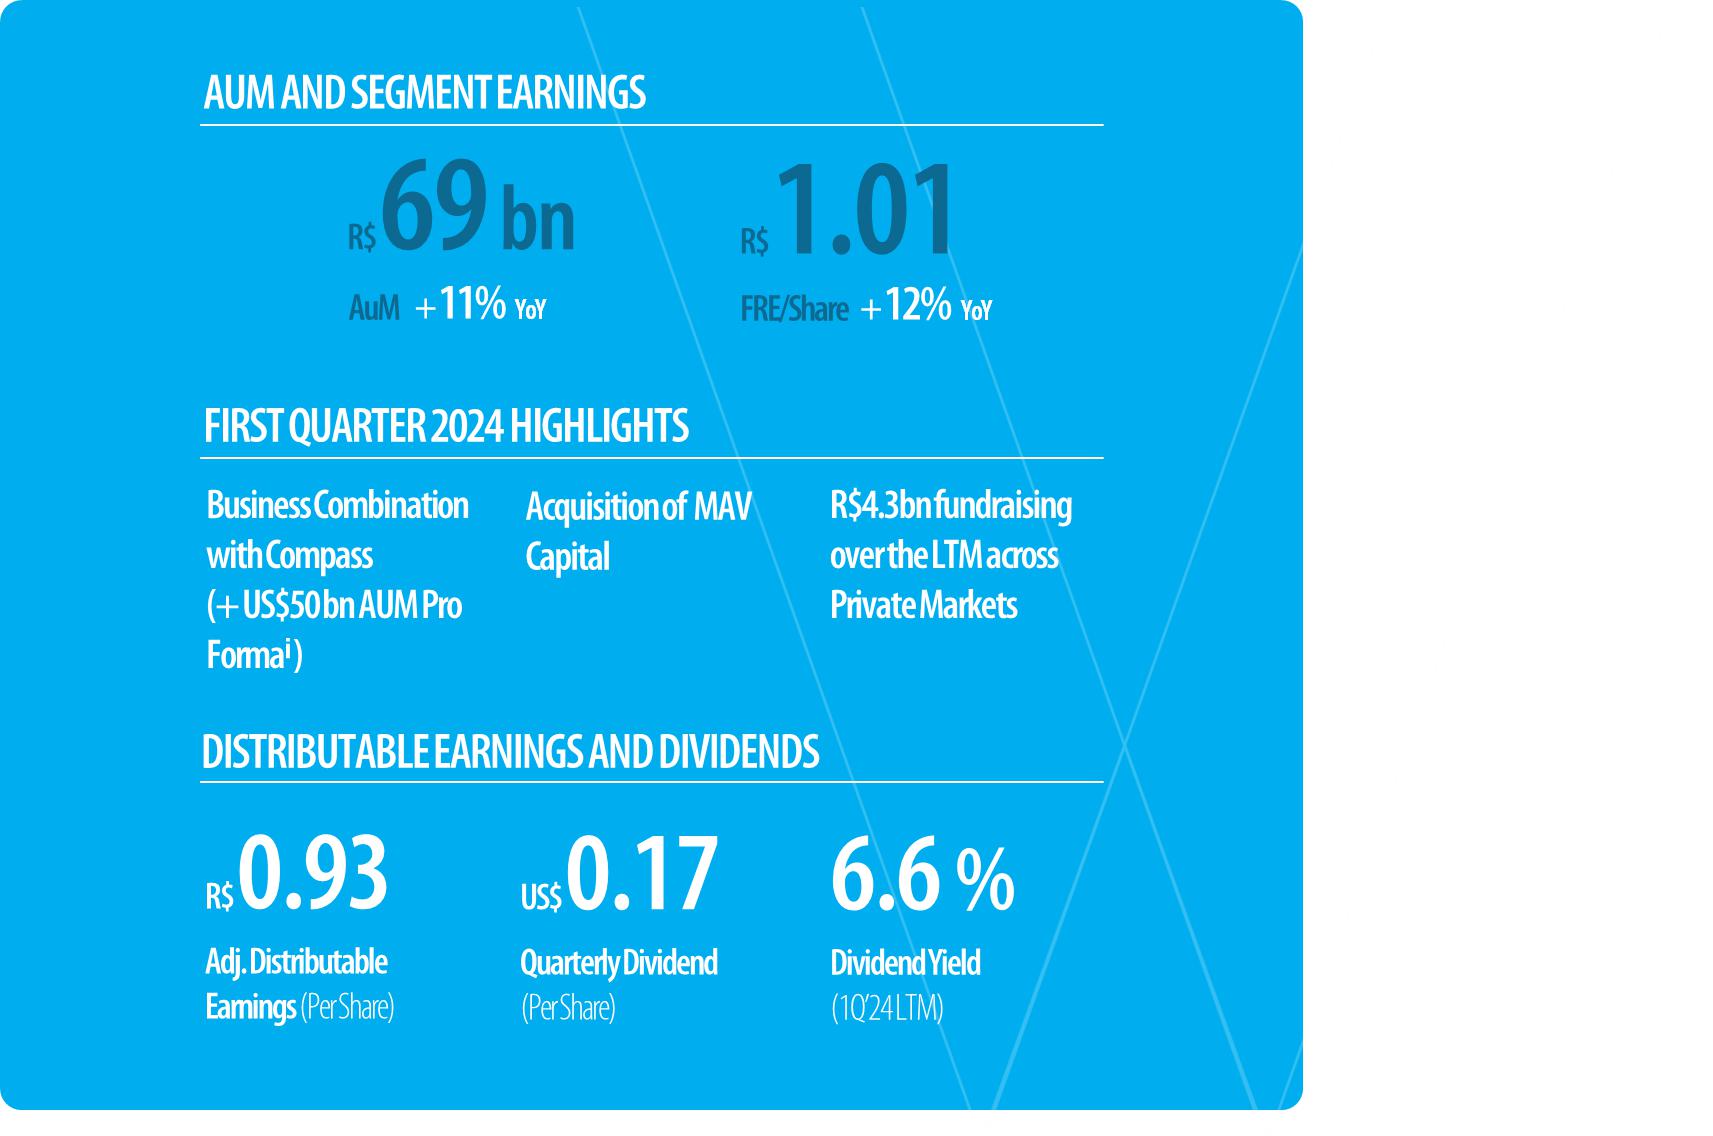
 IR.VINCIPARTNERS.COM SHAREHOLDERRELATIONS@VINCIPARTNERS.COM IR.VINCIPARTNERS.COM SHAREHOLDERRELATIONS@VINCIPARTNERS.COM
|  |
About
Vinci Partners
Vinci
Partners is a leading alternative investment platform in Brazil, established in 2009.
Vinci
Partners’ business segments include Private Markets (Private Equity, Real Estate, Infrastructure, Special Situations and Private
Credit), Public Equities, Investment Products and Solutions, Corporate Advisory and Retirement Services. As of March 28, 2024, the firm
had R$69 billion of assets under management.
Webcast
and Earnings Conference Call
Vinci
Partners will host a conference call at 5:00pm ET on Thursday, May 09, 2024, to announce its first quarter 2024 results.
To
access the webcast please visit the Events & Presentations’ section of the Company's website at:
https://ir.vincipartners.com/news-and-events/events.
For
those unable to listen to the live broadcast, there will be a webcast replay on the same section of the website.
To
access the conference call through dial in, please register at 1Q24 VINP Earnings Dial In
to obtain the conference number and access code.
 Investor Contact
ShareholderRelations@vincipartners.com
NY:
+1 (646) 559-8040
RJ:
+55 (21) 2159-6240
 USA Media Contact
Joele
Frank, Wilkinson Brimmer Katcher
Kate
Thompson
+1
(212) 355-4449
Brazil Media Contact
Danthi
Comunicações
Carla
Azevedo (carla@danthicomunicacoes.com.br)+55 (21)
3114-0779
IR.VINCIPARTNERS.COM SHAREHOLDERRELATIONS@VINCIPARTNERS.COM | |
Segment
Earnings
| (R$ thousands,
unless mentioned) |
1Q'23 |
4Q'23 |
1Q'24 |
∆
YoY(%) |
1Q'23
LTM |
1Q'24
LTM |
∆
YoY(%) |
| Net revenue from management fees |
95,877 |
99,976 |
96,455 |
1% |
380,149 |
393,945 |
4% |
| Net revenue from advisory fees |
4,468
|
18,998
|
10,359
|
132%
|
22,788
|
45,690
|
101%
|
| Total Fee Related Revenues[ii] |
100,345
|
118,974
|
106,814
|
6%
|
402,937
|
439,635
|
9%
|
| Segment personnel expenses |
(7,164) |
(7,462) |
(7,337) |
2% |
(26,069) |
(29,859) |
15% |
| Other G&A expenses |
(3,458) |
(6,573) |
(5,996) |
73% |
(17,338) |
(22,961) |
32% |
| Corporate center expenses |
(22,606) |
(21,499) |
(21,087) |
(7)% |
(88,615) |
(89,105) |
1% |
| Bonus compensation related to management and advisory |
(18,062) |
(26,143) |
(18,748) |
4%
|
(74,108) |
(84,686) |
14%
|
| Total Fee Related Expenses |
(51,290) |
(61,677) |
(53,168) |
4%
|
(206,130) |
(226,611) |
10%
|
| FEE RELATED EARNINGS (FRE)[iii] |
49,055 |
57,297 |
53,646 |
9% |
196,807
|
213,024
|
8% |
| FRE Margin (%)[iv] |
48.9% |
48.2% |
50.2% |
|
48.8% |
48.5% |
|
| FRE per share[v]
(R$/share) |
0.90 |
1.07 |
1.01 |
12% |
3.57 |
3.96 |
11% |
| Net revenue from performance fees |
1,963 |
6,468 |
2,273 |
16% |
13,391 |
21,564 |
61% |
| Performance based compensation |
(733) |
(3,614) |
(1,009) |
38% |
(6,255) |
(10,916) |
75% |
| PERFORMANCE RELATED EARNINGS (PRE)[vi] |
1,230 |
2,854 |
1,264 |
3% |
7,136 |
10,648 |
49% |
| PRE Margin (%)[vii] |
62.7% |
44.1% |
55.6% |
|
53.3% |
49.4% |
|
| (-) Unrealized performance fees |
– |
1,042 |
– |
N/A |
4,254 |
1,042 |
(76)% |
| (+) Unrealized performance compensation |
– |
(369) |
– |
N/A |
(1,503) |
(369) |
(75)% |
| (+) Realized GP investment income |
5,881 |
4,451 |
4,406 |
(25)% |
24,007 |
17,735 |
(26)% |
| SEGMENT DISTRIBUTABLE EARNINGS[viii] |
56,166 |
65,275 |
59,316 |
6% |
230,701
|
242,080
|
5% |
| Segment DE Margin (%) |
51.9% |
49.9% |
52.3% |
|
51.9% |
50.4% |
|
| (+) Depreciation and amortization |
1,778 |
1,858 |
1,891 |
6% |
5,780 |
7,423 |
28% |
| (+) Realized financial income |
20,089 |
22,046 |
12,362 |
(38)% |
82,051 |
76,618 |
(7)% |
| (-) Leasing expenses |
(2,631) |
(2,267) |
(2,216) |
(16)% |
(9,518) |
(9,394) |
(1)% |
| (-) Other items[ix] |
(3,900) |
(6,446) |
(9,236) |
137% |
(8,482) |
(24,155) |
185% |
| (-) Non-operational expenses[x] |
– |
(1,924) |
(1,333) |
N/A |
(1,485) |
(3,257) |
N/A |
| (-) Income taxes (excluding related to unrealized fees
and income) |
(11,496) |
(16,532) |
(12,487) |
9% |
(49,972) |
(56,819) |
14% |
| DISTRIBUTABLE EARNINGS (DE)[xi] |
60,006 |
62,010 |
48,297 |
(20)% |
249,075
|
232,496
|
(7)% |
| DE Margin (%)[xii] |
46.8% |
40.5% |
38.4% |
|
47.3% |
41.8% |
|
| DE per share (R$/share) |
1.10 |
1.15 |
0.91 |
(17)% |
4.52 |
4.32 |
(4)% |
| (+) Non-operational expenses (including Income Tax
effect) |
– |
1,631 |
1,308 |
N/A |
988 |
2,939 |
197% |
| ADJUSTED DISTRIBUTABLE EARNINGS[xiii] |
60,006 |
63,641 |
49,605 |
(17)% |
250,063
|
235,435
|
(6)% |
| Adjusted DE Margin (%)[xiv] |
46.8% |
41.6% |
39.4% |
|
47.5% |
42.3% |
|
| Adjusted DE per share (R$/share) [xv] |
1.10 |
1.18 |
0.93 |
(15)% |
4.53 |
4.38 |
(3)% |
Total
Fee-Related Revenues of R$106.8 million for the quarter ended March 28, 2024, compared to R$100.3 million for the quarter ended March
31, 2023, an increase of 6% year-over year. This growth was propelled by a strong quarter for the Corporate Advisory segment. Management
fees for the quarter remained flat on a year-over-year basis. Although Private Markets revenues continue to grow pushed by strong fundraising,
the pension plans strategy within IP&S encountered headwinds caused by volatile markets. Fee-related revenues were R$439.6 million
for the last twelve months ended March 28, 2024, up 9% when compared to the last twelve months ended March 31, 2023. This growth was
driven by strong fundraising across Private Markets' products and a higher level of advisory fees.
Fee
Related Earnings (“FRE”) of R$53.6 million (R$1.01/share) for the quarter ended March 28, 2024, up 9% year-over-year
on an absolute basis and 12% year-over-year on an FRE per share basis when compared the quarter ended March 31, 2023, driven by a higher
level of advisory fees in the 1Q’24. FRE of R$213.0 million (R$3.96/share) for the last twelve months ended March 28, 2024, up
8% when compared to the last twelve months ended March 31, 2023 on an absolute basis and 11% on an FRE per share basis, driven by stronger
management and advisory fees.
FRE
Margin was 50.2% for the quarter ended March 28, 2024, an increase of 1.3 percentage point year-over-year, following our cost efficiency
orientation to contain expenses growth.
IR.VINCIPARTNERS.COM SHAREHOLDERRELATIONS@VINCIPARTNERS.COM | |
Performance
Related Earnings (“PRE”) of R$1.3 million for the quarter ended March 28, 2024, up 3% year-over-year. PRE was R$10.6
million (R$0.20/share) for the last twelve months ended March 28, 2024, an increase of 49% when compared to the last twelve months ended
March 31, 2023. Most of our open-end funds charge performance fees semiannually, recognizing revenues in June and December, thus it's
typical for the first and third quarters to exhibit lower performance levels for domestic open-ended funds.
Segment
Distributable Earnings of R$59.3 million for the quarter ended March 28, 2024, compared to R$56.2 million for the quarter ended March
31, 2023, up 6% year-over-year. Segment Distributable Earnings were R$242.1 million for the last twelve months ended March 28, 2024,
up 5% year-over-year, when compared to the last twelve months ended March 31, 2023.
Adjusted
Distributable Earnings (“DE”) of R$49.6 million (R$0.93/share) for the quarter ended March 28, 2024, compared to R$60.0
million (R$1.10/share) for the quarter ended March 31, 2023, down 17% year-over-year on an absolute basis and 15% year-over-year on an
Adjusted DE per share basis, due to a weaker quarter for the Financial Income, following a challenging macroeconomic environment that
has negatively impacted our liquid portfolio in the quarter. Adjusted DE was R$235.4 million (R$4.38/share) for the last twelve months
ended March 28, 2024, down 6% when compared to the last twelve months ended March 31, 2023, on an absolute basis and down 3% on an Adjusted
DE per share basis.
Adjusted
DE Margin was 39.4% for the quarter ended March 28, 2024, a 7.4 percentage point decrease compared to 46.8% for the quarter ended
March 31, 2023, due to a weaker quarter for financial income, that carry a lower income tax bracket. For the last twelve months ended
March 28, 2024, Adjusted DE Margin reached 42.3%, a decrease of 5.2 percentage points compared to the last twelve months ended March
31, 2023.
IR.VINCIPARTNERS.COM SHAREHOLDERRELATIONS@VINCIPARTNERS.COM | |
Segment
Highlights
Private Market
Strategies
| (R$ thousands,
unless mentioned) |
1Q'23 |
4Q'23 |
1Q'24 |
∆
YoY (%) |
1Q'23
LTM |
1Q'24
LTM |
∆
YoY (%) |
| Net revenue from management fees |
58,432 |
66,363 |
62,519 |
7% |
218,734 |
255,046 |
17% |
| Net revenue from advisory fees |
275
|
1,648
|
554
|
102%
|
2,865
|
2,751
|
(4)% |
| Total Fee Related Revenues |
58,706
|
68,011
|
63,073
|
7%
|
221,598
|
257,798
|
16%
|
| Segment personnel expenses |
(3,509) |
(3,616) |
(3,707) |
6% |
(12,630) |
(14,727) |
17% |
| Other G&A expenses |
(1,438) |
(2,378) |
(2,856) |
99% |
(8,592) |
(10,609) |
23% |
| Corporate center expenses |
(13,018) |
(13,502) |
(12,937) |
(1)% |
(47,922) |
(54,511) |
14% |
| Bonus compensation related to management and advisory |
(9,111) |
(12,963) |
(8,978) |
(1)% |
(35,955) |
(40,867) |
14%
|
| Total Fee Related Expenses |
(27,076) |
(32,459) |
(28,478) |
5% |
(105,100) |
(120,714) |
15% |
| FEE RELATED EARNINGS (FRE) |
31,630 |
35,552 |
34,595 |
9% |
116,499
|
137,084
|
18% |
| FRE Margin (%) |
53.9% |
52.3% |
54.8% |
|
52.6% |
53.2% |
|
| Net revenue from performance fees |
7 |
1,983 |
8 |
8% |
2,826 |
4,983 |
76% |
| Realized performance fees |
7 |
3,025 |
8 |
8% |
7,080 |
6,024 |
(15)% |
| Unrealized performance fees |
– |
(1,042) |
– |
N/A |
(4,254) |
(1,042) |
(76)% |
| Performance based compensation |
(3) |
(970) |
(3) |
34% |
(1,165) |
(2,297) |
97% |
| PERFORMANCE RELATED EARNINGS (PRE) |
5 |
1,014 |
4 |
(7)% |
1,661 |
2,686 |
62% |
| PRE Margin (%) |
64.6% |
51.1% |
55.8% |
|
58.8% |
53.9% |
|
| (-) Unrealized performance fees |
– |
1,042 |
– |
N/A |
4,254 |
1,042 |
(76)% |
| (+) Unrealized performance compensation |
– |
(369) |
– |
N/A |
(1,503) |
(369) |
(75)% |
| (+) Realized GP investment income |
5,881 |
4,451 |
4,406 |
(25)% |
24,007 |
17,735 |
(26)% |
| SEGMENT DISTRIBUTABLE EARNINGS |
37,516 |
41,689 |
39,005 |
4% |
144,918
|
158,178
|
9% |
| Segment DE Margin (%) |
58.1% |
55.2% |
57.8% |
|
57.4% |
56.2% |
|
| |
|
|
|
|
|
|
|
| ASSETS UNDER MANAGEMENT (AUM[xvi]
R$ millions) |
28,198 |
32,956 |
33,018 |
17% |
28,198 |
33,018 |
17% |
| FEE EARNING ASSETS UNDER MANAGEMENT (FEAUM R$ millions) |
24,825 |
29,706 |
29,763 |
20% |
24,825 |
29,763 |
20% |
| AVERAGE MANAGEMENT FEE RATE (%) |
0.87% |
0.89% |
0.80% |
|
0.88% |
0.88% |
|
Fee
related earnings (FRE) of R$34.6 million for the quarter ended March 28, 2024, up 9% year-over-year. This growth was driven by the
strong fundraising in 2023 across Private Equity, Infrastructure and Real Estate. FRE was R$ 137.1 million for the last twelve months
ended March 28, 2024, an increase of 18% when compared to the last twelve months ended March 31, 2023.
Segment
Distributable Earnings of R$39.0 million for the quarter ended March 28, 2024, up 4% when compared to the quarter ended March 31,
2023, driven primarily by a higher Fee Related Earnings in the quarter. Segment DE was R$158.2 million over the last twelve months ended
March 28, 2024, up 9% when compared to the last twelve months ended March 31, 2023, boosted by growth in FRE and PRE.
AUM
of R$33.0 billion at the end of the first quarter, a 17% year-over-year increase propelled by robust fundraising across VCP IV, in
Private Equity, VICC, in Infrastructure and VISC, in Real Estate.
IR.VINCIPARTNERS.COM SHAREHOLDERRELATIONS@VINCIPARTNERS.COM | |
Investment
Products and Solutions
| (R$ thousands,
unless mentioned) |
1Q'23
PF[xvii] |
4Q'23
PF |
1Q'24 |
∆
YoY (%) |
1Q'23
LTM PF |
1Q'24
LTM PF |
∆
YoY (%) |
| Net revenue from management fees |
22,817 |
19,349 |
19,814 |
(13)% |
98,635 |
80,451 |
(18)% |
| Net revenue from advisory fees |
7
|
8
|
8
|
13%
|
28
|
32
|
14%
|
| Total Fee Related Revenues |
22,825
|
19,357
|
19,822
|
(13)% |
98,664
|
80,483
|
(18)% |
| Segment personnel expenses |
(1,832) |
(1,801) |
(1,627) |
(11)% |
(6,614) |
(7,244) |
10% |
| Other G&A expenses |
(1,292) |
(1,816) |
(1,008) |
(22)% |
(4,916) |
(4,972) |
1% |
| Corporate center expenses |
(5,084) |
(3,937) |
(4,100) |
(19)% |
(21,951) |
(17,241) |
(21)% |
| Bonus compensation related to management and advisory |
(5,255) |
(4,011) |
(3,952) |
(25)% |
(21,774) |
(17,371) |
(20)% |
| Total Fee Related Expenses |
(13,462) |
(11,564) |
(10,687) |
(21)% |
(55,253) |
(46,826) |
(15)% |
| FEE RELATED EARNINGS (FRE) |
9,362 |
7,793 |
9,135 |
(2)% |
43,410 |
33,657 |
(22)% |
| FRE Margin (%) |
41.0% |
40.3% |
46.1% |
|
44.0% |
41.8% |
|
| Net revenue from performance fees |
790 |
1,995 |
9 |
(99)% |
6,334 |
3,913 |
(38)% |
| Realized performance fees |
790 |
1,995 |
9 |
(99)% |
6,334 |
3,913 |
(38)% |
| Unrealized performance fees |
– |
– |
– |
N/A |
– |
– |
N/A |
| Performance based compensation |
(316) |
(994) |
(4) |
(99)% |
(3,244) |
(1,948) |
(40)% |
| PERFORMANCE RELATED EARNINGS (PRE) |
474 |
1,001 |
4 |
(99)% |
3,089 |
1,965 |
(36)% |
| PRE Margin (%) |
60.0% |
50.2% |
50.0% |
|
48.8% |
50.2% |
|
| (-) Unrealized performance fees |
– |
– |
– |
N/A |
– |
– |
N/A |
| (+) Unrealized performance compensation |
– |
– |
– |
N/A
|
– |
– |
N/A
|
| SEGMENT DISTRIBUTABLE EARNINGS |
9,837 |
8,793 |
9,139 |
(7)% |
46,500 |
35,621 |
(23)% |
| Segment DE Margin (%) |
41.7% |
41.2% |
46.1% |
|
44.3% |
42.2% |
|
| |
|
|
|
|
|
|
|
| ASSETS UNDER MANAGEMENT (AUM R$ millions) |
26,599 |
25,426 |
25,756 |
(3)% |
26,599 |
25,756 |
(3)% |
| FEE EARNING ASSETS UNDER MANAGEMENT (FEAUM R$ millions) |
26,288 |
25,179 |
25,507 |
(3)% |
26,288 |
25,507 |
(3)% |
| AVERAGE MANAGEMENT FEE RATE (%) |
0.37% |
0.33% |
0.34% |
|
0.40% |
0.34% |
|
This
quarter, we executed a strategic realignment across our segments. In response to the evolving dynamics of our funds and the strategic
vision of our management team, we reassigned a portion of our Hedge Funds business to IP&S (R$2.3 billion).
Fee
related earnings (FRE) of R$9.1 million for the quarter ended March 28, 2024, down 2% year-over-year. FRE was R$33.7 million over
the last twelve months ended March 28, 2024 Pro Forma, a decrease of 22% when compared to the last twelve months ended March 31, 2023
Pro Forma. This decrease is attributed to outflows, especially within our pension funds strategy, which carries higher fees.
Performance
related earnings (PRE) was R$2.0 million over the last twelve months ended March 28, 2024 Pro Forma, a decrease of 36% when compared
to the last twelve months ended March 31, 2023 Pro Forma.
Segment
Distributable Earnings of R$9.1 million for the quarter ended March 28, 2024, down 7% year-over-year. Segment DE was R$35.6 million
over the last twelve months ended March 28, 2024 Pro Forma, a decrease of 23% when compared to the last twelve months ended March 31,
2023 Pro Forma, that posted higher contribution from FRE and PRE.
AUM
of R$25.8 billion, down 3% year-over-year.
IR.VINCIPARTNERS.COM SHAREHOLDERRELATIONS@VINCIPARTNERS.COM | |
Public Equities
| (R$ thousands,
unless mentioned) |
1Q'23
PF |
4Q'23
PF |
1Q'24 |
∆
YoY (%) |
1Q'23
LTM PF |
1Q'24
LTM PF |
∆
YoY (%) |
| Net revenue from management fees |
14,628 |
14,145 |
13,964 |
(5)% |
62,780 |
58,124 |
(7)% |
| Net revenue from advisory fees |
– |
– |
– |
N/A
|
– |
– |
N/A
|
| Total Fee Related Revenues |
14,628
|
14,145
|
13,964
|
(5)% |
62,780
|
58,124
|
(7)% |
| Segment personnel expenses |
(931) |
(875) |
(889) |
(4)% |
(3,401) |
(3,576) |
5% |
| Other G&A expenses |
(280) |
(315) |
(344) |
23% |
(1,695) |
(1,430) |
(16)% |
| Corporate center expenses |
(3,259) |
(2,878) |
(2,890) |
(11)% |
(13,972) |
(12,454) |
(11)% |
| Bonus compensation related to management and advisory |
(2,074) |
(1,798) |
(2,004) |
(3)% |
(9,703) |
(8,263) |
(15)% |
| Total Fee Related Expenses |
(6,544) |
(5,866) |
(6,126) |
(6)% |
(28,771) |
(25,722) |
(11)% |
| FEE RELATED EARNINGS (FRE) |
8,084 |
8,279 |
7,838 |
(3)% |
34,008 |
32,403 |
(5)% |
| FRE Margin (%) |
55.3% |
58.5% |
56.1% |
|
54.2% |
55.7% |
|
| Net revenue from performance fees |
1,166 |
2,491 |
2,257 |
94% |
4,232 |
12,670 |
199% |
| Realized performance fees |
1,166 |
2,491 |
2,257 |
94% |
4,232 |
12,670 |
199% |
| Unrealized performance fees |
– |
– |
– |
N/A |
– |
– |
N/A |
| Performance based compensation |
(415) |
(1,651) |
(1,001) |
141%
|
(1,845) |
(6,672) |
262%
|
| PERFORMANCE RELATED EARNINGS (PRE) |
751 |
840 |
1,255 |
67% |
2,386 |
5,997 |
151% |
| PRE Margin (%) |
64.4% |
33.7% |
55.6% |
|
56.4% |
47.3% |
|
| (-) Unrealized performance fees |
– |
– |
– |
N/A |
– |
– |
N/A |
| (+) Unrealized performance compensation |
– |
– |
– |
N/A
|
– |
– |
N/A
|
| SEGMENT DISTRIBUTABLE EARNINGS |
8,835 |
9,119 |
9,093 |
3% |
36,395 |
38,398 |
6% |
| Segment DE Margin (%) |
55.9% |
54.8% |
56.1% |
|
54.3% |
54.2% |
|
| |
|
|
|
|
|
|
|
| ASSETS UNDER MANAGEMENT (AUM R$ millions) |
7,434 |
10,055 |
9,910 |
33% |
7,434 |
9,910 |
33% |
| FEE EARNING ASSETS UNDER MANAGEMENT (FEAUM R$ millions) |
7,374 |
10,005 |
9,859 |
34% |
7,374 |
9,859 |
34% |
| AVERAGE MANAGEMENT FEE RATE (%) |
0.83% |
0.64% |
0.60% |
|
0.84% |
0.68% |
|
This
quarter, we executed a strategic realignment across our segments. In response to the evolving dynamics of our funds and the strategic
vision of our management team, we reassigned a portion of our Hedge Funds business to Public Equities (R$ 533.6 million).
Fee
related earnings (FRE) of R$7.8 million for the quarter ended March 28, 2024, down 3% year-over-year. FRE was R$32.4 million over
the last twelve months ended March 28, 2024 Pro Forma, a decrease of 5% when compared to the last twelve months ended March 31, 2023
Pro Forma.
Performance
related earnings (PRE) of R$1.3 million for the quarter ended March 28, 2024, up 67% year-over-year. PRE was R$6.0 million over the
last twelve months ended March 28, 2024 Pro Forma, an increase of 151% when compared to the last twelve months ended March 31, 2023 Pro
Forma.
Segment
Distributable Earnings of R$9.1 million for the quarter ended March 28, 2024, up 3% year-over-year. Segment DE was R$38.4 million
over the last twelve months ended March 28, 2024 Pro Forma, an increase of 6% when compared to the last twelve months ended March 31,
2023 Pro Forma, due to higher contributions from PRE.
AUM
was R$9.9 billion at the end of the first quarter, up 33% year-over-year.
IR.VINCIPARTNERS.COM SHAREHOLDERRELATIONS@VINCIPARTNERS.COM | |
Corporate Advisory
| (R$ thousands,
unless mentioned) |
1Q'23 |
4Q'23 |
1Q'24 |
∆
YoY (%) |
1Q'23
LTM |
1Q'24
LTM |
∆
YoY (%) |
| Net revenue from management fees |
– |
– |
– |
N/A |
– |
– |
N/A |
| Net revenue from advisory fees |
4,186
|
17,343
|
9,797
|
134%
|
19,894
|
42,907
|
116%
|
| Total Fee Related Revenues |
4,186
|
17,343
|
9,797
|
134%
|
19,894
|
42,907
|
116%
|
| Segment personnel expenses |
(471) |
(574) |
(553) |
17% |
(1,975) |
(2,143) |
8% |
| Other G&A expenses |
(74) |
(723) |
(170) |
130% |
(408) |
(1,363) |
234% |
| Corporate center expenses |
(1,130) |
(1,075) |
(1,054) |
(7)% |
(4,449) |
(4,455) |
0% |
| Bonus compensation related to management and advisory |
(1,023) |
(5,598) |
(3,093) |
202%
|
(4,054) |
(14,049) |
247%
|
| Total Fee Related Expenses |
(2,698) |
(7,970) |
(4,870) |
80%
|
(10,885) |
(22,010) |
102%
|
| FEE RELATED EARNINGS (FRE) |
1,487 |
9,373 |
4,926 |
231% |
9,009 |
20,897 |
132% |
| FRE Margin (%) |
35.5% |
54.0% |
50.3% |
|
45.3% |
48.7% |
|
| SEGMENT DISTRIBUTABLE EARNINGS |
1,487 |
9,373 |
4,926 |
231% |
9,009 |
20,897 |
132% |
| Segment DE Margin (%) |
35.5% |
54.0% |
50.3% |
|
45.3% |
48.7% |
|
Fee
related earnings (FRE) of R$4.9 million for the quarter ended March 28, 2024. FRE was R$21.0 million over the last twelve months
ended March 28, 2024, an increase of 132% when compared to the last twelve months ended March 31, 2023, due to a pickup in deal activity
over the last twelve months.
Segment
Distributable Earnings over the last twelve months ended March 28, 2024 were R$21.0 million, an increase of 132% year-over-year when
compared to the last twelve months ended March 31, 2023.
Deal
activity has been notably increasing since the latter part of 2023, propelled by the easing cycle for interest rates in Brazil. This
environment allows great opportunities in M&A, complemented by a broader sector diversification by our Corporate Advisory strategy
aimed for reducing risk exposure across various economic cycles and asset profiles.
IR.VINCIPARTNERS.COM SHAREHOLDERRELATIONS@VINCIPARTNERS.COM | |
Retirement
Services
| (R$ thousands,
unless mentioned)/ |
1Q'23 |
4Q'23 |
1Q'24 |
∆
YoY (%) |
1Q'23
LTM |
1Q'24
LTM |
∆
YoY (%) |
| Net revenue from management fees |
– |
119 |
158 |
N/A |
– |
324 |
N/A |
| Net revenue from advisory fees |
– |
– |
– |
N/A
|
– |
– |
N/A
|
| Total Fee Related Revenues |
– |
119
|
158
|
N/A
|
–
|
324
|
N/A
|
| Segment personnel expenses |
(422) |
(596) |
(561) |
33% |
(1,450) |
(2,168) |
50% |
| Other G&A expenses |
(374) |
(1,341) |
(1,618) |
333% |
(1,724) |
(4,589) |
166% |
| Corporate center expenses |
(115) |
(107) |
(105) |
(8)% |
(322) |
(446) |
38% |
| Bonus compensation related to management and advisory |
(598) |
(1,773) |
(721) |
21%
|
(2,622) |
(4,136) |
58%
|
| Total Fee Related Expenses |
(1,509) |
(3,818) |
(3,006) |
99%
|
(6,119) |
(11,338) |
85%
|
| FEE RELATED EARNINGS (FRE) |
(1,509) |
(3,699) |
(2,847) |
89% |
(6,119) |
(11,014) |
80% |
| FRE Margin (%) |
N/A |
N/A |
N/A |
|
N/A |
N/A |
|
| Net revenue from performance fees |
– |
– |
– |
N/A |
– |
– |
N/A |
| Realized performance fees |
– |
– |
– |
N/A |
– |
– |
N/A |
| Unrealized performance fees |
– |
– |
– |
N/A |
– |
– |
N/A |
| Performance based compensation |
– |
– |
– |
N/A
|
– |
– |
N/A
|
| PERFORMANCE RELATED EARNINGS (PRE) |
– |
– |
– |
N/A |
– |
– |
N/A |
| PRE Margin (%) |
N/A |
N/A |
N/A |
|
N/A |
N/A |
|
| (-) Unrealized performance fees |
– |
– |
– |
N/A |
– |
– |
N/A |
| (+) Unrealized performance compensation |
– |
– |
– |
N/A
|
– |
– |
N/A
|
| SEGMENT DISTRIBUTABLE EARNINGS |
(1,509) |
(3,699) |
(2,847) |
89% |
(6,119) |
(11,014) |
80% |
| Segment DE Margin (%) |
N/A |
N/A |
N/A |
|
N/A |
N/A |
|
| |
|
|
|
|
|
|
|
| ASSETS UNDER MANAGEMENT (AUM R$millions) |
– |
88 |
147 |
N/A |
– |
147 |
N/A |
| AVERAGE MANAGEMENT FEE RATE (%) |
– |
0.72% |
0.58% |
N/A |
– |
0.86% |
N/A |
Fee
Related Earnings (FRE) of negative R$2.8 million for the quarter ended March 28, 2024. FRE was negative R$11.0 million over the last
twelve months ended March 28, 2024.
VRS
started to contribute to AUM numbers and management fee revenues in 2023. In February 2024, VRS was officially presented to the general
public with an article in a major newspaper in Brazil. The product is now fully accessible to the public through dedicated apps and website
and prepared to accept allocations from all investors through our newly launched platform called Mio.
VRS
reached close to R$ 150 million in AUM by the end of the first quarter.
IR.VINCIPARTNERS.COM SHAREHOLDERRELATIONS@VINCIPARTNERS.COM | |
Income Statement
| (R$ thousands,
unless mentioned) |
1Q'23 |
4Q'23 |
1Q'24 |
∆
YoY (%) |
1Q'23
LTM |
1Q'24
LTM |
∆
LTM (%) |
| REVENUES |
|
|
|
|
|
|
|
| Net revenue from management fees |
95,877 |
99,976 |
96,455 |
1% |
380,149 |
393,945 |
4% |
| Net revenue from performance fees |
1,963 |
6,468 |
2,273 |
16% |
13,391 |
21,564 |
61% |
| Realized performance fees |
1,963 |
7,510 |
2,273 |
16% |
17,645 |
22,606 |
28% |
| Unrealized performance fees |
– |
(1,042) |
– |
N/A |
(4,254) |
(1,042) |
(76)% |
| Net revenue from advisory |
4,468
|
18,998
|
10,359
|
132%
|
22,788
|
45,690
|
101%
|
| Total net revenues from services rendered |
102,308
|
125,442
|
109,087
|
7%
|
416,328
|
461,199
|
11%
|
| EXPENSES |
|
|
|
|
|
|
|
| Bonus related to management and advisory |
(18,062) |
(26,143) |
(18,748) |
4% |
(74,108) |
(84,686) |
14% |
| Performance based compensation |
(733) |
(3,614) |
(1,009) |
38% |
(6,255) |
(10,916) |
75% |
| Realized |
(733) |
(3,983) |
(1,009) |
38% |
(7,759) |
(11,285) |
45% |
| Unrealized |
– |
369
|
– |
N/A
|
1,503
|
369
|
(75)% |
| Total compensation and benefits[xviii] |
(18,795) |
(29,757) |
(19,757) |
5% |
(80,363) |
(95,602) |
19% |
| Segment personnel expenses |
(7,164) |
(7,462) |
(7,337) |
2% |
(26,069) |
(29,859) |
15% |
| Other general and administrative expenses |
(3,458) |
(6,573) |
(5,996) |
73% |
(17,338) |
(22,961) |
32% |
| Corporate center expenses |
(22,606) |
(21,499) |
(21,087) |
(7)% |
(88,615) |
(89,106) |
1%
|
| Total expenses |
(52,023) |
(65,291) |
(54,177) |
4%
|
(212,385) |
(237,527) |
12%
|
| Operating profit |
50,285
|
60,151
|
54,910
|
9%
|
203,943
|
223,672
|
10%
|
| OTHER ITEMS |
|
|
|
|
|
|
|
| GP Investment income |
(20,200) |
14,914 |
13,509 |
N/A |
(9,727) |
59,727 |
N/A |
| Realized gain from GP investment
income |
5,881 |
4,451 |
4,406 |
(25)% |
24,007 |
17,735 |
(26)% |
| Unrealized gain from GP
investment income |
(26,081) |
10,463 |
9,103 |
N/A |
(33,734) |
41,992 |
N/A |
| Financial income |
20,089 |
22,046 |
12,362 |
(38)% |
83,251 |
76,618 |
(8)% |
| Realized gain from financial
income |
20,089 |
22,046 |
12,362 |
(38)% |
82,051 |
76,618 |
(7)% |
| Unrealized gain from financial
income |
– |
– |
– |
N/A |
1,200 |
(0) |
N/A |
| Leasing expenses |
(2,631) |
(2,267) |
(2,216) |
(16)% |
(9,518) |
(9,394) |
(1)% |
| Other items |
151 |
(10,461) |
(14,992) |
N/A |
9,540 |
(48,468) |
N/A |
| Share Based Plan |
(2,107) |
(4,249) |
(6,148) |
192% |
(15,647) |
(19,008) |
21% |
| Non-operational expenses |
– |
(1,924) |
(1,333) |
N/A
|
(1,485) |
(3,257) |
119%
|
| Total Other Items |
(4,698) |
18,059
|
1,182
|
N/A
|
56,414
|
56,218
|
(0)% |
| Profit before income taxes |
45,587 |
78,210 |
56,092 |
23% |
260,356 |
279,890 |
8% |
| (-) Income taxes |
(12,881) |
(14,826) |
(10,384) |
(19)% |
(53,555) |
(47,429) |
(11)% |
| NET INCOME |
32,706
|
63,384
|
45,708
|
40%
|
206,801
|
232,461
|
12%
|
| (+) Non-operational expenses including income tax related
to realized expense |
– |
1,631 |
1,308 |
N/A |
988 |
2,939 |
197% |
| (-)Earn-out Adjust |
(2,674) |
2,691 |
3,799 |
N/A |
(11,895) |
16,949 |
N/A |
| ADJUSTED NET INCOME |
30,032
|
67,706
|
50,815
|
69%
|
195,894
|
252,349
|
29%
|
Total
net revenues from services rendered of R$109.1 million for the quarter ended March 28, 2024, up 7% year-over-year. This growth was
driven by stronger advisory fees in the period. Net revenues for the last twelve months ended March 28, 2024, were R$461.2 million, representing
an 11% increase when compared to the last twelve months ended March 31, 2023, a result from higher advisory, management and performances
fees in the period.
| · | Management
fee revenues of R$96.5 million for the quarter ended March 28, 2024, flat year-over-year.
Although Private Markets revenues continue to grow and push FRE for the platform, IP&S
have suffered headwinds in the pension plans strategy propelled by tougher macro conditions.
Management fees of R$393.9 million over the last twelve months ended March 28, 2024, up 4%
when compared to the last twelve months ended March 31, 2023, due to a strong fundraising
across Private Markets products. |
IR.VINCIPARTNERS.COM SHAREHOLDERRELATIONS@VINCIPARTNERS.COM | |
| · | Performance
fee revenues of R$2.3 million for the quarter ended March 28, 2024, up 16% year-over-year.
Performance fee revenues of R$21.6 for the last twelve months ended March 28, 2024, an increase
of 61% when compared to the last twelve months ended March 31, 2023. |
| · | Advisory
fee revenues of R$10.4 million for the quarter ended March 28, 2024, compared to R$4.5 million
for the quarter ended March 31, 2023, an increase of 132% year-over-year. Advisory revenues
for the last twelve months ended March 28, 2024, were R$45.7 million, up 101% when compared
to the last twelve months ended March 31, 2023, due to a pickup in deal activity. |
Total
expenses for the quarter ended March 28, 2024, of R$54.2 million, compared to R$52.0 million for the quarter ended March 31, 2023,
an increase of 4% year-over-year. Total expenses for the last twelve months ended March 28, 2024, were R$237.5 million, up 12% when compared
to the last twelve months ended March 31, 2023. Disregarding bonus compensation, total operating expenses summed R$141.9 million, up
8% year-over-year, following our cost efficiency orientation to contain expenses growth.
| · | Bonus
related to management and advisory fees of R$18.7 million for the quarter ended March 28,
2024, compared to R$18.1 million for the quarter ended March 31, 2023, a 4% increase year-over-year.
Bonus related to management and advisory was R$84.7 million for the last twelve months ended
March 28, 2024, up 14% year-over-year, when compared to the last twelve months ended March
31, 2023. |
| · | Performance
based compensation of R$1.0 million for the quarter ended March 28, 2024, compared to R$0.7
million for the quarter ended March 31, 2023, an increase of 38% year-over-year. Performance
based compensation for the last twelve months ended March 28, 2024, was R$11.0 million, an
increase of 75% when compared to the last twelve months ended March 31, 2023. |
| · | Segment
personnel expenses[xix]
of R$7.3 million for the quarter ended March 28, 2024, compared to R$7.2 million for
the quarter ended March 31, 2023, an increase of 2% year-over-year. Segment personnel expenses
for the last twelve months ended March 28, 2024, was R$29.9 million, up 15% when compared
to the last twelve months ended March 31, 2023. |
| · | Corporate
center expenses[xx]
of R$21.1 million for the quarter ended March 28, 2024, compared to R$22.6 million
for the quarter ended March 31, 2023, a decrease of 7% year-over-year. Corporate center expenses
for the last twelve months ended March 28, 2024, were R$89.1 million, up 1% year-over-year,
when compared to the last twelve months ended March 31, 2023. |
| · | Other
general and administrative expenses[xxi]
of R$6.0 million for the quarter ended March 28, 2024, compared to R$3.5 million for
the quarter ended March 31, 2023, an increase of 73% year-over-year. Other G&A expenses
for the last twelve months ended March 28, 2024, were R$23.0 million, up 32% when compared
to the last twelve months ended March 31, 2023. |
Operating
Profit of R$54.9 million for the quarter ended March 28, 2024, compared to R$50.3 million for the quarter ended March 31, 2023, an
increase of 9% year-over-year. Operating profit for the last twelve months ended March 28, 2024, was R$223.7 million, up 10% when compared
to the last twelve months ended March 31, 2023.
IR.VINCIPARTNERS.COM SHAREHOLDERRELATIONS@VINCIPARTNERS.COM | |
GP
Investment income[xxii], a result of the
company’s GP investments in its proprietary private market funds, was R$13.5 million for the quarter ended March 28, 2024, compared
to negative R$20.2 million for the quarter ended March 31, 2023, following the appreciation of our proprietary position in private markets
funds, a result of mark-to-market appreciation of REITs and annual mark-up of closed-end funds. GP Investment income for the last twelve
months ended March 28, 2024, was R$59.7 million compared to negative R$9.7 million for the last twelve months ended March 31, 2023.
Financial
Income[xxiii] of R$22.0 million for the
quarter ended March 28, 2024, compared to R$20.1 million for the quarter ended March 31, 2023. Financial income for the last twelve months
ended March 28, 2024, was R$76.6 million, down 8% when compared to the last twelve months ended March 31, 2023.
Leasing
Expenses[xxiv] of R$2.2 million for the
quarter ended March 28, 2024, compared to R$2.6 million for the quarter ended March 31, 2023, down 16% year-over-year.
Other
Items of negative R$15.0 million for the quarter ended March 28, 2024. Other items comprise the income/(loss) generated by contingent
consideration adjustment and financial income/(expenses) related to SPS acquisition and Ares investment and other financial expenses.
Share
Based Plan expenses[xxv] of R$6.1 million
for the quarter ended March 28, 2024. Over the last twelve months ended March 28, 2024, share based plan expenses accounted for R$19.0
million.
Profit
before income taxes of R$56.1 million for the quarter ended March 28, 2024, compared to R$45.6 million for the quarter ended March
31, 2023, an increase of 23% year-over-year. Profit before income taxes for the last twelve months ended March 28, 2024, was R$279.9
million, an increase of 8% when compared to the last twelve months ended March 31, 2023.
Income
Taxes[xxvi] of R$10.4 million for the
quarter ended March 28, 2024, which represented an effective tax rate for the quarter of 19%, compared to R$12.9 million for the quarter
ended March 31, 2023, which represented an effective tax rate of 28%, representing a decrease of 9.7 percentage points year-over-year.
Non-operational
expenses of R$1.3 million for the quarter ended March 28, 2024. Non-operational expenses are comprised of expenses related to professional
services rendered in connection with acquisitions.
Contingent
consideration adjustment related to acquisitions, after tax, of R$3.8 million for the quarter ended March 28, 2024. Contingent consideration
adjustment related to Vinci SPS’ acquisition reflects the change in earn out’s fair value to be paid in 2027.
Adjusted
Net Income of R$50.8 million for the quarter ended March 28, 2024, compared to R$30.0 million for the quarter ended March 31, 2023,
an increase of 69% year-over-year. Adjusted Net Income was R$252.3 million for the last twelve months ended March 28, 2024, up 29% when
compared to the last twelve months ended March 31, 2023.
IR.VINCIPARTNERS.COM SHAREHOLDERRELATIONS@VINCIPARTNERS.COM | |
Supplement
Details
Assets Under
Management (AUM) Rollforward – R$ millions
For
the Three Months Ended March 28, 2024
| |
Private |
Public |
IP&S |
Infrastructure |
Real
Estate |
Credit |
Hedge |
Retirement
Services |
Vinci
SPS |
Total |
| Equity |
Equities |
Funds |
| Beginning
balance |
14,593 |
9,537 |
23,149 |
3,943 |
7,049 |
5,406 |
2,795 |
88 |
1,964 |
68,525 |
| Managerial
Adjustment |
– |
518 |
2,277 |
– |
– |
– |
(2,795) |
– |
– |
– |
| Beginning
balance |
14,593 |
10,055 |
25,426 |
3,943 |
7,049 |
5,406 |
– |
88 |
1,964 |
68,525 |
| (+/-) Capital Subscription
/ (capital return) |
– |
– |
544 |
(20) |
(70) |
(5) |
– |
– |
(86) |
363 |
| (+)
Capital Subscription |
– |
– |
548 |
– |
71 |
66 |
– |
– |
2 |
687 |
| (-)
Capital Return |
– |
– |
(4) |
(20) |
(141) |
(71) |
– |
– |
(88) |
(324) |
| (+/-) Net Inflow / (outflow) |
– |
(26) |
(985) |
– |
49 |
49 |
– |
58 |
– |
(855) |
| (+/-) Appreciation / (depreciation) |
(176) |
(120) |
772 |
24 |
33 |
8 |
– |
1 |
255 |
797 |
| Ending
Balance |
14,417 |
9,910 |
25,756 |
3,947 |
7,061 |
5,459 |
– |
147 |
2,133 |
68,831 |
For
the Twelve months Ended March 28, 2024
| |
Private |
Public |
IP&S |
Infrastructure |
Real
Estate |
Credit |
Hedge |
Retirement
Services |
Vinci
SPS |
Total |
| Equity |
Equities |
Funds |
| Beginning
balance |
13,587 |
7,095 |
24,216 |
2,361 |
5,137 |
4,964 |
2,723 |
– |
2,149 |
62,232 |
| Managerial Adjustment |
– |
339 |
2,384 |
– |
– |
– |
(2,723) |
– |
– |
– |
| Beginning
balance |
13,587 |
7,434 |
26,599 |
2,361 |
5,137 |
4,964 |
– |
– |
2,149 |
62,232 |
| (+/-) Capital Subscription / (capital return) |
600 |
– |
571 |
1,377 |
760 |
(135) |
– |
– |
(376) |
2,798 |
| (+) Capital Subscription |
937 |
– |
576 |
1,497 |
1,251 |
66 |
– |
– |
5 |
4,332 |
| (-) Capital Return |
(337) |
– |
(4) |
(119) |
(491) |
(201) |
– |
– |
(381) |
(1,534) |
| (+/-) Net Inflow / (outflow) |
– |
101 |
(3,896) |
– |
58 |
195 |
– |
143 |
– |
(3,399) |
| (+/-) Appreciation / (depreciation) |
229 |
2,375 |
2,481 |
209 |
1,106 |
435 |
– |
4 |
360 |
7,200 |
| Ending
Balance |
14,417 |
9,910 |
25,756 |
3,947 |
7,061 |
5,459 |
– |
147 |
2,133 |
68,831 |
IR.VINCIPARTNERS.COM SHAREHOLDERRELATIONS@VINCIPARTNERS.COM | |
Fee Earning
Assets Under Management (FEAUM) Rollforward – R$ millions
For
the Three Months Ended March 28, 2024
| |
Private |
Public |
IP&S |
Infrastructure |
Real
Estate |
Credit |
Hedge |
Retirement
Services |
Vinci
SPS |
Total |
| Equity |
Equities |
Funds |
| Beginning
balance |
11,392 |
9,487 |
23,055 |
3,894 |
7,049 |
5,406 |
2,642 |
88 |
1,964 |
64,977 |
| Managerial Adjustment |
– |
518 |
2,123 |
– |
– |
– |
(2,642) |
– |
– |
– |
| Beginning
balance |
11,392 |
10,005 |
25,179 |
3,894 |
7,049 |
5,406 |
– |
88 |
1,964 |
64,977 |
| (+/-) Capital Subscription / (capital return) |
– |
– |
544 |
(20) |
(70) |
(5) |
– |
– |
(86) |
363 |
| (+) Capital Subscription |
– |
– |
548 |
– |
71 |
66 |
– |
– |
2 |
687 |
| (-) Capital Return |
– |
– |
(4) |
(20) |
(141) |
(71) |
– |
– |
(88) |
(324) |
| (+/-) Net Inflow / (outflow) |
– |
(26) |
(985) |
– |
49 |
49 |
– |
58 |
– |
(855) |
| (+/-) Appreciation / (depreciation) |
(152) |
(121) |
770 |
(4) |
33 |
8 |
– |
1 |
255 |
791 |
| Ending
Balance |
11,240 |
9,859 |
25,507 |
3,870 |
7,061 |
5,459 |
– |
147 |
2,133 |
65,277 |
For
the Twelve months Ended March 28, 2024
| |
Private |
Public |
IP&S |
Infrastructure |
Real
Estate |
Credit |
Hedge |
Retirement
Services |
Vinci
SPS |
Total |
| Equity |
Equities |
Funds |
| Beginning
balance |
10,262 |
7,040 |
24,048 |
2,313 |
5,137 |
4,964 |
2,574 |
– |
2,149 |
58,487 |
| Managerial Adjustment |
– |
339
|
2,235
|
– |
– |
– |
(2,574) |
– |
– |
– |
| Beginning
balance |
10,262 |
7,379
|
26,283
|
2,313 |
5,137 |
4,964 |
– |
– |
2,149 |
58,487 |
| (+/-) Capital Subscription / (capital return) |
595 |
– |
571 |
1,377 |
760 |
(135) |
– |
– |
(376) |
2,793 |
| (+) Capital Subscription |
887 |
– |
576 |
1,497 |
1,251 |
66 |
– |
– |
5 |
4,282 |
| (-) Capital Return |
(292) |
– |
(4) |
(119) |
(491) |
(201) |
– |
– |
(381) |
(1,489) |
| (+/-) Net Inflow / (outflow) |
– |
101 |
(3,822) |
– |
58 |
195 |
– |
143 |
– |
(3,325) |
| (+/-) Appreciation / (depreciation) |
382 |
2,380 |
2,474 |
180 |
1,106 |
435 |
– |
4 |
360 |
7,322 |
| Ending
Balance |
11,240 |
9,859 |
25,507 |
3,870 |
7,061 |
5,459 |
– |
147 |
2,133 |
65,277 |
IR.VINCIPARTNERS.COM SHAREHOLDERRELATIONS@VINCIPARTNERS.COM | |
Accrued Performance
Fees – Private Market Funds
| (R$ mm) |
4Q'23 |
Unrealized
Performance Fees |
Realized
Distributions |
1Q'24 |
| Private Equity |
255.8 |
(10.1) |
- |
245.7 |
| Infrastructure |
22.5 |
(1.5) |
- |
21.0 |
| Credit |
0.2 |
(0.0) |
- |
0.2 |
| Vinci SPS |
- |
27.5 |
- |
27.5 |
| Total |
278.6 |
(11.6) |
- |
266.9 |
Vinci
Partners recognizes the performance revenue according to IFRS 15. Unrealized performance fees are recognized only when is highly probable
that the revenue will not be reversed in the Income Statement.
The
fund FIP Infra Transmissão in Infrastructure had R$14.4 million as of the end of the first quarter of 2024 booked as unrealized
performance fees in the company´s balance sheet.
Accrued
performance fees shown for Private Equity funds of R$245.7 million, for the Credit fund VCM of R$ 0.2 million, for the Vinci SPS fund
SPS III of R$ 27.4 million and for the Infrastructure fund VIAS of R$6.6 million as of the end of the first quarter of 2024 have not
been booked as unrealized performance fees in the company´s balance sheet.
IR.VINCIPARTNERS.COM SHAREHOLDERRELATIONS@VINCIPARTNERS.COM | |
Investment
Records – IP&S, Public Equities, Private Credit and Listed REIT
| Fund |
Segment |
NAV[xxvii]
(R$
millions) |
1Q’24 |
YTD |
12
M |
24
M |
Market
Comparison |
Index
Rate |
| Vinci Multiestratégia FIM |
IP&S |
257.1 |
2.0% |
2.0% |
11.2% |
24.6% |
CDI4 |
CDI4 |
| Atlas Strategy[xxviii] |
IP&S |
359.7 |
1.0% |
1.0% |
9.1% |
14.7% |
CDI4 |
CDI4 |
| Total Return Strategy[xxix] |
Public Equities |
372.7 |
(3.2)% |
(3.2)% |
26.0% |
16.0% |
IPCA5 + Yield
IMA-B7 |
IPCA5 + Yield
IMA-B7 |
| Mosaico Strategy[xxx] |
Public Equities |
887.0 |
(1.7)% |
(1.7)% |
30.7% |
4.9% |
IBOV5 |
IBOV5 |
| Vinci Gas Dividendos FIA |
Public Equities |
551.5 |
(3.7)% |
(3.7)% |
24.8% |
8.8% |
IBOV5 |
IBOV5 |
| Valorem Strategy[xxxi] |
IP&S |
1,483.8 |
1.5% |
1.5% |
9.0% |
19.6% |
IMA-B 57 |
IMA-B 57 |
| Equilibrio Strategy[xxxii] |
IP&S |
2,052.2 |
1.6% |
1.6% |
9.3% |
19.1% |
IPCA6 |
- |
| Vinci Retorno Real FIM |
IP&S |
184.6 |
0.5% |
0.5% |
7.1% |
20.8% |
IMA-B7 |
IMA-B7 |
| Vinci Crédito Imobiliário
II |
Private Credit |
814.0 |
1.1% |
1.1% |
12.7% |
23.8% |
IPCA6 |
IPCA6+ 6% |
| Vinci Crédito Estruturado Multiestrategia
Plus FIC FIM |
Private Credit |
100.1 |
3.2% |
3.2% |
14.6% |
29.2% |
CDI4 |
CDI4 |
| Vinci Energia Sustentável |
Private Credit |
593.4 |
2.5% |
2.5% |
14.6% |
20.4% |
IPCA6 |
IPCA6
+ 6% |
| Vinci Crédito Multiestratégia |
Private Credit |
373.5 |
2.2% |
2.2% |
14.7% |
21.2% |
CDI4 |
IPCA6
+ 5% |
| VISC11 |
Real Estate
(listed REIT) |
3,534.7 |
0.6% |
0.6% |
33.4% |
48.2% |
IFIX8 |
IPCA6 + 6% |
| VILG11 |
Real Estate
(listed REIT) |
1,396.3 |
(5.0)% |
(5.0)% |
13.8% |
10.1% |
IFIX8 |
IPCA6
+ 6% |
| VINO11 |
Real Estate
(listed REIT) |
643.6 |
3.0% |
3.0% |
7.5% |
(7.8)% |
IFIX8 |
IPCA6 + 6% |
| VIFI11 |
Real Estate
/ Private Credit (listed REIT) |
67.5 |
4.1% |
4.1% |
24.1% |
15.0% |
IFIX8 |
IFIX8 |
| VIUR11 |
Real Estate
(listed REIT) |
205.9 |
(1.0)% |
(1.0)% |
25.7% |
3.9% |
IFIX8 |
IPCA6 + 6% |
| VCRI11 |
Real Estate
/ Private Credit (listed REIT) |
153.2 |
4.5% |
4.5% |
18.7% |
- |
IFIX8 |
IPCA6
+ X9% |
| VICA11 |
Real Estate / Private
Credit (REIT) |
375.7 |
0.3% |
0.3% |
0.4% |
- |
IFIX8 |
CDI4 + 1% |
| VINCI FOF IMOBILIARIO FIM CP |
Real Estate
(REIT) |
66.0 |
2.3% |
2.3% |
22.3% |
27.1% |
IFIX8 |
IFIX8 |
| VIGT11 |
Infrastructure
(listed) |
612.4 |
(5.6)% |
(5.6)% |
19.4% |
22.4% |
- |
- |
| Benchmark |
1Q’24 |
YTD |
12
M |
24
M |
| IBOV |
(4.5)% |
(4.5)% |
25.7% |
6.8% |
| CDI |
2.6% |
2.6% |
12.4% |
27.3% |
| IMA-B 5 |
2.1% |
2.1% |
9.6% |
21.0% |
| IPCA + Yield IMA-B |
3.0% |
3.0% |
10.1% |
23.0% |
| IPCA |
1.4% |
1.4% |
3.9% |
8.8% |
| IFIX |
2.9% |
2.9% |
23.4% |
22.6% |
IR.VINCIPARTNERS.COM SHAREHOLDERRELATIONS@VINCIPARTNERS.COM | |
Investment
Records – Closed End Private Markets funds[xxxiii]
| Fund |
Segment
|
Vintage
year |
Committed
Capital
(R$mm)
|
Invested
Capital
(R$mm)
|
Realized
or Partially
Realized
(R$mm) |
Unrealized
(R$mm)
|
Total
Value
(R$mm)
|
Gross
MOIC[xxxiv]
(BRL)
|
Gross
MOIC
(USD)
|
Gross
IRR[xxxv]
(BRL)
|
Gross
IRR
(USD)
|
| Fund 1 |
Private Equity |
2004 |
1,415 |
1,206 |
5,065 |
137 |
5,202 |
4.3x |
4.0x |
71.5% |
77.2% |
| VCP II |
Private Equity |
2011 |
2,200 |
2,063 |
1,909 |
2,250 |
4,159 |
2.0x |
1.1x |
10.1% |
1.5% |
| VCP III |
Private Equity |
2018 |
4,000 |
2,330 |
53 |
4,449 |
4,502 |
1.9x |
1.9x |
30.9% |
28.6% |
| VCP IV |
Private Equity |
2022 |
2,205 |
325 |
– |
455 |
455 |
1.4x |
1.4x |
– |
– |
| VCP Strategy[xxxvi] |
Private
Equity |
|
9,820 |
5,924 |
7,027 |
7,291 |
14,318 |
2.4x |
2.2x |
64.6% |
70.2% |
| NE Empreendedor[xxxvii] |
Private Equity |
2003 |
36 |
13 |
26 |
– |
26 |
2.1x |
2.6x |
22.0% |
30.5% |
| Nordeste III |
Private Equity |
2017 |
240 |
135 |
95 |
163 |
257 |
1.9x |
1.6x |
20.2% |
14.2% |
| VIR IV |
Private Equity |
2020 |
1,000 |
424 |
154 |
422 |
576 |
1.3x |
1.4x |
25.4% |
31.5% |
| VIR Strategy[xxxviii] |
Private
Equity |
|
1,276 |
571 |
275 |
585 |
859 |
1.5x |
1.5x |
22.2% |
28.2% |
| SPS I |
Vinci SPS |
2018 |
128 |
191 |
250 |
90 |
340 |
1.8x |
1.6x |
26.0% |
19.9% |
| SPS II |
Vinci SPS |
2020 |
671 |
1,005 |
789 |
723 |
1,512 |
1.5x |
1.6x |
24.9% |
27.3% |
| SPS III |
Vinci SPS |
2021 |
1,070 |
787 |
131 |
949 |
1,080 |
1.4x |
1.6x |
37.7% |
41.5% |
| SPS Strategy[xxxix] |
Vinci SPS |
|
1,869 |
1,983 |
1,170 |
1,762 |
2,932 |
1.5x |
1.6x |
27.5% |
28.1% |
| FIP Transmissão[xl] |
Infrastructure |
2017 |
211 |
104 |
261 |
116 |
377 |
3.6x |
2.8x |
58.2% |
43.5% |
| VIAS[xli] |
Infrastructure |
2021 |
386 |
350 |
– |
409 |
409 |
1.3x |
1.4x |
28.5% |
32.9% |
| VICC[xlii] |
Infrastructure |
2023 |
1,566 |
– |
– |
– |
– |
– |
– |
0.0% |
0.0% |
| VFDL[xliii] |
Real Estate |
2021 |
422 |
238 |
10 |
271 |
281 |
1.2x |
1.2x |
14.8% |
16.4% |
| Vinci
Credit Infra[xliv] |
Private
Credit |
2022 |
1,460 |
538 |
– |
587 |
587 |
1.2x |
1.2x |
NM |
NM |
Shareholder
Dividends
| ($ in thousands) |
1Q’22 |
2Q’22 |
3Q'22 |
4Q’22 |
1Q’23 |
2Q'23 |
| Distributable Earnings (R$) |
53,255 |
60,435 |
72,842 |
55,792 |
60,006 |
70,369 |
| Distributable Earnings (US$)[xlv] |
10,615 |
11,795 |
14,281 |
10,618 |
11,994 |
14,290 |
| DE per Common Share (US$)[xlvi] |
0.19 |
0.21 |
0.26 |
0.19 |
0.22 |
0.26 |
| Actual Dividend per Common Share[xlvii] |
0.17 |
0.17 |
0.20 |
0.17 |
0.16 |
0.20 |
| Record Date |
May
24, 2022 |
Aug 25, 2022 |
Nov 23, 2022 |
Mar 01, 2023 |
May 25, 2023 |
Aug 24, 2023 |
| Payable Date |
Jun 08, 2022 |
Sep 09,2022 |
Dec 08, 2022 |
Mar 15, 2023 |
Jun 09, 2023 |
Sep 08, 2023 |
| |
|
|
|
|
|
|
| ($
in thousands) |
3Q’23 |
4Q’23 |
1Q’24 |
|
| Distributable Earnings (R$) |
51,820 |
62,010 |
48,297 |
|
| Distributable Earnings
(US$) |
10,647 |
12,500 |
9,543 |
|
| DE per Common Share (US$) |
0.20 |
0.23 |
0.18 |
|
| Actual
Dividend per Common Share |
0.17 |
0.20 |
0.17 |
|
| Record Date |
Nov 22, 2023 |
Feb 22, 2024 |
May 23, 2024 |
|
| Payable Date |
Dec
07, 2023 |
Mar
07, 2024 |
Jun
07, 2024 |
|
| |
|
|
|
|
|
|
Vinci
Partners generated R$0.91 or US$0.18 of Distributable Earnings per common share for the first quarter of 2024. The company declared a
quarterly dividend of US$0.17 per common share to record holders as of May 23, 2024; payable on June 07, 2024.
IR.VINCIPARTNERS.COM SHAREHOLDERRELATIONS@VINCIPARTNERS.COM | |
Share Summary
| VINP Shares |
1Q'22 |
2Q'22 |
3Q'22 |
4Q'22 |
1Q23 |
2Q’23 |
3Q'23 |
4Q’23 |
1Q'24 |
| Class B |
14,466,239 |
14,466,239 |
14,466,239 |
14,466,239 |
14,466,239 |
14,466,239 |
14,466,239 |
14,466,239 |
14,466,239 |
| Class A[xlviii] |
41,363,077 |
41,112,717 |
40,892,619 |
40,614,497 |
40,247,461 |
39,730,720 |
39,405,827 |
39,312,578 |
38,778,597 |
| Common Shares Outstanding |
55,829,316 |
55,578,956 |
55,358,858 |
55,080,736 |
54,713,700 |
54,196,959 |
53,872,066 |
53,778,817 |
53,244,836 |
Common
Shares Outstanding as of quarter end of 53,244,836 shares.
| · | Repurchased
533,981 common shares in the quarter, with an average share price of US$10.6. |
| · | Repurchased
4,090,985 common shares since the announcement of the first share repurchase plan, with an
average share price of US$10.7. |
| · | A
new share repurchase plan was approved on February 07, 2024, to buy back up to R$60.0 million
of the company’s outstanding shares. |
IR.VINCIPARTNERS.COM SHAREHOLDERRELATIONS@VINCIPARTNERS.COM | |
GP Commitment
in Vinci Partners funds
(R$
millions,
unless
mentioned)
Fund
|
Segment
|
1Q’24
Commitments
|
Total
Capital Committed
|
1Q’24
Capital Called
|
Total
Capital
Called
|
Capital
Returned/ Dividends Paid (1Q’24)
|
Accumulated
Capital Returned/
Dividends
Paid |
Fair
value
of
investments |
| Nordeste
III |
Private
Equity |
– |
5.0
|
– |
3.2
|
– |
1.6
|
3.4
|
| VCP
III |
Private
Equity |
– |
3.1
|
– |
2.8
|
– |
– |
4.3
|
| VIR IV |
Private Equity |
– |
11.1 |
0.2
|
5.6 |
– |
1.7 |
4.9
|
| VCP
IV |
Private
Equity |
– |
350.0
|
– |
– |
– |
– |
– |
| FIP Infra Transmissão
(co- investment)[i] |
Infrastructure |
– |
29.5 |
– |
8.9 |
– |
20.9 |
10.3
|
| FIP
Infra Transmissão[ii] |
Infrastructure |
– |
10.5
|
– |
3.4
|
– |
6.6
|
2.9
|
| VIAS |
Infrastructure |
– |
50.0 |
– |
37.5 |
– |
– |
50.7
|
| Vinci
Transporte e Logística II |
Infrastructure |
– |
15.0
|
– |
– |
– |
– |
– |
| Vinci Transporte
e Logística I |
Infrastructure |
– |
11.4 |
– |
11.3 |
– |
– |
19.1
|
| VICC |
Infrastructure |
– |
100.0
|
1.6
|
1.6
|
– |
– |
0.2
|
| VFDL |
Real Estate |
– |
70.0 |
6.0
|
52.0 |
– |
– |
59.2
|
| VIUR |
Real
Estate |
– |
67.3
|
– |
67.3
|
1.4
|
16.2
|
51.5
|
| VINO |
Real Estate |
– |
50.0 |
– |
50.0 |
0.8
|
7.5 |
35.2
|
| Vinci
FOF Imobiliário |
Real
Estate |
– |
16.9
|
– |
16.9
|
– |
0.5
|
22.5
|
| VCRI |
Real Estate /
Private Credit |
– |
80.0 |
– |
80.0 |
2.1
|
20.6 |
71.9
|
| Vinci
Crédito Agro Fiagro-Imobiliário |
Real
Estate / Private Credit |
– |
23.0
|
– |
23.0
|
0.8
|
4.7
|
22.9
|
| Vinci Crédito
Infra Institucional |
Private Credit |
– |
100.0 |
– |
44.2 |
– |
– |
47.4
|
| VSP
FIM |
IP&S |
– |
50.0
|
0.2
|
12.5
|
0.1
|
0.9
|
14.65
|
| Vinci PIPE FIA |
Public Equities |
– |
25.0 |
– |
25.0 |
– |
0.0 |
23.8
|
| Vinci
US Real Estate |
Real
Estate |
34.8
|
34.8
|
34.8
|
34.8
|
– |
– |
35.0
|
| FDIRS |
Infrastructure |
15.0 |
15.0 |
15.0
|
15.0 |
– |
– |
15.3
|
| Total |
|
49.8
|
1,117.6
|
57.8
|
495.0
|
5.1
|
81.2
|
495.0
|
IR.VINCIPARTNERS.COM SHAREHOLDERRELATIONS@VINCIPARTNERS.COM | |
Reconciliation
and Disclosures
Non-GAAP Reconciliation
| (R$ thousands,
unless mentioned) |
1Q'23 |
4Q'23 |
1Q'24 |
1Q'23
LTM |
1Q'24
LTM |
| |
|
|
|
|
|
| OPERATING
PROFIT |
50,285 |
60,151 |
54,910 |
203,943
|
223,672
|
| (-) Net revenue from
realized performance fees |
(1,963) |
(7,510) |
(2,273) |
(17,645) |
(22,606) |
| (-) Net revenue from
unrealized performance fees |
– |
1,042 |
– |
4,254 |
1,042 |
| (+) Compensation allocated
in relation to performance fees |
733 |
3,614 |
1,009 |
6,255 |
10,916 |
| FEE
RELATED EARNINGS (FRE) |
49,055 |
57,297 |
53,646 |
196,807
|
213,024
|
| |
|
|
|
|
|
| OPERATING
PROFIT |
50,285 |
60,151 |
54,910 |
203,943
|
223,672
|
| (-) Net revenue from
management fees |
(95,877) |
(99,976) |
(96,455) |
(380,149) |
(393,945) |
| (-) Net revenue from
advisory |
(4,468) |
(18,998) |
(10,359) |
(22,788) |
(45,690) |
| (+) Bonus related to
management and advisory |
18,062 |
26,143 |
18,748 |
74,108 |
84,686 |
| (+) Personnel expenses |
7,164 |
7,462 |
7,337 |
26,069 |
29,859 |
| (+) Other general and
administrative expenses |
3,458 |
6,573 |
5,996 |
17,338 |
22,961 |
| (+) Corporate center
expenses |
22,606 |
21,499 |
21,087 |
88,615 |
89,106 |
| PERFORMANCE
RELATED EARNINGS (PRE) |
1,230 |
2,854 |
1,264 |
7,136 |
10,648 |
| |
|
|
|
|
|
| OPERATING
PROFIT |
50,285 |
60,151 |
54,910 |
203,943
|
223,672
|
| (-) Net revenue from
unrealized performance fees |
– |
1,042 |
– |
4,254 |
1,042 |
| (+) Compensation allocated
in relation to unrealized performance fees |
– |
(369) |
– |
(1,503) |
(369) |
| (+) Realized gain from
GP investment income |
5,881 |
4,451 |
4,406 |
24,007 |
17,735 |
| SEGMENT
DISTRIBUTABLE EARNINGS |
56,166 |
65,275 |
59,316 |
230,701
|
242,080
|
| |
|
|
|
|
|
| NET
INCOME |
32,706 |
63,384 |
45,708 |
206,801
|
232,461
|
| (-) Net revenue from
unrealized performance fees |
– |
1,042 |
– |
4,254 |
1,042 |
| (+) Income tax from
unrealized performance fees |
– |
(120) |
– |
(490) |
(120) |
| (+) Compensation allocated
in relation to unrealized performance fees |
– |
(369) |
– |
(1,503) |
(369) |
| (-) Unrealized gain
from GP investment income |
26,081 |
(10,463) |
(9,103) |
33,734 |
(41,992) |
| (+) Income tax on unrealized
gain from GP investment income |
– |
119 |
283 |
(369) |
458 |
| (-) Unrealized gain
from financial income |
– |
(0) |
– |
(1,200) |
– |
| (+) Income tax on unrealized
gain from financial income |
– |
– |
– |
(65) |
– |
| (-) Contingent consideration
(earn-out) gain (loss), after-tax |
(2,674) |
2,691 |
3,799 |
(11,895) |
16,949 |
| (+) Depreciation and
amortization³ |
1,778 |
1,858 |
1,891 |
5,780 |
7,423 |
| (+) Share Based Plan |
2,107 |
4,188 |
6,148 |
15,647 |
17,642 |
| (-) Income Taxes on
Share Based Plan |
8 |
(320) |
(429) |
(1,620) |
(998) |
| (+) Non-operational
expenses including income tax related to realized expense |
– |
1,631 |
1,308 |
988 |
2,939 |
| ADJUSTED
DISTRIBUTABLE EARNINGS |
60,006 |
63,641 |
49,605 |
250,063
|
235,435
|
| |
|
|
|
|
|
| TOTAL
NET REVENUE FROM SERVICES RENDERED |
102,308
|
125,442
|
109,087
|
416,328
|
461,199
|
| (-) Net revenue from
realized performance fees |
(1,963) |
(7,510) |
(2,273) |
(17,645) |
(22,606) |
| (-) Net revenue from
unrealized performance fees |
– |
1,042 |
– |
4,254 |
1,042 |
| NET
REVENUE FROM MANAGEMENT FEES AND ADVISORY |
100,345
|
118,974
|
106,814
|
402,937
|
439,635 |
IR.VINCIPARTNERS.COM SHAREHOLDERRELATIONS@VINCIPARTNERS.COM | |
Effective Tax
Rate Reconciliation
| (R$ thousands,
unless mentioned) |
1Q'23 |
1Q'24 |
1Q'23
LTM |
1Q'24
LTM |
|
| Profit (loss) before income taxes |
45,587 |
56,092 |
260,356 |
279,890 |
|
| Combined statutory
income taxes rate - % |
34% |
34% |
34% |
34% |
|
| Income tax benefit (Expense) at statutory rates |
(15,500) |
(19,071) |
(88,522) |
(95,162) |
|
| Reconciliation adjustments: |
|
|
|
|
|
| Expenses not deductible |
(62) |
(99) |
(258) |
(917) |
|
| Tax benefits |
35 |
37 |
282 |
192 |
|
| Share based payments |
(29) |
(338) |
(240) |
(825) |
|
| Tax loss |
- |
(918) |
- |
(2,973) |
|
| Effect of presumed profit of subsidiaries[li]and
offshore subsidiaries |
2,662 |
9,981 |
35,168 |
52,152 |
|
| Other additions (exclusions), net |
13 |
24 |
15 |
104 |
|
| Income taxes expenses |
(12,881) |
(10,384) |
(53,555) |
(47,429) |
|
| Current |
(12,517) |
(12,871) |
(52,990) |
(58,920) |
|
| Deferred |
(364) |
2,487
|
(565) |
11,491
|
|
| Effective tax rate |
28% |
19% |
21% |
17% |
|
IR.VINCIPARTNERS.COM SHAREHOLDERRELATIONS@VINCIPARTNERS.COM | |
Balance Sheet
Results
| Assets |
12/29/2023 |
3/28/2024 |
| Current assets |
|
|
| Cash and cash equivalents |
660,305 |
531,988 |
| Cash and bank deposits |
15,896 |
45,738 |
| Financial instruments at fair
value through profit or loss |
173,300 |
85,649 |
| Financial instruments at amortized
cost |
471,109
|
400,601 |
| Financial instruments at fair value through profit
or loss |
1,168,355 |
1,221,642 |
| Accounts receivable |
101,523 |
89,701 |
| Sub-leases receivable |
4,071 |
3,601 |
| Taxes recoverable |
2,219 |
1,630 |
| Other assets |
19,109 |
25,169 |
| Total current assets |
1,955,582 |
1,873,731 |
| |
|
|
| Non-current assets |
|
|
| Financial instruments at fair value through profit
or loss |
7,146 |
57,965 |
| Accounts receivable |
16,638 |
16,412 |
| Sub-leases receivable |
1,467 |
1,079 |
| Taxes recoverable |
325 |
1,139 |
| Deferred taxes |
13,487 |
16,395 |
| Other assets |
19,427 |
19,556 |
| |
58,490 |
112,546 |
| |
|
|
| Property and equipment |
12,591 |
11,924 |
| Right of use - Leases |
58,308 |
55,917 |
| Intangible assets |
214,748 |
215,527 |
| Total non-current assets |
344,137 |
395,914 |
| |
|
|
| Total Assets |
2,299,719 |
2,269,645 |
IR.VINCIPARTNERS.COM SHAREHOLDERRELATIONS@VINCIPARTNERS.COM | |
| Liabilities and
equity |
12/29/2023 |
3/28/2024 |
| Current liabilities |
|
|
| Trade payables |
1,869 |
348 |
| Deferred Revenue |
– |
10,419 |
| Leases |
24,381 |
25,104 |
| Accounts payable |
6,020 |
6,052 |
| Labor and social security obligations |
101,506 |
27,325 |
| Loans and obligations |
76,722 |
78,138 |
| Taxes and contributions payable |
24,853 |
18,618
|
| Total current liabilities |
235,351
|
166,004
|
| |
|
|
| Non-current liabilities |
|
|
| Leases |
48,431 |
43,188 |
| Labor and social security obligations |
5,357 |
6,784 |
| Loans and Obligations |
540,369 |
554,452 |
| Deferred taxes |
3,883 |
4,303 |
| Retirement plans liabilities |
85,554 |
144,782
|
| |
683,594
|
753,509
|
| |
|
|
| Total liabilities |
918,945
|
919,513
|
| |
|
|
| Equity |
|
|
| Share capital |
15 |
15 |
| Additional paid-in capital |
1,408,438 |
1,408,438 |
| Treasury shares |
(172,863) |
(201,165) |
| Retained Earnings |
111,444 |
104,244 |
| Other reserves |
31,876
|
37,185
|
| |
1,378,910
|
1,348,717
|
| |
|
|
| Non-controlling interests in the equity of subsidiaries
|
1,864 |
1,415 |
| |
|
|
| Total equity |
1,380,774
|
1,350,132
|
| |
|
|
| Total liabilities and equity |
2,299,719
|
2,269,645
|
IR.VINCIPARTNERS.COM SHAREHOLDERRELATIONS@VINCIPARTNERS.COM | |
Forward-Looking
Statements
This
earnings release contains forward-looking statements that can be identified by the use of words such as “anticipate,” “believe,”
“could,” “expect,” “should,” “plan,” “intend,” “estimate” and
“potential,” among others. By their nature, forward-looking statements are necessarily subject to a high degree of uncertainty
and involve known and unknown risks, uncertainties, assumptions and other factors because they relate to events and depend on circumstances
that will occur in the future whether or not outside of our control. Such factors may cause actual results, performance or developments
to differ materially from those expressed or implied by such forward-looking statements and there can be no assurance that such forward-looking
statements will prove to be correct. The forward-looking statements included herein speak only as at the date of this press release and
we do not undertake any obligation to update these forward-looking statements. Past performance does not guarantee or predict future
performance. Moreover, neither we nor our affiliates, officers, employees and agents undertake any obligation to review, update or confirm
expectations or estimates or to release any revisions to any forward-looking statements to reflect events that occur or circumstances
that arise in relation to the content of this press release. Further information on these and other factors that could affect our financial
results is included in filings we have made and will make with the U.S. Securities and Exchange Commission from time to time.
[i]
Considers assets under management and advisory as of March 2024.
[ii]
“Net revenue from Fund Management and Advisory” is a measure that we use to assess our ability to generate profits
from our fund management and advisory business without measuring for the outcomes from funds above their respective benchmarks. We calculate
Net Revenue from Fund Management and Advisory as net revenue from services rendered less (a) net revenue from realized performance fees
and less (b) net revenue from unrealized performance fees.
[iii]
“Fee related earnings”, or “FRE”, is a metric to monitor the baseline performance of, and trends in, our
business, in a manner that does not include performance fees, investment income and expenses that do not arise from our normal course
of operations. FRE is calculated as operating profit, less (a) net revenue from realized performance fees, less (b) net revenue from
unrealized performance fees, plus (c) share-based payments plus (d) compensation allocated in relation to performance fees plus (e) non-operational
expenses, which are comprised of expenses relating to professional services rendered in connection with acquisitions and our international
corporate organization.
[iv]
“FRE Margin” is calculated as FRE divided by the sum of net revenue from fund management and net revenue from advisory
services.
[v]
“FRE per share” is calculated considering the number of outstanding shares at the end of the current quarter. Full
year values are calculated as the sum of the last three quarters.
[vi]
“Performance Related Earnings”, or “PRE”, is a performance measure that we use to assess our ability to
generate profits from revenue that relies on outcomes from funds above their respective benchmarks. We calculate PRE as operating profit
less (a) net revenue from fund management, less (b) net revenue from advisory services, plus (c) personnel and profit-sharing expenses,
plus (d) other general and administrative expenses, less (e) compensation in relation to performance fees.
[vii]
“PRE Margin” is calculated as PRE divided by net revenue from performance fees.
[viii]
“Segment Distributable Earnings” is Vinci Partners’ segment profitability measure used to make operating decisions
IR.VINCIPARTNERS.COM SHAREHOLDERRELATIONS@VINCIPARTNERS.COM | |
and assess performance across the company’s five segments (Private Markets, Public Equities, Investment Products and Solutions,
Retirement Services and Corporate Advisory). Segment Distributable Earnings is calculated as operating profit less (a) net revenue from
unrealized performance fees, plus (b) compensation allocated in relation to unrealized performance fees, plus (c) realized gain from
GP investment income.
[ix]
“Other items” comprise the income/(loss) generated by financial income/(expenses) related to SPS acquisition and Ares
investment and other financial expenses.
[x]
“Non-operational expenses” are composed by expenses related to professional services to matters related to acquisitions.
[xi]
“Distributable Earnings”, or “DE”, is used as a reference point by our board of directors to assess our
performance and capabilities to distribute dividends to our shareholders. Distributable Earnings is calculated as profit for the year,
less (a) net revenue from unrealized performance fees, plus (b) income taxes from unrealized performance fees, plus (c) compensation
allocated in relation to unrealized performance fees, less (d) unrealized gain from investment income, plus (e) income taxes on unrealized
gain from investment income, plus (f) share-based payments, plus (g) income taxes on share-based payments, plus (h) depreciation and
amortization, except for depreciation and amortization relating to each segment’s investments, less (i) contingent consideration
(earn-out) gain (loss) (after tax).
[xii]
“DE Margin” is calculated as Distributable Earnings divided by sum of net revenue from fund management, net revenue
from performance fees, net revenue from advisory services and realized gain from investment income.
[xiii]
“Adjusted Distributable Earnings”, or “Adjusted DE”, is used as a reference point by our board of directors
for determining the amount of earnings available to distribute to shareholders as dividends. Adjusted Distributable Earnings is calculated
as Distributable Earnings, less non-operational expenses, which are comprised of expenses relating to professional services rendered
in connection with acquisitions and our international corporate organization.
[xiv]
“Adjusted DE Margin” is calculated as Adjusted Distributable Earnings divided by the sum of net revenue from fund management,
net revenue from performance fees, and net revenue from advisory services and realized gain from investment income.
[xv]
“Adjusted DE per share” is calculated considering the number of outstanding shares at the end of the current quarter.
Full year values are calculated as the sum of the last three quarters.
[xvi]
“AUM” refers to assets under management. Our AUM equals the sum of: (1) the fair market value of all funds and management
accounts managed by Vinci Partners, across Private Equity, Real Estate, Infrastructure, Vinci SPS, Credit, IP&S, Public Equities
and Retirement Services; (2) the capital that we are entitled to call from investors in funds pursuant to the terms of their capital
commitments to those funds; and (3) the fair market value of co-investments arranged by us that were made or could be made by limited
partners of our corporate private equity funds and portfolio companies of such funds. AUM includes double counting related to funds from
one segment that invest in funds from another segment. Those cases occur mainly due to (a) fund, of funds of investment products and
solutions segment, and (b) investment funds in general that invest part of their cash in credit segment and hedge fund segment funds
in order to maintain liquidity and provide for returns on cash. Such amounts are eliminated on consolidation. The bylaws of the relevant
funds prohibit double-charging fees on AUM across segments. Therefore, while our AUM by segment may double-count funds from one segment
that invest in funds from another segment, the revenues for any given segment do not include revenue in respect of assets managed by
another segment, which means there are no intercompany eliminations on revenues in our results of operations.
[xvii]
In the First Quarter of 2024, Vinci Partners executed a strategic realignment across our segments, reassigning R$2.3
IR.VINCIPARTNERS.COM SHAREHOLDERRELATIONS@VINCIPARTNERS.COM | |
billion in
AUM from our Hedge Funds business to IP&S, while allocating the remainder R$534 million in AUM to our Public Equities division. Pro
Forma numbers for past quarters and last twelve months reflect the retroactive adjustment for this managerial reassignment.
[xviii]
“Total compensation and benefits” are the result of the profit sharing paid to our employees as (a) bonus compensation
related to management advisory and (b) performance-based compensation.
[xix]
“Segment personnel expenses” are composed of the salary-part compensation paid to employees and partners of our funds’
management teams.
[xx]
“Corporate center expenses” are composed by the salary-compensation paid to employees and partners of our support teams
and other expenses, such as research, risk, legal & compliance, investor relations, operations and ESG.
[xxi]
“Other general and administrative expenses” is made up of third-party expenses, depreciation and amortization, travel
and representation, marketing expenses, administrative fees, non-operating taxes, third-party consultants’ fees, such as legal
and accounting, and office consumables.
[xxii]
“GP investment income” is income from proprietary investments made by us in our own Private Markets’ funds, used
as GP Commitments.
[xxiii]
“Financial income” is income generated through the investments made with our cash and cash equivalents in cash and
bank deposits, certificate of deposits and proprietary investments in our Liquid Funds from our public equities and hedge funds’
segments.
[xxiv]
“Leasing expenses” include costs from the company’s sub-leasing activities.
[xxv]
“Share Based Plan” is the composition of two benefit programs: SOP (Stock Option Plan) and RSU (Restricted Stock Units).
In Stock Option Plan the company concedes to an employee the option to buy stock in the company with stated fixed price. The Restricted
Stock Units concedes company shares to an employee through a vesting plan in which RSUs are assigned a fair market value.
[xxvi]
Income taxes is comprised of taxes on our corporate income tax and social contribution taxes. We are taxed on an actual taxable
profit regime, while part of our subsidiaries is taxed based on deemed profit.
[xxvii]
NAV is the net asset value of each fund. For listed vehicles, the NAV represents the Market valuation of the fund ex-dividends.
[xxviii]
Atlas strategy includes the funds Atlas FIC FIM, Atlas Institucional FIC FIM and Vinci Potenza.
[xxix]
Total Return Strategy includes the funds Total Return FIC FIM and Total Return Institucional FIA.
[xxx]
Mosaico Strategy includes the funds Mosaico, Mosaico Institucional and Mosaico Advisory FIA.
[xxxi]
Valorem Strategy includes the funds Valorem FIM and Valorem Advisory.
[xxxii]
Equilibrio Strategy comprises IP&S Family of pension plans.
[xxxiii]
Track record information is presented throughout this release on a pro forma basis and in local currency,
excluding
PIPE investments, a strategy that will be discontinued in VCP III.
IR.VINCIPARTNERS.COM SHAREHOLDERRELATIONS@VINCIPARTNERS.COM | |
[xxxiv]
“MOIC” means multiple on invested capital, a ratio intended to represent how much value an investment has returned,
and is calculated as realized value plus unrealized value, divided by the total amount invested, gross of expenses and fees.
[xxxv]
“IRR” means the internal rate of return, which is a discount rate that makes the net present value of all cash flows
equal to zero in a discounted cash flow analysis.
[xxxvi]
Total commitments for VCP III include R$1.3 billion in co-investments. Track record presented for the VCP strategy as of 4Q’23,
due to fund’s administrator timeline to disclose the quarterly markup of the fund, which are presented as of 1Q’24.
[xxxvii]
Performance information for Nordeste Empreendedor (“NE I”) comprises only the four (out of seven) investments invested,
managed and divested by a team led by Jose Pano (collectively, the ”Participating Investments”) while they were employed
by NE I’s manager (the “NE I Manager”), an entity not affiliated with the manager or Vinci Partners. Information herein
pertaining to any investments made by NE I manager has not been prepared by NE I manager and NE I manager assumes no responsibility for
the accuracy or completeness of any such information.
[xxxviii]
Track record for VIR strategy is presented as of 4Q’23, due to fund’s administrator timeline to disclose the quarterly
markup of the fund.
[xxxix]
Track record for Vinci SPS strategy is presented as of 1Q’24.
[xl]
Track record for FIP Infra is presented as of 4Q’23.
[xli]
Track record for VIAS is presented as of 4Q’23.
[xlii]
Total Commitments for VICC are presented as of 1Q’24.
[xliii]
Track record for VFDL is presented as of 1Q’24.
[xliv]
Track record for Vinci Credit Infra is presented as of 1Q’24.
[xlv]
US$ Distributable Earnings was calculated considering the exchange rate from USD to BRL of 5.061 as of May 07, 2024, when dividends
were approved by our Board of Directors.
[xlvi]
Per Share calculations are based on end of period Participating Common Shares.
[xlvii]
Actual dividends per common share are calculated considering the share count as of the applicable record date.
[xlviii]
As of March 28, 2024, Public Float was comprised of 12,510,083 Class A common shares.
[xlix]
The remaining capital committed in FIP Infra Transmissão co-investment will not be called by the fund, which is already
in divestment period.
[l] The
remaining capital committed in FIP Infra Transmissão will not be called by the fund, which is already in divestment period.
IR.VINCIPARTNERS.COM SHAREHOLDERRELATIONS@VINCIPARTNERS.COM | |
[li]
Brazilian tax law establishes that companies that generate gross revenues of up to R$ 78,000.00 in the prior fiscal year may calculate
income taxes as a percentage of gross revenue, using the presumed profit income tax regime. The Entity's subsidiaries adopted this tax
regime and the effect of the presumed profit of subsidiaries represents the difference between the taxation based on this method and
the amount that would be due based on the statutory rate applied to the taxable profit of the subsidiaries.
IR.VINCIPARTNERS.COM SHAREHOLDERRELATIONS@VINCIPARTNERS.COM | |


Exhibit 99.3
Vinci Partners Investments Ltd.
Interim Financial Statements as of
March 31, 2024
Vinci Partners Investments Ltd.
Consolidated balance sheets
All amounts in thousands of reais unless otherwise stated
| Assets | |
Note | |
03/31/2024 | |
12/31/2023 |
| | |
| |
| |
|
| Current assets | |
| | | |
| | | |
| | |
| Cash and cash equivalents | |
| 5 | (c) | |
| 531,988 | | |
| 660,305 | |
| Cash and bank deposits | |
| 5 | (c) | |
| 45,738 | | |
| 15,896 | |
| Financial instruments at fair value through profit or loss | |
| 5 | (c) | |
| 85,649 | | |
| 173,300 | |
| Financial instruments at amortized cost | |
| 5 | (c) | |
| 400,601 | | |
| 471,109 | |
| Financial instruments at fair value through profit or loss | |
| 5 | (d) | |
| 1,221,642 | | |
| 1,168,355 | |
| Accounts receivable | |
| 5 | (a) | |
| 89,701 | | |
| 101,523 | |
| Sub-leases receivable | |
| 10 | | |
| 3,601 | | |
| 4,071 | |
| Taxes recoverable | |
| | | |
| 1,630 | | |
| 2,219 | |
| Other assets | |
| 6 | | |
| 25,169 | | |
| 19,109 | |
| Total current assets | |
| | | |
| 1,873,731 | | |
| 1,955,582 | |
| | |
| | | |
| | | |
| | |
| Non-current assets | |
| | | |
| | | |
| | |
| Financial instruments at fair value through profit or loss | |
| 5 | (c) | |
| 57,965 | | |
| 7,146 | |
| Accounts receivable | |
| 5 | (a) | |
| 16,412 | | |
| 16,638 | |
| Sub-leases receivable | |
| 10 | | |
| 1,079 | | |
| 1,467 | |
| Taxes recoverable | |
| | | |
| 1,139 | | |
| 325 | |
| Deferred taxes | |
| 20 | | |
| 16,395 | | |
| 13,487 | |
| Other assets | |
| 6 | | |
| 19,556 | | |
| 19,427 | |
| | |
| | | |
| 112,546 | | |
| 58,490 | |
| | |
| | | |
| | | |
| | |
| Property and equipment | |
| 8 | | |
| 11,924 | | |
| 12,591 | |
| Right of use – Leases | |
| 10 | | |
| 55,917 | | |
| 58,308 | |
| Intangible assets | |
| 9 | | |
| 215,527 | | |
| 214,748 | |
| Total non-current assets | |
| | | |
| 395,914 | | |
| 344,137 | |
| | |
| | | |
| | | |
| | |
| Total assets | |
| | | |
| 2,269,645 | | |
| 2,299,719 | |
The accompanying notes are an integral part of these interim consolidated
financial statements.
Vinci Partners Investments Ltd.
Consolidated balance sheets
All amounts in thousands of reais unless otherwise stated
| Liabilities and equity | |
Note | |
03/31/2024 | |
12/31/2023 |
| | |
| |
| |
|
| Current liabilities | |
| | | |
| | | |
| | |
| Trade payables | |
| | | |
| 348 | | |
| 1,869 | |
| Deferred revenue | |
| 25 | | |
| 10,419 | | |
| - | |
| Leases | |
| 10 and 5(e) | | |
| 25,104 | | |
| 24,381 | |
| Accounts payable | |
| 11 | | |
| 6,052 | | |
| 6,020 | |
| Labor and social security obligations | |
| 12 | | |
| 27,325 | | |
| 101,506 | |
| Loans and obligations | |
| 14 | | |
| 78,138 | | |
| 76,722 | |
| Taxes and contributions payable | |
| 13 | | |
| 18,618 | | |
| 24,853 | |
| Total current liabilities | |
| | | |
| 166,004 | | |
| 235,351 | |
| | |
| | | |
| | | |
| | |
| Non-current liabilities | |
| | | |
| | | |
| | |
| Leases | |
| 10 and 5(e) | | |
| 43,188 | | |
| 48,431 | |
| Labor and social security obligations | |
| 12 | | |
| 6,784 | | |
| 5,357 | |
| Loans and obligations | |
| 14 | | |
| 554,452 | | |
| 540,369 | |
| Deferred taxes | |
| 20 | | |
| 4,303 | | |
| 3,883 | |
| Retirement plans liabilities | |
| 15 | | |
| 144,782 | | |
| 85,554 | |
| Total non-current liabilities | |
| | | |
| 753,509 | | |
| 683,594 | |
| | |
| | | |
| | | |
| | |
| Total liabilities | |
| | | |
| 919,513 | | |
| 918,946 | |
| | |
| | | |
| | | |
| | |
| Equity | |
| 16 | | |
| | | |
| | |
| Share capital | |
| | | |
| 15 | | |
| 15 | |
| Additional paid-in capital | |
| | | |
| 1,408,438 | | |
| 1,408,438 | |
| Treasury shares | |
| 16 | (f) | |
| (201,165 | ) | |
| (172,863 | ) |
| Retained earnings | |
| | | |
| 104,244 | | |
| 111,444 | |
| Other reserves | |
| | | |
| 37,185 | | |
| 31,876 | |
| | |
| | | |
| 1,348,717 | | |
| 1,378,910 | |
| | |
| | | |
| | | |
| | |
| Non-controlling interests in the equity of subsidiaries | |
| 7 | (b) | |
| 1,415 | | |
| 1,864 | |
| | |
| | | |
| | | |
| | |
| Total equity | |
| | | |
| 1,350,132 | | |
| 1,380,774 | |
| | |
| | | |
| | | |
| | |
| Total liabilities and equity | |
| | | |
| 2,269,645 | | |
| 2,299,719 | |
The accompanying notes are an integral part of these interim consolidated
financial statements.
Vinci Partners Investments Ltd.
Interim consolidated statement of income
For the three-month period ended March 31
All amounts in thousands of reais unless otherwise stated
| Statements of Income | |
Note | |
03/31/2024 | |
03/31/2023 |
| | |
| |
| |
|
| Net revenue from services rendered | |
| 17 | | |
| 109,087 | | |
| 102,308 | |
| | |
| | | |
| | | |
| | |
| General and administrative expenses | |
| 18 | | |
| (61,658 | ) | |
| (54,130 | ) |
| | |
| | | |
| | | |
| | |
| Operating profit | |
| | | |
| 47,429 | | |
| 48,178 | |
| | |
| | | |
| | | |
| | |
| Finance income | |
| 19 | | |
| 32,611 | | |
| 4,253 | |
| Finance expenses | |
| 19 | | |
| (23,948 | ) | |
| (6,844 | ) |
| | |
| | | |
| | | |
| | |
| Finance profit, net | |
| | | |
| 8,663 | | |
| (2,591 | ) |
| | |
| | | |
| | | |
| | |
| Profit before income taxes | |
| | | |
| 56,092 | | |
| 45,587 | |
| | |
| | | |
| | | |
| | |
| Income taxes | |
| 20 | | |
| (10,384 | ) | |
| (12,881 | ) |
| | |
| | | |
| | | |
| | |
| Profit for the year | |
| | | |
| 45,708 | | |
| 32,706 | |
| | |
| | | |
| | | |
| | |
| Attributable to the shareholders of the parent company | |
| | | |
| 46,157 | | |
| 32,737 | |
| Attributable to non-controlling interests | |
| | | |
| (449 | ) | |
| (31 | ) |
| | |
| | | |
| | | |
| | |
| Basic earnings per share in Brazilian Reais | |
| 16 | (g) | |
| 0.84 | | |
| 0.58 | |
| Diluted earnings per share in Brazilian Reais | |
| 16 | (g) | |
| 0.80 | | |
| 0.57 | |
The accompanying notes are an integral part of these interim consolidated
financial statements.
Vinci Partners Investments Ltd.
Interim consolidated statement of comprehensive income
For the three-month period ended March 31
All amounts in thousands of reais unless otherwise stated
| | |
03/31/2024 | |
03/31/2023 |
| | |
| |
|
| Profit for the year | |
| 45,708 | | |
| 32,706 | |
| | |
| | | |
| | |
| Other comprehensive income | |
| | | |
| | |
| Items that may be reclassified to profit or loss: | |
| | | |
| | |
| Foreign exchange variance of investees | |
| | | |
| | |
| Vinci Capital Partners GP Limited | |
| 4 | | |
| (3 | ) |
| Vinci USA LLC | |
| 947 | | |
| (869 | ) |
| Vinci Capital Partners F III GP Limited | |
| 22 | | |
| (22 | ) |
| GGN GP LLC | |
| 2 | | |
| (3 | ) |
| VICC Infra GP LLC | |
| 11 | | |
| (4 | ) |
| Vinci Capital Partners IV GP LLC | |
| 58 | | |
| (48 | ) |
| VICC Infra GP (Lux), S.A.R.L. | |
| (14 | ) | |
| - | |
| | |
| | | |
| | |
| Total comprehensive income for the year | |
| 46,738 | | |
| 31,757 | |
| | |
| | | |
| | |
| Attributable to: | |
| | | |
| | |
| Shareholders of the parent company | |
| 47,187 | | |
| 31,788 | |
| Non-controlling interests | |
| (449 | ) | |
| (31 | ) |
| | |
| | | |
| | |
| | |
| 46,738 | | |
| 31,757 | |
The accompanying notes are an integral part of these interim consolidated
financial statements.
Vinci Partners Investments Ltd.
Interim consolidated statement of changes in equity
For the three-month period ended March 31
All amounts in thousands of reais unless otherwise stated
| | |
Share capital | |
Additional Paid-in
capital | |
Retained earnings | |
Other reserves | |
Treasury shares | |
Total | |
Non-controlling interests | |
Total equity |
| | |
| |
| |
| |
| |
| |
| |
| |
|
| At January 01, 2023 | |
| 15 | | |
| 1,382,038 | | |
| 81,310 | | |
| 24,149 | | |
| (114,978 | ) | |
| 1,372,534 | | |
| 3,013 | | |
| 1,375,547 | |
| | |
| | | |
| | | |
| | | |
| | | |
| | | |
| | | |
| | | |
| | |
| Profit for the year | |
| - | | |
| - | | |
| 32,737 | | |
| - | | |
| - | | |
| 32,737 | | |
| (31 | ) | |
| 32,706 | |
| Other comprehensive income: | |
| | | |
| | | |
| | | |
| | | |
| | | |
| | | |
| | | |
| | |
| Foreign exchange variation of investee located abroad | |
| - | | |
| - | | |
| - | | |
| (949 | ) | |
| - | | |
| (949 | ) | |
| - | | |
| (949 | ) |
| Share based payments | |
| - | | |
| - | | |
| - | | |
| 1,986 | | |
| - | | |
| 1,986 | | |
| - | | |
| 1,986 | |
| Treasury quotas bought | |
| - | | |
| - | | |
| - | | |
| - | | |
| (17,988 | ) | |
| (17,988 | ) | |
| - | | |
| (17,988 | ) |
| Allocation of profit: | |
| | | |
| | | |
| | | |
| | | |
| | | |
| | | |
| | | |
| | |
| Dividends | |
| - | | |
| - | | |
| (49,015 | ) | |
| - | | |
| - | | |
| (49,015 | ) | |
| - | | |
| (49,015 | ) |
| | |
| | | |
| | | |
| | | |
| | | |
| | | |
| | | |
| | | |
| | |
| | |
| | | |
| | | |
| | | |
| | | |
| | | |
| | | |
| | | |
| | |
| At March 31, 2023 | |
| 15 | | |
| 1,382,038 | | |
| 65,032 | | |
| 25,186 | | |
| (132,966 | ) | |
| 1,339,305 | | |
| 2,982 | | |
| 1,342,287 | |
| | |
| | | |
| | | |
| | | |
| | | |
| | | |
| | | |
| | | |
| | |
| At January 01, 2024 | |
| 15 | | |
| 1,408,438 | | |
| 111,444 | | |
| 31,876 | | |
| (172,863 | ) | |
| 1,378,910 | | |
| 1,864 | | |
| 1,380,774 | |
| | |
| | | |
| | | |
| | | |
| | | |
| | | |
| | | |
| | | |
| | |
| Profit for the year | |
| - | | |
| - | | |
| 46,157 | | |
| - | | |
| - | | |
| 46,157 | | |
| (449 | ) | |
| 45,708 | |
| Other comprehensive income: | |
| | | |
| | | |
| | | |
| | | |
| | | |
| | | |
| | | |
| | |
| Foreign exchange variation of investee located abroad | |
| - | | |
| - | | |
| - | | |
| 1,030 | | |
| - | | |
| 1,030 | | |
| - | | |
| 1,030 | |
| Share based payments | |
| - | | |
| - | | |
| - | | |
| 4,279 | | |
| - | | |
| 4,279 | | |
| - | | |
| 4,279 | |
| Treasury shares bought, net of shares sold | |
| - | | |
| - | | |
| - | | |
| - | | |
| (28,302 | ) | |
| (28,302 | ) | |
| - | | |
| (28,302 | ) |
| Allocation of profit: | |
| | | |
| | | |
| | | |
| | | |
| | | |
| | | |
| | | |
| | |
| Dividends | |
| - | | |
| - | | |
| (53,357 | ) | |
| - | | |
| - | | |
| (53,357 | ) | |
| - | | |
| (53,357 | ) |
| | |
| | | |
| | | |
| | | |
| | | |
| | | |
| | | |
| | | |
| | |
| At March 31, 2024 | |
| 15 | | |
| 1,408,438 | | |
| 104,244 | | |
| 37,185 | | |
| (201,165 | ) | |
| 1,348,717 | | |
| 1,415 | | |
| 1,350,132 | |
The accompanying notes are an integral part of these interim consolidated
financial statements.
Vinci Partners Investments Ltd.
Interim consolidated statements of cash flows
For the three-month period ended March 31
All amounts in thousands of reais unless otherwise stated
| | |
Notes | |
03/31/2024 | |
03/31/2023 |
| Cash flows from operating activities | |
| | | |
| | | |
| | |
| | |
| | | |
| | | |
| | |
| Profit before taxation | |
| | | |
| 56,092 | | |
| 45,587 | |
| Adjustments to reconcile net income to cash flows from operations: | |
| | | |
| | | |
| | |
| Depreciation and amortization | |
| 18 | | |
| 5,464 | | |
| 4,555 | |
| Investment income of financial instruments at fair value through profit or loss | |
| | | |
| 34,844 | | |
| 3,173 | |
| Net foreign exchange on liabilities at amortized cost | |
| 14 | (i) | |
| 15,576 | | |
| - | |
| Interest expense on loans and obligations | |
| 19 | | |
| 15,010 | | |
| 3,934 | |
| Loss/(gain) on remeasurement of contingent consideration | |
| 19 | | |
| 5,756 | | |
| (4,051 | ) |
| Share based payments | |
| 18 | | |
| 6,148 | | |
| 2,107 | |
| Financial result on lease agreements | |
| 19 | | |
| 2,037 | | |
| 2,555 | |
| | |
| | | |
| 140,927 | | |
| 57,860 | |
| Changes in assets and liabilities | |
| | | |
| | | |
| | |
| Accounts receivables | |
| | | |
| 12,048 | | |
| (2,494 | ) |
| Taxes recoverable | |
| | | |
| (225 | ) | |
| (568 | ) |
| Other assets | |
| | | |
| (6,188 | ) | |
| (3,552 | ) |
| Trade payables | |
| | | |
| (1,521 | ) | |
| (726 | ) |
| Deferred revenue | |
| | | |
| 10,419 | | |
| 17,219 | |
| Accounts payable | |
| | | |
| 32 | | |
| (85 | ) |
| Labor and social security obligations | |
| | | |
| (74,623 | ) | |
| (62,473 | ) |
| Taxes and contributions payable | |
| | | |
| (4,847 | ) | |
| (419 | ) |
| Contribution for retirements plans | |
| | | |
| 58,000 | | |
| - | |
| | |
| | | |
| (6,905 | ) | |
| (53,098 | ) |
| | |
| | | |
| | | |
| | |
| Cash generated from operations | |
| | | |
| 134,022 | | |
| 4,762 | |
| Income tax paid | |
| | | |
| (15,417 | ) | |
| (18,219 | ) |
| Net cash inflow from operating activities | |
| | | |
| 118,605 | | |
| (13,457 | ) |
| | |
| | | |
| | | |
| | |
| Cash flows from investing activities | |
| | | |
| | | |
| | |
| Purchases of property and equipment and additions to intangible assets | |
| | | |
| (3,302 | ) | |
| (4,196 | ) |
| Purchase of financial instruments at fair value through profit or loss | |
| | | |
| (383,265 | ) | |
| (13,338 | ) |
| Sales of financial instruments at fair value through profit or loss | |
| | | |
| 245,543 | | |
| 76,375 | |
| | |
| | | |
| | | |
| | |
| Net cash (outflow) from investing activities | |
| | | |
| (141,024 | ) | |
| 58,841 | |
| | |
| | | |
| | | |
| | |
| Cash flows from financing activities | |
| | | |
| | | |
| | |
| Interest payments of loans and obligations | |
| 14 | (ii) | |
| (11,955 | ) | |
| (5,943 | ) |
| Principal payments of loans and obligations | |
| 14 | (ii) | |
| (8,889 | ) | |
| - | |
| Treasury shares acquisition paid, net of treasury shares sold | |
| 16 | (f) | |
| (28,302 | ) | |
| (18,431 | ) |
| Lease payments, net of sublease received | |
| | | |
| (5,652 | ) | |
| (5,864 | ) |
| Dividends paid | |
| 16 | (e) | |
| (53,228 | ) | |
| (48,474 | ) |
| | |
| | | |
| | | |
| | |
| Net cash (outflow) from financing activities | |
| | | |
| (108,026 | ) | |
| (78,712 | ) |
| | |
| | | |
| | | |
| | |
| Net increase in cash and cash equivalents | |
| | | |
| (130,445 | ) | |
| (33,328 | ) |
| | |
| | | |
| | | |
| | |
| Cash and cash equivalents at the beginning of the year | |
| 5 | (c) | |
| 660,305 | | |
| 136,581 | |
| | |
| | | |
| | | |
| | |
| Foreign exchange variation of cash and cash equivalents in subsidiary | |
| | | |
| 2,128 | | |
| (2,051 | ) |
| | |
| | | |
| | | |
| | |
| Cash and cash equivalents at the end of the year | |
| 5 | (c) | |
| 531,988 | | |
| 101,202 | |
Non-cash financing activities
Dividends declared and not yet paid until March 31, 2024 and 2023 were
R$ 3,791 (Note 11), respectively.
Consideration payable and contingent consideration (earn-out) as of
March 31, 2024 and 2023 were 119,552 and 82,123 (Note 14), respectively. Vinci expects to pay the contingent consideration through its
equity instruments. However, accordingly to IAS 32, the earn-out obligation was classified as a financial liability.
The accompanying notes are an integral part of these interim consolidated
financial statements.
Vinci Partners Investments Ltd.
Notes to the interim consolidated financial statements
All amounts in thousands of reais unless otherwise stated
Vinci Partners Investments Ltd. is an exempted
company incorporated in the Cayman Islands (referred to herein as "Entity", "Group" or "Vinci"). The Group
started its activities in September 2009. Its objective is to hold investments in the capital of other companies as partner (shareholder).
The investees are specialized in rendering alternative investment management, asset allocation, corporate advisory services and retirement
services.
The registered office of the Entity is at Harneys
Fiduciary (Cayman) Limited, 4th Floor, Harbour Place, 103 South Church Street, P.O. Box 10240, Grand Cayman KY1-1002, Cayman Islands.
| 2 | Summary of significant accounting policies |
| 2.1 | Basis of preparation and presentation |
The unaudited interim condensed consolidated financial
statements have been prepared in accordance with IAS 34 Interim Financial Reporting as issued by the International Accounting Standards
Board (“IASB”).
The unaudited interim condensed consolidated financial
statements do not include all the information and disclosures required in the annual financial statements and should be read in conjunction
with the Group’s annual consolidated financial statements as of December 31, 2023.
The accounting policies adopted are consistent
with those of the previous financial year and corresponding interim reporting period.
The unaudited interim condensed consolidated financial
statements are presented in Brazilian reais (“R$”), and all amounts disclosed in the financial statements and notes have been
rounded off to the nearest thousand currency units unless otherwise stated.
The issuance of these financial statements was
authorized by the Entity's management on May 9, 2024.
| (a) | Interim consolidated financial statements |
Vinci operates as an asset management firm. The
Group focuses on private markets, public equities, corporate advisory, investment products and solutions, and retirement services, which
comprise the main activity of the Group.
The Group controls an entity where the Group is
exposed to, or has rights to, variable returns from its involvement with the entity and has the ability to affect those returns through
its power to direct the activities of the entity.
Also, the Entity holds interest in subsidiaries
whose main purpose and activities are providing services that relate to the Entity’s activities. Therefore, the Entity consolidates
these subsidiaries.
Ownership interest in subsidiaries on March 31, 2024 and December 31,
2023 are as follows:
Vinci Partners Investments Ltd.
Notes to the interim consolidated financial statements
All amounts in thousands of reais unless otherwise stated
| | |
Interest - % |
| | |
| |
|
| | |
| 03/31/2024 | | |
| 12/31/2023 | |
| | |
| | | |
| | |
| Subsidiaries | |
| | | |
| | |
| Vinci Partners Investimentos Ltda. | |
| 100 | | |
| 100 | |
| Vinci Assessoria financeira Ltda. (1) | |
| 100 | | |
| 100 | |
| Vinci Equities Gestora de Recursos Ltda. (1) | |
| 100 | | |
| 100 | |
| Vinci Gestora de Recursos Ltda. (1) | |
| 100 | | |
| 100 | |
| Vinci Capital Gestora de Recursos Ltda. (1) | |
| 100 | | |
| 100 | |
| Vinci Soluções de Investimentos Ltda. | |
| 100 | | |
| 100 | |
| Vinci Real Estate Gestora de Recursos Ltda. (1) | |
| 100 | | |
| 100 | |
| Vinci Capital Partners GP Limited. | |
| 100 | | |
| 100 | |
| Vinci Partners USA LLC | |
| 100 | | |
| 100 | |
| Vinci GGN Gestão de Recursos Ltda. (1) | |
| 100 | | |
| 100 | |
| Vinci Infraestrutura Gestora de Recursos Ltda. | |
| 100 | | |
| 100 | |
| Vinci Capital Partners GP III Limited. | |
| 100 | | |
| 100 | |
| GGN GP LLC | |
| 100 | | |
| 100 | |
| Vinci APM Ltda. (1) | |
| 100 | | |
| 100 | |
| Vinci Monalisa FIM Crédito Privado IE (2) | |
| 100 | | |
| 100 | |
| Vinci Asset Allocation Ltda. | |
| 75 | | |
| 75 | |
| VICC Infra GP LLC | |
| 100 | | |
| 100 | |
| Vinci Capital Partners IV GP LLC | |
| 100 | | |
| 100 | |
| Vinci Holding Securitária Ltda. | |
| 85 | | |
| 85 | |
| Vinci Vida e Previdência S.A. (3) | |
| 85 | | |
| 85 | |
| Vinci SPS Capital Gestão de Recursos Ltda. (4) | |
| 100 | | |
| 100 | |
| VICC Infra GP (Lux), S.A.R.L. | |
| 100 | | |
| 100 | |
| VINCI US RE Corporation (5) | |
| 98 | | |
| - | |
| (1) | Minority interest represents less than 0.001%. |
| (2) | Under the terms of IFRS 10, the Entity does not consolidate
its investment in Vinci Monalisa FIM Crédito Privado IE and measures at fair value through profit or loss in accordance with IFRS
9. |
| (3) | Vinci has an indirect interest at Vinci Vida e Previdência
of 85% through its subsidiary Vinci Holding Securitária Ltda., which holds 100% of ownership interest at Vinci Vida e Previdência.
Vinci Vida e Previdência commenced its operations in April 2023. |
| (4) | On 16 August 2022, Vinci Soluções de Investimentos Ltda. acquired 90% of the issued share capital of SPS Capital Gestão
de Recursos Ltda. The acquisition gives to Vinci Soluções de Investimentos the right of 100% on the economic interest of
SPS Gestão de Recursos Ltda. |
| (5) | Under the terms of IFRS 10, the Entity does not consolidate its investment in Vinci US RE Corporation and measures at fair value through
profit or loss in accordance with IFRS 9. |
Subsidiaries are all entities (including structured
entities) over which the Group has control. Subsidiaries are fully consolidated from the date on which control is transferred to the Group.
They are deconsolidated from the date that control ceases.
Inter-company transactions, balances and unrealized
gains on transactions between Group companies are eliminated. Unrealized losses are also eliminated unless the transaction provides evidence
of an impairment of the transferred asset. Accounting policies of subsidiaries have been changed where necessary to ensure consistency
with the policies adopted by the Group.
Non-controlling interests in the results and equity
of subsidiaries are shown separately in the consolidated statement of profit or loss, consolidated statement of comprehensive income,
consolidated statement of changes in equity and consolidated balance sheet respectively.
The Group treats transactions with non-controlling
interests that do not result in a loss of control as transactions with equity
Vinci Partners Investments Ltd.
Notes to the interim consolidated financial statements
All amounts in thousands of reais unless otherwise stated
owners of the Group. A change in ownership interest
results in an adjustment between the carrying amounts of the controlling and non-controlling interests to reflect their relative interests
in the subsidiary. Any difference between the amount of the adjustment to non-controlling interests and any consideration paid or received
is recognized in another reserve within equity attributable to owners of Entity.
When the Group ceases to consolidate an investment
or account for it under equity method because of a loss of control, joint control or significant influence, any retained interest in the
entity is remeasured to its fair value, with the change in carrying amount recognized in profit or loss. This fair value becomes the initial
carrying amount for the purposes of subsequently accounting for the retained interest as an associate, joint venture or financial asset.
In addition, any amounts previously recognized in other comprehensive income in respect of that entity are accounted for as if the group
had directly disposed of the related assets or liabilities. This may mean that amounts previously recognized in other comprehensive income
are reclassified to profit or loss.
In 2021, the members of the Board of Directors
of Vinci Partners Investments Ltd were appointed. Under the supervision of the Board of Directors, the CEO is responsible for the decision-making
process related to executive themes, resources allocation and strategic decisions of Vinci.
The strategic decisions of the Group comprise
five distinct business segments: (i) Private market strategies, (ii) Public equities, (iii) Investment products and solutions; (iv) Corporate
advisory and (v) Vinci retirement services (Note 20).
Strategies were sorted out within business segments
following technical and strategic similarities among funds’ attributes, such as management and performance fee structures, liquidity
constraints, targeted returns and investor profile.
| 3 | Accounting estimates and judgments |
The Entity makes estimates and assumptions concerning
the future, based on historical experience and other factors, including expectations of future events. The resulting accounting estimates
will, by definition, seldom equal the related actual results. The main estimations and assumptions made by the Entity is included as follow:
| • | Allowance of expected credit losses of accounts receivable. |
| • | Provision for profit sharing. |
| • | Consolidation of subsidiaries. |
| • | Fair value measurement of financial assets. |
| • | Provision for contingent liabilities. |
| • | Impairment for goodwill and other intangible assets. |
| • | Fair value measurement of contingent consideration. |
| • | Fair value of share-based payments. |
| • | Financial evaluation of compound instruments. |
| 4 | Financial risk management |
The main risks related to the financial instruments
are credit risk, market risk, and liquidity risk, as defined below. The management of such risks involves various levels in the Entity
and comprehends a number of policies and strategies. The Group's risk management focuses on the unpredictability of financial markets
and seeks to mitigate potential adverse impacts on the Group's financial performance.
Vinci Partners Investments Ltd.
Notes to the interim consolidated financial statements
All amounts in thousands of reais unless otherwise stated
| 4.1 | Financial risk factors |
This note explains the Group's exposure to financial
risks and how these risks could affect the Group's future financial performance. Current year profit and loss information has been included
where relevant to add further context.
The Group's risk management is predominantly controlled
by a risk assessment department under process and controls approved by the management. The management provides written process and controls
for overall risk management, as well as policies covering specific areas, such as foreign exchange risk, interest rate risk, credit risk,
use of derivative financial instruments and non-derivative financial instruments, and investment of excess liquidity.
Credit risk arises from cash and cash equivalents,
contractual cash flows of debt investments carried at amortized cost, at fair value through profit or loss (FVTPL), and deposits with
banks and financial institutions, as well as credit exposures to wholesale and retail customers, including outstanding receivables.
(i) Risk management
As of March 31, 2024, and 2023 the expected credit
losses are considered immaterial due to the short maturities of the deposits and the credit quality of the main counterparty, which have
a credit rating AAA evaluated by Fitch Ratings. The Entity has not suffered any losses from cash and cash equivalents since inception.
Vinci's treasury review expected credit losses on a regular basis.
(ii) Impairment of financial assets
The Group has the following types of financial
assets that are subject to the expected credit loss model:
| • | Debt investments carried at amortized cost. |
While cash and cash equivalents are also subject
to the impairment requirements of IFRS 9, the expected impairment loss was immaterial.
Vinci Partners Investments Ltd.
Notes to the interim consolidated financial statements
All amounts in thousands of reais unless otherwise stated
(i) Foreign exchange risk
At the reporting date, the carrying amount value
of the Group’s financial assets and liabilities exposed to US Dollars and Euros were as follows:
| Balance sheet | |
03/31/2024 | |
12/31/2023 |
| | |
| |
|
| Cash and cash equivalents | |
| 453,194 | | |
| 486,977 | |
| Financial instruments at fair value through profit or loss | |
| - | | |
| 606 | |
| Accounts receivable | |
| 10,890 | | |
| 5,927 | |
| Other receivables | |
| 3,410 | | |
| 2,381 | |
| Current assets | |
| 467,494 | | |
| 495,891 | |
| | |
| | | |
| | |
| Financial instruments at fair value through profit or loss | |
| 35,020 | | |
| - | |
| Other receivables | |
| - | | |
| (29 | ) |
| Leases, property and equipment | |
| 2,561 | | |
| 2,684 | |
| Non-current assets | |
| 37,581 | | |
| 2,655 | |
| | |
| | | |
| | |
| Trade payables | |
| 307 | | |
| 589 | |
| Deferred revenue | |
| 2,398 | | |
| - | |
| Loans and obligations | |
| 9,992 | | |
| 6,993 | |
| Labor and social security obligations | |
| 311 | | |
| 5,485 | |
| Taxes and contributions payable | |
| 3 | | |
| - | |
| Current liabilities | |
| 13,011 | | |
| 13,067 | |
| | |
| | | |
| | |
| Other payables | |
| 250 | | |
| 242 | |
| Loans and obligations | |
| 441,358 | | |
| 424,340 | |
| Lease | |
| 733 | | |
| 940 | |
| Non-current liabilities | |
| 442,341 | | |
| 425,522 | |
| | |
| | | |
| | |
| Net Equity exposed to US Dollars | |
| 48,242 | | |
| 59,957 | |
| Net Equity exposed to Euros | |
| 1,481 | | |
| - | |
The aggregate net foreign exchange gains/losses recognized in profit
or loss were:
| Net foreign exchange result | |
03/31/2024 | |
03/31/2023 |
| | |
| |
|
| Financial expense | |
| (614 | ) | |
| (155 | ) |
| | |
| | | |
| | |
| Net foreign exchange result, net | |
| (614 | ) | |
| (155 | ) |
The Group operates internationally and is exposed
to foreign exchange risk, exclusively the US dollar.
Foreign exchange risk arises from future commercial
transactions and recognized assets and liabilities denominated in a currency that is not the functional currency of the Group.
(ii) Interest rate risk
The Group's profit or loss is sensitive to higher/lower
interest income from cash equivalents and fixed income funds as a result of changes in interest rates.
Vinci Partners Investments Ltd.
Notes to the interim consolidated financial statements
All amounts in thousands of reais unless otherwise stated
(iii) Price risk
The Group's exposure to investment securities
price risk arises from investments held by the group and classified in the balance sheet at fair value through profit or loss (note 5).
To manage its price risk arising from investments
in investment securities, the Group diversifies its portfolio. Diversification of the portfolio is done in accordance with the limits
set by the Group.
The majority of the Group's financial investments
that are exposed to significant price risk are the private equity investments and investments held by Monalisa FIM. Note 5(d) demonstrates
the sensitivity analyses of impact for the assets held by the Group.
Prudent liquidity risk management implies maintaining
sufficient cash and marketable securities and the availability of funding through an adequate amount of committed credit facilities to
meet obligations when due and to close out market positions. At the end of the reporting period the Group held bank deposits, certificates
of deposits and US treasury bills of R$ 531,988 (12/31/2023 – R$ 189,196) that are expected to readily generate cash inflows for
managing liquidity risk.
Net debt reconciliation
This section sets out an analysis of net debt
and the movements in net debt for each of the years presented.
| | |
03/31/2024 | |
12/31/2023 |
| Cash and cash equivalents | |
| 531,988 | | |
| 660,305 | |
| Financial instruments at fair value through profit or loss (i) | |
| 1,221,642 | | |
| 1,168,355 | |
| Trade payables | |
| (348 | ) | |
| (1,869 | ) |
| Labor and social security obligations | |
| (34,109 | ) | |
| (106,863 | ) |
| Accounts payable | |
| (6,052 | ) | |
| (6,020 | ) |
| Lease liabilities | |
| (68,292 | ) | |
| (72,812 | ) |
| Convertible preferred shares | |
| (451,350 | ) | |
| (431,334 | ) |
| Commercial notes | |
| (61,688 | ) | |
| (73,189 | ) |
| Consideration payable | |
| (49,425 | ) | |
| (48,199 | ) |
| Contingent consideration | |
| (70,127 | ) | |
| (64,370 | ) |
| Retirement plans liabilities | |
| (144,782 | ) | |
| (85,554 | ) |
| Net debt | |
| 867,457 | | |
| 938,450 | |
| (i) | Comprised of liquid and illiquid investments. Liquid investments are current assets that are traded in
an active market. Illiquid investments are comprised of assets that trade infrequently. |
Vinci Partners Investments Ltd.
Notes to the interim consolidated financial statements
All amounts in thousands of reais unless otherwise stated
| | |
Financial liabilities | |
Other assets |
| | |
Payables | |
Loans and obligations | |
Retirement plans | |
Lease liabilities | |
Cash and cash equivalents | |
Financial instruments at fair value through profit or loss |
| Net debt as at December 31, 2022 | |
| (99,275 | ) | |
| (175,290 | ) | |
| - | | |
| (86,211 | ) | |
| 136,581 | | |
| 1,243,764 | |
| | |
| | | |
| | | |
| | | |
| | | |
| | | |
| | |
| Cash flow and dividends provision | |
| (15,477 | ) | |
| 20,864 | | |
| (82,734 | ) | |
| 25,830 | | |
| 522,328 | | |
| (172,629 | ) |
| Fair value adjustment | |
| - | | |
| (28,686 | ) | |
| (2,820 | ) | |
| (2,737 | ) | |
| 1,396 | | |
| 97,220 | |
| Addition and finance expenses accrual | |
| - | | |
| (450,493 | ) | |
| | | |
| - | | |
| - | | |
| - | |
| Foreign exchange adjustments | |
| - | | |
| 16,513 | | |
| | | |
| - | | |
| - | | |
| - | |
| Other changes (i) | |
| - | | |
| - | | |
| | | |
| (9,694 | ) | |
| - | | |
| - | |
| December 31, 2023 | |
| (114,752 | ) | |
| (617,092 | ) | |
| (85,554 | ) | |
| (72,812 | ) | |
| 660,305 | | |
| 1,168,355 | |
| | |
| | | |
| | | |
| | | |
| | | |
| | | |
| | |
| Cash flow and dividends provision | |
| 74,243 | | |
| 20,845 | | |
| (58,000 | ) | |
| 6,764 | | |
| (138,042 | ) | |
| 29,966 | |
| Fair value adjustment | |
| - | | |
| (6,983 | ) | |
| (1,228 | ) | |
| - | | |
| 8,820 | | |
| 23,321 | |
| Addition and finance expenses accrual | |
| - | | |
| (13,784 | ) | |
| - | | |
| (2,216 | ) | |
| - | | |
| - | |
| Foreign exchange adjustments | |
| - | | |
| (15,576 | ) | |
| - | | |
| - | | |
| 905 | | |
| - | |
| Other changes (i) | |
| - | | |
| - | | |
| - | | |
| (28 | ) | |
| - | | |
| - | |
| March 31, 2024 | |
| (40,509 | ) | |
| (632,590 | ) | |
| (144,782 | ) | |
| (68,292 | ) | |
| 531,988 | | |
| 1,221,642 | |
(i) Other changes include non-cash movements, including Cumulative
Translation Adjustments (“CTA”) which are being presented as in other comprehensive income statements.
Maturities of financial liabilities
Except for the retirement plans liabilities, the
tables below analyze the Group's financial liabilities into relevant maturity groupings based on their contractual maturities for significant
financial liabilities.
Contractual maturities of
financial liabilities
at March 31, 2024 | |
Less than 1 year | |
Between 1 and 3 years | |
Over 3 years | |
Total | |
Carrying amount |
| | |
| |
| |
| |
| |
|
| Trade payables | |
| (348 | ) | |
| - | | |
| - | | |
| (348 | ) | |
| (348 | ) |
| Labor and social security obligations | |
| (27,325 | ) | |
| (3,100 | ) | |
| (3,684 | ) | |
| (34,109 | ) | |
| (34,109 | ) |
| Lease liabilities | |
| (25,104 | ) | |
| (28,782 | ) | |
| (33,504 | ) | |
| (87,390 | ) | |
| (68,292 | ) |
| Accounts payable | |
| (6,052 | ) | |
| - | | |
| - | | |
| (6,052 | ) | |
| (6,052 | ) |
| Loans and financing | |
| (116,526 | ) | |
| (153,262 | ) | |
| (821,749 | ) | |
| (1,091,537 | ) | |
| (632,590 | ) |
| Total | |
| (175,355 | ) | |
| (185,144 | ) | |
| (858,937 | ) | |
| (1,219,436 | ) | |
| (741,391 | ) |
Contractual maturities of
financial liabilities
at December 31, 2023 | |
Less than 1 year | |
Between 1 and 3 years | |
Over 3 years | |
Total | |
Carrying amount |
| | |
| |
| |
| |
| |
|
| Trade payables | |
| (1,869 | ) | |
| - | | |
| - | | |
| (1,869 | ) | |
| (1,869 | ) |
| Labor and social security obligations | |
| (101,505 | ) | |
| (2,458 | ) | |
| (2,900 | ) | |
| (106,863 | ) | |
| (106,863 | ) |
| Lease liabilities | |
| (24,381 | ) | |
| (32,786 | ) | |
| (36,017 | ) | |
| (93,184 | ) | |
| (72,812 | ) |
| Accounts payable | |
| (6,020 | ) | |
| - | | |
| - | | |
| (6,020 | ) | |
| (6,020 | ) |
| Loans and financing | |
| (114,390 | ) | |
| (182,178 | ) | |
| (783,572 | ) | |
| (1,080,140 | ) | |
| (617,092 | ) |
| Total | |
| (248,165 | ) | |
| (217,422 | ) | |
| (822,489 | ) | |
| (1,288,076 | ) | |
| (804,656 | ) |
Vinci Partners Investments Ltd.
Notes to the interim consolidated financial statements
All amounts in thousands of reais unless otherwise stated
The Group monitors and evaluates the market risk
related to its financial investments portfolio periodically to assess its volatility, through changes that can significantly impact its
financial results. Considering a period of one day and the historical results over the past year, the following Value at Risk (VAR) parameters
were used:
| ● | 0.21% (or R$ 3.1 million) of the financial investment portfolio for a confidence interval of 95% on March
31, 2024 (0.26% or R$ 3.2 million on December 31, 2023). |
| ● | 0.36% (or R$ 5.2 million) of the financial investment portfolio for a confidence interval of 99% on March
31, 2024 (0.53% or R$ 6.8 million on December 31, 2023). |
Additionally, the Group evaluated the financial
investment portfolio on March 31, 2024 and December 31, 2023, through stress scenarios according to the main risk factors related to its
investments, as presented in the table below:
| | |
| |
| |
Financial Impact (**) |
| Risk Factor | |
Variation in | |
| Stress Scenario (*) | | |
| 03/31/2024 | | |
| 12/31/2023 | |
| Current inflation | |
Inflation index | |
| -100 | bps | |
| 11.9 | | |
| 12.3 | |
| Exchange traded real estate funds | |
Share prices | |
| -10 | % | |
| (21.9 | ) | |
| (14.4 | ) |
| Brazilian stock prices | |
Share prices | |
| -10 | % | |
| (5.4 | ) | |
| (9.3 | ) |
| Fixed-rate offshore rates | |
US yield curve | |
| -100 | bps | |
| (44.4 | ) | |
| (34.9 | ) |
| Foreign exchange rate | |
Foreign exchange rates | |
| 10 | %(***) | |
| (0.9 | ) | |
| (0.4 | ) |
| Domestic base overnight rate | |
Domestic base overnight rate | |
| -100 | bps | |
| (4.3 | ) | |
| (6.0 | ) |
(*) bps - basis point (1bps = 0,01%)
(**) In millions of Brazilian reais
(***) Brazilian reais devaluation against US Dollars
An equal change in the opposite direction of the stress scenario would
have affected the financial investment portfolio by a similar amount, on the basis that all other variables remain constant.
This note provides information about the group's
financial instruments, including:
| - | an overview of all financial instruments held by the Group |
| - | specific information about each type of financial instrument |
| - | information about determining the fair value of the instruments,
including judgements and estimation uncertainty involved. |
The Group classifies its financial assets in the
following measurement categories:
| ● | those measured at fair value or through profit or loss, and |
| ● | those measured at amortized cost. |
The classification depends on the entity's business
model for managing the financial assets and the contractual terms of the cash flows.
Vinci Partners Investments Ltd.
Notes to the interim consolidated financial statements
All amounts in thousands of reais unless otherwise stated
For
assets measured at fair value, gains and losses will be recorded in profit or loss.
Recognition
and derecognition
Regular
way purchases and sales of financial assets are recognized on trade date, being the date on which the group commits to purchase or sell
the asset. Financial assets are derecognized when the rights to receive cash flows from the financial assets have expired or have been
transferred and the group has transferred substantially all the risks and rewards of ownership.
Measurement
At
initial recognition, the group measures a financial asset at its fair value plus, in the case of a financial asset not at fair value
through profit or loss (FVPL), transaction costs that are directly attributable to the acquisition of the financial asset. Transaction
costs of financial assets carried at FVPL are expensed in profit or loss.
The Group holds the following
financial instruments:
| Financial assets | |
Section | |
03/31/2024 | |
12/31/2023 |
| | |
| |
| |
|
| Accounts receivable | |
| (a) | | |
| 106,113 | | |
| 118,161 | |
| Other financial assets at amortized cost | |
| (b) | | |
| 5,564 | | |
| 5,519 | |
| Cash and cash equivalents | |
| (c) | | |
| 531,988 | | |
| 660,305 | |
| Financial assets at fair value through profit or loss (FVPL) | |
| (d) | | |
| 1,279,607 | | |
| 1,175,501 | |
| | |
| | | |
| 1,923,272 | | |
| 1,959,486 | |
| | |
| | | |
| | | |
| | |
| Financial liabilities | |
| | | |
| | | |
| | |
| | |
| | | |
| | | |
| | |
| Liabilities at amortized cost | |
| (e) | | |
| 40,509 | | |
| 114,752 | |
| Lease liabilities | |
| (e) | | |
| 68,292 | | |
| 72,812 | |
| Loans and financing | |
| (e) | | |
| 632,590 | | |
| 617,091 | |
| | |
| | | |
| 741,391 | | |
| 804,655 | |
The Group's exposure to risks associated with
the financial instruments is discussed in Note 4. The maximum exposure to credit risk at the end of the reporting period is the carrying
amount of each class of financial assets mentioned above.
| Current assets | |
03/31/2024 | |
12/31/2023 |
| Accounts receivable from contracts with customers | |
| 89,851 | | |
| 101,673 | |
| Loss allowance | |
| (150 | ) | |
| (150 | ) |
| | |
| | | |
| | |
| Non-current assets | |
| | | |
| | |
| Accounts receivable from contracts with customers | |
| 16,412 | | |
| 16,638 | |
| | |
| 106,113 | | |
| 118,161 | |
Accounts receivables are recognized initially
at the amount of consideration that is unconditional and are not submitted to any financial components. They are subsequently measured
at amortized cost, less loss allowance.
Current accounts receivable are amounts due from
customers for services performed in the ordinary course of business. They are generally due for settlement within 30 days and are therefore
classified as current in its entirety. Due to the short-term nature of the current receivables, their carrying amount is considered to
be the same as their fair value.
Vinci Partners Investments Ltd.
Notes to the interim consolidated financial statements
All amounts in thousands of reais unless otherwise stated
Non-current accounts receivable comprised by unrealized
performance fees and other receivables. Unrealized performance fees are recognized when the management, with accumulated experience, estimate
that it is highly probable that a significant reversal will not occur. Vinci expects the unrealized performance fees will be received
during 2024. However, since its realization is subject to uncertainty, the balance is presented as a non-current receivable.
Monthly, the Entity evaluates the revenues and
receipts for each customer (Funds). Additionally, on quarterly basis Vinci analyzes the outstanding balances to calculate expected credit
losses and the exposure to credit risk from receivables are reviewed. Accounts receivable allowance for expected credit losses are presented
in general and administrative expense.
The loss allowances for accounts receivable as
of March 31, 2024 and December 31, 2023 reconcile to the opening loss allowances as follows:
| | |
03/31/2024 | |
12/31/2023 |
| Opening loss allowance on January 1 | |
| (150 | ) | |
| (166 | ) |
| Decrease in accounts receivable allowance recognized in profit or loss | |
| - | | |
| 16 | |
| Closing loss allowance on December 31 | |
| (150 | ) | |
| (150 | ) |
Accounts receivables are written off when there
is no reasonable expectation of recovery. Indicators that there is no reasonable expectation of recovery include, among others, the failure
of a debtor to engage in a repayment plan with the group, and a failure to make contractual payments. The Entity has not written any amount
of accounts receivable during 2024 and 2023. Subsequent recoveries of amounts previously written off are credited against the same line
item.
| b) | Other financial assets at amortized cost |
Financial assets at amortized cost refer to the
following debt instruments:
| | |
03/31/2024 | |
12/31/2023 |
| | |
| | | |
| | |
| Employees loans (Note 6 (i)) | |
| 5,564 | | |
| 5,519 | |
These amounts generally arise from transactions
outside the usual operating activities of the group. Interest may be charged at commercial rates and collateral is not normally obtained.
All the financial assets at amortized cost are
denominated in Brazilian currency units. As a result, there is no exposure to foreign currency risk. There is also no exposure to price
risk as the investments will be held to maturity.
See note 6 for more details.
| c) | Cash and cash equivalents |
| | |
12/31/2023 | |
12/31/2022 |
| | |
| |
|
| Cash and bank deposits | |
| 45,738 | | |
| 15,896 | |
| Financial instruments at fair value through profit or loss (i) | |
| 85,649 | | |
| 173,300 | |
| Financial instruments at amortized cost (ii) | |
| 400,601 | | |
| 471,109 | |
| | |
| 531,988 | | |
| 660,305 | |
For the purpose of presentation in the statement
of cash flows, cash and cash equivalents includes cash on hand, bank deposits held at financial institutions, and highly liquid investments
with original maturities of three months or less that are readily convertible to known amounts of cash and which are subject to an insignificant
risk of changes in value.
Vinci Partners Investments Ltd.
Notes to the interim consolidated financial statements
All amounts in thousands of reais unless otherwise stated
(i) Comprises certificates of deposits issued
by Banco Bradesco (credit rating AAA evaluated by Fitch Ratings) with an interest rate of 100.5% of CDI (interbank deposit rate). The
certificates are readily convertible to known amounts of cash and which are subject to an insignificant risk of changes in value.
| (ii) | Comprised of US Treasury Bills with maturity date in June 2024. |
| d) | Financial assets at fair value through profit or loss |
The group classifies the following financial assets
at fair value through profit or loss (FVPL):
Financial assets measured at FVPL include the following categories:
| | |
03/31/2024 | |
12/31/2023 |
| | |
| |
|
| Current assets | |
| 1,221,642 | | |
| 1,168,355 | |
| Mutual funds (i) | |
| 1,221,642 | | |
| 1,168,355 | |
| | |
| | | |
| | |
| Non-current assets | |
| 57,965 | | |
| 7,146 | |
| Private markets funds (ii) | |
| 22,945 | | |
| 7,146 | |
| Real Estate Investments (iii) | |
| 35,020 | | |
| - | |
The following table demonstrate the funds invested included in each
category mentioned above.
| (i) Mutual funds | |
| |
|
| | |
03/31/2024 | |
12/31/2023 |
| | |
| |
|
| Vinci Monalisa FIM Crédito Privado IE (3) | |
| 1,011,775 | | |
| 991,470 | |
| Vinci Multiestratégia FIM | |
| 11,676 | | |
| 11,642 | |
| Vinci International Master Portfolio SPC - Reflation SP | |
| - | | |
| 606 | |
| Vinci Institucional FI RF Referenciado DI | |
| 46,853 | | |
| 62,687 | |
| Vinci Reservas Técnicas FI RF DI | |
| 2,256 | | |
| 2,199 | |
| Retirement services investment funds (1) | |
| 144,782 | | |
| 85,554 | |
| FI Vinci Renda Fixa CP | |
| 4,300 | | |
| 14,197 | |
| | |
| 1,221,642 | | |
| 1,168,355 | |
| (1) | These funds refer to the financial products as part of the Company's retirement plans services. See Note
15 for further information. |
| (2) | Vinci US RE Corporation holds investments in real estate properties. |
| (3) | Vinci Monalisa FIM Crédito Privado IE (“Vinci Monalisa”) is a mutual fund incorporated
in Brazil and wholly owned by the Company. Vinci Monalisa’s balances are the following: |
| | |
03/31/2024 | |
12/31/2023 |
| Net Asset Value | |
| 1,011,775 | | |
| 991,470 | |
| Real estate funds | |
| 240,604 | | |
| 234,245 | |
| Mutual funds | |
| 531,235 | | |
| 535,430 | |
| Private equity funds | |
| 147,902 | | |
| 136,810 | |
| Other assets/liabilities | |
| 92,034 | | |
| 84,985 | |
Vinci Partners Investments Ltd.
Notes to the interim consolidated financial statements
All amounts in thousands of reais unless otherwise stated
The Vinci Monalisa’s portfolio is comprised
of liquid and illiquid investee funds with different redemption criteria. Over 74% of its investments are liquid and may be redeemed and
26% are non-redeemable investments. The following tables demonstrate the funds invested by Vinci Monalisa:
Mutual funds
Vinci Monalisa holds investments in several mutual
funds to seek profitability through investments in various classes of financial assets such as fixed income assets, Brazilian government
bonds, public equities, derivatives financial instruments, investment funds and other short-term liquid securities. As of March 31, 2024
and December 31, 2023, Vinci Monalisa holds R$ 531,235 and R$ 535,430 of investments in mutual funds, respectively, which are distributed
in the following classification:
| | |
03/31/2024 | |
12/31/2023 |
| Mutual Funds’ classification | |
| | | |
| | |
| Interest and foreign exchange (a) | |
| 86.07 | % | |
| 84.93 | % |
| Foreign investments (b) | |
| 4.91 | % | |
| 4.56 | % |
| Macro (c) | |
| 4.13 | % | |
| 3.96 | % |
| Specific strategy (d) | |
| 4.89 | % | |
| 6.55 | % |
| | |
| 100.00 | % | |
| 100.00 | % |
| (a) | Funds that seek long-term returns via investments in fixed-income assets, admitting strategies that imply interest risk, price index
risk and foreign currency risk. |
| (b) | Funds that invest in financial assets abroad in a portion greater than 40% of their net asset values. |
| (c) | Funds that operate in various asset classes (fixed income, variable income, foreign exchange, etc.), with investment strategies based
on medium and long-term macroeconomic scenarios. |
| (d) | Funds that adopt an investment strategy that involves specific risks, such as commodities, futures of index, etc. |
| Real Estate funds | |
| |
|
| | |
03/31/2024 | |
12/31/2023 |
| | |
| |
|
| Vinci Credit Securities FII (a) | |
| 71,884 | | |
| 70,049 | |
| Vinci Imóveis Urbanos FII (b) | |
| 51,460 | | |
| 53,884 | |
| Vinci Offices FII (c) | |
| 35,229 | | |
| 34,639 | |
| Vinci Fulwood DL FII (d) | |
| 59,158 | | |
| 52,849 | |
| Other real estate funds (e) | |
| 22,873 | | |
| 22,824 | |
| | |
| 240,604 | | |
| 234,245 | |
(a) The fund invests in real
estate receivable certificates, bonds and other real estate assets;
(b) The fund’s investment
strategy is to acquire properties in the retail, general markets, health and education sectors located in large urban centers that, in
the Manager's view, generate long-term value;
(c) The fund invests in controlling
corporate buildings, mostly leased, which, in the Manager's view, generate value for the properties.
(d) The fund’s strategy
is to provide its shareholders with profitability resulting from the sale of properties, as well as the eventual commercial exploitation
of properties. The Fund may carry out renovations or improvements to properties with the aim of enhancing the returns arising from their
commercial exploitation or eventual commercialization.
(e) Comprised of funds that
allocate their capital in diversified portfolios of shares of real estate funds, real estate receivable certificates, bonds, securities
and other real estate assets.
| Private markets funds | |
| |
|
| | |
03/31/2024 | |
12/31/2023 |
| | |
| |
|
| Vinci Infra Água e Saneamento Strategy FIP – Infraestrutura (a) | |
| 50,740 | | |
| 50,698 | |
| Vinci Crédito Infra Institucional Fundo Incentivado – Infraestrutura (b) | |
| 47,395 | | |
| 46,844 | |
| Vinci Infra Coinvestimento I FIP - Infraestrutura (c) | |
| 10,323 | | |
| 10,290 | |
| Vinci Impacto Ret IV FIP Multiestratégia | |
| 4,851 | | |
| 4,687 | |
| Other funds | |
| 34,593 | | |
| 24,291 | |
| Total private markets funds | |
| 147,902 | | |
| 136,810 | |
| | |
| | | |
| | |
Vinci Partners Investments Ltd.
Notes to the interim consolidated financial statements
All amounts in thousands of reais unless otherwise stated
(a) The Fund's investment policy is the acquisition
of shares, subscription bonuses, debentures convertible or not into shares, or other securities, convertible or exchangeable into shares
issued by companies, publicly or privately held in the water sector and basic sanitation.
(b) The Fund aims to increase the value of its
shares through the subscription or acquisition, on the primary or secondary market, predominantly of debentures issued by privately held
companies, for the purpose of raising funds to implement projects relating to the implementation, expansion, maintenance, recovery, adaptation,
or modernization of infrastructure projects.
(c) Fund focused on the acquisition of shares,
share bonuses subscriptions, debentures convertible or not into shares, or other securities issued by publicly held, publicly traded or
private corporations that develop new projects of infrastructure in the development sector and operations of electric power transmission
lines, participating in the decision-making process of the investee, with effective influence. As of March 31, 2024 and December 31, 2023,
the fund held investment in Água Vermelha Transmissora de Energia S.A.
| (ii) Private markets | |
| |
|
| | |
03/31/2024 | |
12/31/2023 |
| | |
| |
|
| Vinci Capital Partners III Feeder FIP Multiestratégia | |
| 4,251 | | |
| 4,262 | |
| Nordeste III FIP Multiestratégia | |
| 3,395 | | |
| 2,884 | |
| Fundo Garantidor de Infraestrutura – FGIE – Class A | |
| 3,047 | | |
| - | |
| Fundo Garantidor de Infraestrutura – FGIE – Class B | |
| 12,252 | | |
| - | |
| Total Private markets | |
| 22,945 | | |
| 7,146 | |
| (iii) Real Estate Investments | |
| |
|
| | |
03/31/2024 | |
12/31/2023 |
| | |
| |
|
| Vinci US RE Corporation (a) | |
| 35,020 | | |
| - | |
| Total Real Estate Investments | |
| 35,020 | | |
| - | |
| (a) | In March 2024, Vinci invested in several properties through its subsidiary Vinci US RE Corporation. The
investments are intended to develop real estate properties for capital appreciation through income or sale of the respective properties. |
During the year, the following gains were recognized in profit or loss:
| | |
|
| | |
| 03/31/2024 | | |
| 03/31/2023 | |
| | |
| | | |
| | |
| Fair value gains on investments at FVPL recognized in finance income | |
| 25,871 | | |
| (111 | ) |
Vinci Partners Investments Ltd.
Notes to the interim consolidated financial statements
All amounts in thousands of reais unless otherwise stated
| | |
03/31/2024 | |
12/31/2023 |
| | |
| |
|
| Current | |
| 136,967 | | |
| 210,498 | |
| Trade payables | |
| 348 | | |
| 1,869 | |
| Labor and social security obligations (Note 12) | |
| 27,325 | | |
| 101,506 | |
| Loans and obligations (Note 14) | |
| 78,138 | | |
| 76,722 | |
| Lease liabilities | |
| 25,104 | | |
| 24,381 | |
| Accounts payable (Note 11) | |
| 6,052 | | |
| 6,020 | |
| | |
| | | |
| | |
| Non-current | |
| 604,424 | | |
| 594,157 | |
| Lease liabilities | |
| 43,188 | | |
| 48,431 | |
| Labor and social security obligations (Note 12) | |
| 6,784 | | |
| 5,357 | |
| Loans and obligations (Note 14) | |
| 554,452 | | |
| 540,369 | |
| | |
| | | |
| | |
| | |
| 741,391 | | |
| 804,655 | |
Fair value hierarchy
This section explains the judgments and estimates
made in determining the fair values of the financial instruments that are recognized and measured at fair value through profit or loss
in the financial statements. To provide an indication about the reliability of the inputs used in determining fair value, the group has
classified its financial instruments into the three levels prescribed under the accounting standards. An explanation of each level follows
underneath the table.
| | |
On March 31, 2024 |
| Recurring fair value measurements | |
Level 1 | |
Level 2 | |
Level 3 | |
Total |
| Financial Assets | |
| | | |
| | | |
| | | |
| | |
| Certificate of deposits | |
| - | | |
| 85,649 | | |
| - | | |
| 85,649 | |
| Mutual funds | |
| - | | |
| 1,221,642 | | |
| - | | |
| 1,221,642 | |
| Private equity funds | |
| - | | |
| - | | |
| 22,945 | | |
| 22,945 | |
| Real Estate Investments | |
| - | | |
| - | | |
| 35,020 | | |
| 35,020 | |
| Total Financial Assets | |
| - | | |
| 1,307,291 | | |
| 57,965 | | |
| 1,365,256 | |
| | |
On December 31, 2023 |
| Recurring fair value measurements | |
Level 1 | |
Level 2 | |
Level 3 | |
Total |
| Financial Assets | |
| | | |
| | | |
| | | |
| | |
| Certificate of deposits | |
| - | | |
| 173,300 | | |
| - | | |
| 173,300 | |
| Mutual funds | |
| - | | |
| 1,168,355 | | |
| - | | |
| 1,168,355 | |
| Private equity funds | |
| - | | |
| - | | |
| 7,146 | | |
| 7,146 | |
| Total Financial Assets | |
| - | | |
| 1,341,655 | | |
| 7,146 | | |
| 1,348,801 | |
Level 1: The fair value of financial instruments traded in active markets
(such as publicly traded real estate funds) is based on quoted market prices at the end of the reporting period. The quoted market price
used for financial assets held by the group is the current bid price. These instruments are included in level 1.
Level 2: The fair value of financial instruments that are not traded
in an active market is determined using valuation techniques which maximize the use of observable market data and rely as little as possible
on entity-specific estimates. If all significant inputs required to fair value an instrument are observable, the instrument is included
in level 2.
Vinci Monalisa is a financial instrument classified as level 2. Its
portfolio is comprised of items that could be classified as level 1, level 2 and level 3, in the amount of R$ 151,526, R$ 538,514 and
R$ 229,701, respectively (2023: R$ 151,645, R$ 542,358 and R$ 212,482, respectively).
Level 3: If one or more of the significant inputs is not based on observable
market data, the instrument is included in level 3. This is the case for unlisted equity securities.
Vinci Partners Investments Ltd.
Notes to the interim consolidated financial statements
All amounts in thousands of reais unless otherwise stated
Valuation techniques used to determine fair values
Specific valuation techniques used to value financial instruments include:
| - | the use of quoted market prices |
| - | for level 3 financial instruments – discounted cash flow
analysis. |
All non-listed assets fair value estimates are included in level 2,
except for private equity funds, where the fair values have been determined based on fair value appraisals for fund's investments, performed
by the fund's management (Vinci Capital and Vinci Infra) or a third party hired by the Fund’s Administrator. The most part of the
level 3 financial instruments evaluation uses discount cash flows techniques to evaluate the fair value of the Fund's investments. The
appraisals performed by a third party are reviewed by Vinci or its subsidiaries (fund's management).
Fair value measurements using significant unobservable inputs (level
3)
The following table presents the changes in level 3 items for the period/year
ended March 31, 2024 and December 31, 2023:
| | |
Fair Value |
| Opening balance January 1, 2023 | |
| 5,985 | |
| Capital deployment | |
| 947 | |
| Sales and distributions | |
| (247 | ) |
| Gain recognized in finance income | |
| 461 | |
| Closing balance December 31, 2023 | |
| 7,146 | |
| Capital deployment | |
| 49,788 | |
| Sales and distributions | |
| (31 | ) |
| Gain recognized in finance income | |
| 1,062 | |
| Closing balance March 31, 2024 | |
| 57,965 | |
Vinci Partners Investments Ltd.
Notes to the interim consolidated financial statements
All amounts in thousands of reais unless otherwise stated
| | |
03/31/2024 | |
12/31/2023 |
| | |
| |
|
| Employees loans (i) | |
| 5,564 | | |
| 5,519 | |
| Sundry advances | |
| 188 | | |
| 152 | |
| Advances to projects in progress (ii) | |
| 18,787 | | |
| 12,771 | |
| Other prepayments | |
| 320 | | |
| 319 | |
| Related parties’ receivables (iii) | |
| 4 | | |
| 4 | |
| Guarantee deposits (iv) | |
| 511 | | |
| 494 | |
| Receivables from employees (v) | |
| 18,946 | | |
| 18,820 | |
| Sublease receivables | |
| 224 | | |
| 224 | |
| Others | |
| 181 | | |
| 233 | |
| | |
| | | |
| | |
| | |
| 44,725 | | |
| 38,536 | |
| | |
| | | |
| | |
| Current | |
| 25,169 | | |
| 19,109 | |
| Non-current | |
| 19,556 | | |
| 19,427 | |
| | |
| 44,725 | | |
| 38,536 | |
| (i) | Refers to amounts receivable from employees. |
| (ii) | Refers to costs incurred by projects related to funds administered by Vinci, that are initially paid by
the Group and subsequently reimbursed. |
| (iii) | Refers to an intercompany transaction. See Note 21 (b) for more details. |
| (iv) | Refers to the security deposit of a lease. |
| (v) | Refers to an intercompany transaction. See Note 21 (d) for more details. |
Vinci Partners Investments Ltd.
Notes to the interim consolidated financial statements
All amounts in thousands of reais unless otherwise stated
Compass Business Combination
On March 07, 2024, Vinci announced an agreement
for a combination with Compass. Once closed, the transaction will create a full-service Latin American alternative asset manager with
more than US$50 billion in assets under management, across private markets, investment products and solutions, public equities, and corporate
advisory segments. Founded in 1995, Compass is a leading independent asset manager and investment advisory firm in Latin America, currently
present in seven countries in Latin America, the United States and United Kingdom.
The transaction will have a total upfront consideration
of 11,783,384 shares of VINP Class A common stock, and a cash consideration of US$31.3 million, in the form of VINP Class C redeemable
common stock. Under the agreement, Compass partners are entitled to an earn-out of up to an additional 7.5% stake in the combined entity,
subject to the achievement of pre-determined metrics, to be paid in VINP Class A common stock until 2028.
The transaction is expected to close in the third quarter of 2024,
subject to regulatory approvals and other customary closing conditions.
| (b) | Non-controlling interests (NCI) |
Set out below is summarized financial information for each subsidiary
that has non-controlling interests. The amounts disclosed for each subsidiary are before inter-company eliminations.
| | |
Vinci Asset Allocation | |
Vinci Holding Securitária | |
Total |
| Summarized Balance Sheet | |
| 03/31/2024 | | |
| 12/31/2023 | | |
| 03/31/2024 | | |
| 12/31/2023 | | |
| 03/31/2024 | | |
| 12/31/2023 | |
| | |
| | | |
| | | |
| | | |
| | | |
| | | |
| | |
| Current assets | |
| 198 | | |
| 232 | | |
| 164,064 | | |
| 100,873 | | |
| 164,262 | | |
| 101,105 | |
| Current liabilities | |
| (156 | ) | |
| (707 | ) | |
| (958 | ) | |
| (2,816 | ) | |
| (1,114 | ) | |
| (3,523 | ) |
| Current net assets | |
| 42 | | |
| (475 | ) | |
| 163,106 | | |
| 98,057 | | |
| 163,148 | | |
| 97,582 | |
| | |
| | | |
| | | |
| | | |
| | | |
| | | |
| | |
| Non-current assets | |
| 601 | | |
| 601 | | |
| 15,432 | | |
| 13,549 | | |
| 16,033 | | |
| 14,150 | |
| Non-current liabilities | |
| (2,250 | ) | |
| (1,550 | ) | |
| (166,425 | ) | |
| (96,805 | ) | |
| (168,675 | ) | |
| (98,355 | ) |
| Non-current net assets | |
| (1,649 | ) | |
| (949 | ) | |
| (150,993 | ) | |
| (83,256 | ) | |
| (152,642 | ) | |
| (84,205 | ) |
| | |
| | | |
| | | |
| | | |
| | | |
| | | |
| | |
| Net assets | |
| (1,607 | ) | |
| (1,424 | ) | |
| 12,113 | | |
| 14,801 | | |
| 10,506 | | |
| 13,377 | |
| | |
| | | |
| | | |
| | | |
| | | |
| | | |
| | |
| Accumulated NCI | |
| (402 | ) | |
| (356 | ) | |
| 1,817 | | |
| 2,220 | | |
| 1,415 | | |
| 1,864 | |
Vinci Partners Investments Ltd.
Notes to the interim consolidated financial statements
All amounts in thousands of reais unless otherwise stated
| |
Vinci Asset Allocation | |
Vinci Holding Securitária | |
Total |
| Summarized statement of comprehensive income | |
03/31/2024 | |
03/31/2023 | |
03/31/2024 | |
03/31/2023 | |
03/31/2024 | |
03/31/2023 |
| | |
| |
| |
| |
| |
| |
|
| Revenue | |
| 83 | | |
| - | | |
| 75 | | |
| - | | |
| 158 | | |
| - | |
| | |
| | | |
| | | |
| | | |
| | | |
| | | |
| | |
| Profit for the period | |
| (183 | ) | |
| (185 | ) | |
| (2,688 | ) | |
| 103 | | |
| (2,871 | ) | |
| (82 | ) |
| | |
| | | |
| | | |
| | | |
| | | |
| | | |
| | |
| Total comprehensive income | |
| (183 | ) | |
| (185 | ) | |
| (2,688 | ) | |
| 103 | | |
| (2,871 | ) | |
| (82 | ) |
| | |
| | | |
| | | |
| | | |
| | | |
| | | |
| | |
| Profit/(loss) allocated to NCI | |
| (46 | ) | |
| (46 | ) | |
| (403 | ) | |
| 15 | | |
| (449 | ) | |
| (31 | ) |
Vinci Partners Investments Ltd.
Notes to the interim consolidated financial statements
All amounts in thousands of reais unless otherwise stated
| | |
| |
| |
| |
| |
| |
03/31/2024 |
| | |
Furniture and fittings stuffs | |
Improvements in properties of third parties | |
Computers and peripherals - improvements | |
Equipment and tools | |
Work of arts and others | |
Total |
| | |
| |
| |
| |
| |
| |
|
| Cost | |
| | | |
| | | |
| | | |
| | | |
| | | |
| | |
| At January 1, 2024 | |
| 12,858 | | |
| 48,963 | | |
| 7,634 | | |
| 10,325 | | |
| 791 | | |
| 80,571 | |
| Acquisitions, net of disposals | |
| 37 | | |
| 237 | | |
| 141 | | |
| 25 | | |
| - | | |
| 440 | |
| Foreign Exchange variations of property and equipment abroad | |
| - | | |
| 590 | | |
| - | | |
| 169 | | |
| - | | |
| 759 | |
| | |
| | | |
| | | |
| | | |
| | | |
| | | |
| | |
| At March 31, 2024 | |
| 12,895 | | |
| 49,790 | | |
| 7,775 | | |
| 10,519 | | |
| 791 | | |
| 81,770 | |
| | |
| | | |
| | | |
| | | |
| | | |
| | | |
| | |
| Accumulated depreciation | |
| | | |
| | | |
| | | |
| | | |
| | | |
| | |
| At January 1, 2024 | |
| (9,303 | ) | |
| (43,205 | ) | |
| (6,128 | ) | |
| (9,344 | ) | |
| - | | |
| (67,980 | ) |
| Depreciation | |
| (220 | ) | |
| (708 | ) | |
| (117 | ) | |
| (66 | ) | |
| - | | |
| (1,111 | ) |
| Foreign Exchange variations of property and equipment abroad | |
| - | | |
| (590 | ) | |
| - | | |
| (165 | ) | |
| - | | |
| (755 | ) |
| | |
| | | |
| | | |
| | | |
| | | |
| | | |
| | |
| At March 31, 2024 | |
| (9,524 | ) | |
| (44,503 | ) | |
| (6,245 | ) | |
| (9,575 | ) | |
| - | | |
| (69,846 | ) |
| | |
| | | |
| | | |
| | | |
| | | |
| | | |
| | |
| Net book value | |
| | | |
| | | |
| | | |
| | | |
| | | |
| | |
| At January 1, 2024 | |
| 3,555 | | |
| 5,758 | | |
| 1,506 | | |
| 981 | | |
| 791 | | |
| 12,591 | |
| | |
| | | |
| | | |
| | | |
| | | |
| | | |
| | |
| At March 31, 2024 | |
| 3,371 | | |
| 5,287 | | |
| 1,530 | | |
| 944 | | |
| 791 | | |
| 11,924 | |
| | |
| | | |
| | | |
| | | |
| | | |
| | | |
| | |
| Annual depreciation rate - % | |
| 10 | | |
| From 10 to 20 | | |
| 20 | | |
| 10 | | |
| - | | |
| - | |
Vinci Partners Investments Ltd.
Notes to the interim consolidated financial statements
All amounts in thousands of reais unless otherwise stated
| | |
| |
| |
| |
| |
| |
12/31/2023 |
| | |
Furniture and fittings stuffs | |
Improvements in properties of third parties | |
Computers and peripherals - improvements | |
Equipaments and tools | |
Work of arts and others | |
Total |
| Cost | |
| | | |
| | | |
| | | |
| | | |
| | | |
| | |
| At January 1, 2023 | |
| 11,782 | | |
| 47,824 | | |
| 7,113 | | |
| 10,241 | | |
| 873 | | |
| 77,833 | |
| Acquisitions | |
| 1,076 | | |
| 2,574 | | |
| 521 | | |
| 496 | | |
| (82 | ) | |
| 4,585 | |
| Foreign Exchange variations of property and equipment abroad | |
| - | | |
| (1,435 | ) | |
| - | | |
| (412 | ) | |
| - | | |
| (1,847 | ) |
| | |
| | | |
| | | |
| | | |
| | | |
| | | |
| | |
| At December 31, 2023 | |
| 12,858 | | |
| 48,963 | | |
| 7,634 | | |
| 10,325 | | |
| 791 | | |
| 80,571 | |
| | |
| | | |
| | | |
| | | |
| | | |
| | | |
| | |
| Accumulated depreciation | |
| | | |
| | | |
| | | |
| | | |
| | | |
| | |
| At January 1, 2023 | |
| (8,473 | ) | |
| (42,188 | ) | |
| (5,707 | ) | |
| (9,514 | ) | |
| - | | |
| (65,882 | ) |
| Depreciation | |
| (830 | ) | |
| (2,447 | ) | |
| (421 | ) | |
| (229 | ) | |
| - | | |
| (3,927 | ) |
| Foreign Exchange variations of property and equipment abroad | |
| | | |
| 1,430 | | |
| - | | |
| 399 | | |
| - | | |
| 1,829 | |
| | |
| | | |
| | | |
| | | |
| | | |
| | | |
| | |
| At December 31, 2023 | |
| (9,303 | ) | |
| (43,205 | ) | |
| (6,128 | ) | |
| (9,344 | ) | |
| - | | |
| (67,980 | ) |
| | |
| | | |
| | | |
| | | |
| | | |
| | | |
| | |
| Net book value | |
| | | |
| | | |
| | | |
| | | |
| | | |
| | |
| At January 1, 2023 | |
| 3,309 | | |
| 5,636 | | |
| 1,406 | | |
| 727 | | |
| 873 | | |
| 11,951 | |
| | |
| | | |
| | | |
| | | |
| | | |
| | | |
| | |
| At December 31, 2023 | |
| 3,555 | | |
| 5,758 | | |
| 1,506 | | |
| 981 | | |
| 791 | | |
| 12,591 | |
| | |
| | | |
| | | |
| | | |
| | | |
| | | |
| | |
| Annual depreciation rate - % | |
| 10 | | |
| From 10 to 20 | | |
| 20 | | |
| 10 | | |
| | | |
| | |
Vinci Partners Investments Ltd.
Notes to the interim consolidated financial statements
All amounts in thousands of reais unless otherwise stated
Intangible assets include expenditures with the
development of the software, placement agent, management contracts and the goodwill generated by the acquisition of SPS.
The software development comprises mainly the
following assets:
| - | Products for Risk System and Portfolio Allocation, whose purpose is to evaluate the risk of the funds
and to allocate the clients' portfolio; and |
| - | Systems and applications which are being developed to support retirement services applications. |
The Entity assesses at each reporting date whether
there is an indication that an intangible asset may be impaired, If any indication exists, the Entity estimates the asset's recoverable
amount. There were no indications of impairment of intangible assets for the year ended March 31, 2024 and December 31, 2023.
| | |
| | | |
| | | |
| | | |
| 03/31/2024 | |
| | |
| Software development | | |
| Placement Agent (a) | | |
| Goodwill (b) | | |
| Management Contracts (c) | | |
| Total | |
| | |
| | | |
| | | |
| | | |
| | | |
| | |
| Cost | |
| | | |
| | | |
| | | |
| | | |
| | |
| At January 1, 2024 | |
| 40,333 | | |
| 20,722 | | |
| 162,290 | | |
| 22,049 | | |
| 245,394 | |
| Additions | |
| 2,779 | | |
| 83 | | |
| - | | |
| - | | |
| 2,862 | |
| Foreign exchange variation of intangible assets abroad | |
| 246 | | |
| 50 | | |
| - | | |
| - | | |
| 296 | |
| | |
| | | |
| | | |
| | | |
| | | |
| | |
| At March 31, 2024 | |
| 43,358 | | |
| 20,855 | | |
| 162,290 | | |
| 22,049 | | |
| 248,552 | |
| | |
| | | |
| | | |
| | | |
| | | |
| | |
| Accumulated amortization | |
| | | |
| | | |
| | | |
| | | |
| | |
| At January 1, 2024 | |
| (24,686 | ) | |
| (1,896 | ) | |
| - | | |
| (4,064 | ) | |
| (30,646 | ) |
| Amortization | |
| (824 | ) | |
| (526 | ) | |
| - | | |
| (762 | ) | |
| (2,112 | ) |
| Foreign exchange variation of intangible assets abroad | |
| (237 | ) | |
| (30 | ) | |
| - | | |
| - | | |
| (267 | ) |
| | |
| | | |
| | | |
| | | |
| | | |
| | |
| At March 31, 2024 | |
| (25,747 | ) | |
| (2,452 | ) | |
| - | | |
| (4,826 | ) | |
| (33,025 | ) |
| | |
| | | |
| | | |
| | | |
| | | |
| | |
| At January 1, 2024 | |
| 15,647 | | |
| 18,826 | | |
| 162,290 | | |
| 17,985 | | |
| 214,748 | |
| | |
| | | |
| | | |
| | | |
| | | |
| | |
| At March 31, 2024 | |
| 17,611 | | |
| 18,403 | | |
| 162,290 | | |
| 17.223 | | |
| 215,527 | |
| | |
| | | |
| | | |
| | | |
| | | |
| | |
| Amortization rate (per year) - % | |
| 20 | % | |
| (a) | | |
| (b) | | |
| (c) | | |
| - | |
| | |
| | | |
| | | |
| | | |
| | | |
| | |
Vinci Partners Investments Ltd.
Notes to the interim consolidated financial statements
All amounts in thousands of reais unless otherwise stated
(a) Refers to amounts capitalized relating to
agreements with investments placement agents relating to funds raised from investors in funds managed by the Group. These amounts are
amortized based on the estimated duration of the related funds. When a Fund has an undefined useful life (Perpetual funds), placement
agent costs are amortized within 10 years. In case of an early liquidation of the funds, the amortization period is adjusted, or if there
is an indication of impairment, an impairment evaluation is performed and recognized, if necessary.
(b) Goodwill has an indefinite useful life and
are not subject to amortization. Goodwill is tested annually for impairment, or more frequently if events or changes in circumstances
indicate that they might be impaired. At December 31, 2023, goodwill was tested and no provision for impairment losses was identified
by Vinci.
Key assumptions to determine the fair value of goodwill include discounted
cash flow calculations based on current performance and considering current market indicators listed below. There were no significant
changes to assumptions between acquisition and reporting date.
Inputs to determine fair value of Goodwill:
| Annual inflation rate – Brazil |
4% |
| Discount Rate |
12.5% |
(c) Refers to the purchase price allocated to
Fund’s Management Contracts as a result of SPS acquisition. These amounts are amortized based on the duration of the related funds,
from September 2022 to December 2030.
Other assets than Goodwill are tested for impairment
whenever events or changes in circumstances indicate that the carrying amount may not be recoverable. An impairment loss is recognized
for the amount by which the asset’s carrying amount exceeds its recoverable amount. The recoverable amount is the higher of an asset’s
fair value less costs of disposal and value in use. For the purposes of assessing impairment, assets are grouped at the lowest levels
for which there are separately identifiable cash inflows which are largely independent of the cash inflows from other assets or groups
of assets (cash-generating units).
Vinci Partners Investments Ltd.
Notes to the interim consolidated financial statements
All amounts in thousands of reais unless otherwise stated
| | |
| | | |
| | | |
| | | |
| 12/31/2023 | |
| | |
| Software development | | |
| Placement Agent (a) | | |
| Goodwill (b) | | |
| Management Contracts (c) | | |
| Total | |
| | |
| | | |
| | | |
| | | |
| | | |
| | |
| Cost | |
| | | |
| | | |
| | | |
| | | |
| | |
| At January 1, 2023 | |
| 28,250 | | |
| 1,359 | | |
| 162,290 | | |
| 22,049 | | |
| 213,948 | |
| Additions | |
| 12,684 | | |
| 19,469 | | |
| - | | |
| - | | |
| 32,153 | |
| Foreign exchange variation of intangible assets abroad | |
| (601 | ) | |
| (106 | ) | |
| - | | |
| - | | |
| (707 | ) |
| | |
| | | |
| | | |
| | | |
| | | |
| | |
| At December 31, 2023 | |
| 40,333 | | |
| 20,722 | | |
| 162,290 | | |
| 22,049 | | |
| 245,394 | |
| | |
| | | |
| | | |
| | | |
| | | |
| | |
| Accumulated amortization | |
| | | |
| | | |
| | | |
| | | |
| | |
| At January 1, 2023 | |
| (23,629 | ) | |
| (65 | ) | |
| - | | |
| (1,016 | ) | |
| (24,710 | ) |
| Annual amortization | |
| (1,636 | ) | |
| (1,863 | ) | |
| - | | |
| (3,048 | ) | |
| (6,547 | ) |
| Foreign exchange variation of intangible assets abroad | |
| 579 | | |
| 32 | | |
| - | | |
| | | |
| 611 | |
| | |
| | | |
| | | |
| | | |
| | | |
| | |
| At December 31, 2023 | |
| (24,686 | ) | |
| (1,896 | ) | |
| - | | |
| (4,064 | ) | |
| (30,646 | ) |
| | |
| | | |
| | | |
| | | |
| | | |
| | |
| | |
| | | |
| | | |
| | | |
| | | |
| | |
| At January 1, 2023 | |
| 4,621 | | |
| 1,294 | | |
| 162,290 | | |
| 21,033 | | |
| 189,238 | |
| | |
| | | |
| | | |
| | | |
| | | |
| | |
| At December 31, 2023 | |
| 15,647 | | |
| 18,826 | | |
| 162,290 | | |
| 17,985 | | |
| 214,748 | |
| | |
| | | |
| | | |
| | | |
| | | |
| | |
| Amortization rate (per year) - % | |
| 20 | % | |
| (a) | | |
| (b) | | |
| (c) | | |
| - | |
| | |
| | | |
| | | |
| | | |
| | | |
| | |
Vinci Partners Investments Ltd.
Notes to the interim consolidated financial statements
All amounts in thousands of reais unless otherwise stated
This note provides information for leases where
the Group is a lessee. The notes also provide the information of subleases agreements where the Group is a lessor, once part of the assets
leased by the Group is subleased to third parties.
| (i) | Amount recognized in the balance sheet |
The balance sheet shows the following amounts relating to leases:
| | |
03/31/2024 | |
12/31/2023 |
| Sub-lease receivable | |
| | | |
| | |
| Rio de Janeiro Office - BM 336 | |
| 4,680 | | |
| 5,538 | |
| Total | |
| 4,680 | | |
| 5,538 | |
| | |
| | | |
| | |
| Current | |
| 3,601 | | |
| 4,071 | |
| Non-current | |
| 1,079 | | |
| 1,467 | |
| Total | |
| 4,680 | | |
| 5,538 | |
| | |
| | | |
| | |
| Right of use assets | |
| | | |
| | |
| Rio de Janeiro Office - BM 336 | |
| 47,504 | | |
| 48,741 | |
| São Paulo Office – JRA | |
| 7,804 | | |
| 8,780 | |
| NY Office - Third Avenue | |
| 609 | | |
| 787 | |
| Total | |
| 55,917 | | |
| 58,308 | |
| | |
| | | |
| | |
| Lease liabilities | |
| | | |
| | |
| Rio de Janeiro Office - BM 336 | |
| (57,620 | ) | |
| (61,051 | ) |
| São Paulo Office – JRA | |
| (9,939 | ) | |
| (10,821 | ) |
| NY Office - Third Avenue | |
| (733 | ) | |
| (940 | ) |
| Total | |
| (68,292 | ) | |
| (72,812 | ) |
| | |
| | | |
| | |
| Current | |
| (25,104 | ) | |
| (24,381 | ) |
| Non-current | |
| (43,188 | ) | |
| (48,431 | ) |
| Total | |
| (68,292 | ) | |
| (72,812 | ) |
Reduction to the right-of-use assets until March 31, 2024 were R$ 75
(reductions of R$ 2,045 during 2023 financial year).
Vinci Partners Investments Ltd.
Notes to the interim consolidated financial statements
All amounts in thousands of reais unless otherwise stated
| (ii) | Amount recorded in the statement of profit or loss |
The statement of profit or loss shows the following amounts relating
to leases:
| | |
03/31/2024 | |
03/31/2023 |
| | |
| |
|
| Right of use assets depreciation | |
| (2,339 | ) | |
| (2,777 | ) |
| Financial expense | |
| (2,216 | ) | |
| (2,631 | ) |
| | |
| (4,555 | ) | |
| (5,408 | ) |
The total cash outflow for leases until March
31, 2024 was R$ 6,764 (R$ 6,270 until March 31, 2023).
The Group’s leasing activities and how these
are accounted for are disclosed in the Group’s annual consolidated financial statements as of December 31, 2023.
| | |
03/31/2024 | |
12/31/2023 |
| | |
| |
|
| Dividends payable | |
| 3,791 | | |
| 3,791 | |
| Lease payable – prior month expense | |
| 2,170 | | |
| 2,161 | |
| Other payables | |
| 91 | | |
| 68 | |
| | |
| | | |
| | |
| | |
| 6,052 | | |
| 6,020 | |
| 12 | Labor and social security obligations |
| | |
| |
|
| | |
03/31/2024 | |
12/31/2023 |
| | |
| |
|
| Profit sharing | |
| 17,981 | | |
| 93,611 | |
| Labor provisions | |
| 16,128 | | |
| 13,252 | |
| | |
| | | |
| | |
| | |
| 34,109 | | |
| 106,863 | |
| | |
| | | |
| | |
| Current | |
| 27,325 | | |
| 101,506 | |
| Non-current | |
| 6,784 | | |
| 5,357 | |
Except for the profit sharing related to the unrealized
performance fees, the accrual for profits sharing payable on December 31, 2023 was paid in January 2024. Profit sharing is calculated
based on the performance review of each employee plus the area performance, in accordance with the Entity policy. Vinci Management estimated
the profit sharing as of March 31, 2024 based on the management and advisory net revenue recognized and the realized performance fee up
to March 31, 2024.
Since the second quarter of 2022 labor provisions
are being impacted by provisions and social charges related to Restricted Share Units Plan (RSUs). The non-current amount comprises the
provisions and social charges for the RSUs which the vesting dates are over than 1 year. Please see note 24 for more details.
Vinci Partners Investments Ltd.
Notes to the interim consolidated financial statements
All amounts in thousands of reais unless otherwise stated
| 13 | Taxes and contributions payable |
| | |
03/31/2024 | |
12/31/2023 |
| | |
| |
|
| Income tax | |
| 11,049 | | |
| 14,467 | |
| Social contribution | |
| 4,051 | | |
| 5,061 | |
Social Contribution on
revenues (COFINS) | |
| 1,982 | | |
| 2,780 | |
| Social Integration Program (PIS) | |
| 434 | | |
| 606 | |
| Service tax (ISS) on billing | |
| 652 | | |
| 1,742 | |
Withholding Income Tax (IRRF)
deducted from third parties | |
| 199 | | |
| 103 | |
| Others | |
| 251 | | |
| 94 | |
| | |
| | | |
| | |
| | |
| 18,618 | | |
| 24,853 | |
Vinci Partners Investments Ltd.
Notes to the interim consolidated financial statements
All amounts in thousands of reais unless otherwise stated
| | |
03/31/2024 | |
12/31/2023 |
| | |
| |
|
| Convertible Preferred Shares (i) | |
| 451,350 | | |
| 431,333 | |
| Commercial Notes (ii) | |
| 61,688 | | |
| 73,189 | |
| Consideration payable (iii) | |
| 49,425 | | |
| 48,199 | |
| Contingent consideration (iv) | |
| 70,127 | | |
| 64,370 | |
| | |
| | | |
| | |
| | |
| 632,590 | | |
| 617,091 | |
| | |
| | | |
| | |
| Current | |
| 78,138 | | |
| 76,722 | |
| Non-current | |
| 554,452 | | |
| 540,369 | |
| (i) | Convertible Preferred Shares |
On October 10, 2023, Vinci and Ares Management
Corporation (“Ares”) announced an agreement to form a strategic partnership to accelerate the growth of Vinci's platform in
Latin America and to collaborate on distribution, product development and other business opportunities. In connection with the formation
of the strategic partnership, an affiliate of Ares invested US$100 million (R$ 500,550) in new Series
A Convertible Preferred Shares issued by Vinci.
The Series A Convertible Preferred Shares will
be entitled to cumulative dividends payable quarterly in cash at a rate of 8,00% per annum. The dividend rate is subject to increase to
10,00% per annum in the case of certain breaches by the Company of its obligations under the Certificate of Designations.
The Series A Convertible Preferred Shares will
be convertible at the option of the holders at any time after the closing of the issuance into Class A Common Shares at an initial conversion
rate of 73,5402 Class A Common Shares for each Series A Convertible Preferred Share, which represents an initial conversion price of approximately
$13,60 per Class A Common Share.
Under certain conditions, Vinci may redeem, following
the dissolution or termination of the strategic partnership with Ares, and prior to the one-year anniversary of such dissolution or termination,
for cash all, or, if Ares no longer holds all Series A Convertible Preferred Shares, all of the Series A Convertible Preferred Shares
held by Ares and any whole number of Series A Convertible Preferred Shares held by such other holders, On or around October 1, 2033, if
not earlier repurchased, redeemed or converted, the Company will redeem, in whole but not in part, all of the outstanding Series A Convertible
Preferred Shares for an amount in cash equal to the stated value of the Series A Convertible Preferred Shares.
Under the terms of IAS 32, this agreement was
evaluated by the Management and classified as a compound instrument, having both a liability and an equity component from the issuer's
perspective. Based on it, the component parts were accounted for and presented separately according to their substance. The split was
made at issuance and not revised for subsequent changes in market interest rates, share prices, or other event that changes the likelihood
that the conversion option will be exercised.
Vinci Partners Investments Ltd.
Notes to the interim consolidated financial statements
All amounts in thousands of reais unless otherwise stated
The following table presents the changes in the
Convertible Preferred Shares up the period ended March 31, 2024:
| Fair value of the convertible preferred shares, net of transaction costs | |
| 439,651 | |
| Net foreign exchange loss/(gain) | |
| (16,513 | ) |
| Interest expense | |
| 8,195 | |
| Closing balance December 31, 2023 | |
| 431,333 | |
| Net foreign exchange loss/(gain) | |
| 15,576 | |
| Interest expense | |
| 11,434 | |
| Interest paid | |
| (6,993 | ) |
| Closing balance March 31, 2024 | |
| 451,350 | |
| | |
| | |
Current
| |
| 9,992 | |
| Non-current | |
| 441,358 | |
On January 1, 2024, the Entity paid the total amount of R$ 6,993 related
to the dividends of the series A convertible preferred shares.
On August 15, 2022, Vinci Soluções
de Investimentos Ltda., a subsidiary of Vinci, issued 80,000 commercial notes in the total amount of R$ 80,000 (R$ 1,000,00 reais for
each commercial note). The commercial notes were subject to public distribution 90 days after the issuing date. The main characteristics
of the financial instrument are indicated below:
Term and expiration date: 5 (five) years, ending
on August 15, 2027.
Interest rate: 100% of the daily rates of interbank
deposits (“DI”) plus a spread of 2,15% on an annual basis.
Amortization: On semi-annually basis, beginning
on February 15, 2023.
Commercial Notes comprises a financial liability
evaluated at amortized cost. Interest expense is calculated using the effective interest method and is recognized in profit or loss as
part of financial expense.
Accordingly, to the terms of the agreement, the
Group is committed to be compliant with financial covenants, on an annual basis and beginning on December 31, 2022. The entity was in
compliance with the covenants as of March 31, 2024 and December 31, 2023.
The following table presents the changes in the
Commercial Notes up the period ended March 31, 2024 and December 31, 2023:
| Closing balance December 31, 2022 | |
| 83,212 | |
| Interest expense | |
| 10,841 | |
| Interest paid | |
| (11,975 | ) |
| Principal paid | |
| (8,889 | ) |
| Closing balance December 31, 2023 | |
| 73,189 | |
| Interest expense | |
| 2,350 | |
| Interest paid | |
| (4,962 | ) |
| Principal paid | |
| (8,889 | ) |
| Closing balance March 31, 2024 | |
| 61,688 | |
| | |
| | |
| Current | |
| 18,720 | |
| Non-current | |
| 42,968 | |
Vinci Partners Investments Ltd.
Notes to the interim consolidated financial statements
All amounts in thousands of reais unless otherwise stated
| (iii) | Consideration payable |
According to Note 7(a), Vinci acquired SPS Capital
Gestão de Recursos Ltda, on August 16, 2022. As part of the deal, Vinci assumed a financial obligation to be paid on the second
anniversary of the closing date. The amount as of March 31, 2024 and December 31, 2023 is R$ 49,425 and R$ 48,199, respectively.
Consideration payable is financial liability evaluated
at amortized cost. Interest expense is calculated using the effective interest method and is recognized in profit or loss as part of financial
expense.
| (iv) | Contingent consideration |
Vinci shall pay an additional consideration in
VINP’s Class A shares through an earnout structure to be paid in 2027, up to a maximum number of 1,7 million shares, subject to
the achievement of certain fundraising and incremental management fee revenue targets. The amount reflects the fair value of the obligation,
based on the terms of the purchase agreement and how the current economic environment is likely to impact it, accordingly to Vinci’s
best estimate.
On March 31, 2024, Vinci reevaluated the fair
value of the obligation based on the economic conditions at that date, resulting in an increase of the contingent consideration fair value.
The variation was recognized as an expense in the financial result in the amount of R$ 5,756 for the three months period ended March 31,
2024 (revenue of R$ 4,051 for the three months period ended March 31, 2023).
| 15 | Retirement plans liabilities |
During the year of 2023, the subsidiary Vinci
Vida e Previdência S.A. started its retirement services operations. As of March 2024 and December 2023, active plans are principally
accumulation of financial resources through products PGBL (Free Benefit Generator Plan) and VGBL (Free Benefit Generator Life) structured
in the form of variable contribution, for the purpose of granting participants with returns based on the accumulated capital in the form
of monthly withdraws for a certain term or temporary monthly withdraws.
In this respect, such financial products represent
investment contracts that have the legal form of retirement plans, but which do not transfer insurance risk to the Group. Therefore, contributions
received from participants are accounted for as liabilities and balance consists of the balance of the participant in the linked Specially
Constituted Investment Fund (“FIE”) at the reporting date (Note 5). On March 31, 2024 the Retirement plan liabilities are
R$ 144,782 (R$ 85,554 as of December 31, 2023).
The capital comprises 42,447,349 Class A shares
and 14,466,239 Class B shares with a par value of US$ 0,00005 each and 100,000 Series A convertible preferred shares.
The Class A common shares have been approved for
listing on the Nasdaq Global Select Market, or Nasdaq, under the symbol "VINP," Vinci has two classes of common shares: Class
A common shares and our Class B common shares.
Class B common shares carry rights that are identical
to the Class A common shares, except that (1) holders of Class B common shares are entitled to 10 votes per share, whereas holders of
our Class A common shares are entitled to one vote per share; (2) holders of Class B common shares have certain conversion rights; (3)
holders of Class B common shares are entitled to preemptive rights in the event that additional Class A common shares are issued in order
to maintain their proportional ownership interest; and (4) Class B common shares shall not be listed on any stock exchange and will not
be publicly traded.
Vinci Partners Investments Ltd.
Notes to the interim consolidated financial statements
All amounts in thousands of reais unless otherwise stated
Series A Convertible Preferred Shares will be
convertible at the option of the holders at any time after the closing of the issuance into Class A Common Shares at an initial conversion
rate of 73,5402 Class A Common Shares for each Series A Convertible Preferred Share, which represents an initial conversion price of approximately
$13,60 per Class A Common Share.
Fair value option of convertible preferred shares
As informed on note 14 (i), when the initial carrying
amount of a compound financial instrument is allocated to its equity and liability components, the equity component is assigned the residual
amount after deducting from the fair value of the instrument determined for the liability component. At the transaction date, the fair
value of the stock option and the amount of transaction cost were allocated to the equity in the amounts of R$ 34,141 and 1,958, respectively.
Transactions costs comprises the expenses incurred
by the Entity in connection with the IPO and the issuance of the convertible preferred shares.
Retained earnings comprises the net profit generated
by the Entity which were not distributed to their shareholders or approved to be distributed by the Entity management.
Other reserves are comprised by the following
operations:
| (i) | Exchange variation on investees |
Comprises the exchange variation in investments
made on investees which have a functional currency other than Brazilian Reais, the Entity functional currency. When a foreign operation
is sold, the associated exchange differences are reclassified to profit or loss, as part of the gain or loss on sale.
Benefits to its employees through a share-based
incentive.
On February 7, 2024, Vinci declared a quarterly
dividend distribution of US$ 0.20 per common share to shareholders as of February 22, 2024, totalizing US$ 10,756 (R$ 53,357), paid on
March 5, 2024.
Once dividends are declared and approved by the
board of directors, they will be paid on proportional basis to the owners of the common shares.
When shares recognized as equity are repurchased,
the amount of the consideration paid, which includes directly attributable costs, is recognized as a deduction from equity. Repurchased
shares are classified as treasury shares and are presented in the treasury share reserve. When treasury shares are sold or reissued subsequently,
the amount received is recognized as an increase in equity and the resulting surplus or deficit on the transaction is presented within
the additional paid-in capital.
Vinci Partners Investments Ltd.
Notes to the interim consolidated financial statements
All amounts in thousands of reais unless otherwise stated
On February 14, 2023, the Company announced a
new share buyback plan and a share repurchase plan to buy back up to R$60.0 million of the Company's outstanding Class A common shares
across both plans. The new buyback and repurchase plans will commence on the expiration date of the legacy plans and will not have specified
expiration dates (other than when the R$60.0 million buyback limit is reached).
In October 2023, the Company suspended for undetermined
time the Repurchase Program, in compliance with SEC Rule 10b5-1.
On February 7, 2024, the Company announced a new
share buyback plan and a share repurchase plan to buy back up to R$60.0 million of the Company's outstanding Class A common shares which
shall be executed through open market transactions or privately negotiated purchases. The plan is approved to replace the share buyback
and repurchase plans approved on February 14, 2023, which expired on the date that the R$60.0 million buyback limit set thereunder was
reached.
During the first quarter of 2024, the Company
bought back 533,981 shares from its shareholders, in the amount of R$ 28,302.
In March 2024 the Company holds 3,668,752 Class
A common shares in treasury.
| (g) | Basic and diluted earnings per share |
| a) Basic earning per share | |
03/31/2024 | |
03/31/2023 |
| From continuing operations attributable to the ordinary equity holders of the Entity | |
| 0.84 | | |
| 0.58 | |
| Total basic earning per share attributable to the ordinary equity holders of the Entity | |
| 0.84 | | |
| 0.58 | |
| b) Diluted earning per share | |
03/31/2024 | |
03/31/2023 |
| From continuing operations attributable to the ordinary equity holders of the Entity | |
| 0.80 | | |
| 0.57 | |
| Total basic earning per share attributable to the ordinary equity holders of the Entity | |
| 0.80 | | |
| 0.57 | |
| c) Reconciliations of earnings used in calculating earnings per share |
| Basic earnings per share: | |
03/31/2024 | |
03/31/2023 |
| Profit attributable to the ordinary equity holders of the Entity used in calculating basic earnings per share: | |
|
| From continuing operations | |
| 46,157 | | |
| 32,737 | |
| | |
| 46,157 | | |
| 32,737 | |
| Diluted earnings per share | |
03/31/2024 | |
03/31/2023 |
| Profit from continuing operations attributable to the ordinary equity holders of the Entity | |
|
| Used in calculating basic earnings per share | |
| 46,157 | | |
| 32,737 | |
| Used in calculating diluted earnings per share | |
| 46,157 | | |
| 32,737 | |
| d) Weighted average number of share used as the denominator | |
Number 03/31/2024 | |
Number 03/31/2023 |
| Weighted average number of ordinary share/quotas used as the denominator in calculating basic earnings per share: | |
| 54,799,469 | | |
| 56,741,596 | |
| Adjustments for calculation of diluted earnings per share: | |
| 3,079,155 | | |
| 725,084 | |
| Weighted average number of ordinary shares/quotas and potential ordinary shares used as the denominator in calculating diluted earnings per share | |
| 57,878,624 | | |
| 57,466,680 | |
Vinci Partners Investments Ltd.
Notes to the interim consolidated financial statements
All amounts in thousands of reais unless otherwise stated
| 17 | Revenue from services rendered |
| | |
03/31/2024 | |
03/31/2023 |
| | |
| |
|
| Gross revenue from fund management | |
| 103,185 | | |
| 102,491 | |
| Gross revenue from performance fees | |
| 2,352 | | |
| 2,075 | |
| Gross revenue from corporate advisory services | |
| 10,934 | | |
| 4,891 | |
| | |
| | | |
| | |
| Gross revenue from services rendered | |
| 116,471 | | |
| 109,457 | |
| | |
| | | |
| | |
| In Brazil | |
| 87,902 | | |
| 87,034 | |
| Abroad | |
| 28,569 | | |
| 22,423 | |
| | |
| | | |
| | |
| Taxes and contributions | |
| | | |
| | |
| COFINS | |
| (3,947 | ) | |
| (4,044 | ) |
| PIS | |
| (856 | ) | |
| (877 | ) |
| ISS | |
| (2,581 | ) | |
| (2,228 | ) |
| | |
| | | |
| | |
| Net revenue from services rendered | |
| 109,087 | | |
| 102,308 | |
| | |
| | | |
| | |
| Net revenue from fund management | |
| 96,455 | | |
| 95,877 | |
| Net revenue from performance fees | |
| 2,273 | | |
| 1,963 | |
| Net revenue from advisory services | |
| 10,359 | | |
| 4,468 | |
| 18 | General and administrative expenses |
| | |
03/31/2024 | |
03/31/2023 |
| | |
| |
|
| Personnel and profit-sharing (a) | |
| (17,314 | ) | |
| (17,677 | ) |
| Share Based Plans (b) | |
| (6,148 | ) | |
| (2,107 | ) |
| Profit sharing (a) | |
| (19,757 | ) | |
| (18,795 | ) |
| | |
| (43,219 | ) | |
| (38,579 | ) |
| Third party expense (c) | |
| (8,413 | ) | |
| (6,584 | ) |
| Right of use depreciation (d) | |
| (2,339 | ) | |
| (2,777 | ) |
| Depreciation and amortization (e) | |
| (3,125 | ) | |
| (1,778 | ) |
| Travel and representations | |
| (1,140 | ) | |
| (865 | ) |
| Condominium expenses | |
| (660 | ) | |
| (985 | ) |
| Other operating expenses (f) | |
| (2,762 | ) | |
| (2,562 | ) |
| | |
| (61,658 | ) | |
| (54,130 | ) |
| (a) | Personnel and profit-sharing |
According to the profit-sharing program and based
on Law 10,101 of December 19, 2000 and on objectives established at the beginning of each year, management estimated the payment of profit
sharing in the amount of R$ 19,757 (R$ 18,795 on March 31, 2023) for the three-months period ended March 31, 2024.
See Note 24 for more details.
Vinci Partners Investments Ltd.
Notes to the interim consolidated financial statements
All amounts in thousands of reais unless otherwise stated
Third party expenses are composed for accounting,
advisory, information technology, marketing, and other contracted services.
| (d) | Right of use depreciation |
See Note 10 for more details.
| (e) | Depreciation and amortization |
The amount is mainly comprised by property and equipment depreciation
and intangible amortization.
| (f) | Other operating expenses |
The amount is mainly comprised of office expenses,
including energy, cleaning, maintenance and conservation, among others several expenses.
Vinci Partners Investments Ltd.
Notes to the interim consolidated financial statements
All amounts in thousands of reais unless otherwise stated
| | |
| 03/31/2024 | | |
| 03/31/2023 | |
| | |
| | | |
| | |
| Investment income (i) | |
| 25,871 | | |
| - | |
| Financial revenue through amortized cost | |
| 6,065 | | |
| - | |
| Financial revenue on sublease agreements | |
| 179 | | |
| 76 | |
| Contingent consideration variation (iii) | |
| - | | |
| 4,051 | |
| Other finance income | |
| 496 | | |
| 126 | |
| | |
| | | |
| | |
| Finance income | |
| 32,611 | | |
| 4,253 | |
| | |
| | | |
| | |
| Financial expense on lease agreements | |
| (2,216 | ) | |
| (2,631 | ) |
| Interest expense on loans and financing (ii) | |
| (15,010 | ) | |
| (3,934 | ) |
| Bank fees | |
| (36 | ) | |
| (13 | ) |
| Investment losses (i) | |
| - | | |
| (111 | ) |
| Fines on taxes | |
| (1 | ) | |
| - | |
| Foreign currency variation on liabilities at amortized cost | |
| (614 | ) | |
| (155 | ) |
| Interest on taxes | |
| (78 | ) | |
| - | |
| Contingent consideration variation (iii) | |
| (5,756 | ) | |
| - | |
| Other financial expenses | |
| (237 | ) | |
| - | |
| | |
| | | |
| | |
| Finance costs | |
| (23,948 | ) | |
| (6,844 | ) |
| | |
| | | |
| | |
| Finance profit/(loss), net | |
| 8,663 | | |
| (2,591 | ) |
| (i) | Investment income and losses comprises the fair value changes on the financial instruments at fair value through profit or loss, Segregated
investment income result is demonstrated below. |
| | |
03/31/2024 | |
03/31/2023 |
| Mutual funds and fixed income investments (a) | |
| 25,038 | | |
| - | |
| Private equity funds | |
| 833 | | |
| - | |
| | |
| 25,871 | | |
| - | |
| | |
| | | |
| | |
| Mutual funds | |
| - | | |
| (108 | ) |
| Private equity funds | |
| - | | |
| (3 | ) |
| | |
| - | | |
| (111 | ) |
| (a) | Vinci Monalisa corresponds to the most part of the Group’s investment income, |
| (ii) | Interest expense on loans and financing comprises the financial result on the Commercial notes, the consideration
payable related to SPS acquisition and interest expense on the convertible preferred shares. Please see note 14 for more detail. |
| (iii) | Variation on contingent consideration comprises the financial result of the fair value evaluation. Please see note 14 (iii) for more
detail. |
Vinci Partners Investments Ltd.
Notes to the interim consolidated financial statements
All amounts in thousands of reais unless otherwise stated
| 20 | Income tax and social contribution |
As an exempted company incorporated in the Cayman
Islands, Vinci Partners Ltd is subject to Cayman Islands laws, which currently levy no taxes on individuals or corporations based upon
profits, income, gains or appreciation and there is no taxation in the nature of inheritance tax or estate duty or withholding tax applicable
to us.
Vinci Partners Ltd subsidiaries, except for certain
subsidiaries, are taxed based on the deemed profit.
Vinci has tax losses and negative basis resulting
from previous years and deferred income tax and social contribution credits are recognized since there is expectation of future tax results
for these companies, The tax credit arising from the tax loss and negative basis under the taxable profit regime on March 31, 2024 is
R$ 6,066 (R$ 6,066 on December 31, 2023).
The income tax and social contribution charge
on the results for the year can be summarized as follows:
| | |
03/31/2024 | |
03/31/2023 |
| | |
| |
|
| Current income tax | |
| (9,440 | ) | |
| (9,210 | ) |
| Current social contribution | |
| (3,431 | ) | |
| (3,307 | ) |
| | |
| | | |
| | |
| | |
| (12,871 | ) | |
| (12,517 | ) |
| | |
| | | |
| | |
| Deferred income tax | |
| 1,829 | | |
| (227 | ) |
| Deferred social contribution | |
| 658 | | |
| (137 | ) |
| | |
| | | |
| | |
| | |
| 2,487 | | |
| (364 | ) |
| | |
| | | |
| | |
| Total income tax and social contribution | |
| (10,384 | ) | |
| (12,881 | ) |
Vinci Partners Investments Ltd.
Notes to the interim consolidated financial statements
All amounts in thousands of reais unless otherwise stated
Deferred tax balances
| | |
03/31/2024 | |
12/31/2023 |
| Deferred tax assets | |
| | | |
| | |
| Tax losses | |
| 6,066 | | |
| 6,066 | |
| Leases | |
| 930 | | |
| 1,084 | |
| RSU | |
| 2,617 | | |
| 2,188 | |
| Interest expense on obligation for acquisition | |
| 2,538 | | |
| 2,121 | |
| Amortization on management Contracts | |
| 1,641 | | |
| 1,382 | |
| Contingent consideration | |
| 2,603 | | |
| 646 | |
| Total | |
| 16,395 | | |
| 13,487 | |
| Deferred tax liabilities | |
| |
|
| Financial revenue | |
| (1,434 | ) | |
| (1,147 | ) |
| Estimated revenue | |
| (1,570 | ) | |
| (1,570 | ) |
| Leases | |
| (484 | ) | |
| (351 | ) |
| Total Income Tax | |
| (3,488 | ) | |
| (3,068 | ) |
| | |
| | | |
| | |
| Estimated revenue | |
| (815 | ) | |
| (815 | ) |
| Total (Taxes and contribution) | |
| (815 | ) | |
| (815 | ) |
| | |
| | | |
| | |
| Total deferred tax liabilities | |
| (4.303 | ) | |
| (3,883 | ) |
| Movements | |
Tax losses | |
Leases | |
RSU | |
Other (*) | |
Total |
| Deferred tax assets | |
| | | |
| | | |
| | | |
| | | |
| | |
| As at December 31, 2022 | |
| 4,912 | | |
| 1,805 | | |
| 1,628 | | |
| 896 | | |
| 9,241 | |
| to profit and loss | |
| 1,154 | | |
| (721 | ) | |
| 560 | | |
| 3,253 | | |
| 4,246 | |
| As at December 31, 2023 | |
| 6,066 | | |
| 1,084 | | |
| 2,188 | | |
| 4,149 | | |
| 13,487 | |
| to profit and loss | |
| - | | |
| (154 | ) | |
| 429 | | |
| 2,633 | | |
| 2,908 | |
| As at March 31, 2024 | |
| 6,066 | | |
| 930 | | |
| 2,617 | | |
| 6,782 | | |
| 16,395 | |
(*) Comprises deferred taxes related to interest
expense on obligation for ownership acquisition, amortization on management contracts and contingent consideration.
| Movements | |
Financial Revenue | |
Estimated Revenue | |
Leases | |
Contingent consideration | |
Total |
| Deferred tax liabilities | |
| | | |
| | | |
| | | |
| | | |
| | |
| As at December 31, 2022 | |
| (973 | ) | |
| (2,568 | ) | |
| (49 | ) | |
| (4,750 | ) | |
| (8,340 | ) |
| to profit and loss | |
| (174 | ) | |
| 183 | | |
| (302 | ) | |
| 4,750 | | |
| 4,457 | |
| As at December 31, 2023 | |
| (1,147 | ) | |
| (2,385 | ) | |
| (351 | ) | |
| - | | |
| (3,883 | ) |
| to profit and loss | |
| (287 | ) | |
| - | | |
| (133 | ) | |
| - | | |
| (420 | ) |
| As at March 31, 2024 | |
| (1,434 | ) | |
| (2,385 | ) | |
| (484 | ) | |
| - | | |
| (4,303 | ) |
Vinci Partners Investments Ltd.
Notes to the interim consolidated financial statements
All amounts in thousands of reais unless otherwise stated
| | |
03/31/2024 | |
03/31/2023 |
| | |
| |
|
| Profit (loss) before income taxes | |
| 56,092 | | |
| 45,587 | |
| Combined statutory income taxes rate - % | |
| 34 | % | |
| 34 | % |
| Income tax benefit (expense) at statutory rates | |
| (19,071 | ) | |
| (15,500 | ) |
| Reconciliation adjustments: | |
| | | |
| | |
| Expenses not deductible | |
| (99 | ) | |
| (62 | ) |
| Tax benefits | |
| 37 | | |
| 35 | |
| Share based payments | |
| (338 | ) | |
| (29 | ) |
| Unrecognized tax loss credits | |
| (918 | ) | |
| - | |
| Effect of presumed profit of subsidiaries (i) and offshore subsidiaries | |
| 9,981 | | |
| 2,662 | |
| | |
| | | |
| | |
| Other additions (exclusions), net | |
| 24 | | |
| 13 | |
| | |
| | | |
| | |
| Income taxes expenses | |
| (10,384 | ) | |
| (12,881 | ) |
| Current | |
| (12,871 | ) | |
| (12,517 | ) |
| Deferred | |
| 2,487 | | |
| (364 | ) |
| | |
| | | |
| | |
| Effective rate | |
| 19 | % | |
| 28 | % |
| (i) | Brazilian tax law establishes that companies that generate gross revenues of up to R$ 78,000 in the
prior fiscal year may calculate income taxes as a percentage of gross revenue, using the presumed profit income tax regime. The Entity's
subsidiaries adopted this tax regime and the effect of the presumed profit of subsidiaries represents the difference between the taxation
based on this method and the amount that would be due based on the statutory rate applied to the taxable profit of the subsidiaries. |
Vinci Partners Investments Ltd.
Notes to the interim consolidated financial statements
All amounts in thousands of reais unless otherwise stated
| (a) | Key management remuneration |
The total remuneration (salaries and benefits)
of key management personnel, including the Executive Committee, amounted to R$ 1,755 for the three-month period ended March 31, 2024 (March
31, 2023 – R$ 1,878).
According to Vinci internal policy, the key management
is entitled to receive a profit-sharing compensation for the current year. As informed in Note 12, Vinci accrued a provision for profit
sharing for the Group as of March 31, 2024.
| (b) | Receivables from related parties |
The Entity receivables from related parties as of December 31, 2023
and 2022, as shown in the table below:
| | |
03/31/2024 | |
12/31/2023 |
| Cagliari Participações S,A, | |
| 4 | | |
| 4 | |
| | |
| 4 | | |
| 4 | |
As presented in Note 6(i), Vinci may advance payments to its employees.
| (d) | Receivables from employees |
During 2023, Vinci sold part of its treasury shares to employees. The
amount will be received from January 31, 2025, in annual installments until January 31, 2029, and a monetary variation will be charged
by inflation index.
The Entity's reportable segments are those business
units which provide different services and are separately managed since each business demands different market strategies.
The main information used by management for assessment
of the performance of each segment is the profit by segment for the analysis of the return of these investments.
The information on assets and liabilities by segment
is not disclosed in these financial statements because it is not used by management when managing segments. Management does not make an
analysis by geographical areas for the management of the Entity's business.
In 2024, the Entity reassessed
the allocation of certain revenues and expenses across its segments and restated the segment reporting as of March 31, 2023, for
comparative purposes.
Segments are independently managed, with professionals
specifically skilled allocated in each segment.
The Entity's operations are segmented according
to the organization and management model approved by management, and they are divided as follows:
Vinci Partners Investments Ltd.
Notes to the interim consolidated financial statements
All amounts in thousands of reais unless otherwise stated
Private Market Strategies
Comprises the investments in illiquid funds, as
described below:
The private equity segment has a generalist
and control-oriented approach, focusing on growth and turnaround. The primary strategy is value creation pursuing transformation of invested
companies, with changes in the growth of revenue, productivity, profitability and management profile, using a proprietary methodology
("Value from the Core").
Another strategy of the segment is
focused on sectors resilient to different investment cycles and minority holdings in small and medium enterprises with business models
that exhibit high growth potential and clear, mensurable ESG (Environmental, Social and Governance) goals.
The Real Estate Investment Funds segment
are focused on shopping centers, logistics, offices, urban real estate and funds of funds, and seek to achieve differentiated returns
through an active management of a diversified and quality portfolio. The segment’s objective is also the development of real estate
properties, following up to five key steps: origination of opportunities, analysis, execution, monitoring and asset sale.
The infrastructure segment has exposure
to real assets through equity and debt instruments, active in the following sub-segments: power, oil & gas, transportation & logistic
and water & sewage. The strategy invests across two sub-strategies: sector-focused funds and structured credit. The fund’s investments
are periodically monitored, including the evolution of ESG metrics, financial and operational metrics.
This credit segment is focused on
fundamental credit analysis, consistency, and long-term value creation to investors. The area dynamic approach is to tactically allocate
capital between asset classes and adapt to different cycles. It is also sourcing of credit instruments with resilient structures and sound
collateral packages. The credit strategy investments include for core sub-strategies: infrastructure debt, real estate debt, structured
credit and exclusive mandates, following four key steps: origination, analysis, structuring and monitoring.
| (v) | Special situations (SPS) |
This Special situation segment is
focused in complex situations in which financial and human capital are employed to generate superior returns, maintaining adequate risk
levels and preserving the interests of all parties involved.
Public Equities
This segment seeks return through investments
in liquid funds and manages long-term positions based on fundamental analysis of Brazilian publicly traded companies, trading bonds, public
stocks and derivatives, among other assets.
Vinci Partners Investments Ltd.
Notes to the interim consolidated financial statements
All amounts in thousands of reais unless otherwise stated
Investment products and solutions
Investment products and solutions segments offer
financial products on an open platform basis providing portfolio and management services considering medium/long term risk allocation.
The strategy aims to provide an advanced investment strategy with alpha generation according to the clients’ targets. The strategy
is divided in five sub-strategies: separate exclusive mandates, commingled funds, international allocation, pension plans and hedge funds.
Monitoring and risk control are based on different techniques such as: use of options for high conviction trades, monitoring liquidity
conditions for each position, VaR monitoring, scenarios simulations (including stress test), stop loss rules on individual positions and
on the portfolio level.
Corporate advisory
The corporate advisory services objective is including
high value-added to financial and strategic advisory services to entrepreneurs, corporate senior management teams and boards of directors,
focusing primarily on IPO advisory and M&A transactions for Brazilian middle-market companies. The corporate advisory services team
serves as trusted advisors to clients targeting local and/or product expertise in the Brazilian marketplace.
Vinci retirement services
The retirement services focus on planning and building long-term investment
portfolios that assist investors to achieve their retirement goals. The retirement services segment started its operations during the
first semester of 2023.
Vinci Partners Investments Ltd.
Notes to the interim consolidated financial statements
All amounts in thousands of reais unless otherwise stated
| | |
| |
Three-month period ended 03/31/2024 |
| | |
Private Market Strategies | |
Public Equities | |
Investment Products and solutions | |
Corporate Advisory | |
Vinci Retirement Services | |
Corporate Center | |
Total |
| In Brazil | |
| 65,466 | | |
| 2,210 | | |
| 19,869 | | |
| 188 | | |
| 169 | | |
| - | | |
| 87,902 | |
| Abroad | |
| 1,485 | | |
| 14,988 | | |
| 1,964 | | |
| 10,132 | | |
| - | | |
| - | | |
| 28,569 | |
| Gross revenue from services rendered | |
| 66,951 | | |
| 17,198 | | |
| 21,833 | | |
| 10,320 | | |
| 169 | | |
| - | | |
| 116,471 | |
| Fund Advisory fee | |
| 605 | | |
| - | | |
| 9 | | |
| 10,320 | | |
| - | | |
| - | | |
| 10,934 | |
| Fund Management fee | |
| 66,338 | | |
| 14,864 | | |
| 21,814 | | |
| - | | |
| 169 | | |
| - | | |
| 103,185 | |
| Fund Performance fee | |
| 8 | | |
| 2,334 | | |
| 10 | | |
| - | | |
| - | | |
| - | | |
| 2,352 | |
| Taxes and contributions | |
| (3,871 | ) | |
| (977 | ) | |
| (2,003 | ) | |
| (523 | ) | |
| (11 | ) | |
| - | | |
| (7,384 | ) |
| Net revenue from services rendered | |
| 63,081 | | |
| 16,221 | | |
| 19,831 | | |
| 9,797 | | |
| 158 | | |
| - | | |
| 109,087 | |
| (-) General and administrative expenses | |
| (11,444 | ) | |
| (3,700 | ) | |
| (5,390 | ) | |
| (3,507 | ) | |
| (2,869 | ) | |
| (28,600 | ) | |
| (55,510 | ) |
| Share-based payments | |
| (61 | ) | |
| (13 | ) | |
| (10 | ) | |
| - | | |
| - | | |
| (6,064 | ) | |
| (6,148 | ) |
| Operating profit | |
| 51,576 | | |
| 12,508 | | |
| 14,431 | | |
| 6,290 | | |
| (2,711 | ) | |
| (34,664 | ) | |
| 47,429 | |
| Finance income | |
| | | |
| | | |
| | | |
| | | |
| | | |
| | | |
| 32,611 | |
| Finance cost | |
| | | |
| | | |
| | | |
| | | |
| | | |
| | | |
| (23,948 | ) |
| Finance result, net | |
| | | |
| | | |
| | | |
| | | |
| | | |
| | | |
| 8,663 | |
| Profit before income taxes | |
| | | |
| | | |
| | | |
| | | |
| | | |
| | | |
| 56,092 | |
| Income taxes | |
| | | |
| | | |
| | | |
| | | |
| | | |
| | | |
| (10,384 | ) |
| Profit for the period | |
| | | |
| | | |
| | | |
| | | |
| | | |
| | | |
| 45,708 | |
Vinci Partners Investments Ltd.
Notes to the interim consolidated financial statements
All amounts in thousands of reais unless otherwise stated
| | |
| |
Three-month period ended 03/31/2023 (Restated) |
| | |
Private Market Strategies | |
Public Equities | |
Investment Products and solutions | |
Corporate Advisory | |
Vinci Retirement Services | |
Corporate Center | |
Total |
| In Brazil | |
| 44,806 | | |
| 15,701 | | |
| 21,944 | | |
| 4,582 | | |
| - | | |
| - | | |
| 87,034 | |
| Abroad | |
| 17,384 | | |
| 1,190 | | |
| 3,849 | | |
| - | | |
| - | | |
| - | | |
| 22,423 | |
| Gross revenue from services rendered | |
| 62,190 | | |
| 16,891 | | |
| 25,793 | | |
| 4,582 | | |
| - | | |
| - | | |
| 109,457 | |
| Fund Advisory fee | |
| 300 | | |
| - | | |
| 9 | | |
| 4,582 | | |
| - | | |
| - | | |
| 4,891 | |
| Fund Management fee | |
| 61,883 | | |
| 15,701 | | |
| 24,907 | | |
| - | | |
| - | | |
| - | | |
| 102,491 | |
| Fund Performance fee | |
| 7 | | |
| 1,190 | | |
| 877 | | |
| - | | |
| - | | |
| - | | |
| 2,075 | |
| Taxes and contributions | |
| (3,477 | ) | |
| (1,097 | ) | |
| (2,179 | ) | |
| (396 | ) | |
| - | | |
| - | | |
| (7,149 | ) |
| Net revenue from services rendered | |
| 58,713 | | |
| 15,794 | | |
| 23,614 | | |
| 4,186 | | |
| - | | |
| - | | |
| 102,308 | |
| (-) General and administrative expenses | |
| (9,607 | ) | |
| (3,007 | ) | |
| (7,516 | ) | |
| (1,293 | ) | |
| (1,394 | ) | |
| (29,204 | ) | |
| (52,023 | ) |
| Share-based payments | |
| (264 | ) | |
| (72 | ) | |
| 184 | | |
| - | | |
| - | | |
| (1,955 | ) | |
| (2,107 | ) |
| Operating profit | |
| 48,842 | | |
| 12,715 | | |
| 16,282 | | |
| 2,893 | | |
| (1,394 | ) | |
| (31,159 | ) | |
| 48,178 | |
| Finance income | |
| | | |
| | | |
| | | |
| | | |
| | | |
| | | |
| 4,253 | |
| Finance cost | |
| | | |
| | | |
| | | |
| | | |
| | | |
| | | |
| (6,844 | ) |
| Finance result, net | |
| | | |
| | | |
| | | |
| | | |
| | | |
| | | |
| (2,591 | ) |
| Profit before income taxes | |
| | | |
| | | |
| | | |
| | | |
| | | |
| | | |
| 45,587 | |
| Income taxes | |
| | | |
| | | |
| | | |
| | | |
| | | |
| | | |
| (12,881 | ) |
| Profit for the period | |
| | | |
| | | |
| | | |
| | | |
| | | |
| | | |
| 32,706 | |
Vinci Partners Investments Ltd.
Notes to the interim consolidated financial statements
All amounts in thousands of reais unless otherwise stated
As of March 31, 2024 and December 31, 2023, the Entity
is not aware of disputes classified as probable chance of loss.
Find below the disputes classified as possible chance of
loss segregated into labor, tax and civil,
| | |
03/31/2024 | |
12/31/2023 |
| | |
| |
|
| Tax | |
| 22,644 | | |
| 22,095 | |
| Labor | |
| 37 | | |
| 780 | |
| Total | |
| 22,681 | | |
| 22,875 | |
Tax Claims
Vinci Gestora de Recursos Ltda, is
a party to a tax administrative proceeding in course arising from the payment of social security contributions (employer's portion and
Work Accident Insurance (SAT)) in 2011, charged on amounts paid by virtue of quota of profits and results, totaling R$ 3,717 (December
31, 2023: R$ 3,652).
Vinci Equities Gestora de Recursos
Ltda, has one proceeding related to the requirement of ISS (excise tax) under rendered services to investment funds located abroad in
the amount of R$ 273 (December 31, 2023: R$ 266). Supported by the opinion of its legal advisors, management classified these proceedings
as having a possible risk of loss and did not record a provision for contingencies related to these proceedings.
On December 21, 2018, the Brazilian
federal revenue opened a tax assessment against Vinci Equities for the collection of open debts of IRPJ, CSLL, PIS and COFINS in the amount
of R$ 18,631 (December 31, 2023: R$ 18,154) for the calendar year of 2013.
The Entity provides benefits to its
employees through a share-based incentive. The following item refers to the outstanding plan on March 31, 2024.
Stock Options
May 2021
On May 6, 2021, the Entity launched
a Stock Option Plan (“SOP” or “Plan”) in order to grant stock options to certain key employees (“Participants”)
to incentivize and reward such individuals. These awards are scheduled to vest over a three-year period and the holders of vested options
are entitled to purchase shares at the market price of the shares at grant date. This right may be subject to certain conditions to be
imposed by the Entity and aims at aligning the interests of the Entity's shareholders with those of the Participants. Each option will
entitle the Participant to acquire 1 Class A common shares issued by the Company.
The issue or purchase price of the
shares to be subscribed or purchased by the Participants (“Exercise Price”) will be US$18,00. The Exercise Price will be reduced
by the amount in dollars per share distributed to its shareholders from the date of execution of this Plan, whether as dividends, interest
on equity, redemption, capital reduction or other events defined by the Board of Directors.
As of March 31, 2024, there are
stock options outstanding with respect to 1,482,753 Class A common shares. All the stock options were vested on February
1st, 2024, and the Participants have a period of 12 months to exercise their vested options from February 1, 2024
(“Exercise Deadline”).
The total expense recognized for the
programs for the three- month period ended March 2024 was R$ 119 (December 31, 2023 was R$ 120).
February 2023
In February 2023, the Board of Directors
approved a second Stock Option Plan, which aims to grant up to 1,150,000 options, each entitling the beneficiary to purchase one Class
A common share, Such options have an exercise price per share equal to US$9,96; provided that, unless otherwise provided for in an option
agreement, this exercise price will be reduced by the amount per share distributed to our shareholders from the date of the grant of the
option, whether as dividends, interest on capital, redemption, capital reduction or others. Options will become eligible to be exercised
in May 2026. During the second quarter of 2023 the Entity and its subsidiaries issued stock option in connection to the related Plan.
Vinci Partners Investments Ltd.
Notes to the interim consolidated financial statements
All amounts in thousands of reais unless otherwise stated
As of March 31, 2024, there are stock
options outstanding with respect to 1,116,884 Class A common shares.
The total expense recognized for the
programs for the three-month period ended March 2024 was R$ 977.
January 2024
In January 2024, the Board of Directors
approved a third Stock Option Plan, which aims to grant up to 1,274,000 options, each entitling the beneficiary to purchase one Class
A common share. Such options have an exercise price per share equal to US$11,04; provided that, unless otherwise provided for in an option
agreement, this exercise price will be reduced by the amount per share distributed to our shareholders from the date of the grant of the
option, whether as dividends, interest on capital, redemption, capital reduction or others. Options will become eligible to be exercised
in January 2027. During the first quarter of 2024 the Entity and its subsidiaries issued stock option in connection to the related Plan.
As of March 2024, there are stock
options outstanding with respect to 1,273,492 Class A common shares.
The total expense recognized for the
programs for the three-month period ended March 2024 was R$ 1,430.
Restricted Share Unit (RSU)
a) Restricted
Shares Units Plan
On April 04, 2022, the Entity announced
its Restricted Share Unit Award Plan (“Plan”). The purpose of this Plan is to provide the opportunity for officers and employees
of Vinci and its Subsidiaries, as elected by the Executive Compensation Committee, to receive restricted Shares (“RSU”). Shares
representing up to 1,65% of the total amount of the capital stock of the Company, which equals, on this date, approximately 950,000 shares.
Under the Plan, stocks are awarded
to the recipient upon their grant date. Subject to the terms of the Plan, each RSU shall grant the beneficiary the right to receive one
(1) share, subject to the satisfaction of the conditions for acquisition of the shares. The RSUs awarded to the beneficiary shall be vested
in different tranches, as long as the service condition is fulfilled and verified. The vesting dates may vary from 1 to 6 years after
the granted date, accordingly to the dates defined in each Restricted Share Unit Award Agreement.
If an eligible participant
ceases its relationship with the Group, within the vesting period, the rights will be forfeited, except in limited circumstances.
b) Fair
value of shares granted.
Estimating fair value for share-based
payment transactions requires determination of the most appropriate valuation model and underlying assumptions, which depends on the terms
and conditions of the grant and the information available at the grant date.
The Company uses certain assumptions
to determine the RSUs fair value at the granted date, including the following:
| • | Market value of the shares at the granted date. |
| • | Estimative of dividend yield and the US interest rate for the
years comprised from the granted date until the vesting dates. |
These estimates also require
determination of the most appropriate inputs to the valuation models including assumptions, regarding the expected life of a
share-based payment.
Vinci Partners Investments Ltd.
Notes to the interim consolidated financial statements
All amounts in thousands of reais unless otherwise stated
c) Outstanding
shares granted and valuation inputs
The total RSUs awarded for this Plan
was 781,881. The table below summarize the activity for the year ended December 31, 2023, and for the three-month period ended March 31,
2024.
| | |
03/31/2024 | |
12/31/2023 |
| | |
| |
|
| RSU outstanding on January 1st | |
| 688,779 | | |
| 781,881 | |
| Granted | |
| - | | |
| - | |
| Forfeited | |
| - | | |
| (35,689 | ) |
| Vested | |
| - | | |
| (57,413 | ) |
| RSU outstanding on December 31 | |
| 688,779 | | |
| 688,779 | |
d) As
of March 31, 2024, total compensation expense of the plans was R$ 3,622 (R$ 1,987 as of March 31, 2023), including R$ 1,869 (R$ 121 as
of March 31, 2023) of social charges provisions.
In accordance with the Partnership
Agreement of Vinci Private Equity and Vinci Impact and Return Offshore Funds, management fees are payable in advance semiannually on January
1 and July 1. The revenue fees are recognized monthly on a linear basis during the semester. The deferred revenue balance in March is
R$10,419.
MAV Capital business combination
On April 25, 2024, Vinci announced
a transaction to acquire MAV Capital. Founded in 2021, MAV Capital is an alternative asset manager focused on the agribusiness sector.
MAV Capital manages roughly R$550 million in assets, through five investment vehicles comprising more than 35 in-house structured credit
operations across a number of sectors, such as agribusiness, real estate and infrastructure.
The transaction will have an initial
cash component, with an additional consideration in cash through an earnout structure to be paid in 2028, subject to the achievement of
certain incremental management fee revenue targets. The transaction is expected to close in the third quarter of 2024, subject to regulatory
approvals and other customary closing conditions.
Vinci Partners Investments (NASDAQ:VINP)
Gráfica de Acción Histórica
De Abr 2024 a May 2024

Vinci Partners Investments (NASDAQ:VINP)
Gráfica de Acción Histórica
De May 2023 a May 2024
