Form NPORT-P - Monthly Portfolio Investments Report on Form N-PORT (Public)
26 Noviembre 2024 - 9:21AM
Edgar (US Regulatory)
Portfolio
of
Investments
September
30,
2024
JRS
(Unaudited)
SHARES
DESCRIPTION
VALUE
LONG-TERM
INVESTMENTS
-
136.8%
(97.1%
of
Total
Investments)
X
279,537,426
REAL
ESTATE
INVESTMENT
TRUST
COMMON
STOCKS
-
98.0%
(69.6%
of
Total
Investments)
X
279,537,426
DATA
CENTER
REITS
-
11.9%
131,684
Digital
Realty
Trust
Inc
$
21,310,422
14,200
Equinix
Inc
12,604,346
TOTAL
DATA
CENTER
REITS
33,914,768
HEALTH
CARE
REITS
-
14.0%
363,968
Healthpeak
Properties
Inc
8,323,948
288,345
Ventas
Inc
18,491,565
102,946
Welltower
Inc
13,180,176
TOTAL
HEALTH
CARE
REITS
39,995,689
HOTEL
&
RESORT
REITS
-
2.8%
306,576
Host
Hotels
&
Resorts
Inc
5,395,738
95,275
Sunstone
Hotel
Investors
Inc
983,238
110,972
Xenia
Hotels
&
Resorts
Inc
1,639,056
TOTAL
HOTEL
&
RESORT
REITS
8,018,032
INDUSTRIAL
REITS
-
12.2%
145,555
First
Industrial
Realty
Trust
Inc
8,148,169
211,336
Prologis
Inc
26,687,510
TOTAL
INDUSTRIAL
REITS
34,835,679
MULTI-FAMILY
RESIDENTIAL
REITS
-
14.4%
35,632
AvalonBay
Communities
Inc
8,026,108
108,319
Camden
Property
Trust
13,380,646
93,599
Equity
Residential
6,969,382
17,895
Essex
Property
Trust
Inc
5,286,541
22,375
Mid-America
Apartment
Communities
Inc
3,555,387
85,575
UDR
Inc
3,879,970
TOTAL
MULTI-FAMILY
RESIDENTIAL
REITS
41,098,034
OFFICE
REITS
-
8.1%
50,934
Alexandria
Real
Estate
Equities
Inc
6,048,412
74,695
BXP
Inc
6,009,960
86,305
Cousins
Properties
Inc
2,544,271
42,260
JBG
SMITH
Properties
738,705
122,605
Kilroy
Realty
Corp
4,744,814
44,265
SL
Green
Realty
Corp
3,081,287
TOTAL
OFFICE
REITS
23,167,449
OTHER
SPECIALIZED
REITS
-
1.5%
129,330
VICI
Properties
Inc
4,307,982
TOTAL
OTHER
SPECIALIZED
REITS
4,307,982
RETAIL
REITS
-
16.8%
112,565
Acadia
Realty
Trust
2,643,026
70,615
Federal
Realty
Investment
Trust
8,118,607
190,865
Kimco
Realty
Corp
4,431,885
368,776
Kite
Realty
Group
Trust
9,794,691
149,159
Macerich
Co/The
2,720,660
100,309
Simon
Property
Group
Inc
16,954,227
53,818
SITE
Centers
Corp
3,255,989
TOTAL
RETAIL
REITS
47,919,085
SELF-STORAGE
REITS
-
9.5%
145,012
CubeSmart
7,805,996
46,585
Extra
Space
Storage
Inc
8,394,151
29,595
Public
Storage
10,768,733
TOTAL
SELF-STORAGE
REITS
26,968,880
SINGLE-FAMILY
RESIDENTIAL
REITS
-
5.4%
166,407
American
Homes
4
Rent,
Class
A
6,388,365
110,520
Invitation
Homes
Inc
3,896,935
36,815
Sun
Communities
Inc
4,975,547
TOTAL
SINGLE-FAMILY
RESIDENTIAL
REITS
15,260,847
Portfolio
of
Investments
September
30,
2024
(continued)
JRS
SHARES
DESCRIPTION
VALUE
TELECOM
TOWER
REITS
-
1.4%
16,830
SBA
Communications
Corp
$
4,050,981
TOTAL
TELECOM
TOWER
REITS
4,050,981
TOTAL
REAL
ESTATE
INVESTMENT
TRUST
COMMON
STOCKS
(Cost
$193,174,935)
279,537,426
SHARES
DESCRIPTION
RATE
VALUE
X
110,570,315
REAL
ESTATE
INVESTMENT
TRUST
PREFERRED
STOCKS
-
38.8%
(27.5%
of
Total
Investments)
X
110,570,315
DATA
CENTER
REITS
-
3.4%
194,920
Digital
Realty
Trust
Inc
5.200
%
$
4,631,299
105,960
Digital
Realty
Trust
Inc
5.250
2,570,590
96,245
Digital
Realty
Trust
Inc
5.850
2,398,425
TOTAL
DATA
CENTER
REITS
9,600,314
DIVERSIFIED
REITS
-
0.4%
34,560
Armada
Hoffler
Properties
Inc
6.750
882,662
10,000
CTO
Realty
Growth
Inc
6.375
235,300
TOTAL
DIVERSIFIED
REITS
1,117,962
HOTEL
&
RESORT
REITS
-
4.5%
90,130
Chatham
Lodging
Trust
6.625
2,086,509
134,915
DiamondRock
Hospitality
Co
8.250
3,440,333
151,610
Pebblebrook
Hotel
Trust
6.375
3,347,549
56,950
Pebblebrook
Hotel
Trust
5.700
1,127,610
21,740
Pebblebrook
Hotel
Trust
6.300
483,063
64,310
Sunstone
Hotel
Investors
Inc
5.700
1,407,746
41,335
Sunstone
Hotel
Investors
Inc
6.125
926,317
TOTAL
HOTEL
&
RESORT
REITS
12,819,127
INDUSTRIAL
REITS
-
2.7%
59,877
Prologis
Inc
8.540
3,405,887
158,030
Rexford
Industrial
Realty
Inc
5.625
3,797,461
23,316
Rexford
Industrial
Realty
Inc
5.875
563,081
TOTAL
INDUSTRIAL
REITS
7,766,429
MULTI-FAMILY
RESIDENTIAL
REITS
-
0.7%
35,658
Mid-America
Apartment
Communities
Inc
8.500
2,119,508
TOTAL
MULTI-FAMILY
RESIDENTIAL
REITS
2,119,508
OFFICE
REITS
-
10.7%
12,713
Highwoods
Properties
Inc
8.625
13,540,362
144,320
SL
Green
Realty
Corp
6.500
3,538,726
226,090
Vornado
Realty
Trust
5.250
4,053,794
222,827
Vornado
Realty
Trust
5.250
3,995,288
176,330
Vornado
Realty
Trust
4.450
2,881,232
126,524
Vornado
Realty
Trust
5.400
2,381,182
TOTAL
OFFICE
REITS
30,390,584
OTHER
SPECIALIZED
REITS
-
0.1%
12,465
EPR
Properties
5.750
286,570
TOTAL
OTHER
SPECIALIZED
REITS
286,570
REAL
ESTATE
OPERATING
COMPANIES
-
0.9%
52,815
DigitalBridge
Group
Inc
7.150
1,355,761
44,840
DigitalBridge
Group
Inc
7.125
1,150,595
TOTAL
REAL
ESTATE
OPERATING
COMPANIES
2,506,356
RETAIL
REITS
-
8.4%
123,025
Agree
Realty
Corp
4.250
2,597,058
144,110
Federal
Realty
Investment
Trust
5.000
3,337,588
156,704
Kimco
Realty
Corp
5.250
3,890,960
126,039
Kimco
Realty
Corp
5.125
3,027,457
30,155
Kimco
Realty
Corp
7.250
1,851,517
60,045
Regency
Centers
Corp
6.250
1,538,953
51,590
Regency
Centers
Corp
5.875
1,256,216
130,415
Saul
Centers
Inc
6.000
3,076,490
19,725
Saul
Centers
Inc
6.125
457,945
5,494
Simon
Property
Group
Inc
8.375
351,616
Investments
in
Derivatives
Part
F
of
Form
N-PORT
was
prepared
in
accordance
with
U.S.
generally
accepted
accounting
principles
(“U.S.
GAAP”)
and
in
conformity
with
the
applicable
rules
and
regulations
of
the
U.S.
Securities
and
Exchange
Commission
(“SEC”)
related
to
interim
filings.
Part
F
of
Form
N-PORT
does
not
include
all
information
and
footnotes
required
by
U.S.
GAAP
for
complete
financial
statements.
Certain
footnote
disclosures
normally
included
in
financial
statements
prepared
in
accordance
with
U.S.
GAAP
have
been
condensed
or
omitted
from
this
report
pursuant
to
the
rules
of
the
SEC.
For
a
full
set
of
the
Fund’s
notes
to
financial
statements,
please
refer
to
the
Fund’s
most
recently
filed
annual
or
semi-annual
report.
Fair
Value
Measurements
The
Fund’s
investments
in
securities
are
recorded
at
their
estimated
fair
value
utilizing
valuation
methods
approved
by
the
Board
of
Directors/
SHARES
DESCRIPTION
RATE
VALUE
RETAIL
REITS
(continued)
107,345
SITE
Centers
Corp
6.375
%
$
2,602,043
TOTAL
RETAIL
REITS
23,987,843
SELF-STORAGE
REITS
-
5.4%
74,661
National
Storage
Affiliates
Trust
6.000
1,865,779
227,370
Public
Storage
5.600
5,661,513
112,599
Public
Storage
5.050
2,792,455
88,555
Public
Storage
4.625
1,941,126
79,910
Public
Storage
4.875
1,858,707
72,365
Public
Storage
4.000
1,388,684
TOTAL
SELF-STORAGE
REITS
15,508,264
SINGLE-FAMILY
RESIDENTIAL
REITS
-
1.6%
102,970
American
Homes
4
Rent
6.250
2,579,399
63,105
American
Homes
4
Rent
5.875
1,594,663
12,175
UMH
Properties
Inc
6.375
293,296
TOTAL
SINGLE-FAMILY
RESIDENTIAL
REITS
4,467,358
TOTAL
REAL
ESTATE
INVESTMENT
TRUST
PREFERRED
STOCKS
(Cost
$117,343,208)
110,570,315
TOTAL
LONG-TERM
INVESTMENTS
(Cost
$310,518,143)
390,107,741
PRINCIPAL
DESCRIPTION
RATE
MATURITY
VALUE
SHORT-TERM
INVESTMENTS
-
4.1% (2.9%
of
Total
Investments)
X
11,600,489
REPURCHASE
AGREEMENTS
-
4.1%
(2.9%
of
Total
Investments)
X
11,600,489
$
11,600,489
(a)
Fixed
Income
Clearing
Corporation
1.520
10/01/24
$
11,600,489
TOTAL
REPURCHASE
AGREEMENTS
(Cost
$11,600,489)
11,600,489
TOTAL
SHORT-TERM
INVESTMENTS
(Cost
$11,600,489)
11,600,489
TOTAL
INVESTMENTS
-
140.9%
(Cost
$322,118,632
)
401,708,230
BORROWINGS
-
(39.4)%
(b),(c)
(112,400,000)
OTHER
ASSETS
&
LIABILITIES,
NET
- (1.5)%
(4,243,061)
NET
ASSETS
APPLICABLE
TO
COMMON
SHARES
-
100%
$
285,065,169
Interest
Rate
Swaps
-
OTC
Uncleared
Counterparty
Notional
Amount
Fund
Pay/Receive
Floating
Rate
Floating
Rate
Index
Fixed
Rate
(Annualized)
Fixed
Rate
Payment
Frequency
Effective
Date
(d)
Optional
Termination
Date
Maturity
Date
Value
Unrealized
Appreciation
(Depreciation)
Morgan
Stanley
$
72,400,000
Receive
SOFR
1.994%
Monthly
6/01/18
7/01/25
7/01/27
$
1,280,877
$
1,280,877
Portfolio
of
Investments
September
30,
2024
(continued)
JRS
Trustees.
Fair
value
is
defined
as
the
price
that
would
be
received
upon
selling
an
investment
or
transferring
a
liability
in
an
orderly
transaction
to
an
independent
buyer
in
the
principal
or
most
advantageous
market
for
the
investment.
U.S.
GAAP
establishes
the
three-tier
hierarchy
which
is
used
to
maximize
the
use
of
observable
market
data
and
minimize
the
use
of
unobservable
inputs
and
to
establish
classification
of
fair
value
measurements
for
disclosure
purposes.
Observable
inputs
reflect
the
assumptions
market
participants
would
use
in
pricing
the
asset
or
liability.
Observable
inputs
are
based
on
market
data
obtained
from
sources
independent
of
the
reporting
entity.
Unobservable
inputs
reflect
management’s
assumptions
about
the
assumptions
market
participants
would
use
in
pricing
the
asset
or
liability.
Unobservable
inputs
are
based
on
the
best
information
available
in
the
circumstances.
The
following
is
a
summary
of
the
three-tiered
hierarchy
of
valuation
input
levels.
Level
1
–
Inputs
are
unadjusted
and
prices
are
determined
using
quoted
prices
in
active
markets
for
identical
securities.
Level
2
–
Prices
are
determined
using
other
significant
observable
inputs
(including
quoted
prices
for
similar
securities,
interest
rates,
credit
spreads,
etc.).
Level
3
–
Prices
are
determined
using
significant
unobservable
inputs
(including
management’s
assumptions
in
determining
the
fair
value
of
investments).
The
following
table
summarizes
the
market
value
of
the
Fund's
investments
as
of
the
end
of
the
reporting
period,
based
on
the
inputs
used
to
value
them:
Level
1
Level
2
Level
3
Total
Long-Term
Investments:
Real
Estate
Investment
Trust
Common
Stocks
$
279,537,426
$
–
$
–
$
279,537,426
Real
Estate
Investment
Trust
Preferred
Stocks
110,570,315
–
–
110,570,315
Short-Term
Investments:
Repurchase
Agreements
–
11,600,489
–
11,600,489
Investments
in
Derivatives:
Interest
Rate
Swaps*
–
1,280,877
–
1,280,877
Total
$
390,107,741
$
12,881,366
$
–
$
402,989,107
*
Represents
net
unrealized
appreciation
(depreciation).
For
Fund
portfolio
compliance
purposes,
the
Fund’s
industry
classifications
refer
to
any
one
or
more
of
the
industry
sub-classifications
used
by
one
or
more
widely
recognized
market
indexes
or
ratings
group
indexes,
and/or
as
defined
by
Fund
management.
This
definition
may
not
apply
for
purposes
of
this
report,
which
may
combine
industry
sub-classifications
into
sectors
for
reporting
ease.
All
percentages
shown
in
the
Portfolio
of
Investments
are
based
on
net
assets
applicable
to
common
shares
unless
otherwise
noted.
(a)
Agreement
with
Fixed
Income
Clearing
Corporation,
1.520%
dated
9/30/24
to
be
repurchased
at
$11,600,979
on
10/1/24,
collateralized
by
Government
Agency
Securities,
with
coupon
rate
3.500%
and
maturity
date
9/30/26,
valued
at
$11,832,663.
(b)
Borrowings
as
a
percentage
of
Total
Investments
is
28.0%.
(c)
The
Fund
may
pledge
up
to
100%
of
its
eligible
investments
(excluding
any
investments
separately
pledged
as
collateral
for
specific
investments
in
derivatives,
when
applicable)
in
the
Portfolio
of
Investments
as
collateral
for
borrowings.
As
of
the
end
of
the
reporting
period,
investments
with
a
value
of
$209,857,407
have
been
pledged
as
collateral
for
borrowings.
(d)
Effective
date
represents
the
date
on
which
both
the
Fund
and
counterparty
commence
interest
payment
accruals
on
each
contract.
SOFR
Secured
Overnight
Financing
Rate
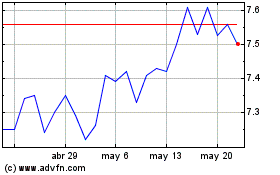
Nuveen Real Estate Income (NYSE:JRS)
Gráfica de Acción Histórica
De Nov 2024 a Dic 2024

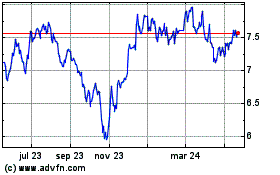
Nuveen Real Estate Income (NYSE:JRS)
Gráfica de Acción Histórica
De Dic 2023 a Dic 2024
