Robust margins and significant free cash flow
enable $200 million debt repayment
Positive progress at all growth projects including first gold
produced from Manh Choh
High-grade exploration results at Great Bear, Round Mountain and
Curlew
TORONTO, July 31, 2024 (GLOBE NEWSWIRE) --
Kinross Gold Corporation (TSX: K, NYSE: KGC) (“Kinross” or the
“Company”) today announced its results for the second quarter ended
June 30, 2024.
This news release contains forward-looking
information about expected future events and financial and
operating performance of the Company. We refer to the risks and
assumptions set out in our Cautionary Statement on Forward-Looking
Information located on pages 30 and 31 of this release. All dollar
amounts are expressed in U.S. dollars, unless otherwise
noted.
2024 second-quarter highlights:
- Guidance
reaffirmed: On an attributable basis, Kinross remains
on track to meet its 2024 annual guidance for production, cost of
sales, all-in sustaining cost and capital expenditures.
-
Production of 535,338 gold equivalent ounces (Au
eq. oz.).
-
Production cost of sales of $1,029 per Au eq. oz.
sold and all-in sustaining cost1 of
$1,387 per Au eq. oz. sold.
-
Margins2 increased to $1,313 per Au eq.
oz. sold, outpacing the rise in the average realized gold
price.
-
Operating cash flow of $604.0 million and
adjusted operating cash flow1 of $478.1
million. Attributable free
cash flow1 of $345.9 million.
-
Reported net earnings of $210.9 million, or $0.17
per share, with adjusted net earnings1
of $174.7 million, or $0.14 per share1.
- Balance sheet
strength: Kinross has improved its debt metrics, with
term loan repayments of $200.0 million. Total liquidity3
is approximately $2.1 billion, including cash and cash equivalents
of $480.0 million.
-
Kinross’ Board of Directors declared a
quarterly dividend of $0.03 per common share
payable on September 6, 2024, to shareholders of record at the
close of business on August 22, 2024.
- Climate Report:
Kinross released its 2023 Climate Report, providing a comprehensive
summary of its progress in 2023.
Operations:
- Tasiast,
Paracatu and La Coipa delivered
67% of total production, with production cost of sales of $848 per
Au eq. oz. sold and margins2 of $1,494 per Au eq. oz.
sold.
-
Sustained strong performance at Tasiast as the
mine continued to be the highest-margin operation in the portfolio,
generating significant free cash flow.
- Fort Knox
delivered a solid quarter, increasing production substantially at
lower costs compared with Q1 2024.
Development Projects and Exploration:
- At Great Bear,
Kinross remains on track to release a Preliminary Economic
Assessment (PEA) in September. During the quarter, Kinross drilled
the deepest drill hole to date, which returned 3.8m at 9.52 g/t at
a vertical depth of 1,575m, demonstrating robust mineralization at
depth, well outside the current resource.
- Manh
Choh achieved a significant milestone, on schedule, and
poured its first gold bar on July 8, 2024. Full commissioning of
the modifications at the Fort Knox mill is expected in the third
quarter and the project remains on track to deliver its planned
production this year.
- At Round
Mountain Phase X, the exploration decline
is progressing well with over 2,200 metres developed to date.
Extension drilling has intersected mineralization with strong
grades and widths outside of the primary exploration
target.
CEO commentary:
J. Paul Rollinson, CEO, made the following comments in relation
to 2024 second-quarter results:
“Kinross had another strong quarter supporting
an excellent first half of the year. Our portfolio of mines
performed well, delivering high-margin production, and we remain on
track to meet our annual production and cost guidance for 2024.
“Quarter-over-quarter, our margins2
grew by 21% to $1,313 per gold ounce sold, outpacing the rise in
gold price, and attributable free cash flow1 more than
doubled to $346 million, totalling $491 million year-to-date. We
are continuing to prudently manage our business with a focus on
maintaining our cost profile and capital discipline while
continuing to advance projects and exploration targets to drive
future value. We also continue to strengthen our investment grade
balance sheet and reduce debt.
“Thanks to the hard work of our team and
partners in Alaska, we achieved an important milestone, on
schedule, and poured the first gold bar from Manh Choh in
early July. The mine remains on plan, the Fort Knox mill is
performing well, and the project is expected to be fully
commissioned in Q3.
“At Great Bear, the drilling campaign continued
to demonstrate positive results, including intersecting high-grade
mineralization in the deepest drill hole to date, outside the
current resource. Permitting and engineering for both the AEX and
Main Project are continuing to advance, and we are looking forward
to releasing a Preliminary Economic Assessment in September.
“We are also pleased to have released our
2023 Climate Report. We are on
track to achieve our target of a 30% reduction in Scope 1 and Scope
2 GHG emissions intensity by 2030.”
Summary of financial and operating
results
|
|
|
|
|
|
|
|
Three months ended |
Six months ended |
|
|
June 30, |
June 30, |
|
(unaudited, in millions of U.S. dollars, except ounces, per share
amounts, and per ounce amounts) |
|
2024 |
|
2023 |
|
2024 |
|
2023 |
|
Operating Highlights |
|
|
|
|
|
Total gold equivalent ounces(a) |
|
|
|
|
Produced |
|
535,338 |
|
555,036 |
|
1,062,737 |
|
1,021,058 |
|
Sold |
|
520,760 |
|
552,969 |
|
1,043,160 |
|
1,043,299 |
|
|
|
|
|
|
|
Financial Highlights |
|
|
|
|
|
Metal sales |
$ |
1,219.5 |
$ |
1,092.3 |
$ |
2,301.0 |
$ |
2,021.6 |
|
Production cost of sales |
$ |
536.1 |
$ |
497.9 |
$ |
1,049.0 |
$ |
981.8 |
|
Depreciation, depletion and amortization |
$ |
295.8 |
$ |
239.3 |
$ |
566.5 |
$ |
451.2 |
|
Operating earnings |
$ |
298.3 |
$ |
237.8 |
$ |
491.5 |
$ |
381.7 |
|
Net earnings attributable to common shareholders |
$ |
210.9 |
$ |
151.0 |
$ |
317.9 |
$ |
241.2 |
|
Basic earnings per share attributable to common shareholders |
$ |
0.17 |
$ |
0.12 |
$ |
0.26 |
$ |
0.20 |
|
Diluted earnings per share attributable to common shareholders |
$ |
0.17 |
$ |
0.12 |
$ |
0.26 |
$ |
0.20 |
|
Adjusted net earnings attributable to common
shareholders(b) |
$ |
174.7 |
$ |
167.6 |
$ |
299.6 |
$ |
255.2 |
|
Adjusted net earnings per share(b) |
$ |
0.14 |
$ |
0.14 |
$ |
0.24 |
$ |
0.21 |
|
Net cash flow provided from operating activities |
$ |
604.0 |
$ |
528.6 |
$ |
978.4 |
$ |
787.6 |
|
Adjusted operating cash flow(b) |
$ |
478.1 |
$ |
459.1 |
$ |
903.0 |
$ |
791.9 |
|
Capital expenditures(c) |
$ |
274.2 |
$ |
281.9 |
$ |
516.1 |
$ |
503.1 |
|
Attributable(d) capital expenditures(b) |
$ |
264.5 |
$ |
272.3 |
$ |
496.6 |
$ |
484.9 |
|
Attributable(d) free cash flow(b) |
$ |
345.9 |
$ |
258.3 |
$ |
491.2 |
$ |
305.3 |
|
Average realized gold price per ounce(e) |
$ |
2,342 |
$ |
1,976 |
$ |
2,206 |
$ |
1,937 |
|
Production cost of sales per equivalent ounce(a)
sold(f)(g) |
$ |
1,029 |
$ |
900 |
$ |
1,006 |
$ |
941 |
|
Production cost of sales per ounce sold on a by-product
basis(b)(g) |
$ |
989 |
$ |
845 |
$ |
965 |
$ |
885 |
|
All-in sustaining cost per ounce sold on a by-product
basis(b)(g) |
$ |
1,357 |
$ |
1,262 |
$ |
1,319 |
$ |
1,272 |
|
All-in sustaining cost per equivalent ounce(a)
sold(b)(g) |
$ |
1,387 |
$ |
1,296 |
$ |
1,348 |
$ |
1,308 |
|
Attributable(d) all-in cost per ounce sold on a
by-product basis(b) |
$ |
1,756 |
$ |
1,596 |
$ |
1,685 |
$ |
1,606 |
|
Attributable(d) all-in cost per equivalent
ounce(a) sold(b) |
$ |
1,774 |
$ |
1,614 |
$ |
1,702 |
$ |
1,624 |
|
|
|
|
|
|
|
(a) “Gold equivalent ounces” include
silver ounces produced and sold converted to a gold equivalent
based on a ratio of the average spot market prices for the
commodities for each period. The ratio for the second quarter and
first six months of 2024 was 81.06:1 and 84.51:1, respectively
(second quarter and first six months of 2023 – 81.88:1 and 82.85:1,
respectively). |
|
(b) The definition and reconciliation of these
non-GAAP financial measures and ratios is included on pages [x] to
[x] of this report. Non-GAAP financial measures and ratios have no
standardized meaning under International Financial Reporting
Standards (“IFRS”) and therefore, may not be comparable to similar
measures presented by other issuers. |
|
(c) “Capital expenditures” is as reported as
“Additions to property, plant and equipment” on the interim
condensed consolidated statements of cash flows. |
|
(d) “Attributable” includes Kinross’ 70% share of
Manh Choh costs, capital expenditures and cash flow, as
appropriate. |
|
(e) “Average realized gold price per
ounce” is defined as gold metal sales divided by total gold ounces
sold. |
|
(f) “Production cost of sales per
equivalent ounce sold” is defined as production cost of sales
divided by total gold equivalent ounces sold. |
|
(g) As production from Manh Choh
commenced in July 2024, production cost of sales and attributable
all-in sustaining cost figures and ratios for Manh Choh are nil for
all periods presented. As a result, production cost of sales and
all-in sustaining cost figures and ratios are equal to attributable
production cost of sales and attributable all-in sustaining cost
figures and ratios, as applicable. |
|
|
|
The following operating and financial results
are based on second-quarter gold equivalent production:
Production: Kinross produced
535,338 Au eq. oz. in Q2 2024, compared with 555,036 Au eq. oz. in
Q2 2023. The 4% year-over-year decrease was primarily due to lower
grades at Paracatu according to the planned mining sequence.
Average realized gold
price4: The average realized gold price in Q2
2024 was $2,342 per ounce, compared with $1,976 per ounce in Q2
2023.
Revenue: During the second
quarter, revenue increased to $1,219.5 million, compared with
$1,092.3 million during Q2 2023.
Production cost of sales:
Production cost of sales per Au eq. oz. sold increased to $1,029
for the quarter, compared with $900 in Q2 2023.
Production cost of sales per Au oz. sold on a
by-product basis1 was $989 in Q2 2024, compared with
$845 in Q2 2023, based on gold sales of 505,122 ounces and
silver sales of 1,267,528 ounces.
Margins2: Kinross’
margin per Au eq. oz. sold increased by 22% to $1,313 for Q2 2024,
compared with the Q2 2023 margin of $1,076, outpacing the 19%
increase in average realized gold price4.
All-in sustaining
cost1: All-in sustaining cost per Au eq. oz.
sold was $1,387 in Q2 2024, compared with $1,296 in Q2 2023.
In Q2 2024, all-in sustaining cost per Au oz.
sold on a by-product basis was $1,357, compared with $1,262 in Q2
2023.
Operating cash flow: Operating
cash flow was $604.0 million for Q2 2024, compared with $528.6
million for Q2 2023.
Adjusted operating cash flow1 for Q2
2024 was $478.1 million, compared with $459.1 million for Q2
2023.
Attributable free cash
flow1: Attributable free cash flow increased by
34% to $345.9 million in Q2 2024, compared with $258.3 million in
Q2 2023.
Earnings: Reported net earnings
increased by 40% to $210.9 million for Q2 2024, or $0.17 per share,
compared with reported net earnings of $151.0 million, or $0.12 per
share, for Q2 2023.
Adjusted net earnings1 increased to
$174.7 million, or $0.14 per share1, for Q2 2024,
compared with $167.6 million, or $0.14 per share1, for
Q2 2023.
Attributable capital
expenditures1: Attributable capital
expenditures were $264.5 million for Q2 2024, compared with $272.3
million for Q2 2023, primarily due to a decrease in capital
development at Bald Mountain and La Coipa, partially offset by
capital development at Round Mountain Phase S.
Balance sheet
The Company maintained its investment grade
ratings and strengthened its balance sheet during the second
quarter, including repaying $200.0 million on its term loan.
Kinross had cash and cash equivalents of $480.0
million as of June 30, 2024, compared with $352.4 million at
December 31, 2023.
The Company has additional available
credit5 of $1.65 billion and total liquidity3
of approximately $2.1 billion.
Dividend
As part of its quarterly dividend program, the
Board of Directors declared a dividend of $0.03 per common share
payable on September 6, 2024, to shareholders of record as of
August 22, 2024.
Operating results
Mine-by-mine summaries for 2024 second-quarter
operating results may be found on pages 10 and 14 of this news
release. Highlights include the following:
Tasiast continued its
consistent and solid performance, with production increasing
compared with Q1 2024 mainly due to higher grades and record mill
throughput, while cost of sales per ounce sold remained largely in
line. Production increased compared with Q2 2023 mainly as a result
of the completion of the Tasiast 24k project in the second half of
2023, and cost of sales per ounce sold was in line.
At Paracatu, production
increased quarter-over-quarter mainly due to higher grades and
recoveries, while cost of sales per ounce sold decreased mainly due
to the higher production. Production was lower compared with Q2
2023 mainly due to lower grades according to the planned mining
sequence, and cost of sales per ounce sold was higher mainly due to
the decrease in grade and production.
At La Coipa, production was
lower quarter-over-quarter mainly due to a decrease in grades and
recoveries, and cost of sales per ounce sold was higher mainly due
to higher mill maintenance costs and timing of sales. Production
was largely in line year-over-year, and cost of sales per ounce
sold was higher primarily due to a lower proportion of mining
activities related to capital development and higher mill
maintenance costs.
In the second quarter, strong grades and
recovery offset lower throughput. The operation continued to
generate robust cash flow, and full-year production guidance
remains on track. The Company is completing mill maintenance work
aimed at increasing long-term plant reliability.
At Fort Knox, production
increased significantly compared with the previous quarter mainly
due to an increase in mill throughput, grades and recoveries, and
was in line year-over-year. Cost of sales per ounce sold decreased
compared with the previous quarter mainly due to the increase in
production, and cost of sales per ounce sold increased
year-over-year due to higher contractor and labour costs.
At Round Mountain, production
decreased quarter-over-quarter mainly due to lower mill throughput
and grades, and increased year-over-year mainly due to higher mill
grades. Cost of sales per ounce sold was higher
quarter-over-quarter mainly due to the decrease in production, and
year-over-year as a result of higher cost ounces produced from the
heap leach pads, partially offset by lower reagent and contractor
costs.
At Bald Mountain, production
was slightly lower compared with the previous quarter and increased
year-over-year due to the timing of ounces recovered from the heap
leach pads. Cost of sales per ounce sold was higher
quarter-over-quarter primarily as a result of higher maintenance
costs, and largely in line year-over-year.
Development Projects and
Exploration
Great Bear
At the Great Bear project, the
Company’s robust exploration program continues to make excellent
progress, execution planning for the Advanced Exploration (AEX)
program is well underway, permitting continues to advance, and the
PEA is expected to be released in September 2024.
The drilling results described below (true
width) continue to support the view of a high-grade, long-life
mining complex at Great Bear, with recent results showing extension
of mineralization at depth across multiple zones.
At Yuma, the deepest drill hole on the property
to date, BR-888C2, has intersected 3.8m @ 9.52 g/t Au, along the
predicted plunge of the zone at a vertical depth of 1,575m below
surface. Also at Yuma, drill hole BR-695C3A intersected 10.3m @
23.76 g/t at 1,285m vertical depth.
At Yauro, recent successful results received
follow-up drill testing this quarter. Of note, drill hole BR-770C3
intersected 22.7m @ 6.51 g/t at a vertical depth of 1,000m below
surface demonstrating continuity of mineralization at depth.
Mineralization at Discovery continues to expand
with recent drill results, including BR-896 and BR-898A, which
intersected 5.4m @ 7.82 g/t at 700m vertical depth and 5.2m @ 3.92
g/t at 780m vertical depth, respectively.
Drilling at Hinge and Limb this quarter has
returned promising results for depth extension at both zones,
providing optionality to supplement LP production in the future. At
Hinge, drill holes DL-132C1 and DL-132C4 crossed quartz veins
containing high-grade mineralization with DL-132C1 intersecting
3.1m @ 9.33 g/t at 850m vertical depth and DL-132C4 intersecting
3.1m @ 22.65 g/t at 865m vertical depth. At Limb, drill holes
DL-132C1 and DL-132C3 intersected 5.0m @ 5.52 g/t at 720m vertical
depth and 2.4m @ 4.54 g/t at 800m vertical depth, directly below
the existing resource indicating mineralization remains open at
depth.
The 2024 drill program will continue to target
mineralization below the existing mineral resource, explore for
additional deposits along strike, and expand the Red Lake style
mineralization at Hinge and Limb.
Notable exploration results at Great Bear in the second quarter
include:
- BR-695C3A (Yuma)
10.3m @ 23.76 g/t Au at a vertical depth of 1,285m
- including 3.6m @
65.51 g/t Au
- BR-770C3 (Yauro)
22.7m @ 6.51 g/t Au at a vertical depth of 1,000m
- including 3.5m @
37.83 g/t Au
- BR-888C2 (Yuma)
10.7m @ 3.88 g/t Au at a vertical depth of 1,575m
- including 3.8m @
9.52 g/t Au
- BR-896 (Discovery)
5.4m @ 7.82 g/t Au at a vertical depth of 700m
- BR-898A (Discovery)
5.2m @ 3.92 g/t Au at a vertical depth of 780m
- DL-132C1 (Hinge)
3.1m @ 9.33 g/t Au at a vertical depth of 850m
- and (Limb) 5.0m @
5.52 g/t Au at a vertical depth of 720m
- DL-132C3 (Limb) 2.4m
@ 4.54 g/t Au at a vertical depth of 800m
- DL-132C4 (Hinge)
3.1m @ 22.65 g/t Au at a vertical depth of 865m
For the AEX program, permitting, detailed
engineering, execution planning, and procurement continue to
advance. Kinross is targeting the start of surface construction in
the second half of 2024. Construction of the underground decline is
planned to commence in mid-2025.
For the Main Project, Kinross continues to
advance technical studies, including engineering and field test
work campaigns. In the last quarter, metallurgical, geochemistry
and backfill test work was advanced to continue building technical
knowledge and provide input into engineering studies.
Kinross is on track to release its PEA in
September 2024. The PEA will provide visibility into the potential
production scale, construction capital, all-in sustaining cost and
margins for both the open pit and the underground. The PEA will
only include a subset of the ounces in the measured, indicated, and
inferred resources drilled to date.
The Draft Tailored Impact Statement Guidelines
for the Main Project were received from the Impact Assessment
Agency of Canada in Q2 2024, as planned, and the Federal Impact
Assessment is underway. Studies are ongoing and the Company expects
to file its Impact Statement in the first half of 2025.
Selected Great Bear Drill
Results
See Appendix A for full results.
Hole ID
|
|
From
(m) |
To
(m) |
Width
(m) |
True
Width (m) |
Au (g/t) |
Target
|
|
BR-695C3A |
|
1,523.1 |
1,526.1 |
3.0 |
2.3 |
0.50 |
Yuma |
|
BR-695C3A |
|
1,539.6 |
1,542.6 |
3.0 |
2.3 |
0.92 |
|
|
BR-695C3A |
|
1,552.9 |
1,566.6 |
13.8 |
10.3 |
23.76 |
|
|
BR-695C3A |
Including |
1,553.9 |
1,558.8 |
4.8 |
3.6 |
65.51 |
|
|
BR-770C3 |
|
1,308.4 |
1,312.2 |
3.9 |
3.0 |
0.60 |
Yauro |
|
BR-770C3 |
|
1,317.9 |
1,334.0 |
16.2 |
12.4 |
0.49 |
|
|
BR-770C3 |
|
1,353.1 |
1,382.5 |
29.5 |
22.7 |
6.51 |
|
|
BR-770C3 |
Including |
1,357.6 |
1,362.1 |
4.5 |
3.5 |
37.83 |
|
|
BR-770C3 |
|
1,393.5 |
1,396.5 |
3.0 |
2.3 |
0.69 |
|
|
BR-770C3 |
|
1,409.5 |
1,417.0 |
7.5 |
5.8 |
0.85 |
|
|
BR-770C3 |
|
1,440.5 |
1,445.5 |
5.0 |
3.9 |
0.57 |
|
|
BR-770C3 |
|
1,456.4 |
1,483.4 |
27.0 |
20.8 |
0.53 |
|
|
BR-770C3 |
|
1,570.7 |
1,574.5 |
3.8 |
2.9 |
1.75 |
|
|
BR-770C3 |
|
1,601.7 |
1,614.8 |
13.1 |
10.1 |
0.57 |
|
|
BR-888C2 |
|
1,990.4 |
1,997.2 |
6.9 |
6.0 |
0.69 |
Yuma |
|
BR-888C2 |
|
2,008.2 |
2,020.6 |
12.3 |
10.7 |
3.88 |
|
|
BR-888C2 |
Including |
2,009.3 |
2,013.6 |
4.3 |
3.8 |
9.52 |
|
|
BR-896 |
|
860.4 |
916.7 |
56.3 |
44.5 |
1.86 |
Discovery |
|
BR-896 |
Including |
881.6 |
888.4 |
6.8 |
5.4 |
7.82 |
|
|
BR-896 |
|
1,132.3 |
1,133.8 |
1.5 |
1.2 |
27.60 |
|
|
BR-898A |
|
880.5 |
936.0 |
55.6 |
48.9 |
1.01 |
Discovery |
|
BR-898A |
Including |
928.6 |
934.5 |
5.9 |
5.2 |
3.92 |
|
|
BR-898A |
|
978.0 |
986.3 |
8.3 |
7.3 |
0.47 |
|
|
BR-898A |
|
997.3 |
1,008.6 |
11.4 |
10.0 |
1.36 |
|
|
BR-898A |
|
1,014.0 |
1,043.0 |
29.0 |
25.5 |
2.30 |
|
|
BR-898A |
Including |
1,032.0 |
1,034.3 |
2.3 |
2.0 |
3.13 |
|
|
BR-898A |
And including |
1,039.5 |
1,041.5 |
2.0 |
1.8 |
15.56 |
|
|
BR-898A |
|
1,060.5 |
1,065.0 |
4.5 |
4.0 |
0.68 |
|
|
DL-132C1 |
|
859.5 |
871.5 |
12.1 |
10.2 |
2.88 |
Hinge/Limb |
|
DL-132C1 |
Including |
859.5 |
865.4 |
5.9 |
5.0 |
5.52 |
|
|
DL-132C1 |
|
1,044.7 |
1,051.5 |
6.8 |
5.8 |
5.47 |
|
|
DL-132C1 |
Including |
1,044.7 |
1,048.3 |
3.6 |
3.1 |
9.33 |
|
|
DL-132C1 |
|
1,136.6 |
1,140.7 |
4.1 |
3.4 |
1.18 |
|
|
DL-132C3 |
|
913.4 |
925.4 |
12.1 |
9.8 |
1.61 |
Limb |
|
DL-132C3 |
Including |
920.1 |
923.0 |
3.0 |
2.4 |
4.54 |
|
|
DL-132C4 |
|
885.3 |
888.7 |
3.5 |
2.9 |
0.55 |
Hinge |
|
DL-132C4 |
|
1,043.1 |
1,059.0 |
15.9 |
13.4 |
6.08 |
|
|
DL-132C4 |
Including |
1,043.1 |
1,046.8 |
3.7 |
3.1 |
22.65 |
|
Results are preliminary in nature and are subject to
on-going QA/QC. Lengths are subject to rounding.
See Appendix B for a LP long section.
Fort Knox – Manh Choh
At the Kinross-operated, 70%-owned Manh
Choh project, processing of ore at the Fort Knox mill
began in early July and the first gold bar was poured on July 8,
2024, during a ceremony with the Native Village of Tetlin and
Lieutenant Governor of Alaska, Nancy Dahlstrom. Ore transportation
has ramped up to planned volumes, full commissioning of the mill
modifications is expected to be completed in Q3, and the project
remains on track to deliver planned production this year.
Round Mountain
The extension work at Round
Mountain is advancing well. At Phase S,
mining remains on plan. For the heap leach pad expansion,
earthworks and procurement are both complete while deployment of
the geomembrane and overliner is advancing.
At Phase X, development of the
exploration decline is progressing well, with over 2,200
metres developed to date. Infill drilling on the primary Phase
X target began during the second quarter, as planned, alongside
continued opportunity drilling outside of the primary Phase X
exploration target to extend zones of mineralization. The Company
expects to begin receiving the results from within the target
mineralization in the third quarter.
The drilling in Q2 has shown exciting results,
demonstrating strong grades and widths:
- DX-0052 (from 0m to
32.4m): 32.4m @ 29.6g/t Au Eq
- DX-0052 (from 40.5m
to 63.4m): 22.9m @ 11.5 g/t Au Eq
- DX-0053: 18.9m @
12.3g/t Au Eq
- DX-0040: 20.1m @ 6.5
g/t Au Eq
- DX-0054: 14.6m @ 5.3
g/t Au Eq
These results continue to indicate upside potential for
expansion of the target area for mineralization and for the
potential of future mining at Phase X. Watch a Round Mountain
Phase X animation here.
Curlew Basin exploration
At Curlew, Kinross’ exploration program
continued to show positive results at both the Stealth and
Roadrunner zones.
Results at Stealth continued to show zones of
wider mineralization with strong grades. Drilling is still underway
and will continue through the second half of the year. Intercepts
to date in 2024 include (true width):
- 1447: 18.7m @ 13.7 g/t Au,
includes 4.7m @ 19.4 g/t Au, and 1.4m @ 22.2 g/t Au
- 1447: 6.1m @ 20.9 g/t Au,
includes 1.5m @ 56.7 g/t Au
- 1448: 4.6m @ 14.3 g/t Au,
includes 1.5m @ 20.7 g/t Au
Delineation drilling at the Roadrunner zone
continues with drilling from both surface and underground platforms
to document the geometry and continuity. The mineralization at
Roadrunner was intercepted again in Q2, as highlighted below:
Chile
Kinross’ activities in Chile are currently
focused on La Coipa and potential opportunities to extend its mine
life. The Lobo-Marte project continues to provide
optionality as a potential large, low-cost mine upon the conclusion
of mining at La Coipa. While the Company focuses its technical
resources on La Coipa, it will continue to engage and build
relationships with communities related to Lobo-Marte and government
stakeholders.
Sustainability
Kinross published its 2023 Climate Report, providing
comprehensive climate-related disclosures and the Company’s
greenhouse gas (GHG) emissions data for 2023. The Climate Report
can be accessed here: www.kinross.com/2023-Climate-Report
Kinross continued to advance its Climate Change
Strategy during 2023 and is on track to achieve its goal of a 30%
reduction in Scope 1 and Scope 2 GHG emissions intensity per ounce,
over the 2021 baseline, by 2030. Efforts will continue to further
reduce emissions intensity. The Climate Report details the
Company’s progress towards the targets outlined in the United
Nations Framework Convention on Climate Change (UNFCCC) Paris
Agreement and our performance on Kinross’ Climate Change
Strategy.
The Climate Report continues to adhere to
reporting best practices and ensure that stakeholders have
comprehensive information about Kinross’ global efforts to reduce
emissions and address the impacts of climate change. Reporting has
been in alignment with the Global Reporting Initiative (GRI)
Standards since 2007, and in alignment with the recommendations of
the Task Force on Climate-related Financial Disclosures (TCFD)
since 2020. The 2023 Climate Report begins the process of alignment
with the International Sustainability Standards Board’s IFRS S2
Climate-Related Disclosures standard, which replaces the previous
TCFD framework.
Across the Kinross portfolio, all sites and
projects maintained a focus on managing climate risk, proactively
developing solutions for energy efficiency and contributing to
resiliency in host communities. An update of climate risk was
completed for all sites and the Company’s renewable energy strategy
progressed well, including the completion of a solar power plant at
Tasiast. The Company contributed to community resiliency through
continued development of solar energy solutions for Colla
indigenous communities in Chile, provision of water for
semi-nomadic communities near Tasiast, and ongoing engagement with
communities and farmers in Paracatu, through the local watershed
committee.
Climate-related opportunities are being
considered in the planning for the Great Bear project, where the
Company is focused on integrating best practices in energy
efficiency and low-carbon emissions technologies, mining techniques
and environmental stewardship. Energy considerations are being
embedded in the proposed design with a focus on mine and mill
process optimization, studying electrification of the underground,
and energy efficient infrastructure. In the surface design, there
is a strong focus on water management, water treatment and water
stewardship. Additional design considerations for Great Bear will
be reflected in its PEA.
Conference call details
In connection with this news release, Kinross
will hold a conference call and audio webcast on Thursday, August
1, 2024, at 8:00 a.m. EDT to discuss the results, followed by a
question-and-answer session. To access the call, please dial:
Canada & US toll-free – 1
(888) 596-4144; Passcode: 5766018
Outside of Canada & US – 1 (646) 968-2525;
Passcode: 5766018
Replay (available up to 14 days after the
call):
Canada & US toll-free – 1
(800) 770-2030; Passcode: 5766018
Outside of Canada & US – 1 (647) 362-9199;
Passcode: 5766018
You may also access the conference call on a
listen-only basis via webcast at our website www.kinross.com. The
audio webcast will be archived on www.kinross.com.
About Kinross Gold Corporation
Kinross is a Canadian-based global senior gold
mining company with operations and projects in the United States,
Brazil, Mauritania, Chile and Canada. Our focus is on delivering
value based on the core principles of responsible mining,
operational excellence, disciplined growth, and balance sheet
strength. Kinross maintains listings on the Toronto Stock Exchange
(symbol: K) and the New York Stock Exchange (symbol: KGC).
Media Contact
Victoria Barrington
Senior Director, Corporate Communications
phone: 647-788-4153
victoria.barrington@kinross.com
Investor Relations Contact
Chris Lichtenheldt
Vice-President, Investor Relations
phone: 416-365-2761
chris.lichtenheldt@kinross.com
Review of operations
|
|
|
|
|
|
|
|
|
|
|
|
|
|
Three months ended June 30, (unaudited) |
|
Gold equivalent ounces |
|
|
|
|
|
|
|
|
|
Produced |
|
Sold |
|
Production cost of sales
($millions) |
|
Production cost of
sales/equivalent ounce sold |
|
|
2024 |
2023 |
|
2024 |
2023 |
|
2024 |
2023 |
|
2024 |
2023 |
|
|
|
|
|
|
|
|
|
|
|
|
|
|
Tasiast |
161,629 |
157,844 |
|
156,038 |
152,564 |
|
102.3 |
99.5 |
|
656 |
652 |
|
Paracatu |
130,228 |
164,243 |
|
130,174 |
163,889 |
|
135.2 |
135.2 |
|
1,039 |
825 |
|
La Coipa |
65,851 |
66,744 |
|
63,506 |
67,378 |
|
58.8 |
43.6 |
|
926 |
647 |
|
|
|
|
|
|
|
|
|
|
|
|
|
|
Fort Knox |
69,914 |
69,438 |
|
70,477 |
69,206 |
|
94.8 |
79.3 |
|
1,345 |
1,146 |
|
Round Mountain |
61,787 |
57,446 |
|
60,049 |
57,412 |
|
93.9 |
85.5 |
|
1,564 |
1,489 |
|
Bald Mountain |
45,929 |
39,321 |
|
39,818 |
42,181 |
|
50.6 |
54.5 |
|
1,271 |
1,292 |
|
United States Total |
177,630 |
166,205 |
|
170,344 |
168,799 |
|
239.3 |
219.3 |
|
1,405 |
1,299 |
|
|
|
|
|
|
|
|
|
|
|
|
|
|
Maricunga |
- |
- |
|
698 |
339 |
|
0.5 |
0.3 |
|
716 |
885 |
|
|
|
|
|
|
|
|
|
|
|
|
|
|
Operations Total |
535,338 |
555,036 |
|
520,760 |
552,969 |
|
536.1 |
497.9 |
|
1,029 |
900 |
|
|
|
|
|
|
|
|
|
|
|
|
|
|
|
|
|
|
|
|
|
|
|
|
|
|
|
|
|
|
|
|
|
|
|
|
|
|
|
|
|
|
Six months ended June 30, (unaudited) |
|
Gold equivalent ounces |
|
|
|
|
|
|
|
|
|
Produced |
|
Sold |
|
Production cost of sales
($millions) |
|
Production cost of
sales/equivalent ounce sold |
|
|
2024 |
2023 |
|
2024 |
2023 |
|
2024 |
2023 |
|
2024 |
2023 |
|
|
|
|
|
|
|
|
|
|
|
|
|
|
Tasiast |
320,828 |
288,889 |
|
307,052 |
281,043 |
|
202.0 |
187.9 |
|
658 |
669 |
|
Paracatu |
258,501 |
287,577 |
|
258,284 |
292,233 |
|
270.9 |
253.2 |
|
1,049 |
866 |
|
La Coipa |
137,096 |
120,340 |
|
134,631 |
129,158 |
|
110.9 |
88.5 |
|
824 |
685 |
|
|
|
|
|
|
|
|
|
|
|
|
|
|
Fort Knox |
123,264 |
134,825 |
|
126,769 |
134,610 |
|
177.3 |
156.9 |
|
1,399 |
1,166 |
|
Round Mountain |
130,139 |
116,278 |
|
128,218 |
115,638 |
|
184.5 |
182.0 |
|
1,439 |
1,574 |
|
Bald Mountain |
92,909 |
73,149 |
|
87,059 |
89,464 |
|
102.7 |
112.5 |
|
1,180 |
1,257 |
|
United States Total |
346,312 |
324,252 |
|
342,046 |
339,712 |
|
464.5 |
451.4 |
|
1,358 |
1,329 |
|
|
|
|
|
|
|
|
|
|
|
|
|
|
Maricunga |
- |
- |
|
1,147 |
1,153 |
|
0.7 |
0.8 |
|
610 |
694 |
|
|
|
|
|
|
|
|
|
|
|
|
|
|
Operations Total |
1,062,737 |
1,021,058 |
|
1,043,160 |
1,043,299 |
|
1,049.0 |
981.8 |
|
1,006 |
941 |
|
|
|
|
|
|
|
|
|
|
|
|
Interim condensed consolidated balance sheets
|
|
|
|
|
|
|
(unaudited, expressed in millions of U.S. dollars, except share
amounts) |
|
|
|
|
|
|
|
|
As at |
|
|
|
June 30, |
|
December 31, |
|
|
|
2024 |
|
|
|
2023 |
|
|
|
|
|
|
|
|
|
Assets |
|
|
|
|
|
Current assets |
|
|
|
|
|
Cash and cash equivalents |
$ |
480.0 |
|
|
$ |
352.4 |
|
|
|
Restricted cash |
|
9.5 |
|
|
|
9.8 |
|
|
|
Accounts receivable and other assets |
|
276.9 |
|
|
|
268.7 |
|
|
|
Current income tax recoverable |
|
1.5 |
|
|
|
3.4 |
|
|
|
Inventories |
|
1,144.0 |
|
|
|
1,153.0 |
|
|
|
Unrealized fair value of derivative assets |
|
16.5 |
|
|
|
15.0 |
|
|
|
|
|
1,928.4 |
|
|
|
1,802.3 |
|
|
|
Non-current assets |
|
|
|
|
|
Property, plant and equipment |
|
7,922.6 |
|
|
|
7,963.2 |
|
|
|
Long-term investments |
|
53.0 |
|
|
|
54.7 |
|
|
|
Other long-term assets |
|
722.6 |
|
|
|
710.6 |
|
|
|
Deferred tax assets |
|
12.6 |
|
|
|
12.5 |
|
|
|
Total assets |
$ |
10,639.2 |
|
|
$ |
10,543.3 |
|
|
|
|
|
|
|
|
|
Liabilities |
|
|
|
|
|
Current liabilities |
|
|
|
|
|
Accounts payable and accrued liabilities |
$ |
546.9 |
|
|
$ |
531.5 |
|
|
|
Current income tax payable |
|
110.1 |
|
|
|
92.9 |
|
|
|
Current portion of long-term debt and credit facilities |
|
799.5 |
|
|
|
- |
|
|
|
Current portion of provisions |
|
49.9 |
|
|
|
48.8 |
|
|
|
Other current liabilities |
|
10.6 |
|
|
|
12.3 |
|
|
|
|
|
1,517.0 |
|
|
|
685.5 |
|
|
|
Non-current liabilities |
|
|
|
|
|
Long-term debt and credit facilities |
|
1,234.5 |
|
|
|
2,232.6 |
|
|
|
Provisions |
|
900.4 |
|
|
|
889.9 |
|
|
|
Long-term lease liabilities |
|
15.4 |
|
|
|
17.5 |
|
|
|
Other long-term liabilities |
|
89.3 |
|
|
|
82.4 |
|
|
|
Deferred tax liabilities |
|
435.2 |
|
|
|
449.7 |
|
|
|
Total liabilities |
$ |
4,191.8 |
|
|
$ |
4,357.6 |
|
|
|
|
|
|
|
|
|
Equity |
|
|
|
|
|
Common shareholders' equity |
|
|
|
|
|
Common share capital |
$ |
4,486.7 |
|
|
$ |
4,481.6 |
|
|
|
Contributed surplus |
|
10,640.4 |
|
|
|
10,646.0 |
|
|
|
Accumulated deficit |
|
(8,738.4 |
) |
|
|
(8,982.6 |
) |
|
|
Accumulated other comprehensive loss |
|
(68.6 |
) |
|
|
(61.3 |
) |
|
|
Total common shareholders' equity |
|
6,320.1 |
|
|
|
6,083.7 |
|
|
|
Non-controlling interests |
|
127.3 |
|
|
|
102.0 |
|
|
|
Total equity |
$ |
6,447.4 |
|
|
$ |
6,185.7 |
|
|
|
Total liabilities and equity |
$ |
10,639.2 |
|
|
$ |
10,543.3 |
|
|
|
|
|
|
|
|
|
Common shares |
|
|
|
|
|
Authorized |
|
Unlimited
|
|
Unlimited |
|
|
Issued and outstanding |
|
1,229,025,839
|
|
|
1,227,837,974 |
|
|
|
|
|
|
|
Interim condensed consolidated statements of
operations
|
|
|
|
|
|
|
|
|
|
|
(unaudited, expressed in millions of U.S. dollars, except per
share amounts) |
|
|
|
|
|
|
Three months ended |
|
Six months ended |
|
|
|
June 30, |
|
June 30, |
|
June 30, |
|
June 30, |
|
|
|
|
2024 |
|
|
|
2023 |
|
|
|
2024 |
|
|
|
2023 |
|
|
|
Revenue |
|
|
|
|
|
|
|
|
|
Metal sales |
$ |
1,219.5 |
|
|
$ |
1,092.3 |
|
|
$ |
2,301.0 |
|
|
$ |
2,021.6 |
|
|
|
|
|
|
|
|
|
|
|
|
|
Cost of sales |
|
|
|
|
|
|
|
|
|
Production cost of sales |
|
536.1 |
|
|
|
497.9 |
|
|
|
1,049.0 |
|
|
|
981.8 |
|
|
|
Depreciation, depletion and amortization |
|
295.8 |
|
|
|
239.3 |
|
|
|
566.5 |
|
|
|
451.2 |
|
|
|
Total cost of sales |
|
831.9 |
|
|
|
737.2 |
|
|
|
1,615.5 |
|
|
|
1,433.0 |
|
|
|
Gross profit |
|
387.6 |
|
|
|
355.1 |
|
|
|
685.5 |
|
|
|
588.6 |
|
|
|
Other operating expense |
|
1.9 |
|
|
|
36.0 |
|
|
|
29.5 |
|
|
|
67.2 |
|
|
|
Exploration and business development |
|
55.7 |
|
|
|
49.3 |
|
|
|
97.4 |
|
|
|
83.3 |
|
|
|
General and administrative |
|
31.7 |
|
|
|
32.0 |
|
|
|
67.1 |
|
|
|
56.4 |
|
|
|
Operating earnings |
|
298.3 |
|
|
|
237.8 |
|
|
|
491.5 |
|
|
|
381.7 |
|
|
|
Other income (expense) - net |
|
5.7 |
|
|
|
(10.4 |
) |
|
|
5.8 |
|
|
|
(6.0 |
) |
|
|
Finance income |
|
4.5 |
|
|
|
11.5 |
|
|
|
8.4 |
|
|
|
20.9 |
|
|
|
Finance expense |
|
(21.8 |
) |
|
|
(26.0 |
) |
|
|
(43.3 |
) |
|
|
(53.5 |
) |
|
|
Earnings before tax |
|
286.7 |
|
|
|
212.9 |
|
|
|
462.4 |
|
|
|
343.1 |
|
|
|
Income tax expense - net |
|
(77.8 |
) |
|
|
(62.0 |
) |
|
|
(146.9 |
) |
|
|
(101.8 |
) |
|
|
Net earnings |
$ |
208.9 |
|
|
$ |
150.9 |
|
|
$ |
315.5 |
|
|
$ |
241.3 |
|
|
|
Net earnings (loss) from continuing operations attributable
to: |
|
|
|
|
|
|
|
|
|
Non-controlling interests |
$ |
(2.0 |
) |
|
$ |
(0.1 |
) |
|
$ |
(2.4 |
) |
|
$ |
0.1 |
|
|
|
Common shareholders |
$ |
210.9 |
|
|
$ |
151.0 |
|
|
$ |
317.9 |
|
|
$ |
241.2 |
|
|
|
Earnings per share attributable to common
shareholders |
|
|
|
|
|
|
|
|
|
Basic |
$ |
0.17 |
|
|
$ |
0.12 |
|
|
$ |
0.26 |
|
|
$ |
0.20 |
|
|
|
Diluted |
$ |
0.17 |
|
|
$ |
0.12 |
|
|
$ |
0.26 |
|
|
$ |
0.20 |
|
|
|
|
|
|
|
|
|
|
|
|
Interim condensed consolidated statements of cash
flows
|
|
|
|
|
|
|
|
|
|
|
(unaudited, expressed in millions of U.S. dollars) |
|
|
|
|
|
|
|
|
|
|
Three months ended |
|
Six months ended |
|
|
|
June 30, |
|
June 30, |
|
June 30, |
|
June 30, |
|
|
|
|
2024 |
|
|
|
2023 |
|
|
|
2024 |
|
|
|
2023 |
|
|
|
Net inflow (outflow) of cash related to the following
activities: |
|
|
|
|
|
|
|
|
|
Operating: |
|
|
|
|
|
|
|
|
|
Net earnings |
$ |
208.9 |
|
|
$ |
150.9 |
|
|
$ |
315.5 |
|
|
$ |
241.3 |
|
|
|
Adjustments to reconcile net earnings to net cash provided from
operating activities: |
|
|
|
|
|
|
|
|
|
Depreciation, depletion and amortization |
|
295.8 |
|
|
|
239.3 |
|
|
|
566.5 |
|
|
|
451.2 |
|
|
|
Share-based compensation expense |
|
2.8 |
|
|
|
2.0 |
|
|
|
5.3 |
|
|
|
1.4 |
|
|
|
Finance expense |
|
21.8 |
|
|
|
26.0 |
|
|
|
43.3 |
|
|
|
53.5 |
|
|
|
Deferred tax (recovery) expense |
|
(21.2 |
) |
|
|
9.7 |
|
|
|
(12.6 |
) |
|
|
18.7 |
|
|
|
Foreign exchange losses (gains) and other |
|
(7.1 |
) |
|
|
31.2 |
|
|
|
7.9 |
|
|
|
21.8 |
|
|
|
Reclamation expense |
|
- |
|
|
|
- |
|
|
|
- |
|
|
|
4.0 |
|
|
|
Changes in operating assets and liabilities: |
|
|
|
|
|
|
|
|
|
Accounts receivable and other assets |
|
41.0 |
|
|
|
42.2 |
|
|
|
51.3 |
|
|
|
87.6 |
|
|
|
Inventories |
|
2.5 |
|
|
|
(39.9 |
) |
|
|
8.4 |
|
|
|
(83.1 |
) |
|
|
Accounts payable and accrued liabilities |
|
112.2 |
|
|
|
91.2 |
|
|
|
124.3 |
|
|
|
85.4 |
|
|
|
Cash flow provided from operating activities |
|
656.7 |
|
|
|
552.6 |
|
|
|
1,109.9 |
|
|
|
881.8 |
|
|
|
Income taxes paid |
|
(52.7 |
) |
|
|
(24.0 |
) |
|
|
(131.5 |
) |
|
|
(94.2 |
) |
|
|
Net cash flow provided from operating
activities |
|
604.0 |
|
|
|
528.6 |
|
|
|
978.4 |
|
|
|
787.6 |
|
|
|
Investing: |
|
|
|
|
|
|
|
|
|
Additions to property, plant and equipment |
|
(274.2 |
) |
|
|
(281.9 |
) |
|
|
(516.1 |
) |
|
|
(503.1 |
) |
|
|
Interest paid capitalized to property, plant and equipment |
|
(17.0 |
) |
|
|
(8.5 |
) |
|
|
(51.9 |
) |
|
|
(46.8 |
) |
|
|
Net (additions) disposals to long-term investments and other
assets |
|
(15.7 |
) |
|
|
(10.4 |
) |
|
|
(18.8 |
) |
|
|
4.9 |
|
|
|
Decrease in restricted cash - net |
|
0.8 |
|
|
|
2.2 |
|
|
|
0.3 |
|
|
|
1.4 |
|
|
|
Interest received and other - net |
|
3.8 |
|
|
|
4.2 |
|
|
|
7.7 |
|
|
|
6.9 |
|
|
|
Net cash flow of continuing operations used in investing
activities |
|
(302.3 |
) |
|
|
(294.4 |
) |
|
|
(578.8 |
) |
|
|
(536.7 |
) |
|
|
Net cash flow of discontinued operations provided from
investing activities |
|
- |
|
|
|
40.0 |
|
|
|
- |
|
|
|
45.0 |
|
|
|
Financing: |
|
|
|
|
|
|
|
|
|
Proceeds from drawdown of debt |
|
- |
|
|
|
- |
|
|
|
- |
|
|
|
100.0 |
|
|
|
Repayment of debt |
|
(200.0 |
) |
|
|
(220.0 |
) |
|
|
(200.0 |
) |
|
|
(220.0 |
) |
|
|
Interest paid |
|
- |
|
|
|
(2.3 |
) |
|
|
(18.5 |
) |
|
|
(26.5 |
) |
|
|
Payment of lease liabilities |
|
(3.4 |
) |
|
|
(5.6 |
) |
|
|
(6.8 |
) |
|
|
(21.1 |
) |
|
|
Funding from non-controlling interest |
|
11.7 |
|
|
|
6.7 |
|
|
|
27.2 |
|
|
|
11.8 |
|
|
|
Dividends paid to common shareholders |
|
(36.8 |
) |
|
|
(36.9 |
) |
|
|
(73.7 |
) |
|
|
(73.7 |
) |
|
|
Other - net |
|
- |
|
|
|
(9.6 |
) |
|
|
0.3 |
|
|
|
(7.5 |
) |
|
|
Net cash flow used in financing activities |
|
(228.5 |
) |
|
|
(267.7 |
) |
|
|
(271.5 |
) |
|
|
(237.0 |
) |
|
|
Effect of exchange rate changes on cash and cash
equivalents |
|
(0.1 |
) |
|
|
0.9 |
|
|
|
(0.5 |
) |
|
|
1.4 |
|
|
|
Increase in cash and cash equivalents |
|
73.1 |
|
|
|
7.4 |
|
|
|
127.6 |
|
|
|
60.3 |
|
|
|
Cash and cash equivalents, beginning of
period |
|
406.9 |
|
|
|
471.0 |
|
|
|
352.4 |
|
|
|
418.1 |
|
|
|
Cash and cash equivalents, end of period |
$ |
480.0 |
|
|
$ |
478.4 |
|
|
$ |
480.0 |
|
|
$ |
478.4 |
|
|
|
|
|
|
|
|
|
|
|
|
| |
Operating Summary |
|
|
Mine |
Period |
Tonnes Ore Mined |
Tonnes Waste Mined |
Ore Processed (Milled) |
Ore Processed (Heap Leach) |
Grade (Mill) |
Grade (Heap Leach) |
Recovery (a)(b) |
Silver Grade |
Silver Recovery |
Gold Eq
Production(c) |
Gold Eq Sales(c) |
Production cost of sales |
Production cost of
sales/oz(d) |
Cap Ex -
sustaining(e) |
Total Cap Ex (e) |
DD&A |
|
|
|
|
('000 tonnes) |
('000 tonnes) |
('000 tonnes) |
('000 tonnes) |
(g/t) |
(g/t) |
(%) |
(g/t) |
(%) |
(ounces) |
(ounces) |
($ millions) |
($/ounce) |
($ millions) |
($ millions) |
($ millions) |
|
West Africa |
Tasiast |
Q2 2024 |
1,985 |
14,051 |
2,161 |
- |
2.70 |
- |
92 |
% |
|
|
161,629 |
156,038 |
$ |
102.3 |
$ |
656 |
$ |
7.0 |
$ |
75.2 |
$ |
84.0 |
|
Q1 2024 |
2,044 |
15,145 |
2,073 |
- |
2.46 |
- |
91 |
% |
|
|
159,199 |
151,014 |
$ |
99.7 |
$ |
660 |
$ |
10.1 |
$ |
79.5 |
$ |
77.9 |
|
Q4 2023 |
2,937 |
14,062 |
2,056 |
- |
3.04 |
- |
93 |
% |
|
|
160,764 |
171,199 |
$ |
110.4 |
$ |
645 |
$ |
9.7 |
$ |
85.2 |
$ |
70.6 |
|
Q3 2023 |
3,486 |
12,231 |
1,796 |
- |
3.10 |
- |
92 |
% |
|
|
171,140 |
162,823 |
$ |
108.5 |
$ |
666 |
$ |
12.2 |
$ |
77.3 |
$ |
69.0 |
|
Q2 2023 |
1,688 |
12,996 |
1,663 |
- |
3.25 |
- |
93 |
% |
|
|
157,844 |
152,564 |
$ |
99.5 |
$ |
652 |
$ |
9.1 |
$ |
81.9 |
$ |
58.6 |
Americas
|
Paracatu |
Q2 2024 |
14,094 |
12,108 |
15,053 |
- |
0.35 |
- |
80 |
% |
|
|
130,228 |
130,174 |
$ |
135.2 |
$ |
1,039 |
$ |
44.6 |
$ |
44.6 |
$ |
45.7 |
|
Q1 2024 |
14,078 |
13,583 |
15,609 |
- |
0.31 |
- |
79 |
% |
|
|
128,273 |
128,110 |
$ |
135.7 |
$ |
1,059 |
$ |
19.6 |
$ |
19.6 |
$ |
46.7 |
|
Q4 2023 |
16,865 |
11,619 |
15,279 |
- |
0.35 |
- |
79 |
% |
|
|
127,940 |
132,886 |
$ |
144.2 |
$ |
1,085 |
$ |
41.6 |
$ |
41.6 |
$ |
43.3 |
|
Q3 2023 |
14,725 |
10,070 |
14,669 |
- |
0.41 |
- |
79 |
% |
|
|
172,482 |
167,105 |
$ |
141.2 |
$ |
845 |
$ |
58.4 |
$ |
58.4 |
$ |
53.1 |
|
Q2 2023 |
14,199 |
10,948 |
15,104 |
- |
0.42 |
- |
80 |
% |
|
|
164,243 |
163,889 |
$ |
135.2 |
$ |
825 |
$ |
39.7 |
$ |
39.7 |
$ |
49.8 |
|
La Coipa(f) |
Q2 2024 |
690 |
3,773 |
882 |
- |
1.97 |
- |
84 |
% |
65.02 |
51 |
% |
65,851 |
63,506 |
$ |
58.8 |
$ |
926 |
$ |
10.7 |
$ |
10.7 |
$ |
45.8 |
|
Q1 2024 |
1,035 |
2,696 |
827 |
- |
2.09 |
- |
87 |
% |
87.20 |
58 |
% |
71,245 |
71,125 |
$ |
52.1 |
$ |
733 |
$ |
7.2 |
$ |
7.2 |
$ |
50.0 |
|
Q4 2023 |
1,591 |
3,762 |
1,188 |
- |
1.92 |
- |
78 |
% |
96.24 |
44 |
% |
73,823 |
73,477 |
$ |
52.9 |
$ |
720 |
$ |
7.0 |
$ |
10.9 |
$ |
54.8 |
|
Q3 2023 |
1,137 |
5,597 |
1,017 |
- |
1.69 |
- |
81 |
% |
106.70 |
63 |
% |
65,975 |
65,856 |
$ |
41.4 |
$ |
629 |
$ |
7.5 |
$ |
15.2 |
$ |
48.3 |
|
Q2 2023 |
869 |
8,009 |
971 |
- |
1.62 |
- |
81 |
% |
109.84 |
56 |
% |
66,744 |
67,378 |
$ |
43.6 |
$ |
647 |
$ |
19.9 |
$ |
23.3 |
$ |
48.3 |
|
Fort Knox
(100%)(g) |
Q2 2024 |
8,331 |
13,667 |
2,003 |
6,385 |
0.85 |
0.22 |
81 |
% |
|
|
69,914 |
70,477 |
$ |
94.8 |
$ |
1,345 |
$ |
47.6 |
$ |
89.2 |
$ |
25.9 |
|
Q1 2024 |
10,037 |
12,211 |
1,850 |
8,778 |
0.67 |
0.24 |
76 |
% |
|
|
53,350 |
56,292 |
$ |
82.5 |
$ |
1,466 |
$ |
37.7 |
$ |
78.6 |
$ |
20.5 |
|
Q4 2023 |
11,018 |
9,042 |
2,173 |
9,930 |
0.69 |
0.22 |
78 |
% |
|
|
84,215 |
81,306 |
$ |
104.3 |
$ |
1,283 |
$ |
50.6 |
$ |
114.3 |
$ |
31.5 |
|
Q3 2023 |
6,667 |
12,265 |
1,912 |
5,961 |
0.81 |
0.21 |
78 |
% |
|
|
71,611 |
71,616 |
$ |
82.3 |
$ |
1,149 |
$ |
52.1 |
$ |
96.0 |
$ |
24.6 |
|
Q2 2023 |
7,624 |
9,426 |
2,075 |
6,837 |
0.82 |
0.24 |
82 |
% |
|
|
69,438 |
69,206 |
$ |
79.3 |
$ |
1,146 |
$ |
52.1 |
$ |
90.3 |
$ |
22.1 |
|
Fort Knox
(attributable)(g) |
Q2 2024 |
8,249 |
12,627 |
2,003 |
6,385 |
0.85 |
0.22 |
81 |
% |
|
|
69,914 |
70,477 |
$ |
94.8 |
$ |
1,345 |
$ |
47.6 |
$ |
79.5 |
$ |
25.9 |
|
Q1 2024 |
10,009 |
11,271 |
1,850 |
8,778 |
0.67 |
0.24 |
76 |
% |
|
|
53,350 |
56,292 |
$ |
82.5 |
$ |
1,466 |
$ |
37.7 |
$ |
68.8 |
$ |
20.5 |
|
Q4 2023 |
11,014 |
8,211 |
2,173 |
9,930 |
0.69 |
0.22 |
78 |
% |
|
|
84,215 |
81,306 |
$ |
104.3 |
$ |
1,283 |
$ |
50.6 |
$ |
100.7 |
$ |
31.5 |
|
Q3 2023 |
6,667 |
11,970 |
1,912 |
5,961 |
0.81 |
0.21 |
78 |
% |
|
|
71,611 |
71,616 |
$ |
82.3 |
$ |
1,149 |
$ |
52.1 |
$ |
84.5 |
$ |
24.6 |
|
Q2 2023 |
7,624 |
9,426 |
2,075 |
6,837 |
0.82 |
0.24 |
82 |
% |
|
|
69,438 |
69,206 |
$ |
79.3 |
$ |
1,146 |
$ |
52.1 |
$ |
81.5 |
$ |
22.1 |
|
Round Mountain |
Q2 2024 |
2,956 |
12,069 |
806 |
1,541 |
1.11 |
0.35 |
73 |
% |
|
|
61,787 |
60,049 |
$ |
93.9 |
$ |
1,564 |
$ |
2.1 |
$ |
37.2 |
$ |
65.9 |
|
Q1 2024 |
4,246 |
7,849 |
960 |
3,257 |
1.32 |
0.37 |
73 |
% |
|
|
68,352 |
68,169 |
$ |
90.6 |
$ |
1,329 |
$ |
3.7 |
$ |
19.3 |
$ |
47.3 |
|
Q4 2023 |
4,666 |
4,640 |
884 |
2,729 |
0.91 |
0.48 |
68 |
% |
|
|
55,764 |
56,495 |
$ |
82.6 |
$ |
1,462 |
$ |
4.6 |
$ |
4.8 |
$ |
45.0 |
|
Q3 2023 |
8,474 |
3,618 |
911 |
7,644 |
0.75 |
0.38 |
75 |
% |
|
|
63,648 |
61,931 |
$ |
93.1 |
$ |
1,503 |
$ |
7.7 |
$ |
7.8 |
$ |
44.1 |
|
Q2 2023 |
10,496 |
6,119 |
1,021 |
10,028 |
0.67 |
0.35 |
76 |
% |
|
|
57,446 |
57,412 |
$ |
85.5 |
$ |
1,489 |
$ |
10.5 |
$ |
10.5 |
$ |
33.5 |
|
Bald Mountain |
Q2 2024 |
2,906 |
16,020 |
- |
2,906 |
- |
0.47 |
nm |
|
|
45,929 |
39,818 |
$ |
50.6 |
$ |
1,271 |
$ |
4.4 |
$ |
4.6 |
$ |
27.0 |
|
Q1 2024 |
1,480 |
14,896 |
- |
1,480 |
- |
0.42 |
nm |
|
|
46,980 |
47,241 |
$ |
52.1 |
$ |
1,103 |
$ |
32.4 |
$ |
32.4 |
$ |
27.0 |
|
Q4 2023 |
3,894 |
14,556 |
- |
3,918 |
- |
0.47 |
nm |
|
|
44,007 |
49,375 |
$ |
57.1 |
$ |
1,156 |
$ |
36.3 |
$ |
38.8 |
$ |
25.0 |
|
Q3 2023 |
7,412 |
7,330 |
- |
7,412 |
- |
0.39 |
nm |
|
|
40,593 |
41,300 |
$ |
53.9 |
$ |
1,305 |
$ |
20.6 |
$ |
24.9 |
$ |
23.3 |
|
Q2 2023 |
4,142 |
11,319 |
- |
4,119 |
- |
0.42 |
nm |
|
|
39,321 |
42,181 |
$ |
54.5 |
$ |
1,292 |
$ |
16.5 |
$ |
31.4 |
$ |
25.6 |
| |
|
(a) Due to the nature of heap leach operations,
recovery rates at Bald Mountain cannot be accurately measured on a
quarterly basis. Recovery rates at Fort Knox and Round Mountain
represent mill recovery only. |
|
(b) "nm" means not meaningful. |
|
(c) Gold equivalent ounces include silver ounces
produced and sold converted to a gold equivalent based on the ratio
of the average spot market prices for the commodities for each
period. The ratios for the quarters presented are as follows: Q2
2024: 81.06:1; Q1 2024: 88.70:1; Q4 2023: 85.00:1; Q3 2023:
81.82:1; Q2 2023: 81.88:1. |
|
(d) “Production cost of sales per equivalent ounce
sold” is defined as production cost of sales divided by total gold
equivalent ounces sold. |
|
(e) "Total Cap Ex" is as reported as “Additions to
property, plant and equipment” on the interim condensed
consolidated statements of cash flows. "Cap Ex - sustaining" is a
non-GAAP financial measure. The definition and reconciliation of
this non-GAAP financial measure is included on pages 20 and 21 of
this news release. |
|
(f) La Coipa silver grade and recovery were as
follows: Q2 2024: 65.02 g/t, 51%; Q1 2024: 87.20 g/t, 58%; Q4 2023:
96.24 g/t, 44%; Q3 2023: 106.70 g/t, 63%; Q2 2023: 109.84 g/t,
56%. |
|
(g) The Fort Knox segment is composed of Fort Knox
and Manh Choh, and comparative results shown are presented in
accordance with the current year’s presentation. Manh Choh tonnes
of ore processed and grade were nil for all periods presented as
production commenced in July 2024. The attributable results for
Fort Knox include 100% of Fort Knox and 70% of Manh
Choh. |
| |
Reconciliation of non-GAAP financial measures and
ratios
The Company has included certain non-GAAP
financial measures and ratios in this document. These financial
measures and ratios are not defined under IFRS and should not be
considered in isolation. The Company believes that these financial
measures and ratios, together with financial measures and ratios
determined in accordance with IFRS, provide investors with an
improved ability to evaluate the underlying performance of the
Company. The inclusion of these financial measures and ratios is
meant to provide additional information and should not be used as a
substitute for performance measures prepared in accordance with
IFRS. These financial measures and ratios are not necessarily
standard and therefore may not be comparable to other issuers.
Adjusted Net Earnings Attributable to Common Shareholders
and Adjusted Net Earnings per Share
Adjusted net earnings attributable to common
shareholders and adjusted net earnings per share are non-GAAP
financial measures and ratios which determine the performance of
the Company, excluding certain impacts which the Company believes
are not reflective of the Company’s underlying performance for the
reporting period, such as the impact of foreign exchange gains and
losses, reassessment of prior year taxes and/or taxes otherwise not
related to the current period, impairment charges (reversals),
gains and losses and other one-time costs related to acquisitions,
dispositions and other transactions, and non-hedge derivative gains
and losses. Although some of the items are recurring, the Company
believes that they are not reflective of the underlying operating
performance of its current business and are not necessarily
indicative of future operating results. Management believes that
these measures and ratios, which are used internally to assess
performance and in planning and forecasting future operating
results, provide investors with the ability to better evaluate
underlying performance, particularly since the excluded items are
typically not included in public guidance. However, adjusted net
earnings and adjusted net earnings per share measures and ratios
are not necessarily indicative of net earnings and earnings per
share measures and ratios as determined under IFRS.
The following table provides a reconciliation of net earnings to
adjusted net earnings for the periods presented:
|
|
|
|
|
|
|
|
|
(unaudited, expressed in millions of U.S. dollars, except per
share amounts) |
Three months ended |
|
Six months ended |
|
June 30, |
|
June 30, |
|
|
|
|
2024 |
|
|
2023 |
|
|
|
2024 |
|
|
2023 |
|
|
|
|
|
|
|
|
|
|
Net earnings attributable to common shareholders - as reported |
$ |
210.9 |
|
$ |
151.0 |
|
|
$ |
317.9 |
|
$ |
241.2 |
|
|
Adjusting items: |
|
|
|
|
|
|
|
Foreign exchange (gains) losses |
|
(6.4 |
) |
|
10.1 |
|
|
|
(9.9 |
) |
|
6.3 |
|
|
|
Foreign exchange losses (gains) on translation of tax basis and
foreign exchange on deferred income taxes within income tax
expense |
|
20.3 |
|
|
(18.5 |
) |
|
|
24.3 |
|
|
(31.7 |
) |
|
|
Loss on sale of assets |
|
- |
|
|
- |
|
|
|
- |
|
|
- |
|
|
|
Taxes in respect of prior periods |
|
(30.7 |
) |
|
16.6 |
|
|
|
(22.7 |
) |
|
28.6 |
|
|
|
Insurance recoveries |
|
(22.9 |
) |
|
(0.8 |
) |
|
|
(22.9 |
) |
|
(0.8 |
) |
|
|
Other(a) |
|
4.9 |
|
|
12.4 |
|
|
|
15.4 |
|
|
15.2 |
|
|
|
Tax effects of the above adjustments |
|
(1.4 |
) |
|
(3.2 |
) |
|
|
(2.5 |
) |
|
(3.6 |
) |
|
|
|
|
(36.2 |
) |
|
16.6 |
|
|
|
(18.3 |
) |
|
14.0 |
|
|
Adjusted net earnings attributable to common shareholders |
$ |
174.7 |
|
$ |
167.6 |
|
|
$ |
299.6 |
|
$ |
255.2 |
|
|
Weighted average number of common shares outstanding - Basic |
|
1,229.0 |
|
|
1,227.6 |
|
|
|
1,228.6 |
|
|
1,226.3 |
|
|
Adjusted net earnings per share |
$ |
0.14 |
|
$ |
0.14 |
|
|
$ |
0.24 |
|
$ |
0.21 |
|
|
Basic earnings per share attributable to common shareholders - as
reported |
$ |
0.17 |
|
$ |
0.12 |
|
|
$ |
0.26 |
|
$ |
0.20 |
|
|
|
|
|
|
|
|
|
|
(a) Other includes various impacts, such as one-time costs at
sites, restructuring costs, legal settlements and gains and losses
on hedges and the sale of assets, which the Company believes are
not reflective of the Company’s underlying performance for the
reporting period. |
|
|
Attributable Free Cash Flow
Attributable free cash flow is a non-GAAP
financial measure and is defined as net cash flow provided from
operating activities less attributable capital expenditures and
non-controlling interest included in net cash flows provided from
operating activities. The Company believes that this measure, which
is used internally to evaluate the Company’s underlying cash
generation performance and the ability to repay creditors and
return cash to shareholders, provides investors with the ability to
better evaluate the Company’s underlying performance. However, this
measure is not necessarily indicative of operating earnings or net
cash flow provided from operating activities as determined under
IFRS.
The following table provides a reconciliation of
attributable free cash flow for the periods presented:
|
|
|
|
|
|
|
|
(unaudited, expressed in millions of U.S. dollars) |
Three months ended
June 30, |
|
Six months ended
June 30, |
|
|
2024
|
2023
|
|
2024
|
2023
|
|
|
|
|
|
|
|
|
Net cash flow provided from operating activities -as reported |
$ |
604.0 |
|
$ |
528.6
|
|
|
$ |
978.4
|
|
$ |
787.6 |
|
|
Adjusting items: |
|
|
|
|
|
|
Attributable(a) capital expenditures |
|
(264.5
|
) |
|
(272.3
|
) |
|
|
(496.6
|
) |
|
(484.9
|
) |
|
Non-controlling interest(b) cash flow used in operating
activities |
|
6.4 |
|
|
2.0 |
|
|
|
9.4 |
|
|
2.6 |
|
|
Attributable(a) free cash flow |
$ |
345.9 |
|
$ |
258.3 |
|
|
$ |
491.2
|
|
$ |
305.3
|
|
|
|
|
|
|
|
|
|
See pages 21 and 22 for details of the endnotes referenced within
the table above. |
|
|
|
|
|
|
|
|
|
|
|
|
Adjusted Operating Cash Flow
Adjusted operating cash flow is a non-GAAP
financial measure and is defined as net cash flow provided from
operating activities excluding certain impacts which the Company
believes are not reflective of the Company’s regular operating cash
flow and excluding changes in working capital. Working capital can
be volatile due to numerous factors, including the timing of tax
payments. The Company uses adjusted operating cash flow internally
as a measure of the underlying operating cash flow performance and
future operating cash flow-generating capability of the Company.
However, the adjusted operating cash flow measure is not
necessarily indicative of net cash flow provided from operating
activities as determined under IFRS.
The following table provides a
reconciliation of adjusted operating cash flow for the periods
presented:
|
|
|
|
|
|
Three months ended |
Six months ended |
|
(unaudited, expressed in millions of U.S. dollars) |
June 30, |
|
June 30, |
|
|
|
|
2024 |
|
|
2023 |
|
|
|
2024 |
|
|
2023 |
|
|
|
|
|
|
|
|
|
|
|
|
|
|
|
|
|
Net cash flow provided from operating activities - as reported |
$ |
604 |
|
$ |
528.6 |
|
|
$ |
978.4 |
|
$ |
787.6 |
|
|
|
|
|
|
|
|
|
|
|
|
|
|
|
|
|
Adjusting items: |
|
|
|
|
|
|
|
|
|
|
|
|
|
|
Insurance proceeds received in respect of prior years |
|
(22.9 |
) |
|
-
|
|
|
|
(22.9 |
) |
|
- |
|
|
Working capital changes: |
|
|
|
|
|
|
|
|
|
|
|
|
|
|
Accounts receivable and other assets |
|
(41 |
) |
|
(42.2 |
) |
|
|
(51.3 |
) |
|
(87.6 |
) |
|
Inventories |
|
(2.5 |
) |
|
39.9 |
|
|
|
(8.4 |
) |
|
83.1 |
|
|
Accounts payable and other liabilities, including income taxes
paid |
|
(59.5 |
) |
|
(67.2 |
) |
|
|
7.2 |
|
|
8.8 |
|
|
|
|
(125.9 |
) |
|
(69.5 |
) |
|
|
(75.4 |
) |
|
4.3 |
|
|
Adjusted operating cash flow |
$ |
478.1 |
|
$ |
459.1 |
|
|
$ |
903 |
|
$ |
791.9 |
|
|
|
|
|
|
|
|
|
|
|
|
|
|
|
|
Production Cost of
Sales(l) per Ounce
Sold on a By-Product Basis
Production cost of
sales per ounce sold on a by-product basis is a non-GAAP ratio
which calculates the Company’s non-gold production as a credit
against its per ounce production costs, rather than converting its
non-gold production into gold equivalent ounces and crediting it to
total production, as is the case in co-product accounting.
Management believes that this ratio provides investors with the
ability to better evaluate Kinross’ production cost of sales per
ounce on a comparable basis with other major gold producers who
routinely calculate their cost of sales per ounce using by-product
accounting rather than co-product accounting.
The following table
provides a reconciliation of production cost of sales per ounce
sold on a by-product basis for the periods presented:
(unaudited, expressed in millions of U.S. dollars,
except ounces and production cost of sales per equivalent
ounce) |
|
Three months ended |
Six months ended |
|
|
|
June 30, |
|
|
June 30, |
|
|
|
|
2024 |
|
|
2023 |
|
|
|
2024 |
|
|
2023 |
|
|
|
|
|
|
|
|
|
|
|
|
|
|
|
|
|
Production cost of sales - as reported |
$ |
536.1 |
|
$ |
497.9 |
|
|
$ |
1049 |
|
$ |
981.8 |
|
|
Less: silver revenue(c) |
|
(36.7 |
) |
|
(53.3 |
) |
|
|
(75.8 |
) |
|
(108.2 |
) |
|
Production cost of sales net of silver by-product revenue |
$ |
499.4 |
|
$ |
444.6 |
|
|
$ |
973.2 |
|
$ |
873.6 |
|
|
|
|
|
|
|
|
|
|
|
|
|
|
|
|
|
Gold ounces sold |
|
505,122 |
|
|
525,921 |
|
|
|
1,008,726 |
|
|
987,617 |
|
|
Total gold equivalent ounces sold |
|
520,760 |
|
|
552,969 |
|
|
|
1,043,160 |
|
|
1,043,299 |
|
|
Production cost of sales per equivalent ounce sold(d) |
$ |
1029 |
|
$ |
900 |
|
|
$ |
1006 |
|
$ |
941 |
|
|
Production cost of sales per ounce sold on a by-product basis |
$ |
989 |
|
$ |
845 |
|
|
$ |
965 |
|
$ |
885 |
|
|
|
|
|
|
|
|
|
|
|
|
|
|
|
|
See pages 21 and 22 for details of the endnotes referenced
within the table above.
All-In Sustaining
Cost(l) and
Attributable All-In Cost per Ounce Sold on a By-Product
Basis
All-in sustaining cost and attributable all-in
cost per ounce sold on a by-product basis are non-GAAP financial
measures and ratios, as applicable, calculated based on guidance
published by the World Gold Council (“WGC”). The WGC is a market
development organization for the gold industry and is an
association whose membership comprises leading gold mining
companies including Kinross. Although the WGC is not a mining
industry regulatory organization, it worked closely with its member
companies to develop these metrics. Adoption of the all-in
sustaining cost and all-in cost metrics is voluntary and not
necessarily standard, and therefore, these measures and ratios
presented by the Company may not be comparable to similar measures
and ratios presented by other issuers. The Company believes that
the all-in sustaining cost and all-in cost measures complement
existing measures and ratios reported by Kinross.
All-in sustaining cost includes both operating
and capital costs required to sustain gold production on an ongoing
basis. The value of silver sold is deducted from the total
production cost of sales as it is considered residual production,
i.e. a by-product. Sustaining operating costs represent
expenditures incurred at current operations that are considered
necessary to maintain current production. Sustaining capital
represents capital expenditures at existing operations comprising
mine development costs, including capitalized development, and
ongoing replacement of mine equipment and other capital facilities,
and does not include capital expenditures for major growth projects
or enhancement capital for significant infrastructure improvements
at existing operations.
All-in cost is comprised of all-in sustaining
cost as well as operating expenditures incurred at locations with
no current operation, or costs related to other non-sustaining
activities, and capital expenditures for major growth projects or
enhancement capital for significant infrastructure improvements at
existing operations.
All-in sustaining cost and attributable all-in
cost per ounce sold on a by-product basis are calculated by
adjusting production cost of sales, as reported on the interim
condensed consolidated statements of operations, as follows:
|
|
|
|
|
|
|
|
|
|
|
|
|
|
|
|
|
|
|
|
(unaudited, expressed in millions of U.S. dollars,
except ounces and costs per ounce |
Three months ended
|
Six months ended |
|
|
|
June 30,
|
June 30, |
|
|
|
|
2024 |
|
|
2023 |
|
|
|
2024 |
|
|
|
2023 |
|
|
|
|
|
|
|
|
|
|
|
Production cost of sales - as reported |
$ |
536.1 |
|
$ |
497.9 |
|
|
$ |
1,049.0 |
|
$ |
|
981.8 |
|
|
|
Less: silver revenue(c) |
|
(36.7 |
) |
|
(53.3 |
) |
|
|
(75.8 |
) |
|
|
(108.2 |
) |
|
|
Production cost of sales net of silver by-product revenue |
$ |
499.4 |
|
$ |
444.6 |
|
|
$ |
973.2 |
|
$ |
|
873.6 |
|
|
|
Adjusting items: |
|
|
|
|
|
|
|
General and administrative(e) |
|
32.4 |
|
|
32.0 |
|
|
|
63.1 |
|
|
|
56.4 |
|
|
|
Other operating expense - sustaining(f) |
|
1.6 |
|
|
5.0 |
|
|
|
2.4 |
|
|
|
11.5 |
|
|
|
Reclamation and remediation - sustaining(g) |
|
19.4 |
|
|
18.3 |
|
|
|
37.7 |
|
|
|
32.6 |
|
|
|
Exploration and business development - sustaining(h) |
|
13.1 |
|
|
9.5 |
|
|
|
21.8 |
|
|
|
16.1 |
|
|
|
Additions to property, plant and equipment - sustaining(i) |
|
116.5 |
|
|
148.6 |
|
|
|
225.8 |
|
|
|
245.1 |
|
|
|
Lease payments - sustaining(j) |
|
3.3 |
|
|
5.5 |
|
|
|
6.7 |
|
|
|
20.7 |
|
|
|
All-in Sustaining Cost on a by-product basis |
$ |
685.7 |
|
$ |
663.5 |
|
|
$ |
1,330.7 |
|
$ |
|
1,256.0 |
|
|
|
Adjusting items on an attributable(a) basis: |
|
|
|
|
|
|
|
Other operating expense - non-sustaining(f) |
|
9.8 |
|
|
10.0 |
|
|
|
19.9 |
|
|
|
18.7 |
|
|
|
Reclamation and remediation - non-sustaining(g) |
|
1.7 |
|
|
2.4 |
|
|
|
3.4 |
|
|
|
4.3 |
|
|
|
Exploration and business development - non-sustaining(h) |
|
41.8 |
|
|
39.7 |
|
|
|
74.7 |
|
|
|
67.3 |
|
|
|
Additions to property, plant and equipment - non-sustaining(i) |
|
148.0 |
|
|
123.7 |
|
|
|
270.8 |
|
|
|
239.8 |
|
|
|
Lease payments - non-sustaining(j) |
|
0.1 |
|
|
0.1 |
|
|
|
0.1 |
|
|
|
0.4 |
|
|
|
All-in Cost on a by-product basis - attributable(a) |
$ |
887.1 |
|
$ |
839.4 |
|
|
$ |
1,699.6 |
|
$ |
|
1,586.5 |
|
|
|
|
|
505,122 |
|
|
525,921 |
|
|
|
1,008,726 |
|
|
|
987,617 |
|
|
|
Production cost of sales per equivalent ounce sold(d) |
$ |
1,029 |
|
$ |
900 |
|
|
$ |
1,006 |
|
$ |
|
941 |
|
|
|
All-in sustaining cost per ounce sold on a by-product basis |
$ |
1,357 |
|
$ |
1,262 |
|
|
$ |
1,319 |
|
$ |
|
1,272 |
|
|
|
Attributable(a) all-in cost per ounce sold on a by-product
basis |
$ |
1,756 |
|
$ |
1,596 |
|
|
$ |
1,685 |
|
$ |
|
1,606 |
|
|
|
|
|
|
|
|
|
|
See pages 21 and 22 for details of the endnotes referenced
within the table above.
All-In Sustaining
Cost(l) and
Attributable All-In Cost per Equivalent Ounce Sold
The Company also assesses its all-in sustaining
cost and attributable all-in cost on a gold equivalent ounce basis.
Under these non-GAAP financial measures and ratios, the Company’s
production of silver is converted into gold equivalent ounces and
credited to total production.
All-in sustaining cost and attributable all-in
cost per equivalent ounce sold are calculated by adjusting
production cost of sales, as reported on the interim condensed
consolidated statements of operations, as follows:
|
|
|
|
|
|
|
|
|
(unaudited, expressed in millions of U.S. dollars, except
ounces and costs per ounce) |
Three months ended |
|
Six months ended |
|
June 30, |
|
June 30, |
|
|
|
|
2024 |
|
2023 |
|
|
2024 |
|
2023 |
|
|
|
|
|
|
|
|
|
|
Production cost of sales - as reported |
$ |
536.1 |
$ |
497.9 |
|
$ |
1,049.0 |
$ |
981.8 |
|
|
Adjusting items: |
|
|
|
|
|
|
|
General and administrative(e) |
|
32.4 |
|
32.0 |
|
|
63.1 |
|
56.4 |
|
|
|
Other operating expense - sustaining(f) |
|
1.6 |
|
5.0 |
|
|
2.4 |
|
11.5 |
|
|
|
Reclamation and remediation - sustaining(g) |
|
19.4 |
|
18.3 |
|
|
37.7 |
|
32.6 |
|
|
|
Exploration and business development - sustaining(h) |
|
13.1 |
|
9.5 |
|
|
21.8 |
|
16.1 |
|
|
|
Additions to property, plant and equipment - sustaining(i) |
|
116.5 |
|
148.6 |
|
|
225.8 |
|
245.1 |
|
|
|
Lease payments - sustaining(j) |
|
3.3 |
|
5.5 |
|
|
6.7 |
|
20.7 |
|
|
All-in Sustaining Cost |
$ |
722.4 |
$ |
716.8 |
|
$ |
1,406.5 |
$ |
1,364.2 |
|
|
Adjusting items on an attributable(a) basis: |
|
|
|
|
|
|
|
Other operating expense - non-sustaining(f) |
|
9.8 |
|
10.0 |
|
|
19.9 |
|
18.7 |
|
|
|
Reclamation and remediation - non-sustaining(g) |
|
1.7 |
|
2.4 |
|
|
3.4 |
|
4.3 |
|
|
|
Exploration and business development - non-sustaining(h) |
|
41.8 |
|
39.7 |
|
|
74.7 |
|
67.3 |
|
|
|
Additions to property, plant and equipment - non-sustaining(i) |
|
148.0 |
|
123.7 |
|
|
270.8 |
|
239.8 |
|
|
|
Lease payments - non-sustaining(j) |
|
0.1 |
|
0.1 |
|
|
0.1 |
|
0.4 |
|
|
All-in Cost - attributable(a) |
$ |
923.8 |
$ |
892.7 |
|
$ |
1,775.4 |
$ |
1,694.7 |
|
|
Gold equivalent ounces sold |
|
520,760 |
|
552,969 |
|
|
1,043,160 |
|
1,043,299 |
|
|
Production cost of sales per equivalent ounce sold(d) |
$ |
1,029 |
$ |
900 |
|
$ |
1,006 |
$ |
941 |
|
|
All-in sustaining cost per equivalent ounce sold |
$ |
1,387 |
$ |
1,296 |
|
$ |
1,348 |
$ |
1,308 |
|
|
Attributable(a) all-in cost per equivalent ounce sold |
$ |
1,774 |
$ |
1,614 |
|
$ |
1,702 |
$ |
1,624 |
|
|
|
|
|
|
|
|
|
See pages 21 and 22 for details of the
endnotes referenced within the table above.
Capital Expenditures and Attributable
Capital Expenditures
Capital expenditures are classified as either
sustaining capital expenditures or non-sustaining capital
expenditures, depending on the nature of the expenditure.
Sustaining capital expenditures typically represent capital
expenditures at existing operations including capitalized
exploration costs and capitalized development unless related to
major projects, ongoing replacement of mine equipment and other
capital facilities and other capital expenditures and is calculated
as total additions to property, plant and equipment (as reported on
the interim condensed consolidated statements of cash flows), less
non-sustaining capital expenditures. Non-sustaining capital
expenditures represent capital expenditures for major projects,
including major capital development projects at existing operations
that are expected to materially benefit the operation, as well as
enhancement capital for significant infrastructure improvements at
existing operations. Management believes the distinction between
sustaining capital expenditures and non-sustaining expenditures is
a useful indicator of the purpose of capital expenditures and this
distinction is an input into the calculation of all-in sustaining
costs per ounce and attributable all-in costs per ounce. The
categorization of sustaining capital expenditures and
non-sustaining capital expenditures is consistent with the
definitions under the WGC all-in cost standard. Sustaining capital
expenditures and non-sustaining capital expenditures are not
defined under IFRS, however, the sum of these two measures total to
additions to property, plant and equipment as disclosed under IFRS
on the interim condensed consolidated statements of cash flows.
Additions to property, plant and equipment per
the statement of cash flow includes 100% of capital expenditures
for Manh Choh. Attributable capital expenditures includes Kinross'
70% share of capital expenditures for Manh Choh. Management
believes this to be a useful indicator of Kinross’ cash resources
utilized for capital expenditures.
The following table provides a reconciliation of
the classification of capital expenditures for the periods
presented:
|
(unaudited, expressed in millions of U.S. dollars) |
|
|
|
|
|
|
|
|
|
|
Three months ended June 30, 2024 |
Tasiast
(Mauritania) |
Paracatu
(Brazil) |
La Coipa
(Chile) |
Fort Knox(k)
(USA) |
Round
Mountain
(USA) |
Bald
Mountain
(USA) |
Total
USA |
Other |
Total |
|
Sustaining capital expenditures |
$ |
7.0 |
$ |
44.6 |
$ |
10.7 |
$ |
47.6 |
|
$ |
2.1 |
$ |
4.4 |
$ |
54.1 |
|
$ |
0.1 |
|
$ |
116.5 |
|
|
Non-sustaining capital expenditures |
|
68.2 |
|
- |
|
- |
|
41.6 |
|
|
35.1 |
|
0.2 |
|
76.9 |
|
|
12.6 |
|
|
157.7 |
|
|
Additions to property, plant and equipment - per cash flow |
$ |
75.2 |
$ |
44.6 |
$ |
10.7 |
$ |
89.2 |
|
$ |
37.2 |
$ |
4.6 |
$ |
131.0 |
|
$ |
12.7 |
|
$ |
274.2 |
|
|
Less: Non-controlling interest(b) |
$ |
- |
$ |
- |
$ |
- |
$ |
(9.7 |
) |
$ |
- |
$ |
- |
$ |
(9.7 |
) |
$ |
- |
|
$ |
(9.7 |
) |
|
Attributable(a) capital expenditures |
$ |
75.2 |
$ |
44.6 |
$ |
10.7 |
$ |
79.5 |
|
$ |
37.2 |
$ |
4.6 |
$ |
121.3 |
|
$ |
12.7 |
|
$ |
264.5 |
|
|
|
|
|
|
|
|
|
|
|
|
|
Three months ended June 30, 2023 |
|
|
|
|
|
|
|
|
|
|
Sustaining capital expenditures |
$ |
9.1 |
$ |
39.7 |
$ |
19.9 |
$ |
52.1 |
|
$ |
10.5 |
$ |
16.5 |
$ |
79.1 |
|
$ |
0.8 |
|
$ |
148.6 |
|
|
Non-sustaining capital expenditures |
|
72.8 |
|
- |
|
3.4 |
|
38.2 |
|
|
- |
|
14.9 |
|
53.1 |
|
|
4.0 |
|
|
133.3 |
|
|
Additions to property, plant and equipment - per cash flow |
$ |
81.9 |
$ |
39.7 |
$ |
23.3 |
$ |
90.3 |
|
$ |
10.5 |
$ |
31.4 |
$ |
132.2 |
|
$ |
4.8 |
|
$ |
281.9 |
|
|
Less: Non-controlling interest(b) |
$ |
- |
$ |
- |
$ |
- |
$ |
(9.6 |
) |
$ |
- |
$ |
- |
$ |
(9.6 |
) |
$ |
- |
|
$ |
(9.6 |
) |
|
Attributable(a) capital expenditures |
$ |
81.9 |
$ |
39.7 |
$ |
23.3 |
$ |
80.7 |
|
$ |
10.5 |
$ |
31.4 |
$ |
122.6 |
|
$ |
4.8 |
|
$ |
272.3 |
|
|
|
|
|
|
|
|
|
|
|
|
|
|
|
|
|
|
|
|
|
|
|
|
(unaudited, expressed in millions of U.S. dollars) |
|
|
|
|
|
|
|
|
|
|
Six months ended June 30, 2024 |
Tasiast
(Mauritania) |
Paracatu
(Brazil) |
La Coipa
(Chile) |
Fort Knox(k)
(USA) |
Round
Mountain
(USA) |
Bald
Mountain
(USA) |
Total
USA |
Other |
Total |
|
Sustaining capital expenditures |
$ |
17.1 |
$ |
64.2 |
$ |
17.9 |
$ |
85.3 |
|
$ |
5.8 |
$ |
36.8 |
$ |
127.9 |
|
$ |
(1.3 |
) |
$ |
225.8 |
|
|
Non-sustaining capital expenditures |
|
137.6 |
|
- |
|
- |
|
82.5 |
|
|
50.7 |
|
0.2 |
|
133.4 |
|
|
19.3 |
|
|
290.3 |
|
|
Additions to property, plant and equipment - per cash flow |
$ |
154.7 |
$ |
64.2 |
$ |
17.9 |
$ |
167.8 |
|
$ |
56.5 |
$ |
37.0 |
$ |
261.3 |
|
$ |
18.0 |
|
$ |
516.1 |
|
|
Less: Non-controlling interest(b) |
$ |
- |
$ |
- |
$ |
- |
$ |
(19.5 |
) |
$ |
- |
$ |
- |
$ |
(19.5 |
) |
$ |
- |
|
$ |
(19.5 |
) |
|
Attributable(a) capital expenditures |
$ |
154.7 |
$ |
64.2 |
$ |
17.9 |
$ |
148.3 |
|
$ |
56.5 |
$ |
37.0 |
$ |
241.8 |
|
$ |
18.0 |
|
$ |
496.6 |
|
|
|
|
|
|
|
|
|
|
|
|
|
Six months ended June 30, 2023 |
|
|
|
|
|
|
|
|
|
|
Sustaining capital expenditures |
$ |
23.7 |
$ |
67.5 |
$ |
21.5 |
$ |
90.7 |
|
$ |
17.9 |
$ |
22.6 |
$ |
131.2 |
|
$ |
1.2 |
|
$ |
245.1 |
|
|
Non-sustaining capital expenditures |
|
122.8 |
|
- |
|
27.2 |
|
67.4 |
|
|
- |
|
34.0 |
|
101.4 |
|
|
6.6 |
|
|
258.0 |
|
|
Additions to property, plant and equipment - per cash flow |
$ |
146.5 |
$ |
67.5 |
$ |
48.7 |
$ |
158.1 |
|
$ |
17.9 |
$ |
56.6 |
$ |
232.6 |
|
$ |
7.8 |
|
$ |
503.1 |
|
|
Less: Non-controlling interest(b) |
$ |
- |
$ |
- |
$ |
- |
$ |
(18.2 |
) |
$ |
- |
$ |
- |
$ |
(18.2 |
) |
$ |
- |
|
$ |
(18.2 |
) |
|
Attributable(a) capital expenditures |
$ |
146.5 |
$ |
67.5 |
$ |
48.7 |
$ |
139.9 |
|
$ |
17.9 |
$ |
56.6 |
$ |
214.4 |
|
$ |
7.8 |
|
$ |
484.9 |
|
See pages 21 and 22 for details of the
endnotes referenced within the tables above.
Endnotes
(a) “Attributable” includes Kinross’
share of Manh Choh (70%) free cash flow, costs and capital
expenditures.
(b) “Non-controlling interest”
represents the non-controlling interest portion in Manh Choh (30%)
and other subsidiaries for which the Company’s interest is less
than 100% for cash flow from operating activities and capital
expenditures.
(c) “Silver revenue” represents the
portion of metal sales realized from the production of the
secondary or by-product metal (i.e. silver). Revenue from the sale
of silver, which is produced as a by-product of the process used to
produce gold, effectively reduces the cost of gold
production.
(d) “Production cost of sales per
equivalent ounce sold” is defined as production cost of sales
divided by total gold equivalent ounces sold.
(e) “General and administrative”
expenses are as reported on the interim condensed consolidated
statements of operations, excluding certain impacts which the
Company believes are not reflective of the Company’s underlying
performance for the reporting period. General and administrative
expenses are considered sustaining costs as they are required to be
absorbed on a continuing basis for the effective operation and
governance of the Company.
(f) “Other operating expense –
sustaining” is calculated as “Other operating expense” as reported
on the interim condensed consolidated statements of operations,
less other operating and reclamation and remediation expenses
related to non-sustaining activities as well as other items not
reflective of the underlying operating performance of our business.
Other operating expenses are classified as either sustaining or
non-sustaining based on the type and location of the expenditure
incurred. The majority of other operating expenses that are
incurred at existing operations are considered costs necessary to
sustain operations, and are therefore classified as sustaining.
Other operating expenses incurred at locations where there is no
current operation or related to other non-sustaining activities are
classified as non-sustaining.
(g) “Reclamation and remediation -
sustaining” is calculated as current period accretion related to
reclamation and remediation obligations plus current period
amortization of the corresponding reclamation and remediation
assets, and is intended to reflect the periodic cost of reclamation
and remediation for currently operating mines. Reclamation and
remediation costs for development projects or closed mines are
excluded from this amount and classified as
non-sustaining.
(h) “Exploration and business
development – sustaining” is calculated as “Exploration and
business development” expenses as reported on the interim condensed
consolidated statements of operations, less non-sustaining
exploration and business development expenses. Exploration expenses
are classified as either sustaining or non-sustaining based on a
determination of the type and location of the exploration
expenditure. Exploration expenditures within the footprint of
operating mines are considered costs required to sustain current
operations and so are included in sustaining costs. Exploration
expenditures focused on new ore bodies near existing mines (i.e.
brownfield), new exploration projects (i.e. greenfield) or for
other generative exploration activity not linked to existing mining
operations are classified as non-sustaining. Business development
expenses are classified as either sustaining or non-sustaining
based on a determination of the type of expense and requirement for
general or growth related operations.
(i) “Additions to property, plant and
equipment – sustaining” and non-sustaining are as presented on
pages 20 and 21. Non-sustaining capital expenditures included in
the calculation of attributable all-in-cost includes Kinross’ share
of Manh Choh (70%) costs.
(j) “Lease payments – sustaining”
represents the majority of lease payments as reported on the
interim condensed consolidated statements of cash flows and is made
up of the principal and financing components of such cash payments,
less non-sustaining lease payments. Lease payments for development
projects or closed mines are classified as non-sustaining.
(k) The Fort Knox segment is composed
of Fort Knox and Manh Choh for all periods presented.
(l) As production from Manh Choh
commenced in July 2024, production cost of sales and attributable
all-in sustaining cost figures and ratios for Manh Choh are nil for
all periods presented. As a result, production cost of sales and
all-in sustaining cost figures and ratios are equal to attributable
production cost of sales and attributable all-in sustaining cost
figures and ratios, as applicable.
APPENDIX A
Recent LP zone assay results
Hole ID
|
|
From
(m) |
To
(m) |
Width
(m) |
True
Width (m) |
Au
(g/t) |
Target
|
|
BR-695C3A |
|
1,523.1 |
1,526.1 |
3.0 |
2.3 |
0.50 |
Yuma |
|
BR-695C3A |
|
1,539.6 |
1,542.6 |
3.0 |
2.3 |
0.92 |
|
|
BR-695C3A |
|
1,552.9 |
1,566.6 |
13.8 |
10.3 |
23.76 |
|
|
BR-695C3A |
Including |
1,553.9 |
1,558.8 |
4.8 |
3.6 |
65.51 |
|
|
BR-695C4 |
|
1,339.6 |
1,345.0 |
5.4 |
4.5 |
2.08 |
Yuma |
|
BR-695C4 |
|
1,512.9 |
1,516.4 |
3.5 |
2.9 |
0.56 |
|
|
BR-695C4 |
|
1,522.8 |
1,559.3 |
36.6 |
30.7 |
0.73 |
|
|
BR-695C4 |
|
1,572.0 |
1,577.1 |
5.1 |
4.3 |
0.53 |
|
|
BR-699C1 |
|
697.7 |
710.0 |
12.3 |
9.2 |
1.28 |
Yauro |
|
BR-699C1 |
|
717.3 |
721.3 |
4.0 |
3.0 |
0.67 |
|
|
BR-699C1 |
|
1,168.5 |
1,173.0 |
4.5 |
3.4 |
1.19 |
|
|
BR-699C1 |
|
1,179.0 |
1,182.0 |
3.0 |
2.3 |
29.90 |
|
|
BR-699C1 |
|
1,198.5 |
1,201.5 |
3.0 |
2.3 |
2.27 |
|
|
BR-708AC3 |
|
1,386.7 |
1,389.8 |
3.0 |
2.7 |
0.97 |
Yauro |
|
BR-708AC4 |
|
1,404.8 |
1,435.7 |
30.9 |
22.9 |
1.43 |
Yauro |
|
BR-708AC4 |
Including |
1,418.0 |
1,419.0 |
1.0 |
0.7 |
26.40 |
|
|
BR-708AC5 |
No Significant Intersections |
Yauro |
|
BR-708AC6 |
|
1,229.9 |
1,233.6 |
3.7 |
3.2 |
0.86 |
Yauro |
|
BR-708AC6 |
|
1,249.0 |
1,252.5 |
3.5 |
3.0 |
1.12 |
|
|
BR-708AC6 |
|
1,321.8 |
1,325.0 |
3.2 |
2.8 |
11.22 |
|
|
BR-708AC6 |
Including |
1,321.8 |
1,324.0 |
2.2 |
1.9 |
16.04 |
|
|
BR-708AC6 |
|
1,376.0 |
1,379.0 |
3.0 |
2.6 |
2.68 |
|
|
BR-770C2C |
|
1,250.7 |
1,257.0 |
6.3 |
5.1 |
0.40 |
Yauro |
|
BR-770C2C |
|
1,312.8 |
1,324.2 |
11.4 |
9.2 |
3.83 |
|
|
BR-770C2C |
Including |
1,312.8 |
1,313.3 |
0.5 |
0.4 |
78.80 |
|
|
BR-770C2C |
|
1,476.0 |
1,497.1 |
21.1 |
17.1 |
0.61 |
|
|
BR-770C3 |
|
1,308.4 |
1,312.2 |
3.9 |
3.0 |
0.60 |
Yauro |
|
BR-770C3 |
|
1,317.9 |
1,334.0 |
16.2 |
12.4 |
0.49 |
|
|
BR-770C3 |
|
1,353.1 |
1,382.5 |
29.5 |
22.7 |
6.51 |
|
|
BR-770C3 |
Including |
1,357.6 |
1,362.1 |
4.5 |
3.5 |
37.83 |
|
|
BR-770C3 |
|
1,393.5 |
1,396.5 |
3.0 |
2.3 |
0.69 |
|
|
BR-770C3 |
|
1,409.5 |
1,417.0 |
7.5 |
5.8 |
0.85 |
|
|
BR-770C3 |
|
1,440.5 |
1,445.5 |
5.0 |
3.9 |
0.57 |
|
|
BR-770C3 |
|
1,456.4 |
1,483.4 |
27.0 |
20.8 |
0.53 |
|
|
BR-770C3 |
|
1,570.7 |
1,574.5 |
3.8 |
2.9 |
1.75 |
|
|
BR-770C3 |
|
1,601.7 |
1,614.8 |
13.1 |
10.1 |
0.57 |
|
|
BR-770C4 |
|
1,307.5 |
1,310.5 |
3.0 |
2.1 |
1.22 |
Yauro |
|
BR-770C5 |
|
1,280.5 |
1,283.5 |
3.0 |
2.3 |
0.66 |
Yauro |
|
BR-770C5 |
|
1,293.5 |
1,299.0 |
5.5 |
4.2 |
2.51 |
|
|
BR-770C5 |
Including |
1,295.4 |
1,298.1 |
2.7 |
2.1 |
4.54 |
|
|
BR-770C5 |
|
1,356.0 |
1,359.0 |
3.0 |
2.3 |
0.58 |
|
|
BR-770C5 |
|
1,365.3 |
1,403.8 |
38.5 |
29.2 |
1.05 |
|
|
BR-770C5 |
Including |
1,392.7 |
1,398.8 |
6.0 |
4.6 |
3.26 |
|
|
BR-770C5 |
|
1,410.2 |
1,418.0 |
7.8 |
6.0 |
0.83 |
|
|
BR-770C5 |
|
1,458.5 |
1,463.1 |
4.5 |
3.5 |
0.70 |
|
|
BR-770C5 |
|
1,519.2 |
1,528.1 |
8.8 |
6.7 |
3.80 |
|
|
BR-770C5 |
Including |
1,524.5 |
1,528.1 |
3.5 |
2.7 |
7.81 |
|
|
BR-843AC4 |
|
1,252.2 |
1,256.5 |
4.3 |
3.5 |
0.89 |
Yuma |
|
BR-843AC4 |
|
1,353.2 |
1,356.2 |
3.0 |
2.4 |
0.39 |
|
|
BR-843AC4 |
|
1,379.6 |
1,410.0 |
30.4 |
24.6 |
1.65 |
|
|
BR-843AC4 |
Including |
1,393.0 |
1,393.5 |
0.5 |
0.4 |
68.50 |
|
|
BR-843AC4 |
|
1,420.9 |
1,457.9 |
37.0 |
30.0 |
0.90 |
|
|
BR-843AC4 |
Including |
1,421.9 |
1,427.0 |
5.0 |
4.1 |
3.70 |
|
|
BR-843AC4 |
|
1,477.2 |
1,482.8 |
5.5 |
4.5 |
0.70 |
|
|
BR-843AC4 |
|
1,503.2 |
1,506.7 |
3.5 |
2.8 |
0.53 |
|
|
BR-843AC5 |
|
1,394.0 |
1,398.0 |
4.0 |
3.4 |
0.45 |
Yuma |
|
BR-843AC5 |
|
1,412.4 |
1,432.4 |
20.1 |
16.8 |
1.36 |
|
|
BR-843AC5 |
Including |
1,429.0 |
1,431.4 |
2.3 |
2.0 |
8.53 |
|
|
BR-843AC5 |
|
1,446.0 |
1,451.0 |
5.0 |
4.2 |
0.44 |
|
|
BR-843AC5 |
|
1,503.0 |
1,511.0 |
8.0 |
6.7 |
0.59 |
|
|
BR-843AC6A |
|
1,288.5 |
1,302.0 |
13.5 |
11.2 |
1.73 |
Yuma |
|
BR-843AC6A |
|
1,308.4 |
1,319.5 |
11.1 |
9.2 |
4.39 |
|
|
BR-843AC6A |
Including |
1,308.4 |
1,311.8 |
3.4 |
2.8 |
13.33 |
|
|
BR-843AC6A |
|
1,323.5 |
1,327.9 |
4.4 |
3.7 |
0.38 |
|
|
BR-843AC6A |
|
1,334.2 |
1,408.5 |
74.3 |
61.7 |
0.53 |
|
|
BR-843AC7 |
|
1,300.0 |
1,303.0 |
3.0 |
2.4 |
1.33 |
Yuma |
|
BR-843AC7 |
|
1,308.7 |
1,314.2 |
5.5 |
4.5 |
0.60 |
|
|
BR-843AC7 |
|
1,324.5 |
1,329.0 |
4.5 |
3.6 |
0.52 |
|
|
BR-843AC7 |
|
1,334.9 |
1,341.0 |
6.2 |
5.0 |
0.67 |
|
|
BR-843AC7 |
|
1,398.4 |
1,401.8 |
3.3 |
2.7 |
0.50 |
|
|
BR-844C4 |
|
1,366.5 |
1,369.5 |
3.0 |
2.3 |
0.45 |
Bruma |
|
BR-844C5 |
|
1,434.0 |
1,438.7 |
4.7 |
4.2 |
0.86 |
Bruma |
|
BR-857 |
|
1,060.5 |
1,065.0 |
4.5 |
3.2 |
0.48 |
Discovery |
|
BR-857 |
|
1,218.0 |
1,246.5 |
28.5 |
20.5 |
0.45 |
|
|
BR-857 |
|
1,254.0 |
1,260.2 |
6.2 |
4.4 |
0.85 |
|
|
BR-857 |
|
1,294.7 |
1,299.0 |
4.3 |
3.1 |
0.91 |
|
|
BR-858 |
|
1,068.7 |
1,074.0 |
5.3 |
3.9 |
0.91 |
Bruma |
|
BR-858 |
|
1,115.0 |
1,130.0 |
15.0 |
11.1 |
0.69 |
|
|
BR-858 |
|
1,144.2 |
1,151.0 |
6.8 |
5.0 |
0.80 |
|
|
BR-859 |
|
631.5 |
639.5 |
8.0 |
5.6 |
0.45 |
Discovery |
|
BR-859 |
|
849.7 |
865.6 |
15.9 |
11.3 |
1.14 |
|
|
BR-873 |
|
851.4 |
855.0 |
3.6 |
2.9 |
2.94 |
Yuma |
|
BR-873 |
|
860.3 |
864.1 |
3.9 |
3.1 |
0.86 |
|
|
BR-873 |
|
971.7 |
983.1 |
11.5 |
9.2 |
0.42 |
|
|
BR-873 |
|
1,009.6 |
1,018.7 |
9.1 |
7.3 |
1.37 |
|
|
BR-873 |
|
1,026.0 |
1,038.0 |
12.1 |
9.6 |
4.12 |
|
|
BR-873 |
Including |
1,032.5 |
1,033.7 |
1.3 |
1.0 |
31.18 |
|
|
BR-873 |
|
1,044.0 |
1,047.0 |
3.0 |
2.4 |
0.43 |
|
|
BR-873 |
|
1,059.0 |
1,063.5 |
4.5 |
3.6 |
0.56 |
|
|
BR-873 |
|
1,071.0 |
1,076.0 |
5.0 |
4.0 |
0.55 |
|
|
BR-873 |
|
1,099.8 |
1,104.3 |
4.5 |
3.6 |
0.58 |
|
|
BR-874 |
|
895.5 |
898.5 |
3.0 |
2.4 |
0.48 |
Yuma |
|
BR-874 |
|
910.9 |
916.1 |
5.2 |
4.1 |
0.98 |
|
|
BR-874 |
|
957.5 |
966.0 |
8.5 |
6.7 |
0.40 |
|
|
BR-874 |
|
978.7 |
981.8 |
3.1 |
2.4 |
0.49 |
|
|
BR-875 |
|
861.6 |
885.2 |
23.6 |
19.5 |
0.43 |
Discovery |
|
BR-875 |
|
909.5 |
917.7 |
8.2 |
6.8 |
1.17 |
|
|
BR-875 |
|
943.5 |
946.5 |
3.0 |
2.5 |
0.31 |
|
|
BR-875 |
|
960.0 |
967.0 |
7.0 |
5.8 |
0.76 |
|
|
BR-875 |
|
980.0 |
997.5 |
17.5 |
14.5 |
3.00 |
|
|
BR-875 |
Including |
981.0 |
984.6 |
3.6 |
3.0 |
11.48 |
|
|
BR-875 |
|
1,006.0 |
1,017.0 |
11.0 |
9.1 |
0.51 |
|
|
BR-876 |
|
681.6 |
714.7 |
33.1 |
27.5 |
1.03 |
Discovery |
|
BR-876 |
Including |
683.5 |
685.9 |
2.4 |
2.0 |
4.15 |
|
|
BR-876 |
|
721.5 |
733.5 |
12.0 |
10.0 |
0.63 |
|
|
BR-876 |
|
790.5 |
794.7 |
4.2 |
3.5 |
0.96 |
|
|
BR-876 |
|
887.9 |
906.0 |
18.1 |
15.0 |
0.64 |
|
|
BR-877 |
|
762.9 |
803.0 |
40.2 |
33.7 |
0.65 |
Discovery |
|
BR-877 |
|
817.6 |
832.5 |
14.9 |
12.5 |
0.57 |
|
|
BR-877 |
|
846.8 |
898.2 |
51.4 |
43.1 |
0.76 |
|
|
BR-877 |
Including |
881.5 |
882.0 |
0.5 |
0.4 |
42.50 |
|
|
BR-879 |
|
895.5 |
898.5 |
3.0 |
2.6 |
0.43 |
Discovery |
|
BR-879 |
|
967.6 |
983.2 |
15.6 |
13.4 |
0.91 |
|
|
BR-879 |
|
992.0 |
995.1 |
3.1 |
2.7 |
1.01 |
|
|
BR-879 |
|
1,035.0 |
1,053.2 |
18.2 |
15.7 |
0.76 |
|
|
BR-887 |
|
1,046.1 |
1,055.0 |
8.9 |
6.4 |
2.55 |
Yuma |
|
BR-887 |
|
1,106.3 |
1,113.8 |
7.5 |
5.4 |
0.96 |
|
|
BR-887 |
|
1,206.3 |
1,221.9 |
15.6 |
11.2 |
7.55 |
|
|
BR-887 |
Including |
1,208.1 |
1,216.9 |
8.8 |
6.3 |
12.92 |
|
|
BR-887 |
|
1,228.4 |
1,241.4 |
13.0 |
9.4 |
1.09 |
|
|
BR-888 |
|
1,850.4 |
1,854.0 |
3.6 |
3.1 |
1.42 |
Yuma |
|
BR-888 |
|
2,002.3 |
2,024.2 |
21.9 |
19.1 |
2.34 |
|
|
BR-888 |
Including |
2,008.6 |
2,015.0 |
6.4 |
5.6 |
3.14 |
|
|
BR-888 |
And including |
2,021.1 |
2,024.2 |
3.1 |
2.7 |
5.76 |
|
|
BR-888C1 |
|
1,988.5 |
2,051.2 |
62.7 |
50.8 |
0.95 |
Yuma |
|
BR-888C2 |
|
1,990.4 |
1,997.2 |
6.9 |
6.0 |
0.69 |
Yuma |
|
BR-888C2 |
|
2,008.2 |
2,020.6 |
12.3 |
10.7 |
3.88 |
|
|
BR-888C2 |
Including |
2,009.3 |
2,013.6 |
4.3 |
3.8 |
9.52 |
|
|
BR-892 |
|
1,049.6 |
1,078.8 |
29.2 |
23.1 |
0.71 |
Discovery |
|
BR-892 |
|
1,086.3 |
1,091.3 |
5.0 |
3.9 |
0.70 |
|
|
BR-892 |
|
1,110.0 |
1,113.0 |
3.0 |
2.4 |
0.62 |
|
|
BR-892 |
|
1,119.9 |
1,147.8 |
27.8 |
22.0 |
1.20 |
|
|
BR-892 |
Including |
1,143.8 |
1,147.8 |
4.0 |
3.2 |
4.60 |
|
|
BR-892 |
|
1,162.5 |
1,179.0 |
16.5 |
13.0 |
0.43 |
|
|
BR-893 |
|
990.0 |
993.3 |
3.3 |
2.7 |
4.03 |
Discovery |
|
BR-893 |
Including |
990.0 |
992.5 |
2.5 |
2.1 |
5.14 |
|
|
BR-893 |
|
1,027.2 |
1,031.8 |
4.6 |
3.9 |
0.80 |
|
|
BR-893 |
|
1,053.3 |
1,057.9 |
4.7 |
3.9 |
0.79 |
|
|
BR-893 |
|
1,065.7 |
1,096.1 |
30.4 |
25.5 |
0.48 |
|
|
BR-893 |
|
1,112.3 |
1,120.4 |
8.1 |
6.8 |
0.72 |
|
|
BR-893 |
|
1,158.4 |
1,163.2 |
4.8 |
4.0 |
1.08 |
|
|
BR-893 |
|
1,179.0 |
1,183.5 |
4.5 |
3.8 |
0.41 |
|
|
BR-893 |
|
1,211.2 |
1,215.2 |
4.0 |
3.4 |
0.69 |
|
|
BR-894 |
|
168.3 |
174.0 |
5.7 |
4.7 |
0.85 |
Discovery |
|
BR-894 |
|
964.6 |
972.5 |
7.9 |
6.6 |
0.81 |
|
|
BR-894 |
|
988.4 |
992.3 |
3.9 |
3.2 |
0.39 |
|
|
BR-894 |
|
1,047.5 |
1,089.6 |
42.1 |
35.0 |
1.26 |
|
|
BR-894 |
Including |
1,056.7 |
1,059.0 |
2.3 |
1.9 |
3.64 |
|
|
BR-894 |
|
1,110.2 |
1,120.2 |
10.0 |
8.3 |
0.61 |
|
|
BR-894 |
|
1,123.3 |
1,126.6 |
3.3 |
2.7 |
0.52 |
|
|
BR-895 |
|
1,027.5 |
1,032.0 |
4.5 |
4.0 |
0.63 |
Discovery |
|
BR-895 |
|
1,211.5 |
1,239.5 |
28.0 |
24.9 |
1.10 |
|
|
BR-895 |
Including |
1,216.3 |
1,219.6 |
3.3 |
3.0 |
3.86 |
|
|
BR-895 |
|
1,247.6 |
1,264.5 |
17.0 |
15.1 |
0.68 |
|
|
BR-895 |
|
1,271.0 |
1,279.8 |
8.8 |
7.8 |
0.40 |
|
|
BR-895 |
|
1,283.6 |
1,303.7 |
20.1 |
17.9 |
0.79 |
|
|
BR-895 |
|
1,382.5 |
1,385.9 |
3.4 |
3.0 |
1.24 |
|
|
BR-896 |
|
860.4 |
916.7 |
56.3 |
44.5 |
1.86 |
Discovery |
|
BR-896 |
Including |
881.6 |
888.4 |
6.8 |
5.4 |
7.82 |
|
|
BR-896 |
|
1,132.3 |
1,133.8 |
1.5 |
1.2 |
27.60 |
|
|
BR-897A |
|
738.0 |
793.3 |
55.3 |
40.9 |
0.77 |
Discovery |
|
BR-897A |
|
847.5 |
870.7 |
23.2 |
17.2 |
0.73 |
|
|
BR-897A |
|
891.4 |
894.4 |
3.0 |
2.2 |
0.60 |
|
|
BR-898A |
|
880.5 |
936.0 |
55.6 |
48.9 |
1.01 |
Discovery |
|
BR-898A |
Including |
928.6 |
934.5 |
5.9 |
5.2 |
3.92 |
|
|
BR-898A |
|
978.0 |
986.3 |
8.3 |
7.3 |
0.47 |
|
|
BR-898A |
|
997.3 |
1,008.6 |
11.4 |
10.0 |
1.36 |
|
|
BR-898A |
|
1,014.0 |
1,043.0 |
29.0 |
25.5 |
2.30 |
|
|
BR-898A |
Including |
1,032.0 |
1,034.3 |
2.3 |
2.0 |
3.13 |
|
|
BR-898A |
And including |
1,039.5 |
1,041.5 |
2.0 |
1.8 |
15.56 |
|
|
BR-898A |
|
1,060.5 |
1,065.0 |
4.5 |
4.0 |
0.68 |
|
|
BR-900BC1B |
|
1,059.0 |
1,065.5 |
6.5 |
5.7 |
0.46 |
Yauro |
|
BR-900BC1B |
|
1,092.3 |
1,098.4 |
6.2 |
5.4 |
5.71 |
|
|
BR-900BC1B |
Including |
1,095.3 |
1,096.3 |
1.0 |
0.9 |
32.20 |
|
|
BR-900BC2A |
|
1,002.2 |
1,014.0 |
11.9 |
10.2 |
3.82 |
Yauro |
|
BR-900BC2A |
Including |
1,007.1 |
1,007.7 |
0.5 |
0.5 |
71.60 |
|
|
BR-900BC2A |
|
1,082.2 |
1,088.1 |
5.8 |
5.0 |
2.24 |
|
|
BR-900BC2A |
Including |
1,082.5 |
1,085.7 |
3.2 |
2.7 |
3.52 |
|
|
BR-901 |
|
718.8 |
724.0 |
5.2 |
4.4 |
1.80 |
Bruma |
|
BR-901 |
|
859.9 |
875.8 |
15.9 |
13.3 |
0.60 |
|
|
BR-901 |
|
892.3 |
912.4 |
20.1 |
16.9 |
1.29 |
|
|
BR-901 |
Including |
898.0 |
901.4 |
3.4 |
2.8 |
3.58 |
|
|
BR-902 |
|
984.6 |
1,020.2 |
35.6 |
32.0 |
0.86 |
Discovery |
|
BR-902 |
|
1,049.5 |
1,062.3 |
12.8 |
11.5 |
1.42 |
|
|
BR-902 |
Including |
1,059.6 |
1,062.3 |
2.7 |
2.4 |
3.21 |
|
|
BR-902 |
|
1,090.0 |
1,095.4 |
5.3 |
4.8 |
0.63 |
|
|
BR-902 |
|
1,113.0 |
1,120.3 |
7.3 |
6.6 |
0.42 |
|
|
BR-902 |
|
1,138.0 |
1,151.3 |
13.3 |
12.0 |
0.65 |
|
|
BR-903 |
|
526.1 |
531.0 |
4.9 |
4.2 |
1.50 |
Discovery |
|
BR-903 |
|
798.0 |
801.7 |
3.6 |
3.1 |
0.33 |
|
|
BR-903 |
|
806.3 |
833.1 |
26.8 |
22.8 |
0.48 |
|
|
BR-903 |
|
847.0 |
851.7 |
4.7 |
4.0 |
0.48 |
|
|
BR-903 |
|
858.0 |
863.0 |
5.0 |
4.3 |
1.13 |
|
|
BR-903 |
|
872.8 |
884.8 |
12.1 |
10.2 |
0.92 |
|
|
BR-903 |
|
907.0 |
910.5 |
3.5 |
3.0 |
1.10 |
|
|
BR-903 |
|
930.2 |
933.8 |
3.6 |
3.1 |
1.04 |
|
|
BR-904 |
|
590.3 |
598.6 |
8.3 |
5.9 |
1.11 |
Discovery |
|
BR-904 |
|
661.0 |
664.0 |
3.0 |
2.2 |
3.32 |
|
|
BR-911A |
|
988.3 |
992.8 |
4.5 |
3.2 |
0.79 |
Auro |
|
BR-911A |
|
1,043.8 |
1,078.0 |
34.2 |
23.9 |
0.62 |
|
|
BR-912 |
|
927.1 |
931.5 |
4.4 |
3.4 |
1.42 |
Auro |
|
BR-912 |
|
937.3 |
956.8 |
19.5 |
15.4 |
1.11 |
|
|
BR-913 |
|
1,431.8 |
1,435.3 |
3.5 |
3.0 |
0.50 |
Auro |
|
BR-914 |
|
532.2 |
540.0 |
7.8 |
6.8 |
0.68 |
Discovery |
|
BR-914 |
|
884.4 |
891.4 |
7.0 |
6.1 |
0.79 |
|
|
BR-914 |
|
901.6 |
906.2 |
4.7 |
4.0 |
0.68 |
|
|
BR-914 |
|
914.6 |
922.8 |
8.2 |
7.1 |
1.34 |
|
|
BR-914 |
|
1,003.5 |
1,023.0 |
19.5 |
17.0 |
1.16 |
|
|
DL-132C1 |
|
859.5 |
871.5 |
12.1 |
10.2 |
2.88 |
Hinge |
|
DL-132C1 |
Including |
859.5 |
865.4 |
5.9 |
5.0 |
5.52 |
|
|
DL-132C1 |
|
1,044.7 |
1,051.5 |
6.8 |
5.8 |
5.47 |
|
|
DL-132C1 |
Including |
1,044.7 |
1,048.3 |
3.6 |
3.1 |
9.33 |
|
|
DL-132C1 |
|
1,136.6 |
1,140.7 |
4.1 |
3.4 |
1.18 |
|
|
DL-132C2 |
|
880.4 |
885.7 |
5.4 |
4.2 |
0.66 |
Hinge |
|
DL-132C2 |
|
1,030.7 |
1,042.2 |
11.5 |
9.0 |
2.38 |
|
|
DL-132C2 |
Including |
1,037.8 |
1,041.4 |
3.6 |
2.8 |
5.18 |
|
|
DL-132C3 |
|
913.4 |
925.4 |
12.1 |
9.8 |
1.61 |
Hinge |
|
DL-132C3 |
Including |
920.1 |
923.0 |
3.0 |
2.4 |
4.54 |
|
|
DL-132C4 |
|
885.3 |
888.7 |
3.5 |
2.9 |
0.55 |
Hinge |
|
DL-132C4 |
|
1,043.1 |
1,059.0 |
15.9 |
13.4 |
6.08 |
|
|
DL-132C4 |
Including |
1,043.1 |
1,046.8 |
3.7 |
3.1 |
22.65 |
|
APPENDIX B
Great Bear: LP long section demonstrating potential for
extension of a high-grade underground resource.
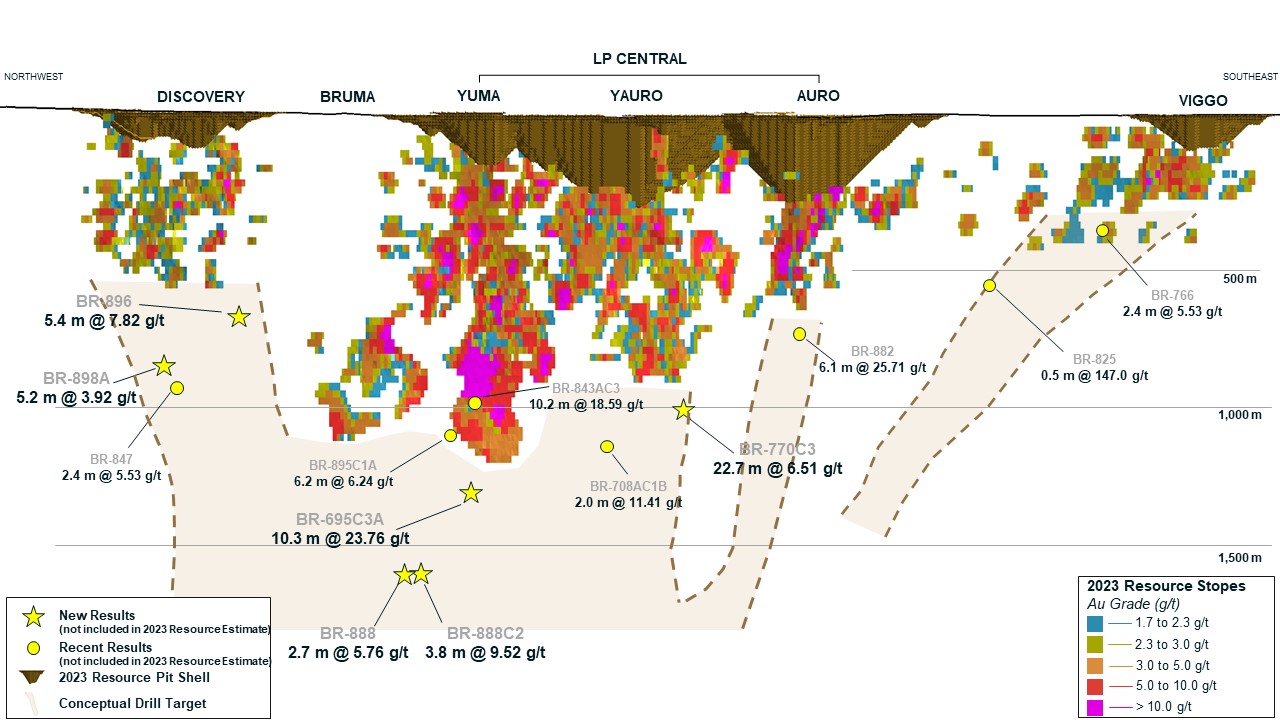
An infographic accompanying this announcement is available at
https://www.globenewswire.com/NewsRoom/AttachmentNg/067d4efe-0392-48ea-95d6-f71e7312ec74
Composites generated from drill intersections received since the
May 7, 2024, news release includes assays from 47 fully assayed
drill holes at the LP zone and 4 fully assayed drill holes at the
Hinge and Limb zones. Composites are generated using 0.3 g/t
minimum grade, maximum linear internal dilution of 5.0 m, and
allows short high-grade intervals greater than 8 GXM to be
retained. Results are preliminary in nature and are subject to
on-going QA/QC. For full list of significant, composited assay
results, see Appendix A.
Cautionary statement on forward-looking
information
All statements, other than statements of
historical fact, contained or incorporated by reference in this
news release including, but not limited to, any information as to
the future financial or operating performance of Kinross,
constitute “forward-looking information” or “forward-looking
statements” within the meaning of certain securities laws,
including the provisions of the Securities Act (Ontario) and the
provisions for “safe harbor” under the United States Private
Securities Litigation Reform Act of 1995 and are based on
expectations, estimates and projections as of the date of this news
release. Forward-looking statements contained in this news release,
include, but are not limited to, those under the headings (or
headings that include) “2024 second-quarter highlights”, “CEO
commentary”, “Development Projects and Exploration”, “Operating
Results”, and “Sustainability”, as well as statements with respect
to our guidance for production, cost guidance, including production
costs of sales, all-in sustaining cost of sales, and capital
expenditures; statements with respect to our guidance for cash flow
and free cash flow; the declaration, payment and sustainability of
the Company’s dividends; identification of additional resources and
reserves or the conversion of resources to reserves; the Company’s
liquidity; the Company’s plan to reduce debt; the schedules
budgets, and forecast economics for the Company’s development
projects; budgets for and future prospects for exploration,
development and operation at the Company’s operations and projects,
including the Great Bear project; potential mine life extensions at
the Company’s operations; the Company’s balance sheet and liquidity
outlook, as well as references to other possible events including,
the future price of gold and silver, costs of production, operating
costs; price inflation; capital expenditures, costs and timing of
the development of projects and new deposits, estimates and the
realization of such estimates (such as mineral or gold reserves and
resources or mine life), success of exploration, development and
mining, currency fluctuations, capital requirements, project
studies, government regulation, permit applications, environmental
risks and proceedings, and resolution of pending litigation. The
words “advance”, “continue”, “expects”, “focus”, “guidance”, “on
plan”, “on track”, “opportunity”, “plan”, “potential”, “priority”,
“target”, “upside” or variations of or similar such words and
phrases or statements that certain actions, events or results may,
could, should or will be achieved, received or taken, or will occur
or result and similar such expressions identify forward-looking
statements. Forward-looking statements are necessarily based upon a
number of estimates and assumptions that, while considered
reasonable by Kinross as of the date of such statements, are
inherently subject to significant business, economic and
competitive uncertainties and contingencies. The estimates, models
and assumptions of Kinross referenced, contained or incorporated by
reference in this news release, which may prove to be incorrect,
include, but are not limited to, the various assumptions set forth
herein and in our Management’s Discussion and Analysis (“MD&A”)
for the year ended December 31, 2023, and the Annual Information
Form dated March 27, 2024 as well as: (1) there being no
significant disruptions affecting the operations of the Company,
whether due to extreme weather events (including, without
limitation, excessive snowfall, excessive or lack of rainfall, in
particular, the potential for further production curtailments at
Paracatu resulting from insufficient rainfall and the operational
challenges at Fort Knox and Bald Mountain resulting from excessive
rainfall or snowfall, which can impact costs and/or production) and
other or related natural disasters, labour disruptions (including
but not limited to strikes or workforce reductions), supply
disruptions, power disruptions, damage to equipment, pit wall
slides or otherwise; (2) permitting, development, operations and
production from the Company’s operations and development projects
being consistent with Kinross’ current expectations including,
without limitation: the maintenance of existing permits and
approvals and the timely receipt of all permits and authorizations
necessary for the operation of Tasiast; water and power supply and
continued operation of the tailings reprocessing facility at
Paracatu; permitting of the Great Bear project (including the
consultation process with Indigenous groups), permitting and
development of the Lobo-Marte project; in each case in a manner
consistent with the Company’s expectations; and the successful
completion of exploration consistent with the Company’s
expectations at the Company’s projects; (3) political and legal
developments in any jurisdiction in which the Company operates
being consistent with its current expectations including, without
limitation, restrictions or penalties imposed, or actions taken, by
any government, including but not limited to amendments to the
mining laws, and potential power rationing and tailings facility
regulations in Brazil (including those related to financial
assurance requirements), potential amendments to water laws and/or
other water use restrictions and regulatory actions in Chile, new
dam safety regulations, potential amendments to minerals and mining
laws and energy levies laws, new regulations relating to work
permits, potential amendments to customs and mining laws (including
but not limited to amendments to the VAT) and the potential
application of the tax code in Mauritania, potential amendments to
and enforcement of tax laws in Mauritania (including, but not
limited to, the interpretation, implementation, application and
enforcement of any such laws and amendments thereto), potential
third party legal challenges to existing permits, and the impact of
any trade tariffs being consistent with Kinross’ current
expectations; (4) the completion of studies, including scoping
studies, preliminary economic assessments, pre-feasibility or
feasibility studies, on the timelines currently expected and the
results of those studies being consistent with Kinross’ current
expectations; (5) the exchange rate between the Canadian dollar,
Brazilian real, Chilean peso, Mauritanian ouguiya and the U.S.
dollar being approximately consistent with current levels; (6)
certain price assumptions for gold and silver; (7) prices for
diesel, natural gas, fuel oil, electricity and other key supplies
being approximately consistent with the Company’s expectations; (8)
attributable production and cost of sales forecasts for the Company
meeting expectations; (9) the accuracy of the current mineral
reserve and mineral resource estimates of the Company and Kinross’
analysis thereof being consistent with expectations (including but
not limited to ore tonnage and ore grade estimates), future mineral
resource and mineral reserve estimates being consistent with
preliminary work undertaken by the Company, mine plans for the
Company’s current and future mining operations, and the Company’s
internal models; (10) labour and materials costs increasing on a
basis consistent with Kinross’ current expectations; (11) the terms
and conditions of the legal and fiscal stability agreements for
Tasiast being interpreted and applied in a manner consistent with
their intent and Kinross’ expectations and without material
amendment or formal dispute (including without limitation the
application of tax, customs and duties exemptions and royalties);
(12) asset impairment potential; (13) the regulatory and
legislative regime regarding mining, electricity production and
transmission (including rules related to power tariffs) in Brazil
being consistent with Kinross’ current expectations; (14) access to
capital markets, including but not limited to maintaining our
current credit ratings consistent with the Company’s current
expectations; (15) potential direct or indirect operational impacts
resulting from infectious diseases or pandemics; (16) changes in
national and local government legislation or other government
actions, including the Canadian federal impact assessment regime;
(17) litigation, regulatory proceedings and audits, and the
potential ramifications thereof, being concluded in a manner
consistent with the Corporation’s expectations (including without
limitation litigation in Chile relating to the alleged damage of
wetlands and the scope of any remediation plan or other
environmental obligations arising therefrom); (18) the Company’s
financial results, cash flows and future prospects being consistent
with Company expectations in amounts sufficient to permit sustained
dividend payments; and (19) the impacts of detected pit wall
instability at Round Mountain and Bald Mountain being consistent
with the Company’s expectations. Known and unknown factors could
cause actual results to differ materially from those projected in
the forward-looking statements. Such factors include, but are not
limited to: the inaccuracy of any of the foregoing assumptions;
fluctuations in the currency markets; fluctuations in the spot and
forward price of gold or certain other commodities (such as fuel
and electricity); price inflation of goods and services; changes in
the discount rates applied to calculate the present value of net
future cash flows based on country-specific real weighted average
cost of capital; changes in the market valuations of peer group
gold producers and the Company, and the resulting impact on market
price to net asset value multiples; changes in various market
variables, such as interest rates, foreign exchange rates, gold or
silver prices and lease rates, or global fuel prices, that could
impact the mark-to-market value of outstanding derivative
instruments and ongoing payments/receipts under any financial
obligations; risks arising from holding derivative instruments
(such as credit risk, market liquidity risk and mark-to-market
risk); changes in national and local government legislation,
taxation (including but not limited to income tax, advance income
tax, stamp tax, withholding tax, capital tax, tariffs, value-added
or sales tax, capital outflow tax, capital gains tax, windfall or
windfall profits tax, production royalties, excise tax,
customs/import or export taxes/duties, asset taxes, asset transfer
tax, property use or other real estate tax, together with any
related fine, penalty, surcharge, or interest imposed in connection
with such taxes), controls, policies and regulations; the security
of personnel and assets; political or economic developments in
Canada, the United States, Chile, Brazil, Mauritania or other
countries in which Kinross does business or may carry on business;
business opportunities that may be presented to, or pursued by, us;
our ability to successfully integrate acquisitions and complete
divestitures; operating or technical difficulties in connection
with mining, development or refining activities; employee
relations; litigation or other claims against, or regulatory
investigations and/or any enforcement actions, administrative
orders or sanctions in respect of the Company (and/or its
directors, officers, or employees) including, but not limited to,
securities class action litigation in Canada and/or the United
States, environmental litigation or regulatory proceedings or any
investigations, enforcement actions and/or sanctions under any
applicable anti-corruption, international sanctions and/or
anti-money laundering laws and regulations in Canada, the United
States or any other applicable jurisdiction; the speculative nature
of gold exploration and development including, but not limited to,
the risks of obtaining and maintaining necessary licenses and
permits; diminishing quantities or grades of reserves; adverse
changes in our credit ratings; and contests over title to
properties, particularly title to undeveloped properties. In
addition, there are risks and hazards associated with the business
of gold exploration, development and mining, including
environmental hazards, industrial accidents, unusual or unexpected
formations, pressures, cave-ins, flooding and gold bullion losses
(and the risk of inadequate insurance, or the inability to obtain
insurance, to cover these risks). Many of these uncertainties and
contingencies can directly or indirectly affect, and could cause,
Kinross’ actual results to differ materially from those expressed
or implied in any forward-looking statements made by, or on behalf
of, Kinross, including but not limited to resulting in an
impairment charge on goodwill and/or assets. There can be no
assurance that forward-looking statements will prove to be
accurate, as actual results and future events could differ
materially from those anticipated in such statements.
Forward-looking statements are provided for the purpose of
providing information about management’s expectations and plans
relating to the future. All of the forward-looking statements made
in this news release are qualified by this cautionary statement and
those made in our other filings with the securities regulators of
Canada and the United States including, but not limited to, the
cautionary statements made in the “Risk Analysis” section of our
MD&A for the year ended December 31, 2023, and the “Risk
Factors” set forth in the Company’s Annual Information Form dated
March 27, 2024. These factors are not intended to represent a
complete list of the factors that could affect Kinross. Kinross
disclaims any intention or obligation to update or revise any
forward-looking statements or to explain any material difference
between subsequent actual events and such forward-looking
statements, except to the extent required by applicable
law.
Key Sensitivities
Approximately 70%-80% of the Company's costs
are denominated in U.S. dollars.
A 10% change in foreign currency exchange
rates would be expected to result in an approximate $20 impact on
production cost of sales per equivalent ounce
sold6.
Specific to the Brazilian real, a 10% change
in the exchange rate would be expected to result in an approximate
$40 impact on Brazilian production cost of sales per equivalent
ounce sold.
Specific to the Chilean peso, a 10% change
in the exchange rate would be expected to result in an approximate
$30 impact on Chilean production cost of sales per equivalent ounce
sold.
A $10 per barrel change in the price of oil
would be expected to result in an approximate $3 impact on
production cost of sales per equivalent ounce sold.
A $100 change in the price of gold would be
expected to result in an approximate $4 impact on production cost
of sales per equivalent ounce sold as a result of a change in
royalties.
Other information
Where we say "we", "us", "our", the
"Company", or "Kinross" in this news release, we mean Kinross Gold
Corporation and/or one or more or all of its subsidiaries, as may
be applicable.
The technical information about the
Company’s mineral properties contained in this news release has
been prepared under the supervision of Mr. Nicos Pfeiffer, an
officer of the Company who is a “qualified person” within the
meaning of National Instrument 43-101.
Source: Kinross Gold Corporation
1 These figures are non-GAAP financial measures and
ratios, as applicable, and are defined and reconciled on pages 16
to 21 of this news release. Non-GAAP financial measures and ratios
have no standardized meaning under IFRS and therefore, may not be
comparable to similar measures presented by other
issuers.
2 “Margins” per equivalent ounce sold is defined as
average realized gold price per ounce less production cost of sales
per equivalent ounce sold.
3 “Total liquidity” is defined as the sum of cash and
cash equivalents, as reported on the interim condensed consolidated
balance sheets, and available credit under the Company’s credit
facilities, including the $100.0 million increase in the Export
Development Canada (EDC) facility as of July 1, 2024 (as calculated
in Section 6 Liquidity and Capital Resources of Kinross’ MD&A
for the three and six months ended June 30, 2024).
4 “Average realized gold price per ounce” is defined as
gold metal sales divided by total gold ounces sold.
5 “Available credit” is defined as available credit under
the Company’s credit facilities, including the $100.0 million
increase in the EDC facility as of July 1, 2024, and is calculated
in Section 6 Liquidity and Capital Resources of Kinross’ MD&A
for the three and six months ended June 30, 2024.
6 Refers to all of the currencies in the countries where
the Company has mining operations, fluctuating simultaneously by
10% in the same direction, either appreciating or depreciating,
taking into consideration the impact of hedging and the weighting
of each currency within our consolidated cost
structure.


Kinross Gold (TSX:K)
Gráfica de Acción Histórica
De Oct 2024 a Nov 2024

Kinross Gold (TSX:K)
Gráfica de Acción Histórica
De Nov 2023 a Nov 2024
