UNITED STATES
SECURITIES AND EXCHANGE COMMISSION
Washington, D.C. 20549
FORM 6-K
REPORT OF FOREIGN ISSUER
PURSUANT TO RULE 13a-16 OR 15b-16 OF
THE SECURITIES EXCHANGE ACT OF 1934
For the month of July 2024
Commission File Number 001-35991
AENZA S.A.A.
(Exact name of registrant as specified in its charter)
N/A
(Translation of registrant’s name into English)
Av. Petit Thouars 4957
Miraflores
Lima 34, Peru
(Address of principal executive offices)
Indicate by check mark whether the registrant files
or will file annual reports under cover Form 20-F or Form 40-F.
Form 20-F ☒ Form 40-F ☐

AENZA S.A.A. AND SUBSIDIARIES
INTERIM CONDENSED CONSOLIDATED
FINANCIAL STATEMENTS (UNAUDITED)
(Free translation from the original in Spanish)
AENZA S.A.A. AND SUBSIDIARIES
INTERIM CONDENSED CONSOLIDATED FINANCIAL STATEMENTS
AS OF JUNE 30, 2024 AND FOR THE THREE AND SIX-MONTH PERIODS THEN ENDED (UNAUDITED)
| S/ |
= |
Peruvian Sol |
| US$ |
= |
United States dollar |
AENZA S.A.A. and Subsidiaries
Interim Condensed Consolidated Statement of Financial Position
As of December 31, 2023, and June 30, 2024
| | |
| |
As of | | |
As of | |
| | |
| |
December 31, | | |
June 30, | |
| In thousands of soles | |
Note | |
2023 | | |
2024 | |
| Assets | |
| |
| | |
| |
| Current assets | |
| |
| | |
| |
| Cash and cash equivalents | |
9 | |
| 1,003,888 | | |
| 765,845 | |
| Trade accounts receivable, net | |
10 | |
| 1,061,801 | | |
| 1,093,646 | |
| Accounts receivable from related parties | |
11 | |
| 15,443 | | |
| 14,588 | |
| Other accounts receivable, net | |
12 | |
| 348,072 | | |
| 635,543 | |
| Inventories, net | |
13 | |
| 360,497 | | |
| 363,441 | |
| Prepaid expenses | |
| |
| 29,098 | | |
| 22,524 | |
| Total current assets | |
| |
| 2,818,799 | | |
| 2,895,587 | |
| | |
| |
| | | |
| | |
| Non-current assets | |
| |
| | | |
| | |
| Trade accounts receivable, net | |
10 | |
| 768,971 | | |
| 777,072 | |
| Accounts receivable from related parties | |
11 | |
| 528,285 | | |
| 545,099 | |
| Other accounts receivable, net | |
12 | |
| 311,404 | | |
| 252,286 | |
| Inventories, net | |
13 | |
| 70,282 | | |
| 70,363 | |
| Prepaid expenses | |
| |
| 14,081 | | |
| 3,968 | |
| Investments in associates and joint ventures | |
14 | |
| 12,747 | | |
| 13,227 | |
| Investment property, net | |
15 | |
| 58,260 | | |
| 56,377 | |
| Property, plant and equipment, net | |
15 | |
| 307,165 | | |
| 302,826 | |
| Right-of-use assets, net | |
15 | |
| 36,295 | | |
| 30,143 | |
| Intangible assets and goodwill, net | |
15 | |
| 752,456 | | |
| 725,104 | |
| Deferred tax asset | |
22 | |
| 255,763 | | |
| 253,643 | |
| Total non-current assets | |
| |
| 3,115,709 | | |
| 3,030,108 | |
| | |
| |
| | | |
| | |
| Total assets | |
| |
| 5,934,508 | | |
| 5,925,695 | |
AENZA S.A.A. and Subsidiaries
Interim Condensed Consolidated Statement of Financial Position
As of December 31, 2023, and June 30, 2024
| | |
| |
As of | | |
As of | |
| | |
| |
December 31, | | |
June 30, | |
| In thousands of soles | |
Note | |
2023 | | |
2024 | |
| Liabilities | |
| |
| | |
| |
| Current liabilities | |
| |
| | |
| |
| Borrowings | |
16 | |
| 516,029 | | |
| 107,255 | |
| Bonds | |
17 | |
| 81,538 | | |
| 94,932 | |
| Trade accounts payable | |
18 | |
| 1,164,266 | | |
| 993,806 | |
| Accounts payable to related parties | |
11 | |
| 44,372 | | |
| 57,676 | |
| Current income tax | |
| |
| 38,398 | | |
| 17,233 | |
| Other accounts payable | |
19 | |
| 608,828 | | |
| 578,738 | |
| Other provisions | |
20 | |
| 117,086 | | |
| 116,631 | |
| Total current liabilities | |
| |
| 2,570,517 | | |
| 1,966,271 | |
| | |
| |
| | | |
| | |
| Non-current liabilities | |
| |
| | | |
| | |
| Borrowings | |
16 | |
| 306,678 | | |
| 300,622 | |
| Bonds | |
17 | |
| 741,387 | | |
| 1,401,338 | |
| Trade accounts payable | |
18 | |
| 4,001 | | |
| 211 | |
| Accounts payable to related parties | |
11 | |
| 28,564 | | |
| 29,204 | |
| Other accounts payable | |
19 | |
| 509,311 | | |
| 510,942 | |
| Other provisions | |
20 | |
| 98,067 | | |
| 105,269 | |
| Deferred tax liability | |
22 | |
| 188,694 | | |
| 193,830 | |
| Total non-current liabilities | |
| |
| 1,876,702 | | |
| 2,541,416 | |
| Total liabilities | |
| |
| 4,447,219 | | |
| 4,507,687 | |
| | |
| |
| | | |
| | |
| Equity | |
| |
| | | |
| | |
| Capital | |
21 | |
| 1,371,965 | | |
| 1,371,965 | |
| Other reserves | |
| |
| (68,440 | ) | |
| (73,004 | ) |
| Retained earnings | |
| |
| (41,148 | ) | |
| (108,037 | ) |
| Equity attributable to controlling interest in the
Company | |
| |
| 1,262,377 | | |
| 1,190,924 | |
| Non-controlling interest | |
29 | |
| 224,912 | | |
| 227,084 | |
| Total equity | |
| |
| 1,487,289 | | |
| 1,418,008 | |
| Total liabilities and equity | |
| |
| 5,934,508 | | |
| 5,925,695 | |
The accompanying notes are part of the consolidated
financial statements.
AENZA S.A.A. and Subsidiaries
Interim Condensed Consolidated Statement of Profit or Loss
For the periods ended June 30, 2023, and 2024
| | |
| |
For the three-month period | | |
For the six-month period | |
| | |
| |
ended June 30, | | |
ended June 30, | |
| In thousands of soles | |
Note | |
2023 | | |
2024 | | |
2023 | | |
2024 | |
| Revenue | |
| |
| | |
| | |
| | |
| |
| Revenue from construction activities | |
| |
| 589,395 | | |
| 547,282 | | |
| 1,038,038 | | |
| 1,093,265 | |
| Revenue from services provided | |
| |
| 259,763 | | |
| 253,942 | | |
| 516,343 | | |
| 532,576 | |
| Revenue from real estate and sale of goods | |
| |
| 187,763 | | |
| 169,992 | | |
| 332,678 | | |
| 342,660 | |
| Total revenue from ordinary
activities arising from contracts with customers | |
23 | |
| 1,036,921 | | |
| 971,216 | | |
| 1,887,059 | | |
| 1,968,501 | |
| Cost | |
| |
| | | |
| | | |
| | | |
| | |
| Cost of construction activities | |
| |
| (561,255 | ) | |
| (535,388 | ) | |
| (1,019,147 | ) | |
| (1,082,189 | ) |
| Cost of services provided | |
| |
| (201,509 | ) | |
| (186,615 | ) | |
| (399,933 | ) | |
| (379,957 | ) |
| Cost of real estate and sale of goods | |
| |
| (139,871 | ) | |
| (133,176 | ) | |
| (252,771 | ) | |
| (262,319 | ) |
| Cost of sales and services | |
24 | |
| (902,635 | ) | |
| (855,179 | ) | |
| (1,671,851 | ) | |
| (1,724,465 | ) |
| Gross profit | |
| |
| 134,286 | | |
| 116,037 | | |
| 215,208 | | |
| 244,036 | |
| Administrative expenses | |
24 | |
| (57,060 | ) | |
| (54,691 | ) | |
| (102,923 | ) | |
| (104,464 | ) |
| Other income and expenses | |
25 | |
| 568 | | |
| 574 | | |
| 1,001 | | |
| (456 | ) |
| Operating profit | |
| |
| 77,794 | | |
| 61,920 | | |
| 113,286 | | |
| 139,116 | |
| Financial expenses | |
26.A | |
| (44,625 | ) | |
| (58,162 | ) | |
| (86,437 | ) | |
| (118,520 | ) |
| Financial income | |
26.A | |
| 8,132 | | |
| 5,726 | | |
| 26,164 | | |
| 13,275 | |
| Interests for present value of financial asset or liability | |
26.B | |
| 6,357 | | |
| (12,434 | ) | |
| 20,163 | | |
| (14,739 | ) |
Share of the profit or loss of associates and joint
ventures accounted for using the equity method | |
14 | |
| 792 | | |
| 822 | | |
| 1,656 | | |
| 1,630 | |
| Profit before income tax | |
| |
| 48,450 | | |
| (2,128 | ) | |
| 74,832 | | |
| 20,762 | |
| Income tax expense | |
27 | |
| (40,032 | ) | |
| (35,600 | ) | |
| (72,413 | ) | |
| (58,025 | ) |
| Profit (loss) for the period | |
| |
| 8,418 | | |
| (37,728 | ) | |
| 2,419 | | |
| (37,263 | ) |
| | |
| |
| | | |
| | | |
| | | |
| | |
| Profit (loss) attributable to: | |
| |
| | | |
| | | |
| | | |
| | |
| Controlling interest in the Company | |
| |
| (5,174 | ) | |
| (51,349 | ) | |
| (22,562 | ) | |
| (66,889 | ) |
| Non-controlling interest | |
| |
| 13,592 | | |
| 13,621 | | |
| 24,981 | | |
| 29,626 | |
| | |
| |
| 8,418 | | |
| (37,728 | ) | |
| 2,419 | | |
| (37,263 | ) |
| | |
| |
| | | |
| | | |
| | | |
| | |
Loss per share attributable to controlling
interest
in the Company during the period | |
31 | |
| (0.004 | ) | |
| (0.038 | ) | |
| (0.019 | ) | |
| (0.049 | ) |
Diluted loss per share
attributable to controlling
interest in the Company during the period | |
31 | |
| (0.004 | ) | |
| (0.038 | ) | |
| (0.019 | ) | |
| (0.049 | ) |
The accompanying notes are part of the consolidated
financial statements.
AENZA S.A.A. and Subsidiaries
Interim Condensed Consolidated Statement of Other Comprehensive Income
For the periods ended June 30, 2023, and 2024
| | |
For the three-month period | | |
For the six-month period | |
| In thousands of soles | |
ended June 30, | | |
ended June 30, | |
| | |
2023 | | |
2024 | | |
2023 | | |
2024 | |
| Profit (loss) for the period | |
| 8,418 | | |
| (37,728 | ) | |
| 2,419 | | |
| (37,263 | ) |
| Other comprehensive income: | |
| | | |
| | | |
| | | |
| | |
| Items that may be subsequently reclassified to profit or loss | |
| | | |
| | | |
| | | |
| | |
| Foreign currency translation adjustment, net of tax | |
| 9,001 | | |
| (9,160 | ) | |
| 9,173 | | |
| (4,575 | ) |
| Exchange difference from net investment in a foreign
operation, net of tax | |
| (243 | ) | |
| - | | |
| 79 | | |
| (1 | ) |
| Other comprehensive income for
the period, net of tax | |
| 8,758 | | |
| (9,160 | ) | |
| 9,252 | | |
| (4,576 | ) |
| Total comprehensive income for
the period | |
| 17,176 | | |
| (46,888 | ) | |
| 11,671 | | |
| (41,839 | ) |
| Comprehensive income attributable to: | |
| | | |
| | | |
| | | |
| | |
| Controlling interest in the Company | |
| 2,693 | | |
| (60,458 | ) | |
| (13,345 | ) | |
| (71,453 | ) |
| Non-controlling interest | |
| 14,483 | | |
| 13,570 | | |
| 25,016 | | |
| 29,614 | |
| | |
| 17,176 | | |
| (46,888 | ) | |
| 11,671 | | |
| (41,839 | ) |
The accompanying notes are part of the consolidated
financial statements.
AENZA S.A.A. and Subsidiaries
Interim Condensed Consolidated Statement of Changes in Equity
For the periods ended June 30, 2023, and 2024
| | |
| |
Number of | | |
| | |
| | |
| | |
| | |
| | |
| | |
| | |
Non- | | |
| |
| | |
| |
shares in | | |
| | |
Legal | | |
Voluntary | | |
Share | | |
Other | | |
Retained | | |
| | |
controlling | | |
| |
| In thousands of soles | |
Note | |
thousands | | |
Capital | | |
reserve | | |
reserve | | |
premium | | |
reserves | | |
earnings | | |
Total | | |
interest | | |
Total | |
| Balances as of January 1, 2023 | |
| |
| 1,196,980 | | |
| 1,196,980 | | |
| 132,011 | | |
| 29,974 | | |
| 1,142,092 | | |
| (97,191 | ) | |
| (1,342,362 | ) | |
| 1,061,504 | | |
| 284,502 | | |
| 1,346,006 | |
| Profit (loss) for the period | |
| |
| - | | |
| - | | |
| - | | |
| - | | |
| - | | |
| - | | |
| (22,562 | ) | |
| (22,562 | ) | |
| 24,981 | | |
| 2,419 | |
| Foreign currency translation adjustment | |
| |
| - | | |
| - | | |
| - | | |
| - | | |
| - | | |
| 9,138 | | |
| - | | |
| 9,138 | | |
| 35 | | |
| 9,173 | |
| Exchange difference from net investment in a foreign operation | |
| |
| - | | |
| - | | |
| - | | |
| - | | |
| - | | |
| 79 | | |
| - | | |
| 79 | | |
| - | | |
| 79 | |
| Comprehensive income of the period | |
| |
| - | | |
| - | | |
| - | | |
| - | | |
| - | | |
| 9,217 | | |
| (22,562 | ) | |
| (13,345 | ) | |
| 25,016 | | |
| 11,671 | |
| Transactions with shareholders: | |
| |
| | | |
| | | |
| | | |
| | | |
| | | |
| | | |
| | | |
| | | |
| | | |
| | |
| Dividend distribution | |
30 | |
| - | | |
| - | | |
| - | | |
| - | | |
| - | | |
| - | | |
| - | | |
| - | | |
| (50,735 | ) | |
| (50,735 | ) |
Acquisition of (profit distribution to) non-controlling
interests, net | |
| |
| - | | |
| - | | |
| - | | |
| - | | |
| - | | |
| - | | |
| - | | |
| - | | |
| (9,889 | ) | |
| (9,889 | ) |
| Total transactions with shareholders | |
| |
| - | | |
| - | | |
| - | | |
| - | | |
| - | | |
| - | | |
| - | | |
| - | | |
| (60,624 | ) | |
| (60,624 | ) |
| Balances as of June 30, 2023 | |
| |
| 1,196,980 | | |
| 1,196,980 | | |
| 132,011 | | |
| 29,974 | | |
| 1,142,092 | | |
| (87,974 | ) | |
| (1,364,924 | ) | |
| 1,048,159 | | |
| 248,894 | | |
| 1,297,053 | |
| Balances as of January 1, 2024 | |
| |
| 1,371,965 | | |
| 1,371,965 | | |
| - | | |
| - | | |
| - | | |
| (68,440 | ) | |
| (41,148 | ) | |
| 1,262,377 | | |
| 224,912 | | |
| 1,487,289 | |
| Profit (loss) for the period | |
| |
| - | | |
| - | | |
| - | | |
| - | | |
| - | | |
| - | | |
| (66,889 | ) | |
| (66,889 | ) | |
| 29,626 | | |
| (37,263 | ) |
| Foreign currency translation adjustment | |
| |
| - | | |
| - | | |
| - | | |
| - | | |
| - | | |
| (4,564 | ) | |
| - | | |
| (4,564 | ) | |
| (11 | ) | |
| (4,575 | ) |
| Exchange difference from net investment in a foreign operation | |
| |
| - | | |
| - | | |
| - | | |
| - | | |
| - | | |
| - | | |
| - | | |
| - | | |
| (1 | ) | |
| (1 | ) |
| Comprehensive income of the period | |
| |
| - | | |
| - | | |
| - | | |
| - | | |
| - | | |
| (4,564 | ) | |
| (66,889 | ) | |
| (71,453 | ) | |
| 29,614 | | |
| (41,839 | ) |
| Transactions with shareholders: | |
| |
| | | |
| | | |
| | | |
| | | |
| | | |
| | | |
| | | |
| | | |
| | | |
| | |
| Dividend distribution | |
30 | |
| - | | |
| - | | |
| - | | |
| - | | |
| - | | |
| - | | |
| - | | |
| - | | |
| (24,618 | ) | |
| (24,618 | ) |
Acquisition of (profit distribution to) non-controlling
interests, net | |
| |
| - | | |
| - | | |
| - | | |
| - | | |
| - | | |
| - | | |
| - | | |
| - | | |
| (2,824 | ) | |
| (2,824 | ) |
| Total transactions with shareholders | |
| |
| - | | |
| - | | |
| - | | |
| - | | |
| - | | |
| - | | |
| - | | |
| - | | |
| (27,442 | ) | |
| (27,442 | ) |
| Balances as of June 30, 2024 | |
| |
| 1,371,965 | | |
| 1,371,965 | | |
| - | | |
| - | | |
| - | | |
| (73,004 | ) | |
| (108,037 | ) | |
| 1,190,924 | | |
| 227,084 | | |
| 1,418,008 | |
The accompanying notes are part of the consolidated
financial statements.
AENZA S.A.A. and Subsidiaries
Interim Condensed Consolidated Statement of Cash Flows
For the periods ended June 30, 2023, and 2024
| | |
| |
For the three-month period | | |
For the six-month period | |
| | |
| |
ended June 30, | | |
ended June 30, | |
| In thousands of soles | |
Note | |
2023 | | |
2024 | | |
2023 | | |
2024 | |
| | |
| |
| | |
| | |
| | |
| |
| Operating activities | |
| |
| | |
| | |
| | |
| |
| Profit (loss) before income tax | |
| |
| 48,450 | | |
| (2,128 | ) | |
| 74,832 | | |
| 20,762 | |
| Adjustments to profit not affecting
cash flows from operating activities: | |
| |
| | | |
| | | |
| | | |
| | |
| Depreciation | |
15 | |
| 17,442 | | |
| 14,874 | | |
| 35,378 | | |
| 28,494 | |
| Amortization of intangible assets | |
15 | |
| 39,775 | | |
| 34,848 | | |
| 75,061 | | |
| 66,105 | |
| Reversal of impairment of inventories | |
| |
| (385 | ) | |
| - | | |
| - | | |
| - | |
| Impairment (reversal) of accounts receivable and other accounts receivable | |
| |
| 4,522 | | |
| (9 | ) | |
| 2,180 | | |
| 110 | |
| Debt condonation | |
| |
| - | | |
| - | | |
| (192 | ) | |
| - | |
| Impairment of property, plant and equipment | |
| |
| 1,309 | | |
| - | | |
| 1,318 | | |
| - | |
| Other provisions | |
| |
| 3,067 | | |
| 4,393 | | |
| 9,122 | | |
| 10,070 | |
| Financial expense, net | |
| |
| 16,564 | | |
| 78,739 | | |
| 46,797 | | |
| 123,526 | |
| Insurance recovery | |
| |
| - | | |
| (51 | ) | |
| - | | |
| (75 | ) |
| Share of the profit and loss of associates and joint ventures accounted for using the equity method | |
14 | |
| (792 | ) | |
| (822 | ) | |
| (1,656 | ) | |
| (1,630 | ) |
| Reversal of provisions | |
| |
| (1,255 | ) | |
| (731 | ) | |
| (4,726 | ) | |
| (1,300 | ) |
| Reversal of disposal of assets | |
| |
| (723 | ) | |
| (137 | ) | |
| (1,258 | ) | |
| (666 | ) |
| (Profit) loss on sale of property, plant and equipment and intangible assets | |
| |
| 1,301 | | |
| (2,549 | ) | |
| 881 | | |
| (3,036 | ) |
| (Profit) loss on remeasurement of accounts receivable and accounts payable | |
| |
| (7,781 | ) | |
| 12,533 | | |
| (20,322 | ) | |
| 14,838 | |
| Net variations in assets and liabilities: | |
| |
| | | |
| | | |
| | | |
| | |
| Trade accounts receivable | |
| |
| (34,412 | ) | |
| 40,870 | | |
| 1,720 | | |
| (39,955 | ) |
| Other accounts receivable | |
| |
| 7,825 | | |
| (61,900 | ) | |
| (16,060 | ) | |
| (49,167 | ) |
| Other accounts receivable from related parties | |
| |
| 16,090 | | |
| (19,585 | ) | |
| (7,313 | ) | |
| (16,750 | ) |
| Inventories | |
| |
| (1,538 | ) | |
| (8,783 | ) | |
| (46,094 | ) | |
| (2,508 | ) |
| Prepaid expenses and other assets | |
| |
| 11,292 | | |
| 18,109 | | |
| (15,690 | ) | |
| 23,626 | |
| Trade accounts payable | |
| |
| 16,370 | | |
| (69,266 | ) | |
| (8,799 | ) | |
| (188,411 | ) |
| Other accounts payable | |
| |
| 86,817 | | |
| (69,576 | ) | |
| 147,163 | | |
| (31,785 | ) |
| Other accounts payable to related parties | |
| |
| (25,772 | ) | |
| 17,343 | | |
| (5,615 | ) | |
| 17,078 | |
| Other provisions | |
| |
| (1,734 | ) | |
| (3,610 | ) | |
| (4,960 | ) | |
| (4,855 | ) |
| Interest paid | |
| |
| (38,120 | ) | |
| (131,611 | ) | |
| (79,532 | ) | |
| (172,206 | ) |
| Payments for purchases of intangible assets - Concessions | |
| |
| - | | |
| (1,198 | ) | |
| - | | |
| (2,904 | ) |
| Income tax paid | |
| |
| (26,771 | ) | |
| (41,086 | ) | |
| (88,474 | ) | |
| (74,625 | ) |
| Net cash provided by (applied to) operating activities | |
| |
| 131,541 | | |
| (191,333 | ) | |
| 93,761 | | |
| (285,264 | ) |
| Investing activities | |
| |
| | | |
| | | |
| | | |
| | |
| Proceeds from sale of property, plant and equipment and intangible assets | |
| |
| - | | |
| 5,239 | | |
| 1,043 | | |
| 5,955 | |
| Interest received | |
| |
| 7,047 | | |
| 5,703 | | |
| 13,782 | | |
| 13,223 | |
| Dividends received | |
| |
| 3,652 | | |
| 1,145 | | |
| 3,652 | | |
| 1,145 | |
| Acquisition of investment property | |
| |
| - | | |
| - | | |
| (2 | ) | |
| (51 | ) |
| Acquisition of intangible assets | |
| |
| (37,572 | ) | |
| (33,588 | ) | |
| (85,374 | ) | |
| (40,169 | ) |
| Acquisition of property, plant and equipment | |
| |
| (10,282 | ) | |
| (8,840 | ) | |
| (22,311 | ) | |
| (18,881 | ) |
| Net cash applied to investing activities | |
| |
| (37,155 | ) | |
| (30,341 | ) | |
| (89,210 | ) | |
| (38,778 | ) |
| Financing activities | |
| |
| | | |
| | | |
| | | |
| | |
| Borrowing received | |
| |
| 40,926 | | |
| 29,280 | | |
| 171,066 | | |
| 70,269 | |
| Bonds issued | |
| |
| | | |
| | | |
| | | |
| | |
| Amortization of borrowings received | |
| |
| (35,969 | ) | |
| (439,244 | ) | |
| (104,793 | ) | |
| (493,312 | ) |
| Amortization of bonds issued | |
| |
| (16,051 | ) | |
| (20,028 | ) | |
| (33,845 | ) | |
| (38,092 | ) |
| Payment for debt transaction costs | |
| |
| 1,819 | | |
| (21,062 | ) | |
| (17 | ) | |
| (21,261 | ) |
| Dividends paid to non-controlling interest | |
| |
| (22,256 | ) | |
| (4,197 | ) | |
| (47,044 | ) | |
| (14,851 | ) |
| Cash received (return of contributions) from non-controlling shareholders | |
| |
| (673 | ) | |
| (4,000 | ) | |
| (9,889 | ) | |
| (4,000 | ) |
| Net cash provided by (applied to) financing activities | |
| |
| (32,204 | ) | |
| (459,251 | ) | |
| (24,522 | ) | |
| (501,247 | ) |
| Net increase (decrease) in cash | |
| |
| 62,182 | | |
| (680,925 | ) | |
| (19,971 | ) | |
| (825,289 | ) |
| Exchange difference | |
| |
| 3,463 | | |
| 4,651 | | |
| (6,358 | ) | |
| 1,079 | |
| Cash and cash equivalents at the beginning of the period | |
| |
| 825,580 | | |
| 855,952 | | |
| 917,554 | | |
| 1,003,888 | |
| Cash and cash equivalents at the end of the period | |
9 | |
| 891,225 | | |
| 179,678 | | |
| 891,225 | | |
| 179,678 | |
| Non-cash transactions: | |
| |
| | | |
| | | |
| | | |
| | |
| Capitalization of interests | |
| |
| 99 | | |
| 248 | | |
| 290 | | |
| 517 | |
| Dividends declared to non-controlling interest | |
| |
| - | | |
| 17,852 | | |
| - | | |
| 17,852 | |
| Acquisition of right-of-use assets | |
| |
| 985 | | |
| 1,879 | | |
| 2,669 | | |
| 2,375 | |
| Transfer to restricted funds | |
| |
| - | | |
| 193,647 | | |
| - | | |
| 193,647 | |
The accompanying notes are part of the consolidated financial statements.
AENZA S.A.A. and Subsidiaries
Notes to the Interim Condensed Consolidated Financial Statements
As of December 31, 2023, and June 30, 2024
A. Incorporation
and operations
AENZA S.A.A. (hereinafter the “Company”
or “AENZA”) is the parent Company of the AENZA Corporation, which comprise the Company and its subsidiaries (hereinafter,
the “Corporation”) and is mainly engaged in holding investments in its subsidiaries. Additionally, the Company provides specialized
management consulting services and operational leasing of offices to the companies of the Corporation. The Company registered office is
at Av. Petit Thouars N° 4957, Miraflores, Lima.
The Corporation is a conglomerate of companies
with operations including different business activities, the most significant are engineering and construction, energy, infrastructure
(public concession ownership and operation) and real estate businesses. See details of operating segments in note 7.
B. Authorization
for Financial Statements Issuance
The interim condensed consolidated financial statements
for the period ended June 30, 2024, have been authorized by Management and the Board of Directors on July 24, 2024.
The consolidated financial statements for the
year ended December 31, 2023 were approved by the General Shareholders’ Meeting on March 27, 2024.
C. Compliance
with laws and regulations
As a result of the investigations into the cases
known as Club de la Construccion and Lava Jato, AENZA has entered into an effective collaboration process. On September 15, 2022, the
Plea Agreement (the Agreement), was entered into between the Public Prosecutor’s Office, the Attorney General’s Office and
the Company, whereby AENZA accepted they were utilized by certain former executives to commit illicit acts in a series of periods until
2016 and committed to pay a civil penalty to the Peruvian Government of approximately S/488.9 million (approximately S/333.3 million and
US$40.7 million). Agreement was homologated by judgment dated August 11, 2023 and entered into force with its consent, which was notified
to AENZA on December 11, 2023.
According to the Agreement, payment shall be made
within twelve (12) years at a legal interest rate in soles and dollars (3.1% and 1.9% annual interest as of June 30, 2024, respectively).
The Company also undertakes to establish a series of guarantees through a trust composed of: i) a trust agreement that includes shares
issued by a subsidiary of the Company, ii) mortgage on a property owned by the Company, and iii) a guarantee account with funds equivalent
to the annual installment for the following year. Among other conditions, the Agreement includes a restriction for AENZA and subsidiaries
Cumbra Peru S.A. and UNNA Transporte S.A.C. to participate in public infrastructure and construction, and road maintenance contracts for
two (2) years from the approval of the Agreement. The other member companies of the Corporation are not subject to any impediment or prohibition
to contract with the Peruvian Government.
On December 27, 2023, the initial installment
of the Civil Compensation was paid to the Peruvian Government for S/10.3 million and US$1.2 million. As of June 30, 2024, the balance
amounts to S/480.9 million (S/469.8 million as of December 31, 2023) (see note 19.a).
Pursuant to the provisions of the Agreement that
excludes AENZA from the scope of Law 30737, the company has requested the Ministry of Justice to exclude it from the Lists of Category
2 and 3 Subjects provided for in said law.
AENZA S.A.A. and Subsidiaries
Notes to the Interim Condensed Consolidated Financial Statements
As of December 31, 2023, and June 30, 2024
D. NYSE
Delisting and SEC Deregistration of the ADSs issued by AENZA.
On October 31, 2023, AENZA’s Board of Directors
decided to initiate the delisting process of shares, represented by American Depositary Securities (ADSs), on the New York Stock Exchange
(NYSE), and the deregistration process of such instruments with the Securities and Exchange Commission of the United States of America
(SEC) and the termination of the ADS Program.
In the opinion of Management and the Board of
Directors, this decision will generate efficiencies for the Company, considering the low liquidity of the ADSs and the high annual costs
of NYSE listing and SEC registration, and will not affect the Company’s long-term plans. AENZA’s shares will continue to be listed on
the Lima Stock Exchange (BVL).
December 7, 2023, was the last day of trading
of the ADSs on the NYSE. AENZA will file a Form 15F with the SEC to terminate its obligations under Section 13(a) and 15(d) of the U.S.
Securities Act of 1933 upon compliance with the requirements of such legislation.
| 2. | Basis of preparation and Summary of Material Accounting Policies |
The interim condensed consolidated financial statements
for the period ended June 30, 2024, have been prepared in accordance with IAS 34 “Interim Financial Reporting”. The interim
condensed consolidated financial statements provide comparative information regarding prior year; however, they do not include all the
information and disclosures required in the consolidated financial statements, so they must be read together with the annual consolidated
financial statements, which have been prepared in accordance with International Standards of Financial Information (hereinafter “IFRS”).
The interim condensed consolidated financial statements are presented in thousands of Peruvian Soles S/(000), unless otherwise stated.
Management continues to have a reasonable expectation
that the Corporation has adequate resources to continue in operation for a reasonable period of time and that the going concern basis
of accounting remains appropriate. Management believes that there are no material uncertainties that may cause significant doubt about
this assumption, and that there is a reasonable expectation that the Corporation has adequate resources to continue operations for the
expected future, and not less than 12 months from the end of the reporting period.
The accounting policies used in the preparation
of these interim condensed consolidated financial statements are consistent with those applied in the preparation of the consolidated
financial statements as of December 31, 2023.
| 3. | Standards, amendments, and interpretation adopted by the Corporation |
Standards, amendments and interpretation that
have entered in force as of January 1, 2024, have not had impact on the interim condensed consolidated financial statements as of June
30, 2024, and for this reason they have not been disclosed. The Corporation has not adopted in advance any amendment and modification
that are not yet effective.
| 4. | Financial Risk Management |
The Corporation’s Management is responsible
for managing financial risks. The corporation Management manages the general administration of financial risks such risks include currency
risk, price risk, fair-value and cash-flow interest rate risks, credit risk, the use of derivative and non-derivative financial instruments,
and investment of liquidity surplus, as well as financial risks; all of which are regularly supervised and monitored.
A.
Financial risk factors
The Corporation’s activities expose it to
a variety of financial risks: market risks (including currency risk, price risk, fair-value and cash-flow interest rate risks), credit
risk, and liquidity risk.
The Corporation’s general program for risk
management is mainly focused on financial market unpredictability and seeks to minimize potential adverse effects on the Corporation’s
financial performance.
AENZA S.A.A. and Subsidiaries
Notes to the Interim Condensed Consolidated Financial Statements
As of December 31, 2023, and June 30, 2024
a)
Market risks
Market risk is the risk that the fair value or
future cash flows of a financial instrument will fluctuate due to changes in market prices. Market prices involve four types of risk:
interest rate risk, exchange rate risk, commodity price risk and other price risks. Financial instruments affected by market risk include
bank deposits, trade accounts receivable, other accounts receivable, other financial liabilities, bonds, trade accounts payable, other
accounts payable and accounts receivable from and payable to related parties.
i)
Currency risk
Foreign exchange risk is the risk that the fair
value of future cash flows of a financial instrument will be reduced by adverse fluctuations in exchange rates. Management is responsible
for identifying, measuring, controlling and reporting the exposure to foreign exchange risk.
The Corporation is exposed to foreign exchange
risk arising from local transactions in foreign currencies and from its foreign operations. As of December 31, 2023 and June 30, 2024,
this exposure is focused mainly on fluctuations of the U.S. dollar, Chilean peso, and Colombian peso. The Corporation’s management monitors
this risk by analyzing the country’s macroeconomic variables.
The balances of financial assets and liabilities
denominated in foreign currencies correspond to balances in U.S. Dollars, Chilean pesos and Colombian pesos, which are stated exchange
rate published on that date, according to the currency type:
| | |
As of
December 31, | | |
As of
June 30, | |
| | |
2023 | | |
2024 | |
| | |
Buy | | |
Sale | | |
Buy | | |
Sale | |
| U.S. Dollars (a) | |
| 3.705 | | |
| 3.713 | | |
| 3.827 | | |
| 3.837 | |
| Chilean Peso (b) | |
| 0.004224 | | |
| 0.004233 | | |
| 0.004053 | | |
| 0.004063 | |
| Colombian Peso (c) | |
| 0.000969 | | |
| 0.000971 | | |
| 0.000923 | | |
| 0.000925 | |
| (a) | U.S. Dollar as published by the Superintendencia de Bancos, Seguros
y Administradoras de Fondos de Pensiones (hereinafter “SBS”). |
| (b) | Chilean peso as published by the Banco Central de Chile. |
| (c) | Colombian peso as published by Banco de la Republica de Colombia. |
The consolidated statement of financial position
as of December 31, 2023 and June 30, 2024, includes the following:
| | |
As of | | |
As of | |
| | |
December 31, | | |
June 30, | |
| In thousands of US dollars | |
2023 | | |
2024 | |
| Assets | |
| | |
| |
| Cash and cash equivalents | |
| 105,542 | | |
| 78,643 | |
| Trade accounts receivable, net | |
| 174,305 | | |
| 161,724 | |
| Accounts receivable from related parties | |
| 142,435 | | |
| 142,435 | |
| Other accounts receivable | |
| 85,535 | | |
| 134,731 | |
| | |
| 507,817 | | |
| 517,533 | |
| | |
| | | |
| | |
| Liabilities | |
| | | |
| | |
| Borrowings | |
| (213,821 | ) | |
| (98,220 | ) |
| Bonds | |
| (3,890 | ) | |
| (178,594 | ) |
| Trade accounts payable | |
| (152,383 | ) | |
| (152,828 | ) |
| Accounts payable to related parties | |
| (3,504 | ) | |
| (3,641 | ) |
| Other accounts payable | |
| (64,277 | ) | |
| (68,027 | ) |
| Other provisions | |
| (2,032 | ) | |
| (2,032 | ) |
| | |
| (439,907 | ) | |
| (503,342 | ) |
The Corporation assumes foreign exchange risk
because it does not use derivative financial instruments to mitigate exchange rate fluctuations.
AENZA S.A.A. and Subsidiaries
Notes to the Interim Condensed Consolidated Financial Statements
As of December 31, 2023, and June 30, 2024
For the periods ended June 30, 2023 and 2024,
the Corporation’s exchange gains and losses (see note 26.A):
| In thousands of soles | |
2023 | | |
2024 | |
| Gain | |
| 140,690 | | |
| 21,976 | |
| Loss | |
| (128,311 | ) | |
| (41,276 | ) |
| | |
| 12,379 | | |
| (19,300 | ) |
The consolidated statement of changes in equity
comprises a foreign currency translation adjustment originated by its subsidiaries. The consolidated statement of financial position includes
the following assets and liabilities in its currency (in thousands):
| | |
As of
December 31, | | |
As of
June 30, | |
| | |
2023 | | |
2024 | |
| | |
Assets | | |
Liabilities | | |
Assets | | |
Liabilities | |
| Chilean Peso | |
| 37,715,040 | | |
| 53,101,695 | | |
| 34,685,059 | | |
| 36,957,835 | |
| Colombian Peso | |
| 183,305,679 | | |
| 125,307,739 | | |
| 188,387,215 | | |
| 137,482,759 | |
ii)
Price risk
The Corporation is exposed to the risk of hydrocarbon
price fluctuations which impacts on the selling price of the products that it commercializes, which are significantly affected by changes
in global economic conditions, resource availability, and the cycles of related industries. Management considers reasonable these possible
fluctuations in the hydrocarbons prices, based in the Corporation´s economic market environment.
iii)
Fair-value and cash flow interest rate risk
Interest rate risk is the risk that the fair value
or future cash flows of a financial instrument will fluctuate due to changes in market interest rates.
The Corporation’s interest rate risk arises
mainly from its long-term borrowings. Variable rate long-term financial liabilities expose the Corporation to cash-flow interest rate
risk. Fixed-rate financial liabilities expose the Corporation to fair-value interest rate risk.
The Corporation assumes the interest rate risk,
due to they do not use financial derivative instruments for mitigate variations in the interest rate risk.
b)
Credit risk
Credit risk is the risk that a counterparty will
not meet its obligations under a financial instrument or commercial contract, resulting in a financial loss.
Credit risk for the Corporation arises from its
operating activities due to credit exposure to customers and from its financial activities, including deposits with banks and financial
institutions, foreign exchange transactions, and other financial instruments. The maximum exposure to credit risk for the consolidated
financial statements as of December 31, 2023 and June 30, 2024 is represented by the sum of cash and cash equivalents (note 9), trade
accounts receivable (note 10), accounts receivable from related parties (note 11) and other accounts receivable (note 12).
Customer credit risk is managed by Management
subject to the Corporation’s established policies, procedures and control related to customer credit risk management. The credit quality
of a customer is assessed based on an extensive credit rating scorecard and individual credit limits are defined based on this assessment.
The maximum credit risk exposure at the reporting date is the carrying value of each class of financial assets disclosed in note 10.
The Corporation assesses the concentration of
risk with respect to trade accounts receivable as low risk because sales are not concentrated in small customer groups and no customers
account for 10% or more of the Corporation’s revenues.
AENZA S.A.A. and Subsidiaries
Notes to the Interim Condensed Consolidated Financial Statements
As of December 31, 2023, and June 30, 2024
Management monitors the credit risk of other receivables
on an ongoing basis and assesses those receivables that show evidence of impairment to determine the required allowance for doubtful accounts.
Concerning loans to related parties, the Corporation
has measures in place to ensure the recovery of these loans through the controls maintained by Corporate Finance Management and the performance
evaluation conducted by the Board of Directors (note 11).
Management does not expect the Corporation to
incur in losses arisen from the performance of these counterparties, except for the ones already recorded at the consolidated financial
statements.
c) Liquidity risk
Prudent liquidity risk management implies holding
enough cash and cash equivalents, and financing available through a proper number of credit sources, and the ability to close positions
in the market. Historically, the Corporation’s cash flows from operations have enabled it to meet its obligations. The Corporation has
implemented various actions to reduce its exposure to liquidity risk and has developed a financial plan based on several steps, which
were designed with a commitment to compliance within a reasonable period of time. The financial plan is intended to meet the various obligations
at the Company and Corporation entities levels.
The Corporate Finance Office monitors the cash
flow projections made on liquidity requirements of the Corporation to ensure it exists sufficient cash to meet operational needs so that
the Corporation does not breach borrowing limits or covenants, where applicable, on any of its borrowing facilities. Less significant
financing transactions are controlled by the Finance Management of each subsidiary.
Such forecasting takes into consideration the
Corporation’s debt financing plans, covenant compliance, compliance with ratio targets in the statement of financial position and,
if applicable, with external regulatory or legal requirements.
As of June 30, 2024, the Company has a payment obligation arising from
the Plea Agreement (note 1.C). Management developed a financial plan in order to cover the aforementioned obligation and other operating
cash requirements (note 18.a).
Cash surplus on the amounts required for the administration
of working capital are invested in checking accounts that generate interest and time deposits, selecting instruments with appropriate
maturities or sufficient liquidity.
The table below analyzes the Corporation’s
financial liabilities grouped according to the remaining period from the date of the statement of financial position to the date of maturity.
The amounts disclosed in the table below are the contractual undiscounted cash flows, which include interest to be accrued according to
the established schedule.
AENZA S.A.A. and Subsidiaries
Notes to the Interim Condensed Consolidated Financial Statements
As of December 31, 2023, and June 30, 2024
| | |
| | |
Contractual cash flows | |
| | |
Carrying | | |
Less than | | |
1-2 | | |
2-5 | | |
More than | | |
| |
| In thousands of soles | |
amount | | |
1 year | | |
years | | |
years | | |
5 years | | |
Total | |
| As of December 31, 2023 | |
| | |
| | |
| | |
| | |
| | |
| |
| Other financial liabilities (except lease liability for right-of-use asset) | |
| 780,145 | | |
| 568,284 | | |
| 165,022 | | |
| 163,943 | | |
| - | | |
| 897,249 | |
| Lease liability for right-of-use asset | |
| 42,562 | | |
| 17,754 | | |
| 23,487 | | |
| 8,725 | | |
| 73 | | |
| 50,039 | |
| Bonds | |
| 822,925 | | |
| 140,546 | | |
| 177,121 | | |
| 345,473 | | |
| 679,085 | | |
| 1,342,225 | |
| Trade accounts payables (except non-financial liabilities) | |
| 1,168,267 | | |
| 1,164,266 | | |
| 4,001 | | |
| - | | |
| - | | |
| 1,168,267 | |
| Accounts payables to related parties | |
| 72,936 | | |
| 44,372 | | |
| 28,564 | | |
| - | | |
| - | | |
| 72,936 | |
| Other accounts payables and other provisions (except non-financial liabilities) | |
| 673,663 | | |
| 195,279 | | |
| 57,601 | | |
| 138,356 | | |
| 410,377 | | |
| 801,613 | |
| | |
| 3,560,498 | | |
| 2,130,501 | | |
| 455,796 | | |
| 656,497 | | |
| 1,089,535 | | |
| 4,332,329 | |
| | |
| | | |
| | | |
| | | |
| | | |
| | | |
| | |
| As of June 30, 2024 | |
| | | |
| | | |
| | | |
| | | |
| | | |
| | |
| Other financial liabilities (except lease liability for right-of-use asset) | |
| 370,697 | | |
| 114,368 | | |
| 155,446 | | |
| 165,606 | | |
| - | | |
| 435,420 | |
| Lease liability for right-of-use asset | |
| 37,180 | | |
| 16,378 | | |
| 22,842 | | |
| 3,842 | | |
| 68 | | |
| 43,130 | |
| Bonds | |
| 1,496,270 | | |
| 249,916 | | |
| 227,708 | | |
| 1,381,536 | | |
| 599,038 | | |
| 2,458,198 | |
| Trade accounts payables (except non-financial liabilities) | |
| 994,017 | | |
| 993,806 | | |
| 211 | | |
| - | | |
| - | | |
| 994,017 | |
| Accounts payables to related parties | |
| 86,880 | | |
| 57,676 | | |
| 29,204 | | |
| - | | |
| - | | |
| 86,880 | |
| Other accounts payables and other provisions (except non-financial liabilities) | |
| 671,787 | | |
| 184,525 | | |
| 55,361 | | |
| 144,788 | | |
| 404,473 | | |
| 789,147 | |
| | |
| 3,656,831 | | |
| 1,616,669 | | |
| 490,772 | | |
| 1,695,772 | | |
| 1,003,579 | | |
| 4,806,792 | |
B.
Capital management
The Corporation’s objective in managing
capital is to safeguard its ability to continue operations as a going concern basis in order to generate returns to its shareholders,
benefits to stakeholders and keep an optimal capital structure to reduce capital cost. The Corporation´s situation has led management
to monitor deviations that could cause noncompliance with covenants and hinder the renegotiation of liabilities (note 16). In special
situations and events, the Corporation identifies potential deviations, requirements and establishes a plan.
The Corporation may adjust the amount of dividends
payable to shareholders, return capital to shareholders, issue new shares or sell assets to reduce its debt to maintain or adjust the
capital structure.
The Corporation monitors its capital based on
the leverage ratio. This ratio is calculated as net debt divided by the sum of net debt plus equity. The net debt corresponds to the total
financial liabilities (including current and non-current indebtedness) adding the provision for civil compensation less cash and cash
equivalents.
As of December 31, 2023 and June 30, 2024, the
leverage ratio is as follows:
| | |
| |
As of | | |
As of | |
| | |
| |
December 31, | | |
June 30, | |
| In thousands of soles | |
Note | |
2023 | | |
2024 | |
| Total borrowing, bonds and civil compensation (*) | |
16 and 17 | |
| 2,115,471 | | |
| 2,385,080 | |
| Less: Cash and cash equivalents | |
9 | |
| (1,003,888 | ) | |
| (765,845 | ) |
| Net debt (a) | |
| |
| 1,111,583 | | |
| 1,619,235 | |
| Total equity (b) | |
| |
| 1,487,289 | | |
| 1,418,008 | |
| Total net debt plus equity (a) + (b) | |
| |
| 2,598,872 | | |
| 3,037,243 | |
| Gearing ratio | |
| |
| 0.43 | | |
| 0.53 | |
| (*) | As of June 30, 2024, the provision for civil compensation
amounts to S/480.9 million (S/469.8 as of December 31, 2023). |
During the periods ended December 31, 2023 and
June 30, 2024, there were no changes in the objectives, policies or processes related to capital management.
AENZA S.A.A. and Subsidiaries
Notes to the Interim Condensed Consolidated Financial Statements
As of December 31, 2023, and June 30, 2024
| 5. | Critical Accounting Estimates and Judgments |
Estimates and judgments used are continuously
evaluated and are based on historical experience among other factors, including expectations of future events that are believed to be
reasonable under current circumstances.
In preparing these interim condensed consolidated
financial statements, the significant judgements made by management in applying Corporation’s accounting policies and the key sources
of uncertainty were the same as those that applied to the consolidated financial statements for the year ended December 31, 2023, except
for:
Revenue recognition by completion percentage
(A.iii)
As of December 31, 2023, the Corporation recognized
service revenue from construction contracts on a percentage-of-completion basis in accordance with the product method; however, given
the current terms of customer contracts awarded beginning in 2024, management believes that the method that best reflects and measures
the transfer of control of goods and services to its customers and full satisfaction of the performance obligation is the recourse method.
Therefore, beginning in 2024, the Corporation applies the recourse method to measure the progress of all of its contractual performance
obligations being satisfied over time.
| 6. | Seasonality of Operations |
The Corporation does not present seasonality in
the operations of any of its subsidiaries; and develop its business during the normal course of the period.
Operating segments are reported consistently with
the internal reports that are reviewed by Corporation’s, chief decision-maker; that is the Executive Committee, which is led by
the Chief Executive Officer. This Committee acts as the highest authority in making operational decisions, responsible for allocating
resources and evaluating the performance of each operating segment.
Corporation’s operating segments are assessed
by the activities of the following business units: (i) engineering and construction, (ii) energy, (iii) infrastructure, and (iv) real
estate.
As set forth under IFRS 8, reportable segments
by significance of income are: ‘engineering and construction’, ‘energy’ and ‘infrastructure’. However,
Management has voluntarily decided to report on all its operating segments.
The Corporation has determined four reportable
segments. These operating segments are components of an enterprise for which separate financial information is available and periodically
evaluated by the Corporate Governance Board to decide how to allocate resources and assess performance.
The operations of Corporation in each reportable segment are as follows:
| (a) | Engineering and construction: This segment includes traditional engineering services such as architectural
planning, structural, civil and design engineering for advanced specialties including process design, simulation, and environmental services,
as well as construction at three divisions: i) civil works, such as the construction of hydroelectric power stations and other large infrastructure
facilities; (ii) electromechanical construction, such as concentrator plants, oil and natural gas pipelines, and electric transmission
lines; and iii) building construction, such as offices, residential buildings, hotels, and affordable housing projects, shopping centers,
and industrial facilities. |
AENZA S.A.A. and Subsidiaries
Notes to the Interim Condensed Consolidated Financial Statements
As of December 31, 2023, and June 30, 2024
| (b) | Energy: This segment includes oil exploration, exploitation, production, treatment, and trade in four
oil deposits, separation and trade of natural gas and its byproducts at the gas processing plant, as well as the construction and assembly
of oil facilities or those linked to the oil and gas industry. It also includes storage and dispatch of fuel and oil byproducts. |
| (c) | Infrastructure: The Corporation has long-term concessions or similar contractual arrangements in Peru
for three highways with tolls, Lima Metro, a sewage treatment plant in Lima, and operation and maintenance services for infrastructure
assets. |
| (d) | Real Estate: The Corporation mainly develops and sells properties for low- and middle-resource sectors,
which are experiencing a significant increase in available income, as well as luxury properties to a lesser degree, it also develops commercial
spaces and offices. |
The Executive Commitee uses the Adjusted EBITDA
(earnings before interest, tax, depreciation, and amortization) as the primary relevant measure to understand the Corporation’s
operating performance and its operating segments.
Adjusted EBITDA is not a measurement of results
based on International Financial Reporting Standards. The Corporation’s definition related to adjusted EBITDA may not be comparable
to similar performance measures and disclosures from other entities.
The adjusted EBITDA is reconciled to profit as
follows:
| | |
For the three-month period | | |
For the six-month period | |
| | |
ended June 30, | | |
ended June 30, | |
| In thousands of soles | |
2023 | | |
2024 | | |
2023 | | |
2024 | |
| Net profit (loss) | |
| 8,418 | | |
| (37,728 | ) | |
| 2,419 | | |
| (37,263 | ) |
| Financial income and expenses | |
| 36,493 | | |
| 52,436 | | |
| 60,273 | | |
| 105,245 | |
| Interests for present value of financial asset or liability | |
| (6,357 | ) | |
| 12,434 | | |
| (20,163 | ) | |
| 14,739 | |
| Income tax | |
| 40,032 | | |
| 35,600 | | |
| 72,413 | | |
| 58,025 | |
| Depreciation and amortization | |
| 57,217 | | |
| 49,722 | | |
| 110,439 | | |
| 94,599 | |
| Adjusted EBITDA | |
| 135,803 | | |
| 112,464 | | |
| 225,381 | | |
| 235,345 | |
The adjusted EBITDA with non-recurring items per
segment is as follows:
| | |
For the three-month period | | |
For the six-month period | |
| | |
ended June 30, | | |
ended June 30, | |
| In thousands of soles | |
2023 | | |
2024 | | |
2023 | | |
2024 | |
| Engineering and construction | |
| 162 | | |
| (9,660 | ) | |
| (29,381 | ) | |
| (29,413 | ) |
| Energy | |
| 44,996 | | |
| 57,098 | | |
| 100,841 | | |
| 113,928 | |
| Infrastructure | |
| 62,243 | | |
| 56,491 | | |
| 118,714 | | |
| 129,708 | |
| Real estate | |
| 29,097 | | |
| 8,146 | | |
| 31,145 | | |
| 20,063 | |
| Parent company operations | |
| (3,719 | ) | |
| 31,498 | | |
| (143 | ) | |
| 49,737 | |
| Intercompany eliminations | |
| 3,024 | | |
| (31,109 | ) | |
| 4,205 | | |
| (48,678 | ) |
| | |
| 135,803 | | |
| 112,464 | | |
| 225,381 | | |
| 235,345 | |
Inter-segmental sales transactions are entered
into prices similar to those that would have been agreed with unrelated third parties. Revenues from external customers reported are measured
in a consistent manner under the basis for preparation of the consolidated financial statements. Sales of goods are related to real estate
segment. Revenues from services are related to other segments.
Corporation sales and receivables are not concentrated
on a few customers. There is no external customer that represents 10% or more of Corporation’s revenue.
AENZA S.A.A. and Subsidiaries
Notes to the Interim Condensed Consolidated Financial Statements
As of December 31, 2023, and June 30, 2024
The following are the Corporation’s financial statements by operating
segment:
| | |
Engineering | | |
| | |
Infrastructure | | |
| | |
Parent | | |
| | |
| |
| In thousands of soles | |
and
construction | | |
Energy | | |
Toll roads | | |
Transportation | | |
Water
treatment | | |
Real
estate | | |
Company
operations | | |
Eliminations | | |
Consolidated | |
| As of December 31, 2023 | |
| | |
| | |
| | |
| | |
| | |
| | |
| | |
| | |
| |
| Assets | |
| | | |
| | | |
| | | |
| | | |
| | | |
| | | |
| | | |
| | | |
| | |
| Cash and cash equivalent | |
| 342,120 | | |
| 40,707 | | |
| 124,283 | | |
| 134,252 | | |
| 3,235 | | |
| 175,920 | | |
| 183,371 | | |
| - | | |
| 1,003,888 | |
| Trade accounts receivables, net | |
| 783,231 | | |
| 119,948 | | |
| 26,353 | | |
| 127,336 | | |
| 943 | | |
| 3,038 | | |
| 952 | | |
| - | | |
| 1,061,801 | |
| Accounts receivable from related parties | |
| 57,024 | | |
| 642 | | |
| 59,279 | | |
| 3,569 | | |
| 643 | | |
| 406 | | |
| 161,430 | | |
| (267,550 | ) | |
| 15,443 | |
| Other accounts receivable, net | |
| 265,378 | | |
| 40,298 | | |
| 21,101 | | |
| 6,372 | | |
| 1 | | |
| 10,418 | | |
| 6,849 | | |
| (2,345 | ) | |
| 348,072 | |
| Inventories, net | |
| 51,108 | | |
| 46,064 | | |
| 6,760 | | |
| 43,993 | | |
| - | | |
| 212,582 | | |
| - | | |
| (10 | ) | |
| 360,497 | |
| Prepaid expenses | |
| 15,461 | | |
| 2,022 | | |
| 4,651 | | |
| 334 | | |
| 169 | | |
| 71 | | |
| 6,388 | | |
| 2 | | |
| 29,098 | |
| Total current assets | |
| 1,514,322 | | |
| 249,681 | | |
| 242,427 | | |
| 315,856 | | |
| 4,991 | | |
| 402,435 | | |
| 358,990 | | |
| (269,903 | ) | |
| 2,818,799 | |
| Trade accounts receivable, net | |
| 744 | | |
| - | | |
| 6,430 | | |
| 756,990 | | |
| 1,453 | | |
| 3,354 | | |
| - | | |
| - | | |
| 768,971 | |
| Accounts receivable from related parties | |
| 298,946 | | |
| - | | |
| 17,157 | | |
| 42 | | |
| 14,015 | | |
| - | | |
| 419,282 | | |
| (221,157 | ) | |
| 528,285 | |
| Prepaid expenses | |
| - | | |
| 480 | | |
| 11,920 | | |
| 1,611 | | |
| 580 | | |
| - | | |
| - | | |
| (510 | ) | |
| 14,081 | |
| Other accounts receivable, net | |
| 102,250 | | |
| 77,116 | | |
| - | | |
| - | | |
| 7,346 | | |
| 59,764 | | |
| 64,928 | | |
| - | | |
| 311,404 | |
| Inventories, net | |
| - | | |
| - | | |
| - | | |
| - | | |
| - | | |
| 70,282 | | |
| - | | |
| - | | |
| 70,282 | |
| Investments in associates and joint ventures | |
| 968 | | |
| 10,536 | | |
| - | | |
| - | | |
| - | | |
| 2,103 | | |
| 1,737,129 | | |
| (1,737,989 | ) | |
| 12,747 | |
| Investment property, net | |
| - | | |
| - | | |
| - | | |
| 1,427 | | |
| - | | |
| 18,203 | | |
| 38,630 | | |
| - | | |
| 58,260 | |
| Property, plant and equipment, net | |
| 83,146 | | |
| 211,127 | | |
| 5,187 | | |
| 1,047 | | |
| 233 | | |
| 5,562 | | |
| 863 | | |
| - | | |
| 307,165 | |
| Intangible assets and goodwill, net | |
| 143,228 | | |
| 370,370 | | |
| 225,363 | | |
| 138 | | |
| - | | |
| 617 | | |
| 12,740 | | |
| - | | |
| 752,456 | |
| Right-of-use assets, net | |
| 4,874 | | |
| 8,270 | | |
| 3,226 | | |
| 25 | | |
| 122 | | |
| 1,317 | | |
| 28,700 | | |
| (10,239 | ) | |
| 36,295 | |
| Deferred income tax asset | |
| 153,841 | | |
| 5,142 | | |
| 24,098 | | |
| - | | |
| 421 | | |
| 15,577 | | |
| 56,670 | | |
| 14 | | |
| 255,763 | |
| Total non-current assets | |
| 787,997 | | |
| 683,041 | | |
| 293,381 | | |
| 761,280 | | |
| 24,170 | | |
| 176,779 | | |
| 2,358,942 | | |
| (1,969,881 | ) | |
| 3,115,709 | |
| Total assets | |
| 2,302,319 | | |
| 932,722 | | |
| 535,808 | | |
| 1,077,136 | | |
| 29,161 | | |
| 579,214 | | |
| 2,717,932 | | |
| (2,239,784 | ) | |
| 5,934,508 | |
| Liabilities | |
| | | |
| | | |
| | | |
| | | |
| | | |
| | | |
| | | |
| | | |
| | |
| Borrowings | |
| 24,081 | | |
| 39,052 | | |
| 15,358 | | |
| 26 | | |
| 5 | | |
| 11,618 | | |
| 437,729 | | |
| (11,840 | ) | |
| 516,029 | |
| Bonds | |
| 3,611 | | |
| - | | |
| 49,369 | | |
| 28,558 | | |
| - | | |
| - | | |
| - | | |
| - | | |
| 81,538 | |
| Trade accounts payable | |
| 928,109 | | |
| 111,816 | | |
| 48,232 | | |
| 38,272 | | |
| 121 | | |
| 21,622 | | |
| 16,094 | | |
| - | | |
| 1,164,266 | |
| Accounts payable to related parties | |
| 78,561 | | |
| 80,357 | | |
| 47,599 | | |
| 69,632 | | |
| 7 | | |
| 10,990 | | |
| 17,154 | | |
| (259,928 | ) | |
| 44,372 | |
| Current income tax | |
| 19,370 | | |
| 677 | | |
| 3,159 | | |
| 13,160 | | |
| 54 | | |
| 323 | | |
| 1,655 | | |
| - | | |
| 38,398 | |
| Other accounts payable | |
| 416,927 | | |
| 26,122 | | |
| 34,045 | | |
| 10,429 | | |
| 1,167 | | |
| 86,968 | | |
| 33,170 | | |
| - | | |
| 608,828 | |
| Provisions | |
| 83,831 | | |
| 20,215 | | |
| 1,171 | | |
| 1,925 | | |
| - | | |
| 193 | | |
| 9,751 | | |
| - | | |
| 117,086 | |
| Total current liabilities | |
| 1,554,490 | | |
| 278,239 | | |
| 198,933 | | |
| 162,002 | | |
| 1,354 | | |
| 131,714 | | |
| 515,553 | | |
| (271,768 | ) | |
| 2,570,517 | |
| Borrowings | |
| 697 | | |
| 84,989 | | |
| 594 | | |
| - | | |
| 123 | | |
| 73,058 | | |
| 147,399 | | |
| (182 | ) | |
| 306,678 | |
| Bonds | |
| 10,834 | | |
| - | | |
| 130,750 | | |
| 599,803 | | |
| - | | |
| - | | |
| - | | |
| - | | |
| 741,387 | |
| Trade accounts payable | |
| - | | |
| - | | |
| - | | |
| 4,001 | | |
| - | | |
| - | | |
| - | | |
| - | | |
| 4,001 | |
| Other accounts payable | |
| 47,984 | | |
| - | | |
| 493 | | |
| 161 | | |
| 3,141 | | |
| - | | |
| 457,532 | | |
| - | | |
| 509,311 | |
| Accounts payable to related parties | |
| 7,481 | | |
| - | | |
| 1,226 | | |
| 28,563 | | |
| 23,146 | | |
| - | | |
| 197,485 | | |
| (229,337 | ) | |
| 28,564 | |
| Provisions | |
| 12,366 | | |
| 46,287 | | |
| 10,002 | | |
| 2,228 | | |
| - | | |
| - | | |
| 27,184 | | |
| - | | |
| 98,067 | |
| Deferred tax liability | |
| 58,804 | | |
| 66,415 | | |
| - | | |
| 63,473 | | |
| - | | |
| - | | |
| 2 | | |
| - | | |
| 188,694 | |
| Total non-current liabilities | |
| 138,166 | | |
| 197,691 | | |
| 143,065 | | |
| 698,229 | | |
| 26,410 | | |
| 73,058 | | |
| 829,602 | | |
| (229,519 | ) | |
| 1,876,702 | |
| Total liabilities | |
| 1,692,656 | | |
| 475,930 | | |
| 341,998 | | |
| 860,231 | | |
| 27,764 | | |
| 204,772 | | |
| 1,345,155 | | |
| (501,287 | ) | |
| 4,447,219 | |
| Equity attributable to controlling interest in the Company | |
| 604,039 | | |
| 424,874 | | |
| 146,259 | | |
| 162,680 | | |
| 1,397 | | |
| 289,942 | | |
| 1,369,744 | | |
| (1,736,558 | ) | |
| 1,262,377 | |
| Non-controlling interest | |
| 5,624 | | |
| 31,918 | | |
| 47,551 | | |
| 54,225 | | |
| - | | |
| 84,500 | | |
| 3,033 | | |
| (1,939 | ) | |
| 224,912 | |
| Total liabilities and equity | |
| 2,302,319 | | |
| 932,722 | | |
| 535,808 | | |
| 1,077,136 | | |
| 29,161 | | |
| 579,214 | | |
| 2,717,932 | | |
| (2,239,784 | ) | |
| 5,934,508 | |
AENZA S.A.A. and Subsidiaries
Notes to the Interim Condensed Consolidated Financial Statements
As of December 31, 2023, and June 30, 2024
| | |
Engineering | | |
| | |
Infrastructure | | |
| | |
Parent | | |
| | |
| |
| In
thousands of soles | |
and
Construction | | |
Energy | | |
Toll
roads | | |
Transportation | | |
Water treatment | | |
Real estate | | |
Company
operations | | |
Eliminations | | |
Consolidated | |
| As of June 30, 2024 | |
| | |
| | |
| | |
| | |
| | |
| | |
| | |
| | |
| |
| Assets | |
| | |
| | |
| | |
| | |
| | |
| | |
| | |
| | |
| |
| Cash and cash equivalents | |
| 126,903 | | |
| 94,237 | | |
| 131,624 | | |
| 125,666 | | |
| 4,065 | | |
| 160,101 | | |
| 123,249 | | |
| - | | |
| 765,845 | |
| Trade accounts receivables, net | |
| 807,573 | | |
| 104,835 | | |
| 45,726 | | |
| 129,023 | | |
| 1,555 | | |
| 3,024 | | |
| 1,910 | | |
| - | | |
| 1,093,646 | |
| Accounts receivable from related parties | |
| 73,080 | | |
| 286 | | |
| 63,353 | | |
| 586 | | |
| 332 | | |
| 150 | | |
| 228,328 | | |
| (351,527 | ) | |
| 14,588 | |
| Other accounts receivable, net | |
| 305,256 | | |
| 30,120 | | |
| 17,438 | | |
| 6,687 | | |
| 1 | | |
| 4,695 | | |
| 273,693 | | |
| (2,347 | ) | |
| 635,543 | |
| Inventories, net | |
| 43,568 | | |
| 43,055 | | |
| 6,149 | | |
| 43,115 | | |
| - | | |
| 227,550 | | |
| - | | |
| 4 | | |
| 363,441 | |
| Prepaid expenses | |
| 9,920 | | |
| 5,703 | | |
| 2,673 | | |
| 2,618 | | |
| 95 | | |
| 99 | | |
| 1,416 | | |
| - | | |
| 22,524 | |
| Total current assets | |
| 1,366,300 | | |
| 278,236 | | |
| 266,963 | | |
| 307,695 | | |
| 6,048 | | |
| 395,619 | | |
| 628,596 | | |
| (353,870 | ) | |
| 2,895,587 | |
| Trade accounts receivable, net | |
| 262 | | |
| - | | |
| 6,189 | | |
| 766,338 | | |
| 1,284 | | |
| 2,999 | | |
| - | | |
| - | | |
| 777,072 | |
| Accounts receivable from related parties | |
| 308,245 | | |
| - | | |
| 17,721 | | |
| 3,064 | | |
| 14,015 | | |
| 6,046 | | |
| 435,823 | | |
| (239,815 | ) | |
| 545,099 | |
| Prepaid expenses | |
| - | | |
| 487 | | |
| 1,893 | | |
| 1,544 | | |
| 554 | | |
| - | | |
| - | | |
| (510 | ) | |
| 3,968 | |
| Other accounts receivable, net | |
| 36,060 | | |
| 72,241 | | |
| - | | |
| - | | |
| 7,346 | | |
| 63,855 | | |
| 65,932 | | |
| 6,852 | | |
| 252,286 | |
| Inventories, net | |
| - | | |
| - | | |
| - | | |
| - | | |
| - | | |
| 70,363 | | |
| - | | |
| - | | |
| 70,363 | |
| Investments in associates and joint ventures | |
| 176 | | |
| 11,021 | | |
| - | | |
| - | | |
| - | | |
| 2,103 | | |
| 1,699,460 | | |
| (1,699,533 | ) | |
| 13,227 | |
| Investment property, net | |
| - | | |
| - | | |
| - | | |
| 1,388 | | |
| - | | |
| 17,341 | | |
| 37,648 | | |
| - | | |
| 56,377 | |
| Property, plant and equipment, net | |
| 79,156 | | |
| 210,796 | | |
| 4,744 | | |
| 1,032 | | |
| 217 | | |
| 5,876 | | |
| 1,005 | | |
| - | | |
| 302,826 | |
| Intangible assets and goodwill, net | |
| 135,936 | | |
| 376,665 | | |
| 199,415 | | |
| 92 | | |
| - | | |
| 585 | | |
| 12,411 | | |
| - | | |
| 725,104 | |
| Right-of-use assets, net | |
| 2,536 | | |
| 5,734 | | |
| 1,861 | | |
| 3 | | |
| 117 | | |
| 662 | | |
| 24,385 | | |
| (5,155 | ) | |
| 30,143 | |
| Deferred income tax asset | |
| 145,627 | | |
| 5,844 | | |
| 26,319 | | |
| - | | |
| 471 | | |
| 15,003 | | |
| 60,383 | | |
| (4 | ) | |
| 253,643 | |
| Total non-current assets | |
| 707,998 | | |
| 682,788 | | |
| 258,142 | | |
| 773,461 | | |
| 24,004 | | |
| 184,833 | | |
| 2,337,047 | | |
| (1,938,165 | ) | |
| 3,030,108 | |
| Total assets | |
| 2,074,298 | | |
| 961,024 | | |
| 525,105 | | |
| 1,081,156 | | |
| 30,052 | | |
| 580,452 | | |
| 2,965,643 | | |
| (2,292,035 | ) | |
| 5,925,695 | |
| Liabilities | |
| | | |
| | | |
| | | |
| | | |
| | | |
| | | |
| | | |
| | | |
| | |
| Borrowings | |
| 17,536 | | |
| 39,110 | | |
| 14,980 | | |
| 4 | | |
| 5 | | |
| 14,814 | | |
| 27,335 | | |
| (6,529 | ) | |
| 107,255 | |
| Bonds | |
| 3,732 | | |
| - | | |
| 49,385 | | |
| 29,466 | | |
| - | | |
| - | | |
| 12,349 | | |
| - | | |
| 94,932 | |
| Trade accounts payable | |
| 762,526 | | |
| 104,348 | | |
| 50,432 | | |
| 30,587 | | |
| 231 | | |
| 21,284 | | |
| 24,398 | | |
| - | | |
| 993,806 | |
| Accounts payable to related parties | |
| 145,344 | | |
| 79,990 | | |
| 100,492 | | |
| 53,609 | | |
| 6 | | |
| 11,316 | | |
| 14,499 | | |
| (347,580 | ) | |
| 57,676 | |
| Current income tax | |
| 906 | | |
| 5,853 | | |
| 2,775 | | |
| 6,077 | | |
| 170 | | |
| 943 | | |
| 509 | | |
| - | | |
| 17,233 | |
| Other accounts payable | |
| 386,252 | | |
| 27,990 | | |
| 31,992 | | |
| 10,286 | | |
| 1,155 | | |
| 80,931 | | |
| 40,132 | | |
| - | | |
| 578,738 | |
| Provisions | |
| 85,479 | | |
| 18,472 | | |
| 1,837 | | |
| 893 | | |
| - | | |
| 199 | | |
| 9,751 | | |
| - | | |
| 116,631 | |
| Total current liabilities | |
| 1,401,775 | | |
| 275,763 | | |
| 251,893 | | |
| 130,922 | | |
| 1,567 | | |
| 129,487 | | |
| 128,973 | | |
| (354,109 | ) | |
| 1,966,271 | |
| Borrowings | |
| 133 | | |
| 76,545 | | |
| - | | |
| - | | |
| 121 | | |
| 71,713 | | |
| 152,110 | | |
| - | | |
| 300,622 | |
| Bonds | |
| 9,330 | | |
| - | | |
| 107,338 | | |
| 597,267 | | |
| - | | |
| - | | |
| 687,403 | | |
| - | | |
| 1,401,338 | |
| Trade accounts payable | |
| - | | |
| - | | |
| - | | |
| 211 | | |
| - | | |
| - | | |
| - | | |
| - | | |
| 211 | |
| Other accounts payable | |
| 45,119 | | |
| - | | |
| 493 | | |
| 120 | | |
| 2,894 | | |
| - | | |
| 462,316 | | |
| - | | |
| 510,942 | |
| Accounts payable to related parties | |
| 7,181 | | |
| - | | |
| 1,006 | | |
| 29,206 | | |
| 24,543 | | |
| - | | |
| 205,436 | | |
| (238,168 | ) | |
| 29,204 | |
| Other provisions | |
| 13,276 | | |
| 50,274 | | |
| 11,063 | | |
| 2,986 | | |
| - | | |
| - | | |
| 27,670 | | |
| - | | |
| 105,269 | |
| Deferred income tax liability | |
| 61,172 | | |
| 68,458 | | |
| - | | |
| 64,200 | | |
| - | | |
| - | | |
| - | | |
| - | | |
| 193,830 | |
| Total non-current liabilities | |
| 136,211 | | |
| 195,277 | | |
| 119,900 | | |
| 693,990 | | |
| 27,558 | | |
| 71,713 | | |
| 1,534,935 | | |
| (238,168 | ) | |
| 2,541,416 | |
| Total liabilities | |
| 1,537,986 | | |
| 471,040 | | |
| 371,793 | | |
| 824,912 | | |
| 29,125 | | |
| 201,200 | | |
| 1,663,908 | | |
| (592,277 | ) | |
| 4,507,687 | |
| Equity attributable to controlling interest in the Company | |
| 530,984 | | |
| 454,767 | | |
| 118,918 | | |
| 192,185 | | |
| 927 | | |
| 292,234 | | |
| 1,298,721 | | |
| (1,697,812 | ) | |
| 1,190,924 | |
| Non-controlling interest | |
| 5,328 | | |
| 35,217 | | |
| 34,394 | | |
| 64,059 | | |
| - | | |
| 87,018 | | |
| 3,014 | | |
| (1,946 | ) | |
| 227,084 | |
| Total liabilities and equity | |
| 2,074,298 | | |
| 961,024 | | |
| 525,105 | | |
| 1,081,156 | | |
| 30,052 | | |
| 580,452 | | |
| 2,965,643 | | |
| (2,292,035 | ) | |
| 5,925,695 | |
AENZA S.A.A. and Subsidiaries
Notes to the Interim Condensed Consolidated Financial Statements
As of December 31, 2023, and June 30, 2024
| | |
Engineering | | |
| | |
Infrastructure | | |
| | |
Parent | | |
| | |
| |
| In thousands of soles | |
and
construction | | |
Energy | | |
Toll roads | | |
Transportation | | |
Water
treatment | | |
Real
estate | | |
Company
operations | | |
Eliminations | | |
Consolidated | |
| For the three-month period ended June 30, 2023 |
| Revenue | |
| 639,939 | | |
| 146,116 | | |
| 125,212 | | |
| 102,570 | | |
| 1,216 | | |
| 76,598 | | |
| 23,591 | | |
| (78,321 | ) | |
| 1,036,921 | |
| Gross profit | |
| 26,508 | | |
| 13,495 | | |
| 23,298 | | |
| 30,576 | | |
| 721 | | |
| 31,767 | | |
| 4,551 | | |
| 3,370 | | |
| 134,286 | |
| Administrative expenses | |
| (31,037 | ) | |
| (3,533 | ) | |
| (4,632 | ) | |
| (2,851 | ) | |
| (231 | ) | |
| (5,116 | ) | |
| (7,819 | ) | |
| (1,841 | ) | |
| (57,060 | ) |
| Other income and expenses, net | |
| (427 | ) | |
| 471 | | |
| 36 | | |
| (124 | ) | |
| (41 | ) | |
| 808 | | |
| 234 | | |
| (389 | ) | |
| 568 | |
| Operating profit (loss) | |
| (4,956 | ) | |
| 10,433 | | |
| 18,702 | | |
| 27,601 | | |
| 449 | | |
| 27,459 | | |
| (3,034 | ) | |
| 1,140 | | |
| 77,794 | |
| Financial expenses | |
| (17,979 | ) | |
| (4,661 | ) | |
| (9,334 | ) | |
| (1,828 | ) | |
| (111 | ) | |
| (2,705 | ) | |
| (19,077 | ) | |
| 11,070 | | |
| (44,625 | ) |
| Financial income | |
| (3,990 | ) | |
| 3,125 | | |
| 1,885 | | |
| 2,822 | | |
| 170 | | |
| 2,383 | | |
| 13,395 | | |
| (11,658 | ) | |
| 8,132 | |
| Interests for present value of financial asset or liability | |
| 280 | | |
| (575 | ) | |
| (588 | ) | |
| - | | |
| - | | |
| 1,897 | | |
| 5,343 | | |
| - | | |
| 6,357 | |
| Share of profit or loss in
associates and joint ventures | |
| - | | |
| 718 | | |
| - | | |
| - | | |
| - | | |
| 73 | | |
| (4,138 | ) | |
| 4,139 | | |
| 792 | |
| Profit (loss) before income tax | |
| (26,645 | ) | |
| 9,040 | | |
| 10,665 | | |
| 28,595 | | |
| 508 | | |
| 29,107 | | |
| (7,511 | ) | |
| 4,691 | | |
| 48,450 | |
| Income tax | |
| (1,532 | ) | |
| (2,521 | ) | |
| (4,880 | ) | |
| (8,969 | ) | |
| (156 | ) | |
| (16,715 | ) | |
| (5,261 | ) | |
| 2 | | |
| (40,032 | ) |
| Profit (loss) for the period | |
| (28,177 | ) | |
| 6,519 | | |
| 5,785 | | |
| 19,626 | | |
| 352 | | |
| 12,392 | | |
| (12,772 | ) | |
| 4,693 | | |
| 8,418 | |
| Profit (loss) from attributable to: | |
| | | |
| | | |
| | | |
| | | |
| | | |
| | | |
| | | |
| | | |
| | |
| Controlling interest in the Company | |
| (27,419 | ) | |
| 5,154 | | |
| 3,591 | | |
| 14,719 | | |
| 352 | | |
| 6,585 | | |
| (12,805 | ) | |
| 4,649 | | |
| (5,174 | ) |
| Non-controlling interest | |
| (758 | ) | |
| 1,365 | | |
| 2,194 | | |
| 4,907 | | |
| - | | |
| 5,807 | | |
| 33 | | |
| 44 | | |
| 13,592 | |
| | |
| (28,177 | ) | |
| 6,519 | | |
| 5,785 | | |
| 19,626 | | |
| 352 | | |
| 12,392 | | |
| (12,772 | ) | |
| 4,693 | | |
| 8,418 | |
AENZA S.A.A. and Subsidiaries
Notes to the Interim Condensed Consolidated Financial Statements
As of December 31, 2023, and June 30, 2024
| | |
Engineering | | |
| | |
Infrastructure | | |
| | |
Parent | | |
| | |
| |
| In thousands of soles | |
and
construction | | |
Energy | | |
Toll roads | | |
Transportation | | |
Water
treatment | | |
Real
estate | | |
Company
operations | | |
Eliminations | | |
Consolidated | |
| For the three-month period ended June 30, 2024 |
| | |
| | |
| |
| Revenue | |
| 581,883 | | |
| 181,562 | | |
| 127,520 | | |
| 103,322 | | |
| 1,181 | | |
| 32,637 | | |
| 25,093 | | |
| (81,982 | ) | |
| 971,216 | |
| Gross profit | |
| 15,140 | | |
| 33,269 | | |
| 18,710 | | |
| 31,495 | | |
| 667 | | |
| 9,728 | | |
| 5,291 | | |
| 1,737 | | |
| 116,037 | |
| Administrative expenses | |
| (29,297 | ) | |
| (4,062 | ) | |
| (6,700 | ) | |
| (2,932 | ) | |
| (234 | ) | |
| (3,747 | ) | |
| (6,625 | ) | |
| (1,094 | ) | |
| (54,691 | ) |
| Other income and expenses, net | |
| (162 | ) | |
| 315 | | |
| (640 | ) | |
| 329 | | |
| (1 | ) | |
| 489 | | |
| (543 | ) | |
| 787 | | |
| 574 | |
| Operating profit (loss) | |
| (14,319 | ) | |
| 29,522 | | |
| 11,370 | | |
| 28,892 | | |
| 432 | | |
| 6,470 | | |
| (1,877 | ) | |
| 1,430 | | |
| 61,920 | |
| Financial expenses | |
| 198 | | |
| (7,989 | ) | |
| (3,349 | ) | |
| (3,145 | ) | |
| 37 | | |
| (3,124 | ) | |
| (50,341 | ) | |
| 9,551 | | |
| (58,162 | ) |
| Financial income | |
| 2,228 | | |
| 559 | | |
| 6,514 | | |
| 1,111 | | |
| 178 | | |
| 1,399 | | |
| 4,279 | | |
| (10,542 | ) | |
| 5,726 | |
| Interests for present value of financial asset or liability | |
| 27 | | |
| (1,382 | ) | |
| (579 | ) | |
| (14 | ) | |
| - | | |
| 127 | | |
| (10,613 | ) | |
| - | | |
| (12,434 | ) |
| Share of profit or loss in associates
and joint ventures | |
| - | | |
| 822 | | |
| - | | |
| - | | |
| - | | |
| - | | |
| 11,356 | | |
| (11,356 | ) | |
| 822 | |
| Profit (loss) before income tax | |
| (11,866 | ) | |
| 21,532 | | |
| 13,956 | | |
| 26,844 | | |
| 647 | | |
| 4,872 | | |
| (47,196 | ) | |
| (10,917 | ) | |
| (2,128 | ) |
| Income tax | |
| (17,358 | ) | |
| (6,741 | ) | |
| (3,670 | ) | |
| (8,364 | ) | |
| (192 | ) | |
| (1,633 | ) | |
| 2,346 | | |
| 12 | | |
| (35,600 | ) |
| Profit (loss) for the period | |
| (29,224 | ) | |
| 14,791 | | |
| 10,286 | | |
| 18,480 | | |
| 455 | | |
| 3,239 | | |
| (44,850 | ) | |
| (10,905 | ) | |
| (37,728 | ) |
| Profit (loss) from attributable to: | |
| | | |
| | | |
| | | |
| | | |
| | | |
| | | |
| | | |
| | | |
| | |
| Controlling interest in the Company | |
| (29,198 | ) | |
| 12,829 | | |
| 6,358 | | |
| 13,860 | | |
| 455 | | |
| 94 | | |
| (44,851 | ) | |
| (10,896 | ) | |
| (51,349 | ) |
| Non-controlling interest | |
| (26 | ) | |
| 1,962 | | |
| 3,928 | | |
| 4,620 | | |
| - | | |
| 3,145 | | |
| 1 | | |
| (9 | ) | |
| 13,621 | |
| | |
| (29,224 | ) | |
| 14,791 | | |
| 10,286 | | |
| 18,480 | | |
| 455 | | |
| 3,239 | | |
| (44,850 | ) | |
| (10,905 | ) | |
| (37,728 | ) |
AENZA S.A.A. and Subsidiaries
Notes to the Interim Condensed Consolidated Financial Statements
As of December 31, 2023, and June 30, 2024
| | |
Engineering | | |
| | |
Infrastructure | | |
| | |
Parent | | |
| | |
| |
| In thousands of soles | |
and
construction | | |
Energy | | |
Toll roads | | |
Transportation | | |
Water
treatment | | |
Real
estate | | |
Company
operations | | |
Eliminations | | |
Consolidated | |
| For the six-month period ended June 30, 2023 | |
| Revenue | |
| 1,138,684 | | |
| 310,992 | | |
| 258,600 | | |
| 204,678 | | |
| 2,479 | | |
| 94,373 | | |
| 48,780 | | |
| (171,527 | ) | |
| 1,887,059 | |
| Gross profit | |
| 19,417 | | |
| 43,201 | | |
| 39,613 | | |
| 61,993 | | |
| 1,483 | | |
| 35,417 | | |
| 10,498 | | |
| 3,586 | | |
| 215,208 | |
| Administrative expenses | |
| (54,262 | ) | |
| (7,945 | ) | |
| (9,788 | ) | |
| (5,648 | ) | |
| (471 | ) | |
| (9,027 | ) | |
| (14,455 | ) | |
| (1,327 | ) | |
| (102,923 | ) |
| Other income and expenses, net | |
| (4,956 | ) | |
| 639 | | |
| 409 | | |
| 51 | | |
| (41 | ) | |
| 1,588 | | |
| 4,032 | | |
| (721 | ) | |
| 1,001 | |
| Operating (loss) profit | |
| (39,801 | ) | |
| 35,895 | | |
| 30,234 | | |
| 56,396 | | |
| 971 | | |
| 27,978 | | |
| 75 | | |
| 1,538 | | |
| 113,286 | |
| Financial expenses | |
| (29,546 | ) | |
| (10,608 | ) | |
| (15,559 | ) | |
| (3,628 | ) | |
| (219 | ) | |
| (5,940 | ) | |
| (43,793 | ) | |
| 22,856 | | |
| (86,437 | ) |
| Financial income | |
| 974 | | |
| 5,247 | | |
| 3,293 | | |
| 4,293 | | |
| 330 | | |
| 4,296 | | |
| 29,837 | | |
| (22,106 | ) | |
| 26,164 | |
| Interests for present value of financial asset or liability | |
| 1,632 | | |
| (437 | ) | |
| (1,602 | ) | |
| - | | |
| - | | |
| 3,153 | | |
| 17,417 | | |
| - | | |
| 20,163 | |
| Share of profit or loss in associates and joint ventures | |
| (1 | ) | |
| 1,585 | | |
| - | | |
| - | | |
| - | | |
| 73 | | |
| (7,016 | ) | |
| 7,015 | | |
| 1,656 | |
| Profit (loss) before income tax | |
| (66,742 | ) | |
| 31,682 | | |
| 16,366 | | |
| 57,061 | | |
| 1,082 | | |
| 29,560 | | |
| (3,480 | ) | |
| 9,303 | | |
| 74,832 | |
| Income tax | |
| (11,739 | ) | |
| (9,724 | ) | |
| (6,235 | ) | |
| (17,651 | ) | |
| (323 | ) | |
| (16,856 | ) | |
| (9,895 | ) | |
| 10 | | |
| (72,413 | ) |
| Profit (loss) for the period | |
| (78,481 | ) | |
| 21,958 | | |
| 10,131 | | |
| 39,410 | | |
| 759 | | |
| 12,704 | | |
| (13,375 | ) | |
| 9,313 | | |
| 2,419 | |
| Profit (loss) from attributable to: | |
| | | |
| | | |
| | | |
| | | |
| | | |
| | | |
| | | |
| | | |
| | |
| Controlling interest in the Company | |
| (77,881 | ) | |
| 18,621 | | |
| 5,178 | | |
| 29,557 | | |
| 759 | | |
| 5,501 | | |
| (13,420 | ) | |
| 9,123 | | |
| (22,562 | ) |
| Non-controlling interest | |
| (600 | ) | |
| 3,337 | | |
| 4,953 | | |
| 9,853 | | |
| - | | |
| 7,203 | | |
| 45 | | |
| 190 | | |
| 24,981 | |
| | |
| (78,481 | ) | |
| 21,958 | | |
| 10,131 | | |
| 39,410 | | |
| 759 | | |
| 12,704 | | |
| (13,375 | ) | |
| 9,313 | | |
| 2,419 | |
AENZA S.A.A. and Subsidiaries
Notes to the Interim Condensed Consolidated Financial Statements
As of December 31, 2023, and June 30, 2024
| | |
Engineering | | |
| | |
Infrastructure | | |
| | |
Parent | | |
| | |
| |
| In thousands of soles | |
and
construction | | |
Energy | | |
Toll roads | | |
Transportation | | |
Water
treatment | | |
Real
estate | | |
Company
operations | | |
Eliminations | | |
Consolidated | |
| For the six-month period ended June 30,
2024 | | |
| | |
| | |
| | |
| |
| Revenue | |
| 1,162,911 | | |
| 353,937 | | |
| 296,697 | | |
| 205,540 | | |
| 2,442 | | |
| 76,537 | | |
| 49,238 | | |
| (178,801 | ) | |
| 1,968,501 | |
| Gross profit | |
| 18,490 | | |
| 70,319 | | |
| 51,614 | | |
| 65,198 | | |
| 1,477 | | |
| 23,687 | | |
| 9,013 | | |
| 4,238 | | |
| 244,036 | |
| Administrative expenses | |
| (54,462 | ) | |
| (8,091 | ) | |
| (13,341 | ) | |
| (6,141 | ) | |
| (469 | ) | |
| (7,395 | ) | |
| (11,694 | ) | |
| (2,871 | ) | |
| (104,464 | ) |
| Other income and expenses, net | |
| (2,690 | ) | |
| 529 | | |
| (323 | ) | |
| 333 | | |
| (1 | ) | |
| 955 | | |
| (45 | ) | |
| 786 | | |
| (456 | ) |
| Operating profit (loss) | |
| (38,662 | ) | |
| 62,757 | | |
| 37,950 | | |
| 59,390 | | |
| 1,007 | | |
| 17,247 | | |
| (2,726 | ) | |
| 2,153 | | |
| 139,116 | |
| Financial expenses | |
| (22,048 | ) | |
| (14,452 | ) | |
| (9,444 | ) | |
| (5,351 | ) | |
| (47 | ) | |
| (5,445 | ) | |
| (78,602 | ) | |
| 16,869 | | |
| (118,520 | ) |
| Financial income | |
| 2,997 | | |
| 810 | | |
| 8,216 | | |
| 3,069 | | |
| 358 | | |
| 2,872 | | |
| 12,863 | | |
| (17,910 | ) | |
| 13,275 | |
| Interests for present value of financial asset or liability | |
| 117 | | |
| (1,953 | ) | |
| (727 | ) | |
| (11 | ) | |
| - | | |
| 303 | | |
| (12,468 | ) | |
| - | | |
| (14,739 | ) |
| Share of profit or loss in associates and joint ventures | |
| - | | |
| 1,631 | | |
| - | | |
| - | | |
| - | | |
| - | | |
| 27,103 | | |
| (27,104 | ) | |
| 1,630 | |
| Profit (loss) before income tax | |
| (57,596 | ) | |
| 48,793 | | |
| 35,995 | | |
| 57,097 | | |
| 1,318 | | |
| 14,977 | | |
| (53,830 | ) | |
| (25,992 | ) | |
| 20,762 | |
| Income tax | |
| (11,509 | ) | |
| (15,028 | ) | |
| (10,406 | ) | |
| (17,757 | ) | |
| (391 | ) | |
| (4,773 | ) | |
| 1,843 | | |
| (4 | ) | |
| (58,025 | ) |
| Profit (loss) for the period | |
| (69,105 | ) | |
| 33,765 | | |
| 25,589 | | |
| 39,340 | | |
| 927 | | |
| 10,204 | | |
| (51,987 | ) | |
| (25,996 | ) | |
| (37,263 | ) |
| Profit (loss) from attributable to: | |
| | | |
| | | |
| | | |
| | | |
| | | |
| | | |
| | | |
| | | |
| | |
| Controlling interest in the Company | |
| (68,818 | ) | |
| 29,893 | | |
| 17,332 | | |
| 29,505 | | |
| 927 | | |
| 2,293 | | |
| (51,992 | ) | |
| (26,029 | ) | |
| (66,889 | ) |
| Non-controlling interest | |
| (287 | ) | |
| 3,872 | | |
| 8,257 | | |
| 9,835 | | |
| - | | |
| 7,911 | | |
| 5 | | |
| 33 | | |
| 29,626 | |
| | |
| (69,105 | ) | |
| 33,765 | | |
| 25,589 | | |
| 39,340 | | |
| 927 | | |
| 10,204 | | |
| (51,987 | ) | |
| (25,996 | ) | |
| (37,263 | ) |
AENZA S.A.A. and Subsidiaries
Notes to the Interim Condensed Consolidated Financial Statements
As of December 31, 2023, and June 30, 2024
Financial assets related to concession contracts
are presented in the consolidated statement of financial position as “trade accounts receivable current” and “trade
accounts receivable non-current”.
The classification of financial assets and liabilities by category
is as follows:
| | |
As of | | |
As of | |
| | |
December 31, | | |
June 30, | |
| In thousands of soles | |
2023 | | |
2024 | |
| Financial assets according to the consolidated statement
of financial position | |
| | |
| |
| Loans and accounts receivable at amortized cost: | |
| | |
| |
| - Cash and cash equivalents | |
| 1,003,888 | | |
| 765,845 | |
| - Trade accounts receivable and other accounts receivable | |
| | | |
| | |
| (excluding non-financial assets) (i) | |
| 1,379,202 | | |
| 1,630,823 | |
| - Financial assets related to concession agreements (ii) | |
| 908,371 | | |
| 940,798 | |
| - Accounts receivable from related parties | |
| 543,728 | | |
| 559,687 | |
| | |
| 3,835,189 | | |
| 3,897,153 | |
| | |
| | | |
| | |
| Financial liabilities according to the consolidated statement of financial position | |
| | | |
| | |
| Other financial liabilities at amortized cost: | |
| | | |
| | |
| - Bank loans and other financial liabilities | |
| 780,145 | | |
| 370,697 | |
| - Lease liability for right-of-use asset | |
| 42,562 | | |
| 37,180 | |
| - Bonds | |
| 822,925 | | |
| 1,496,270 | |
| - Trade and other accounts payable | |
| | | |
| | |
| (excluding non-financial liabilities) (iii) | |
| 1,785,487 | | |
| 1,607,080 | |
| - Accounts payable to related parties | |
| 72,936 | | |
| 86,880 | |
| | |
| 3,504,055 | | |
| 3,598,107 | |
| Other financial liabilities: | |
| | | |
| | |
| - Other provisions (iv) | |
| 56,443 | | |
| 58,724 | |
| (i) | The following non-financial assets are excluded: advances to
suppliers for S/90.3 million and tax receivable for S/96.6 million (S/98 million and S/104.7 million, respectively, as of December 31,
2023). |
| (ii) | Included in the trade accounts receivable item. |
| (iii) | The following non-financial liabilities are excluded: advances
received from customers for S/213.4 million, taxes payable for S/156 million, salaries and other personnel payable for S/99.8 million
and others for S/7.5 million (S/241.5 million, S/158.1 million, S/92.2 million and S/9.1 million, respectively, as of December 31, 2023). |
| (iv) | Includes administrative process INDECOPI for S/58.7 million
(S/56.4 million, as of December 31, 2023). |
| 9. | Cash and Cash Equivalents |
This account comprises:
| | |
As of | | |
As of | |
| | |
December 31, | | |
June 30, | |
| In thousands of soles | |
2023 | | |
2024 | |
| Cash on hand | |
| 1,020 | | |
| 758 | |
| Remittances in-transit | |
| 3,621 | | |
| 3,785 | |
| Current accounts (a) | |
| 263,295 | | |
| 132,556 | |
| Trust account - specific use funds (b) | |
| 421,149 | | |
| 291,454 | |
| Time deposits (c) | |
| 314,803 | | |
| 337,292 | |
| | |
| 1,003,888 | | |
| 765,845 | |
AENZA S.A.A. and Subsidiaries
Notes to the Interim Condensed Consolidated Financial Statements
As of December 31, 2023, and June 30, 2024
| (a) | Current accounts are denominated in local and foreign currency,
deposited in local and foreign banks with a high credit rating and are freely available. These accounts earn interest at market rates. |
| (b) | The Corporation maintains trust accounts in local and foreign banks for the administration of funds for
specific uses that are classified as: |
| | |
As of | | |
As of | |
| | |
December 31, | | |
June 30, | |
| In thousands of soles | |
2023 | | |
2024 | |
| Operational funds | |
| 190,755 | | |
| 166,817 | |
| Reserve funds (i) | |
| 28,661 | | |
| 72,420 | |
| Consortium funds | |
| 200,473 | | |
| 52,217 | |
| Guarantee funds | |
| 1,260 | | |
| - | |
| | |
| 421,149 | | |
| 291,454 | |
| (i) | Reserve funds for the payment of bonds issued and other obligations of the Corporation are as follows: |
| | |
As of | | |
As of | |
| | |
December 31, | | |
June 30, | |
| In thousands of soles | |
2023 | | |
2024 | |
| AENZA S.A.A. | |
| - | | |
| 45,925 | |
| Red Vial 5 S.A. | |
| 24,039 | | |
| 24,578 | |
| Tren Urbano de Lima S.A. | |
| 4,622 | | |
| 1,917 | |
| | |
| 28,661 | | |
| 72,420 | |
| (c) | Time deposits have maturities of less than ninety (90) days
and are renewable at maturity. As of June 30, 2024, these deposits bear interest ranging from 4.3% to 6.45% (4.21% to 7.32% at December
31, 2023). |
Cash and cash equivalents do not represent a significant
credit or interest rate risk; therefore, their carrying amounts approximate their fair value.
| 10. | Trade Accounts Receivable, net |
This caption comprises the following:
| | |
As of | | |
As of | |
| | |
December 31, | | |
June 30, | |
| In thousands of soles | |
2023 | | |
2024 | |
| | |
| | |
| |
| Receivables - net (a) | |
| 204,167 | | |
| 267,601 | |
| Unbilled receivables - Subsidiarie (b) | |
| 718,408 | | |
| 663,993 | |
| Unbilled receivables - Concession (c) | |
| 908,197 | | |
| 939,124 | |
| | |
| 1,830,772 | | |
| 1,870,718 | |
| | |
| | | |
| | |
| Current portion | |
| 1,061,801 | | |
| 1,093,646 | |
| Non-current portion | |
| 768,971 | | |
| 777,072 | |
| | |
| 1,830,772 | | |
| 1,870,718 | |
As of December 31, 2023 and as of June 30, 2024,
trade accounts receivable are denominated in local and foreign currency, have current maturities, do not accrue interest and do not have
specific guarantees. The fair value of current invoices receivable is similar to their carrying value because their average collection
period is less than sixty (60) days.
AENZA S.A.A. and Subsidiaries
Notes to the Interim Condensed Consolidated Financial Statements
As of December 31, 2023, and June 30, 2024
The balance of accounts receivable corresponds
to:
| | |
As of | | |
As of | |
| | |
December 31, | | |
June 30, | |
| In thousands of soles | |
2023 | | |
2024 | |
| Tren Urbano de Lima S.A. | |
| 884,326 | | |
| 895,361 | |
| Cumbra Peru S.A. | |
| 750,109 | | |
| 777,740 | |
| UNNA Energia S.A. | |
| 119,948 | | |
| 104,835 | |
| Cumbra Ingenieria S.A. | |
| 33,866 | | |
| 30,095 | |
| Carretera Andina del Sur S.A.C. | |
| 14,512 | | |
| 29,603 | |
| UNNA Transporte S.A.C. | |
| 11,134 | | |
| 9,317 | |
| Red Vial 5 S.A. | |
| 1,678 | | |
| 7,650 | |
| Viva Negocio Inmobiliario S.A. | |
| 6,392 | | |
| 6,023 | |
| Carretera Sierra Piura S.A.C. | |
| 5,459 | | |
| 5,345 | |
| Concesionaria La Chira S.A. | |
| 2,396 | | |
| 2,839 | |
| Others | |
| 952 | | |
| 1,910 | |
| | |
| 1,830,772 | | |
| 1,870,718 | |
| (a) | As
of December 31, 2023, and June 30, 2024, management evaluated the exposure to credit risk
on trade receivables. As of June 30, 2024, invoices receivable are presented net of impairment
for S/43.4 million, and discounted to present value for S/0.4 million (S/43.4 million for
impairment and S/0.5 million of present value, as of December 31, 2023). |
The aging analysis of trade receivables
is as follows:
| | |
As of | | |
As of | |
| | |
December 31, | | |
June 30, | |
| In thousands of soles | |
2023 | | |
2024 | |
| Current | |
| 153,678 | | |
| 257,629 | |
| Past due up to 30 days | |
| 29,375 | | |
| 2,446 | |
| Past due from 31 days up to 90 days | |
| 11,932 | | |
| 414 | |
| Past due from 91 days up to 120 days | |
| 317 | | |
| 3 | |
| Past due from 121 days up to 360 days | |
| 2,192 | | |
| 1,820 | |
| Past due over 360 days | |
| 6,673 | | |
| 5,289 | |
| | |
| 204,167 | | |
| 267,601 | |
As of June 30, 2024, the amount of
due debts over three hundred and sixty (360) days mainly includes invoices receivable from subsidiaries: UNNA Transporte S.A.C. for S/3.1
million, Cumbra Peru S.A. for S/1.3 million, and Cumbra Ingenieria S.A. for S/0.9 million (S/4.6 million, S/1.2 million S/0.9 million
as of December 31, 2023, respectively).
| (b) | Correspond
to documents related to estimates for services provided and valuations that were not invoiced.
These rights are recognized discounted at present value for S/2.1 million (S/2.3 million
as of December 31, 2023). The following is a breakdown by subsidiary: |
| | |
As of | | |
As of | |
| | |
December 31, | | |
June 30, | |
| In thousands of soles | |
2023 | | |
2024 | |
| Cumbra Peru S.A. | |
| 683,927 | | |
| 633,480 | |
| Cumbra Ingenieria S.A. | |
| 20,655 | | |
| 19,810 | |
| UNNA Energia S.A. | |
| 7,183 | | |
| 7,608 | |
| UNNA Transporte S.A.C. | |
| 6,560 | | |
| 3,054 | |
| Others | |
| 83 | | |
| 41 | |
| | |
| 718,408 | | |
| 663,993 | |
AENZA S.A.A. and Subsidiaries
Notes to the Interim Condensed Consolidated Financial Statements
As of December 31, 2023, and June 30, 2024
| (c) | Correspond to future
collections to the Grantor according to the terms of the concession agreement, as detailed
below: |
| | |
As of | | |
As of | |
| | |
December 31, | | |
June 30, | |
| In thousands of soles | |
2023 | | |
2024 | |
| Tren Urbano de Lima S.A. | |
| 884,317 | | |
| 895,361 | |
| Carretera Andina del Sur S.A.C. | |
| 14,403 | | |
| 29,603 | |
| Red Vial 5 S.A. | |
| 1,637 | | |
| 7,181 | |
| Carretera Sierra Piura S.A.C. | |
| 5,444 | | |
| 5,345 | |
| Concesionaria La Chira S.A. | |
| 2,396 | | |
| 1,634 | |
| | |
| 908,197 | | |
| 939,124 | |
Management, after evaluating the balances receivable
at the date of the interim condensed consolidated financial statements, considers that, except for the accounts receivable provisioned,
there are no accounts at risk of uncollectibility.
In the opinion of Corporate Management, the expected
credit loss and allowance for trade receivables adequately cover the risk of uncollectibility as of December 31, 2023 and as of June 30,
2024.
| 11. | Transactions with Related Parties |
A.
Transactions with related parties
Major transactions for the period ended June 30,
2023 and 2024 between the Company and its related parties are summarized as follows:
| | |
For the three-month period | | |
For the six-month period | |
| | |
ended June 30 | | |
ended June 30 | |
| In thousands of soles | |
2023 | | |
2024 | | |
2023 | | |
2024 | |
| Revenue from sales of goods and services: | |
| | |
| | |
| |
| - Joint operations | |
| 21,987 | | |
| 19,324 | | |
| 28,362 | | |
| 34,686 | |
| | |
| 21,987 | | |
| 19,324 | | |
| 28,362 | | |
| 34,686 | |
Transactions among related parties are made based
on current price lists and according to the terms and conditions similar to those agreed with third parties.
AENZA S.A.A. and Subsidiaries
Notes to the Interim Condensed Consolidated Financial Statements
As of December 31, 2023, and June 30, 2024
| B. | Balances with Related parties |
The balances were the following:
| | |
As of
December 31, 2023 | | |
As of
June 30, 2024 | |
| In thousands of soles | |
Receivable | | |
Payable | | |
Receivable | | |
Payable | |
| Current portion: | |
| | |
| | |
| | |
| |
| Joint operations | |
| | |
| | |
| | |
| |
| Consorcio Constructor Chavimochic | |
| - | | |
| 9,313 | | |
| - | | |
| 7,720 | |
| Consorcio Peruano de Conservacion | |
| 799 | | |
| 2,762 | | |
| 800 | | |
| 2,763 | |
| Consorcio GyM Conciviles | |
| - | | |
| 5,709 | | |
| 1,419 | | |
| 1,961 | |
| Consorcio Vial Quinua | |
| - | | |
| 1,945 | | |
| - | | |
| 1,930 | |
| Consorcio Manperan | |
| 451 | | |
| 1,721 | | |
| 838 | | |
| 1,307 | |
| Consorcio Inti Punku | |
| 5,647 | | |
| 114 | | |
| 4,217 | | |
| 7 | |
| Consorcio TNT Vial y Vives - DSD Chile Ltda | |
| - | | |
| 558 | | |
| 142 | | |
| 478 | |
| Consorcio Rio Urubamba | |
| 1,911 | | |
| - | | |
| 1,947 | | |
| - | |
| Consorcio Italo Peruano | |
| 1,648 | | |
| - | | |
| 1,647 | | |
| - | |
| Consorcio Ermitano | |
| 526 | | |
| - | | |
| 518 | | |
| - | |
| Others | |
| 4,461 | | |
| 523 | | |
| 3,060 | | |
| 22,180 | |
| | |
| 15,443 | | |
| 22,645 | | |
| 14,588 | | |
| 38,346 | |
| | |
| | | |
| | | |
| | | |
| | |
| Other related parties | |
| | | |
| | | |
| | | |
| | |
| Ferrovias S.A. | |
| - | | |
| 21,727 | | |
| - | | |
| 19,330 | |
| | |
| - | | |
| 21,727 | | |
| - | | |
| 19,330 | |
| Current portion | |
| 15,443 | | |
| 44,372 | | |
| 14,588 | | |
| 57,676 | |
| | |
| | | |
| | | |
| | | |
| | |
| Non-current portion | |
| | | |
| | | |
| | | |
| | |
| Gasoducto Sur Peruano S.A. (note 14.i) | |
| 527,722 | | |
| - | | |
| 545,099 | | |
| - | |
| Ferrovias S.A. | |
| - | | |
| 15,761 | | |
| - | | |
| 16,111 | |
| Ferrovias Participaciones S.A. | |
| - | | |
| 12,803 | | |
| - | | |
| 13,093 | |
| Others | |
| 563 | | |
| - | | |
| - | | |
| - | |
| Non-current | |
| 528,285 | | |
| 28,564 | | |
| 545,099 | | |
| 29,204 | |
As of December 31, 2023 and June 30, 2024, accounts
receivable and payable are mainly of current maturity which have no specific guarantees. These balances do not generate interest considering
their maturity in short term.
The Corporation conducts its operations with related
companies under the same conditions as those with third parties; consequently, there are no differences in pricing policies or in the
basis for tax settlement; with respect to payment terms, these do not differ from policies granted to third parties.
AENZA S.A.A. and Subsidiaries
Notes to the Interim Condensed Consolidated Financial Statements
As of December 31, 2023, and June 30, 2024
| 12. | Other Accounts Receivable, net |
This caption comprises the following:
| | |
As of | | |
As of | |
| | |
December 31, | | |
June 30, | |
| In thousands of soles | |
2023 | | |
2024 | |
| | |
| | |
| |
| Restricted funds (a) | |
| 106,929 | | |
| 367,849 | |
| Claims and accounts receivable from third parties (b) | |
| 254,750 | | |
| 245,657 | |
| Credits and recoverable taxes (c) | |
| 104,654 | | |
| 96,584 | |
| Advances to suppliers (d) | |
| 98,021 | | |
| 90,342 | |
| Guarantee deposits (e) | |
| 82,230 | | |
| 71,474 | |
| Accounts receivable from personnel | |
| 1,925 | | |
| 2,637 | |
| Others | |
| 10,967 | | |
| 13,286 | |
| | |
| 659,476 | | |
| 887,829 | |
| | |
| | | |
| | |
| Current portion | |
| 348,072 | | |
| 635,543 | |
| Non-current portion | |
| 311,404 | | |
| 252,286 | |
| | |
| 659,476 | | |
| 887,829 | |
| a) | As of June 30, 2024, the restricted funds correspond to bank
guarantee certificates composed of: AENZA S.A.A. for S/263.6, Cumbra Peru S.A for S/84.1 million, Cumbra Ingenieria S.A for S/12.8 million
and a restricted fund of Concesionaria La Chira S.A. for S/7.3 million (As of December 31, 2023, S/81.5 million, S/18.1 million and S/7.3
million, respectively). |
| b) | The balance corresponds to the following: |
| | |
As of | | |
As of | |
| | |
December 31, | | |
June 30, | |
| In thousands of soles | |
2023 | | |
2024 | |
| | |
| | |
| |
| Additional investments for operating contracts | |
| 98,047 | | |
| 94,983 | |
| Account receivable to the Ministry of Agriculture Development and Irrigation (b.1) | |
| 32,062 | | |
| 33,084 | |
| Claims to the tax authorities | |
| 29,976 | | |
| 29,958 | |
| Real estate project receivable | |
| 30,012 | | |
| 30,409 | |
| Settlement agreement with third parties | |
| 21,136 | | |
| 22,402 | |
| Accounts receivable from joint ventures | |
| 21,878 | | |
| 21,226 | |
| Insurance claims for losses | |
| 6,778 | | |
| 1,755 | |
| Others | |
| 14,861 | | |
| 11,840 | |
| | |
| 254,750 | | |
| 245,657 | |
| (b.1) | The balance corresponds to the claim to the Ministry of Agrarian
Development and Irrigation (hereinafter, MIDAGRI) for US$9.5 million equivalent to S/35.1 million for the execution of the total amount
of the Performance Bond, derived from the arbitration process followed against the Regional Government of La Libertad and MIDAGRI for
the early termination of the Concession Contract due to breach of contract by the Grantor. As of June 30, 2024, the net present value
balance amounts to US$8.6 million, equivalent to S/33.1 million (note 14.ii). |
AENZA S.A.A. and Subsidiaries
Notes to the Interim Condensed Consolidated Financial Statements
As of December 31, 2023, and June 30, 2024
| c) | The balance corresponds to the following: |
| | |
As of | | |
As of | |
| | |
December 31, | | |
June 30, | |
| In thousands of soles | |
2023 | | |
2024 | |
| | |
| | |
| |
| VAT credit | |
| 39,706 | | |
| 46,560 | |
| Income tax - advance payments | |
| 45,263 | | |
| 33,372 | |
| ITAN and other tax receivable | |
| 19,685 | | |
| 16,652 | |
| | |
| 104,654 | | |
| 96,584 | |
| d) | Corresponds to prepayments made to suppliers, mainly for engineering
and construction projects. The variation corresponds to: (i) Increase in Cumbra Peru S.A. for S/8.9 million in the project Centro Comercial
la Molina, and (ii) Decrease in Cumbra Peru S.A. for S/16.6 million in the Consorcio Inti Punku for the Jorge Chavez Airport project. |
| e) | Guarantees deposits correspond to funds retained by customers
for work contracts, mainly of the subsidiary Cumbra Peru S.A. These deposits are retained by customers in order to guarantee that the
subsidiary performs its obligations under the contracts. The amounts withheld will be recovered upon completion of the work. |
The fair value of the other short-term accounts
receivable is similar to their book value due to their short-term maturity. The non-current portion corresponds mainly to non-financial
assets such as claims to third parties and tax credits. Other non-current accounts receivable maintain maturities that vary between 2
and 5 years. The maximum exposure to credit risk as of the reporting date is the carrying amount of each class of other accounts receivable
mentioned.
This caption comprises the following:
| | |
As of | | |
As of | |
| | |
December 31, | | |
June 30, | |
| In thousands of soles | |
2023 | | |
2024 | |
| Land | |
| 117,791 | | |
| 116,509 | |
| Work in progress - Real estate | |
| 127,008 | | |
| 146,442 | |
| Finished properties | |
| 38,970 | | |
| 33,168 | |
| Construction materials | |
| 52,479 | | |
| 46,712 | |
| Merchandise and supplies | |
| 100,103 | | |
| 96,326 | |
| | |
| 436,351 | | |
| 439,157 | |
| Allowance for inventory write-downs | |
| (5,572 | ) | |
| (5,353 | ) |
| | |
| 430,779 | | |
| 433,804 | |
| | |
| | | |
| | |
| Current | |
| 360,497 | | |
| 363,441 | |
| Non-current | |
| 70,282 | | |
| 70,363 | |
| | |
| 430,779 | | |
| 433,804 | |
As of June 30, 2024, the non-current portion corresponds
to land for real estate projects in Lima to be executed in the long term, S/56.7 million located in the district of San Isidro and S/13.7
million located in the district of Barranco (as of December 31, 2023, S/56.6 million and S/13.6 million, respectively).
Management has analyzed the inventories and has
determined that there are no major indications of impairment.
AENZA S.A.A. and Subsidiaries
Notes to the Interim Condensed Consolidated Financial Statements
As of December 31, 2023, and June 30, 2024
| 14. | Investments in Associates and Joint Ventures |
This caption comprises the following:
| | |
As of | | |
As of | |
| | |
December 31, | | |
June 30, | |
| In thousands of soles | |
2023 | | |
2024 | |
| Associates | |
| 2,103 | | |
| 2,103 | |
| Joint ventures | |
| 10,644 | | |
| 11,124 | |
| | |
| 12,747 | | |
| 13,227 | |
Movement of our investments in associates for
the periods ended June 30, 2023, and 2024 is as follows:
| In thousands of soles | |
2023 | | |
2024 | |
| Balance as of January, 1 | |
| 14,916 | | |
| 12,747 | |
| Equity interest in results | |
| 1,656 | | |
| 1,630 | |
| Dividends received | |
| (3,652 | ) | |
| (1,145 | ) |
| Translation adjustment | |
| - | | |
| (5 | ) |
| Balance as of June, 30 | |
| 12,920 | | |
| 13,227 | |
The most relevant associates are described below:
| i. | Gasoducto Sur Peruano S.A. |
In November
2015, the Corporation acquired a 20% interest in Gasoducto Sur Peruano S.A. and obtained a 29% interest in Consorcio Constructor Ductos
del Sur (hereinafter “CCDS”) through its subsidiary Cumbra Peru S.A.
On July
22, 2014, GSP signed a concession agreement with the Peruvian Government to build, operate, and maintain a pipeline transportation system
of natural gas to meet the demand of cities in the south of Peru (hereinafter the “Concession Agreement”). Additionally, GSP
signed an engineering, procurement and construction agreement with CCDS.
The Corporation
made an investment of US$242.5 million (equivalent to S/811 million) and had to assume 21.49% of the performance bond established in the
concession agreement for US$ 262.5 million and 21.49% of the guarantee for a bridge loan of US$600 million.
Early
termination of the Concession Agreement
On January
24, 2017 the Peruvian Ministry of Energy and Mines (hereinafter “MEM”) notified the early termination of the Concession Agreement
under Clause 6.7 for the failure of the concessionaire to accredit the financial closure within the contractual term, proceeding with
the immediate execution of the entirety of the faithful performance guarantee.
The situation
described in the previous paragraph caused Management to recognize the impairment of its total investment equivalent to 21.49% of its
participation (US$242.5 million) between 2016 and 2019, and required the register of the account receivable resulting from the execution
of the counter-guarantees granted by AENZA in favor of the issuer of the guarantee of performance of the concession contract and in favor
of the syndicate of banks that granted the bridge loan to GSP for US$52.5 million and US$129 million, respectively. According to the Concession
Agreement, the guarantees were paid on behalf of GSP, therefore, AENZA recognized the right to collect from GSP for US$181.5 million,
which were recorded in 2016 as accounts receivable from related parties. Likewise, Cumbra Peru recognized the value of accounts receivable
from CCDS for US$73.5 million and lost profits for US$10 million, which correspond to receivables from GSP.
AENZA S.A.A. and Subsidiaries
Notes to the Interim Condensed Consolidated Financial Statements
As of December 31, 2023, and June 30, 2024
On October
11, 2017, the agreement deed for the delivery of the assets of the south Peruvian gas pipeline concession between GSP and MEM was signed.
The assets include the works, equipment, facilities and engineering studies provided for the execution of the project.
Upon termination
of the Concession Agreement, and in accordance with the provisions of clause 20 thereof, the Peruvian Government had the obligation to
hire an internationally recognized auditing firm to calculate the Net Book Value (hereinafter “NBV”) of the concession assets,
and to call up to three auctions on GSP’s assets. However, to date, the Peruvian State continues to fail to comply with these contractual
obligations. The amount of the VCN was calculated at US$2,602 million by an independent auditing firm hired by GSP as of December 31,
2016, this figure was subsequently adjusted to US$2,110 million as a result of variations in the balances related to the works carried
out by the consortium, which in turn is reported in its audited financial statements as of December 31, 2017.
Collection
Actions of AENZA S.A.A.
On December
21, 2018, the Company asked the Peruvian Government for direct treatment and requested the payment of NBV in favor of GSP. On October
18, 2019, the Company filed with CIADI an arbitration request. On December 27, 2019 the Company withdrew the arbitration in compliance
with a preliminary plea agreement signed with the Attorney General´s Office and Ad-hoc Peruvian Public Prosecutor’s Office
on the same date. Withdrawing the arbitration before CIADI does not involve the loss of collection rights of the Company against GSP and
does not restrict, limit, or impede GSP from asserting its rights against the Peruvian Government.
The Company
and its internal and external legal advisors consider that the payment owed by the Government to GSP for the NBV are not within the withholding
scope under Law 30737 that ensures the immediate payment of civil compensation in favor of the Peruvian Government in cases of corruption
and related crimes, since this payment does not include any profit margin and/or not correspond to the sale of assets related to the project,
but to a reimbursement for the investment made by the Concessionaire.
Bankruptcy
of GSP
On December
4, 2017, GSP started a bankruptcy proceeding before the INDECOPI. The Company maintains receivable recognized by INDECOPI of US$0.4 million
and US$169.3 million, the last one held under trust in favor of the creditors of the Company. In addition, it has indirectly recognized
claims of US$11.8 million. On the other hand, the debt of Cumbra Peru S.A. derived from its participation in CCDS is directly recognized
in INDECOPI in the GSP Competition for US$88.7 million. As of the date of this report, GSP is under liquidation and AENZA S.A.A. chairs
the Board of Creditors.
On April
11, 2023, the Liquidation Agreement was approved, which defines the framework for the liquidator’s actions. The Liquidation Agreement
includes the granting of powers to the liquidator with respect to representation, administrative, contractual and other relevant powers
that allow him to comply with the obligations for which he was appointed, as well as the actions he is allowed to take in order to recover
GSP’s assets and in accordance with the mechanisms set forth in the General Law of the Insolvency System.
On April
13, 2023, and under the powers granted to him by the Liquidation Agreement, the Liquidator requested the Ministry of Energy and Mines
(MEM) to initiate the Direct Treatment procedure stipulated in the Concession Agreement.
On September
12, 2023, INDECOPI notified GSP of Resolution No. 4069-2023/CCO-INDECOPI which resolved to declare null and void the Board’s resolution
approving the Liquidation Agreement because the Agreement does not the agreement does not foresee the modality and conditions of realization
of the GSP assets other than the VCN (direct sale, auction, dation, etc.).
On November
21, 2023, the Meeting of Creditors was held with the purpose of correcting the defect declared in the aforementioned resolution, through
the approval of a new Liquidation Agreement. However, this proposal only reached 59% of favorable votes, not reaching the qualified majority
(66.67%) required by law. Likewise, on the same day, the Presidency of the Board, as well as other creditors requested INDECOPI to declare
the liquidation of GSP.
AENZA S.A.A. and Subsidiaries
Notes to the Interim Condensed Consolidated Financial Statements
As of December 31, 2023, and June 30, 2024
In view
of the above, on December 28, 2023, INDECOPI ordered the liquidation of GSP and on January 12, 2024 the Technical Secretariat of the Commission,
convene a Single Meeting of Creditors for January 29, 2024, in order to appoint a Liquidator for the process and approve a new Liquidation
Agreement. The Meeting is formed with the Creditors in attendance and approve the corresponding proposals by simple majority. Therefore,
on the referred day, with 59% of the votes in attendance, the appointment of Alva Legal Asesoria Empresarial S.A.C. as GSP’s liquidator
and the proposed Liquidation Agreement were approved. The liquidation process of GSP continues its course, as well as the necessary actions
for the recovery of VCN.
Additionally,
on April 30, 2024, by means of a public deed, the Trust Agreement for Easements, Administrative Costs and Social Works, formed by GSP
and La Fiduciaria, related to the Concession Contract, was terminated. As a consequence, US$ 38.3 million U.S. dollars are currently in
bank accounts of GSP, in liquidation, managed by Alva Legal Asesoria Empresarial S.A.C., the liquidator named for the liquidation process
of GSP.
Amounts
recognized in the consolidated financial statements (note 11).
As of June
30, 2024, the net value of the account receivable from GSP is approximately US$142.4 million, equivalent to S/545.1 million (US$142.4
million equivalent to S/527.7 million at December 31, 2023), which comprises the recognition in the following entities of the Corporation:
i) AENZA S.A.A. maintains US$ 63.9 million (equivalent to S/244.4 million) discounted to present value net of impairment and the effect
of the exchange difference (US$63.9 million equivalent to S/236.6 million at December 31, 2023) and; ii) Cumbra Peru S.A. maintains US$
78.5 million (equivalent to S/300.7 million) discounted to present value, net of the effect of the exchange difference (US$78.5 million
equivalent to S/291.1 million at December 31, 2023).
The Company’s
management maintains the recovery estimate in 8 years, applying a discount rate of 5.3% (recovery term of 8 years with a discount rate
of 4.98% as of June 30, 2023).
Based on
management’s assessment and in conjunction with the opinion of the internal legal department and external legal counsel, the estimate
of recoverability, impairment allowances and the net recognized value of the account receivable from GSP as of December 31, 2023 and June
30, 2024 is reasonable and sufficient as of the reporting date of the Corporation’s consolidated financial statements.
| ii. | Concesionaria Chavimochic S.A.C. |
In May 2014,
Concesionaria Chavimochic S.A.C. (hereinafter the “Concessionaire”), in which AENZA has 26.5% of interest, signed an agreement
with the Peruvian Government (hereinafter the “Concession Agreement”) for the design, construction, operation, and maintenance
of major hydraulic works of Chavimochic Project (hereinafter the “Project”). The construction of the work started in 2015
with a concession term of twenty-five (25) years and a total investment of about US$647 million.
According
to the Concession Agreement, the works of the third stage of the Project were structured in two phases. To date, the works of the first
phase (Palo Redondo Dam) have an advance of 70%. However, at the beginning of 2017, a procedure for early termination of the Concession
Agreement was initiated due to a contract breach by the Grantor, as a result all activities were suspended in December 2017. Due to the
fact that no agreement was made, the Concessionaire initiated an arbitration process at the Comision de las Naciones Unidas para el Derecho
Mercantil Internacional (CNUDMI).
On October
4, 2022, the Arbitration Court notified the parties the ruling, which claim the early termination of the Concession Agreement and ordered,
that the Grantor pay the Concessionaire the amount of US$25.3 million as a consequence of its failure to provide the Project Control Delivery,
and order the execution of 70% of the Performance Bond or the payment of US$25 million for the Concessionaire’s failure to obtain
the closing of the project finance.
Despite the requests for exclusion and integration of the award filed
by the Concessionaire, the Court did not issue a decision within the deadline, and the ruling was consented to. As of December 31, 2022,
an impairment of the investment amounting to S/14.5 million was recorded.
AENZA S.A.A. and Subsidiaries
Notes to the Interim Condensed Consolidated Financial Statements
As of December 31, 2023, and June 30, 2024
In February
2023, the Grantor executed partially the Concessionaire’s performance bond, where AENZA was required to assume a total of US$7.5 million.
Likewise, the Grantor requested the execution of the balance of the Concessionaire’s performance bond, where AENZA is responsible for
US$1.4 million. The Concessionaire initiated legal actions for the full execution of the ruling so the Grantor complies with the obligations
arising therefrom. Likewise, the Concessionaire initiated legal actions against the Grantor for what it considers an arbitrary execution
of the balance of the performance bond without the arbitration court having granted the possibility of executing the bond for a higher
amount without a contract breach to attributing the Concessionaire what would justify such performance (note 12.a.1).
| 15. | Investment Property, Property, Plant and Equipment, Intangible Assets and Right-of-Use Assets |
The movement in investment property, property,
plant and equipment, intangible assets and right-of-use assets accounts for the period ended June 30, 2023 and 2024, are as follows:
| | |
| | |
Property, | | |
| | |
| |
| | |
Investment | | |
plant and | | |
Right-of-use | | |
Intangibles | |
| | |
property | | |
equipment | | |
assets | | |
assets | |
| In thousands of soles | |
(A) | | |
(A) | | |
(A) | | |
(B) | |
| | |
| | |
| | |
| | |
| |
| Cost | |
| | |
| | |
| | |
| |
| Balance at January 1, 2023 | |
| 99,557 | | |
| 1,234,208 | | |
| 119,495 | | |
| 1,586,462 | |
| Additions | |
| 2 | | |
| 22,311 | | |
| 2,669 | | |
| 85,374 | |
| Sale of assets | |
| - | | |
| (13,052 | ) | |
| - | | |
| - | |
| Disposals | |
| - | | |
| (5,620 | ) | |
| (875 | ) | |
| (5,572 | ) |
| Reclassifications | |
| - | | |
| (1,725 | ) | |
| - | | |
| - | |
| Transfers | |
| - | | |
| - | | |
| - | | |
| (24,863 | ) |
| Translations adjustments | |
| 1 | | |
| 4,740 | | |
| 150 | | |
| 6,429 | |
| Balance at June 30, 2023 | |
| 99,560 | | |
| 1,240,862 | | |
| 121,439 | | |
| 1,647,830 | |
| Balance at January 1, 2024 | |
| 105,440 | | |
| 1,244,039 | | |
| 120,576 | | |
| 1,626,101 | |
| Additions | |
| 51 | | |
| 18,881 | | |
| 2,375 | | |
| 43,073 | |
| Sale of assets | |
| - | | |
| (14,147 | ) | |
| - | | |
| - | |
| Disposals | |
| - | | |
| (4,846 | ) | |
| - | | |
| (6,312 | ) |
| Reclassifications | |
| - | | |
| (70 | ) | |
| 1,046 | | |
| (23,711 | ) |
| Transfers | |
| - | | |
| (336 | ) | |
| - | | |
| 281 | |
| Translations adjustments | |
| - | | |
| (5,275 | ) | |
| (72 | ) | |
| (5,538 | ) |
| Balance at June 30, 2024 | |
| 105,491 | | |
| 1,238,246 | | |
| 123,925 | | |
| 1,633,894 | |
| | |
| | | |
| | | |
| | | |
| | |
| Accumulated depreciation and impairment | |
| | | |
| | | |
| | | |
| | |
| Balance at January 1, 2023 | |
| (37,633 | ) | |
| (949,743 | ) | |
| (69,288 | ) | |
| (799,126 | ) |
| Depreciation / amortization | |
| (1,929 | ) | |
| (24,851 | ) | |
| (8,598 | ) | |
| (75,061 | ) |
| Sale of assets | |
| - | | |
| 11,128 | | |
| - | | |
| - | |
| Disposals | |
| - | | |
| 4,615 | | |
| 875 | | |
| 5,450 | |
| Impairment | |
| - | | |
| (313 | ) | |
| - | | |
| - | |
| Translations adjustments | |
| (1 | ) | |
| (2,835 | ) | |
| (68 | ) | |
| (895 | ) |
| Balance at June 30, 2023 | |
| (39,563 | ) | |
| (960,274 | ) | |
| (77,079 | ) | |
| (844,773 | ) |
| Balance at January 1, 2024 | |
| (47,180 | ) | |
| (936,874 | ) | |
| (84,281 | ) | |
| (873,645 | ) |
| Depreciation / amortization | |
| (1,934 | ) | |
| (18,053 | ) | |
| (8,507 | ) | |
| (66,105 | ) |
| Sale of assets | |
| - | | |
| 11,228 | | |
| - | | |
| - | |
| Disposals | |
| - | | |
| 4,627 | | |
| - | | |
| 6,274 | |
| Reclassifications | |
| - | | |
| 70 | | |
| (1,046 | ) | |
| 23,711 | |
| Translations adjustments | |
| - | | |
| 3,582 | | |
| 52 | | |
| 975 | |
| Balance at June 30, 2024 | |
| (49,114 | ) | |
| (935,420 | ) | |
| (93,782 | ) | |
| (908,790 | ) |
| | |
| | | |
| | | |
| | | |
| | |
| Carrying amounts | |
| | | |
| | | |
| | | |
| | |
| At January 1, 2023 | |
| 61,924 | | |
| 284,465 | | |
| 50,207 | | |
| 787,336 | |
| At June 30, 2023 | |
| 59,997 | | |
| 280,588 | | |
| 44,360 | | |
| 803,057 | |
| At January 1, 2024 | |
| 58,260 | | |
| 307,165 | | |
| 36,295 | | |
| 752,456 | |
| At June 30, 2024 | |
| 56,377 | | |
| 302,826 | | |
| 30,143 | | |
| 725,104 | |
AENZA S.A.A. and Subsidiaries
Notes to the Interim Condensed Consolidated Financial Statements
As of December 31, 2023, and June 30, 2024
| A. | Investment property, property, plant and equipment and right-of-use assets |
As of June 30, 2024, additions to property,
plant and equipment correspond mainly to the energy segment, for works in progress, replacement units, machinery, and other
equipment for a total of S/11.9 million; additions in the engineering and construction segment, for other equipment, machinery,
furniture and fixtures and buildings for S/5 million; and additions in the real estate and infrastructure segment for S/2 million
(as of June 30, 2023, additions to property, plant and equipment correspond mainly to the energy segment, for machinery, replacement
units, work in progress, facilities other equipment furniture and fixtures for a total of S/19.6 million; additions in the
engineering and construction segment, for other equipment, machinery, furniture and fixtures, and buildings for S/1.9 million; and
additions in the real estate and infrastructure segments for S/0.8 million).
As of June 30, 2024, right-of-use asset additions
correspond mainly to lease agreements for the acquisition of machinery and equipment for S/1.1 million in the energy segment and the
price adjustment to the Company’s real estate lease agreement for S/1 million (as of June 30, 2023, it corresponds mainly to the
price adjustment to the Company’s real estate lease agreement for S/2.4 million).
For the period ended June 30, 2023, and 2024,
depreciation of property, plant and equipment, investment property and right-of-use assets is presented in the interim condensed consolidated
statement of income as follows:
| In thousands of soles | |
2023 | | |
2024 | |
| | |
| | |
| |
| Cost of sale of goods and services (Note 24) | |
| 27,488 | | |
| 22,512 | |
| Administrative expenses (Note 24) | |
| 7,890 | | |
| 5,982 | |
| Total depreciation | |
| 35,378 | | |
| 28,494 | |
| (-) Depreciation related to investment property | |
| (1,929 | ) | |
| (1,934 | ) |
| (-) Depreciation related to right-of-use assets | |
| (8,598 | ) | |
| (8,507 | ) |
| Total depreciation of property, plant and equipment | |
| 24,851 | | |
| 18,053 | |
As of June 30, 2024, the additions correspond
mainly to the energy segment for investments in the preparation of wells and other assets for a total of S/40 million and additions in
the infrastructure segment and engineering and construction for investments in concessions and software for a total of S/3.1 million (as
of June 30, 2023, the additions correspond mainly to the energy segment for investments for the preparation of wells and other assets
for a total of S/81.4 million, and in the engineering and construction segment for investments in software for S/2.1 million).
For the period ended
June 30, 2023, and 2024, the breakdown of intangible amortization included in the consolidated statement of income is as follows:
| In thousands of soles | |
2023 | | |
2024 | |
| Cost of sale of goods and services (note 24) | |
| 73,083 | | |
| 62,962 | |
| Administrative expenses (note 24) | |
| 1,978 | | |
| 3,143 | |
| Total amortization | |
| 75,061 | | |
| 66,105 | |
Goodwill
Management reviews business
results based on the type of economic activity developed. The cash-generating units are distributed in the following segments:
| | |
As of | | |
As of | |
| | |
December 31, | | |
June 30, | |
| In thousands of soles | |
2023 | | |
2024 | |
| Engineering and construction | |
| 35,158 | | |
| 33,477 | |
| Electromechanical | |
| 20,736 | | |
| 20,736 | |
| | |
| 55,894 | | |
| 54,213 | |
AENZA S.A.A. and Subsidiaries
Notes to the Interim Condensed Consolidated Financial Statements
As of December 31, 2023, and June 30, 2024
This caption comprises the following:
| | |
| | |
| | |
| |
As of | | |
As of | |
| | |
Date of | | |
Interest | | |
| |
December 31, | | |
June 30, | |
| In thousands of soles | |
maturity | | |
rate | | |
Curency | |
2023 | | |
2024 | |
| Bank loans | |
| | |
| | |
| |
| | |
| |
| Banco Interamericano de Desarrollo (a) | |
2032 | | |
| 7.84 | % | |
USD | |
| 73,802 | | |
| 76,362 | |
| Banco de Credito del Peru S.A. (b) | |
2029 | | |
| 6.04% / 10.58 | % | |
USD | |
| 95,355 | | |
| 92,182 | |
| BD Capital SAF (b) | |
2026 | | |
| 7.68 | % | |
USD | |
| 20,641 | | |
| 17,775 | |
| Bridge loan (c) | |
| | |
| Term
SOFR 3M
+ 9.75 | % | |
| |
| | | |
| | |
| | |
2024 | | |
| 11.25 | % | |
USD | |
| 379,928 | | |
| - | |
| Banco de Credito del Peru S.A. (d) | |
2024 | | |
| 10.00 | % | |
USD | |
| 29,628 | | |
| - | |
| Banco de Credito del Peru S.A. | |
2024 | | |
| 12.50 | % | |
PEN | |
| 8,024 | | |
| 8,034 | |
| Banco BBVA Peru S.A. | |
2024 | | |
| 7.94 | % | |
USD | |
| 1,486 | | |
| - | |
| Bancolombia S.A. | |
2025 | | |
| 12.01% / 16.16 | % | |
COP | |
| 16,209 | | |
| 9,422 | |
| Banco de Bogota | |
2025 | | |
| 14.52% / 15.77 | % | |
COP | |
| 3 | | |
| 3,364 | |
| Other financial entities | |
| | |
| | | |
| |
| | | |
| | |
| BCI Management Administradora General de Fondos S.A. (e) | |
2027 | | |
| 10.45 | % | |
USD | |
| 140,615 | | |
| 148,030 | |
| Others | |
2025 | | |
| 9.70% / 13.54 | % | |
PEN / CLP | |
| 14,454 | | |
| 15,528 | |
| Right-of-use-liabilities | |
2027 | | |
| 5.40% / 22.66 | % | |
USD | |
| 42,562 | | |
| 37,180 | |
| | |
| | |
| | | |
| |
| 822,707 | | |
| 407,877 | |
| | |
| | |
| | | |
| |
| | | |
| | |
| Current | |
| | |
| | | |
| |
| 516,029 | | |
| 107,255 | |
| Non-current | |
| | |
| | | |
| |
| 306,678 | | |
| 300,622 | |
| | |
| | |
| | | |
| |
| 822,707 | | |
| 407,877 | |
| (a) | In December 2022, Viva Negocio Inmobiliario S.A.C. signed
a loan agreement with the Banco Interamericano de Desarrollo, for ten (10) years and with two (2) years grace period for principal amortization,
for the purpose of building social housing. The loan was fully disbursed in January 2023, for US$20 million, equivalent to S/72.2 million.
As of June 30, 2024, the total debt amounts to US$19.9 million, equivalent to S/76.4 million (US$20.2 million, equivalent to S/73.8 million,
as of December 31, 2023), which includes principal of S/76.7 million, plus interest of S/0.8 million and the negative effect of deferred
charges of S/1.1 million (S/74.3 million, S/0.7 million and S/1.2 million, respectively, at December 31, 2023). |
As of December 31, 2023 and June 30,
2024, Viva Negocio Inmobiliario S.A.C. is in compliance with the covenants established in the loan agreement.
| (b) | Terminales del Peru (hereinafter “TP”), a joint
operation of the subsidiary UNNA Energia S.A., has a medium-term loan agreement with Banco de Credito del Peru S.A. (hereinafter BCP)
to finance investments arising from the operation agreement of North and Center terminals for 2015 to 2019 period. |
In addition, in November 2019, TP signed
a loan agreement to finance the additional investments from 2019 to 2023 for a credit line of US$ 46 million with BCP. This agreement
includes an assignee as interest holder, so BD Capital (BDC) acquired 50% of the BCP contractual position through the signature of an
accession agreement.
AENZA S.A.A. and Subsidiaries
Notes to the Interim Condensed Consolidated Financial Statements
As of December 31, 2023, and June 30, 2024
As of June 30, 2024, the amount recorded
for the loans equivalent to the 50% interest held by the subsidiary UNNA Energia S.A. is S/110 million, which includes principal plus
interest and net deferred charges (S/116 million as of 31 December 2023).
As of December 31, 2023, and as of
June 30, 2024, TP is in compliance with the covenants established in the loan agreement.
| (c) | In 2022, the Company entered into a bridge loan agreement
for up to US$120 million, with a group of financial institutions comprised by Banco BTG Pactual S.A. - Cayman Branch, Banco Santander
Peru S.A., HSBC Mexico, S.A., Institucion de Banca Multiple, Grupo Financiero HSBC, and Natixis, New York Branch. The financing will
be repaid over a period of eighteen (18) months, in quarterly interest installments and is secured, subject to the fulfillment of certain
precedent conditions, by a flow trust (first lien), a pledge over the shares in UNNA Energia S.A. (first lien), and a trust on the shares
of Viva Negocio Inmobiliario S.A.C. (second lien). |
On October 5, 2023, and December 27,
2023, payments of US$8 million (equivalent to S/29.1 million) and US$12 million (equivalent to S/43.6 million), respectively, were made.
Additionally, on December 27, 2023, the term extension of the bridge loan agreement was signed for up to US$100 million for a period of
twelve months.
As of December 31, 2023, the amount
of the loan was US$100 million, equivalent to S/379.9 million. On May 14, 2024, the Company repaid the entire US$100 million debt, equivalent
to S/363.4 million.
| (d) | On February 15, 2023, and May 15, 2023, the Ministry of Agrarian
Development and Irrigation - MIDAGRI executed the bank guarantee letter for a total amount of US$ 9.5 million that had been issued by
the Company on behalf of Concesionaria Chavimochic S.A.C. as a guarantee under the Concession contract. As a result, the Company entered
into a short-term loan with Banco de Credito de Peru. |
As of December 31, 2023, the loan was
US$7.9 million, equivalent to S/29.6 million. As of June 30, 2024, the Company repaid the entire US$8 million debt, equivalent to S/30.7
million.
| (e) | Corresponds to the monetization of dividends of Red Vial 5
S.A., transaction carried out on May 29, 2018, through which an investment agreement was signed between the Company and the Inversiones
Concesión Vial S.A.C. (“BCI Peru”) - with the intervention of Fondo de Inversión BCI NV (“Fondo BCI”)
and BCI Management Administradora General de Fondos S.A. (“BCI Asset Management”) to monetize future dividends on Red Vial
5 S.A. to be received by the Company. Upon the signature of this agreement, the Company had to indirectly transfer its economic rights
over 48.8% of the share capital of Red Vial 5 S.A. by transferring its B class shares (equivalent to 48.8% of its capital) to a vehicle
specially incorporated for such purposes called Inversiones en Autopistas S.A. The amount of the transaction was US$ 42.3 million (equivalent
to S/138 million) and was completed on June 11, 2018. |
In addition, it has been agreed that
the Company would have purchase options on 48.8% of Red Vial 5 S.A. economic rights that BCI Peru will maintain through its interest in
Inversiones en Autopistas S.A. These options would be subject to certain conditions such as the expiration of different terms, recovery
of the investment made with the proceeds of BCI Fund (according to different economic calculations) and/or to control changes.
As of June 30, 2024, the loan balance
payable amounts to US$38.6 million, equivalent to S/148 million (as of December 31, 2023, US$37.9 million, equivalent to S/140.6 million)
and includes the positive effect of the present value of S/12.4 million (as of December 31, 2023, the negative effect of the present value
of S/2.4 million).
AENZA S.A.A. and Subsidiaries
Notes to the Interim Condensed Consolidated Financial Statements
As of December 31, 2023, and June 30, 2024
| (f) | The carrying amount and fair value of borrowings are detailed
as follows: |
| | |
Carrying amount | | |
Fair value | |
| | |
As of | | |
As of | | |
As of | | |
As of | |
| | |
December 31, | | |
June 30, | | |
December 31, | | |
June 30, | |
| In thousands of soles | |
2023 | | |
2024 | | |
2023 | | |
2024 | |
| | |
| | |
| | |
| | |
| |
| Bank loans | |
| 625,076 | | |
| 207,139 | | |
| 616,120 | | |
| 202,897 | |
| Other financial entities | |
| 155,069 | | |
| 163,558 | | |
| 155,069 | | |
| 163,558 | |
| Lease liability for right-of-use asset | |
| 42,562 | | |
| 37,180 | | |
| 43,078 | | |
| 37,209 | |
| | |
| 822,707 | | |
| 407,877 | | |
| 814,267 | | |
| 403,664 | |
As of June 30, 2024, the fair value is based on
cash flows discounted using debt rates between 4.5% and 22.7% (between 4.7% and 22.7% as of December 31, 2023) and are included as Level
2 in the level of measurement.
This caption comprised the following:
| | |
| | |
| | |
| |
As of | | |
As of | |
| | |
Date of | | |
Interest | | |
| |
December 31, | | |
June 30, | |
| In thousands of soles | |
maturity | | |
rate | | |
Currency | |
2023 | | |
2024 | |
| | |
| | |
| | |
| |
| | |
| |
| Corporate bonds - Regulation S issued on the United States of America
(a) | |
| 2029 | | |
| 12.00 | % | |
USD | |
| - | | |
| 699,752 | |
| Corporate bonds - Regulation S issued on the United States of America (b) | |
| 2039 | | |
| 4.75% + VAC | | |
PEN | |
| 628,361 | | |
| 626,733 | |
| Corporate Bonds - Lima Stock Exchange issued on Peru (c) | |
| 2027 | | |
| 8.38 | % | |
PEN | |
| 180,119 | | |
| 156,723 | |
| Private bonds (d) | |
| 2027 | | |
| 8.50 | % | |
USD | |
| 14,445 | | |
| 13,062 | |
| | |
| | | |
| | | |
| |
| 822,925 | | |
| 1,496,270 | |
| | |
| | | |
| | | |
| |
| | | |
| | |
| Current portion | |
| | | |
| | | |
| |
| 81,538 | | |
| 94,932 | |
| Non-current portion | |
| | | |
| | | |
| |
| 741,387 | | |
| 1,401,338 | |
| | |
| | | |
| | | |
| |
| 822,925 | | |
| 1,496,270 | |
| (a) | On May 14, 2024, the Company made a placement of corporate bonds in
the international market, adhering to the guidelines established by Rule 144A and Regulation S of the United States of America. The issuance
was made for an amount of US$210 million, with a 5-year bullet amortization term, culminating in the repayment of principal at maturity.
The bonds have a risk rating of BB-. |
These bonds include the following initial
guarantees: (i) Security interest over the Company’s shares in UNNA Energia, (ii) Trust over the Company’s dividends in UNNA Energia,
Tren Urbano de Lima, Red Vial 5, Carretera Andina del Sur, Carretera Sierra Piura and Concesionaria La Chira, iii) Credit rights and flows
under certain loans granted by the Company to UNNA Energia from the uses of the bond, (iv) Trust of flows of UNNA Energia’s accounts receivable
corresponding to Lots III and IV, and (v) Reserve account for debt service.
AENZA S.A.A. and Subsidiaries
Notes to the Interim Condensed Consolidated Financial Statements
As of December 31, 2023, and June 30, 2024
For the period ended June 30, 2024,
movements in this account are as follows:
| In thousands of soles | |
| | |
2024 | |
| | |
| | |
| |
| Balance at January, 1 | |
| | | |
| - | |
| Additions | |
| | | |
| 781,830 | |
| Accrued interest | |
| | | |
| 14,218 | |
| Exchange difference | |
| | | |
| 23,884 | |
| Costs and interest per issue | |
| | | |
| (120,180 | ) |
| Interest paid | |
| (85,466 | ) | |
| | |
| Debt issuance costs | |
| (34,714 | ) | |
| | |
| Balance at June, 30 | |
| | | |
| 699,752 | |
As of June 30, 2024, the Company has
complied with the related covenants.
| (b) | In February 2015, the subsidiary Tren Urbano de Lima S.A.
issued international corporate bonds under Regulation S of the United States of America. The issuance was made in VAC soles (adjusted
at Constant Update Value) for an amount of S/ 629 million. The bonds have a risk rating of AA+. |
These bonds include the following collateral:
(i) mortgage on the concession of which Tren Urbano de Lima S.A. is the concessionaire, (ii) security interest on the shares of the Concessionaire,
(iii) assignment of the Collection Rights of the Administration Trust, and (iv) a Flow Trust and Reserve Accounts for Debt Service, Operation
and Maintenance and ongoing Capex. Issuance costs amounted to S/22 million. As of June 30, 2024, a principal repayment of S/13.1 million
has been made (S/12.9 million in 2023).
As of June 30, 2024, an accumulated
amortization amounting to S/165.9 million (S/152.8 million as of December 31, 2023) was made.
As of June 30, 2024 the balance includes
VAC adjustments and interest payable for S/153.4 million (S/146.1 million as of December 31, 2023).
For the periods ended June 30, 2023
and 2024, the movement of this account is as follows:
| In thousands of soles | |
2023 | | |
2024 | |
| | |
| | |
| |
| Balance at January, 1 | |
| 629,956 | | |
| 628,361 | |
| Amortization | |
| (12,860 | ) | |
| (13,078 | ) |
| Accrued interest | |
| 28,739 | | |
| 27,821 | |
| Interest paid | |
| (16,473 | ) | |
| (16,371 | ) |
| Balance at June, 30 | |
| 629,362 | | |
| 626,733 | |
As of December 31, 2023, and as of
June 30, 2024, Tren Urbano de Lima S.A. has complied with the corresponding covenants.
As of June 30, 2024, the fair value
amounts to S/626.7 million (S/628.4 million, as of December 31, 2023), is based on discounted cash flows using a rate of 4.7% (4.9% as
of December 31, 2023) and corresponds to level 2 of the fair value hierarchy.
AENZA S.A.A. and Subsidiaries
Notes to the Interim Condensed Consolidated Financial Statements
As of December 31, 2023, and June 30, 2024
| (c) | Between 2015 and 2016, the subsidiary Red Vial 5 S.A. issued
the First Corporate Bond Program on the Lima Stock Exchange for a total S/365 million. The bonds are rated AA+. |
According to the terms of the bond
issuance agreement, this financing is secured by: (i) a trust of flows from the collection rights and flows derived from the Concession,
except for flows corresponding to the Remuneration and the Regulation Fee; (ii) a mortgage on the concession of which Red Vial 5 S.A.
is the concessionaire; (iii) movable guarantees on shares; (iv) assignment of rights on the bank letter of guarantee and any other guarantee
granted in the Construction Agreement; and (v) in general, all those additional guarantees granted in favor of the secured creditors if
applicable.
The purpose of the granted funds was
to finance the construction works of the second phase of Red Vial 5 and sales tax related to the execution of project expenses.
For the periods ended June 30, 2023
and 2024, the movement of this account is the following:
| In thousands of soles | |
2023 | | |
2024 | |
| | |
| | |
| |
| Balance at January, 1 | |
| 218,684 | | |
| 180,119 | |
| Amortization | |
| (19,134 | ) | |
| (23,148 | ) |
| Accrued interest | |
| 8,639 | | |
| 6,958 | |
| Interest paid | |
| (8,851 | ) | |
| (7,206 | ) |
| Balance at June, 30 | |
| 199,338 | | |
| 156,723 | |
As of December 31, 2023 and as of June
30, 2024, Red Vial 5 S.A. complied with the respective covenants.
As of June
30, 2024, the fair value amounts to S/160.3 million (as of December 31, 2023, S/184.6 million), is based on discounted cash flows using
an annual effective interest rate 8.1% as of December 31, 2023 and as of June 30, 2024 and is within level 2 of the fair value hierarchy.
| (d) | At the beginning of 2020, the subsidiary Cumbra Peru S.A.
prepared the First Private Bond Program, for US$7.8 million (equivalent to S/25.9 million), which were issued to be exchanged for a previously
incurred commercial debt. |
For the periods ended June 30, 2023,
and 2024 the movement of this account is the following:
| In thousands of soles | |
2023 | | |
2024 | |
| | |
| | |
| |
| Balance at January, 1 | |
| 21,273 | | |
| 14,445 | |
| Amortization | |
| (1,851 | ) | |
| (1,866 | ) |
| Exchange difference | |
| (940 | ) | |
| 489 | |
| Accrued interest | |
| 780 | | |
| 628 | |
| Interest paid | |
| (865 | ) | |
| (634 | ) |
| Balance at June, 30 | |
| 18,397 | | |
| 13,062 | |
As of June 30, 2024, the fair value amounts to S/11.9 million
(S/13.6 million as of December 31, 2023), is based on discounted cash flows using a rate of 14.3% (12% as of December 31, 2023) and is
within level 2 of the fair value hierarchy.
AENZA S.A.A. and Subsidiaries
Notes to the Interim Condensed Consolidated Financial Statements
As of December 31, 2023, and June 30, 2024
| 18. | Trade Accounts Payable |
This item comprises:
| | |
As of | | |
As of | |
| | |
December 31, | | |
June 30, | |
| In thousands of soles | |
2023 | | |
2024 | |
| Invoices payable | |
| 571,438 | | |
| 471,117 | |
| Provision of contract costs | |
| 592,254 | | |
| 521,899 | |
| Notes payable | |
| 4,575 | | |
| 1,001 | |
| | |
| 1,168,267 | | |
| 994,017 | |
| | |
| | | |
| | |
| | |
| | | |
| | |
| Current portion | |
| 1,164,266 | | |
| 993,806 | |
| Non-current portion | |
| 4,001 | | |
| 211 | |
| | |
| 1,168,267 | | |
| 994,017 | |
The breakdown of the
balance of goods and services received but not invoiced by subsidiaries is as follows:
| | |
As of | | |
As of | |
| | |
December 31, | | |
June 30, | |
| In thousands of soles | |
2023 | | |
2024 | |
| Cumbra Peru S.A. | |
| 475,159 | | |
| 406,690 | |
| Unna Energia S.A. | |
| 28,321 | | |
| 37,885 | |
| Unna Transporte S.A.C. | |
| 23,746 | | |
| 29,017 | |
| Viva Negocio Inmobiliario S.A. | |
| 13,192 | | |
| 15,507 | |
| Cumbra Ingenieria S.A. | |
| 17,081 | | |
| 14,307 | |
| Tren Urbano de Lima S.A. | |
| 20,902 | | |
| 9,558 | |
| Aenza S.A.A. | |
| 9,477 | | |
| 5,931 | |
| Aenza Servicios Corporativos S.A.C. | |
| 2,206 | | |
| 1,195 | |
| Red Vial 5 S.A. | |
| 1,151 | | |
| 842 | |
| Others | |
| 1,019 | | |
| 967 | |
| | |
| 592,254 | | |
| 521,899 | |
AENZA S.A.A. and Subsidiaries
Notes to the Interim Condensed Consolidated Financial Statements
As of December 31, 2023, and June 30, 2024
| 19. | Other Accounts Payable |
This caption is comprised by the following:
| | |
As of | | |
As of | |
| | |
December 31, | | |
June 30, | |
| In thousands of soles | |
2023 | | |
2024 | |
| Civil compensation to Peruvian Government (a) | |
| 469,839 | | |
| 480,933 | |
| Advances received from customers (b) | |
| 241,469 | | |
| 213,393 | |
| Taxes payable | |
| 158,132 | | |
| 155,958 | |
| Salaries and other payable to personnel | |
| 92,196 | | |
| 99,802 | |
| Arbitration payable | |
| 68,082 | | |
| 59,222 | |
| Accounts payable Consorcio Ductos del Sur | |
| 16,729 | | |
| 16,671 | |
| Guarantee deposits | |
| 24,570 | | |
| 27,963 | |
| Acquisition of additional non-controlling interest | |
| 6,944 | | |
| 5,604 | |
| Royalties payable | |
| 9,164 | | |
| 10,127 | |
| Other accounts payable | |
| 31,014 | | |
| 20,007 | |
| | |
| 1,118,139 | | |
| 1,089,680 | |
| | |
| | | |
| | |
| Current portion | |
| 608,828 | | |
| 578,738 | |
| Non-current portion | |
| 509,311 | | |
| 510,942 | |
| | |
| 1,118,139 | | |
| 1,089,680 | |
| (a) | Corresponds to the indemnification in AENZA related to their
participation as minority partners in certain entities that developed infrastructure projects in Peru with companies belonging to the
Odebrecht group and the projects associated with the “Construction Club”. As indicated in note 1.C), on September 15, 2022,
the collaboration and benefits agreement was signed, whereby AENZA acknowledges that it was used by some of its former directors to commit
illegal acts until 2016 and consequently undertakes to pay civil reparations to the State for S/333.3 million and US$40.7 million. The
civil reparation is subject to a payment term of 12 years, under a legal interest rate in Soles 3.1% and U.S. dollars 1.9%; also the
Company is obliged to establish a guarantee package after the Homologation formed through (i) a trust including shares issued by a subsidiary
of AENZA (ii) a property belonging to the Company; and (iii) an escrow account with funds equivalent to the annual fee for the following
year. Among other conditions, the Agreement includes a restriction for AENZA and the subsidiaries Cumbra Peru S.A. and UNNA Transporte
S.A.C. to participate in road construction and maintenance projects with the Peruvian State for a period of two (2) years form the homologation
of the Agreement. |
On December 27, 2023, the initial
installment of the Civil Redress was paid to the Peruvian State for S/10.3 million and US$1.2 million. As of June 30, 2024, the balance
including interest amounts to S/327.8 million and US$39.9 million, totaling S/480.9 million (As of December 31, 2023, S/323 million and
US$39.5 million, totaling S/469.8 million).
| (b) | Advances received from customers correspond mainly of the
engineering and construction and real estate segments; and are discounted from the invoicing made in accordance with the terms of the
agreements. |
| | |
As of | | |
As of | |
| | |
December 31, | | |
June 30, | |
| In thousands of soles | |
2023 | | |
2024 | |
| | |
| | |
| |
| Cumbra Peru S.A. - Jorge Chavez Airport | |
| 93,792 | | |
| 54,888 | |
| Viva Negocio Inmobiliario S.A.C. - Real estate projects | |
| 73,626 | | |
| 68,798 | |
| Cumbra Peru S.A. - San Gabriel - Buenaventura Project | |
| 35,923 | | |
| 12,729 | |
| Cumbra Peru S.A. - C. Comercial Parque Arauco La Molina | |
| 21,448 | | |
| 56,548 | |
| Proyecto Especial de Infraestructura de Transporte Nacional | |
| 12,454 | | |
| 19,234 | |
| Others | |
| 4,226 | | |
| 1,196 | |
| | |
| 241,469 | | |
| 213,393 | |
| | |
| | | |
| | |
| Current | |
| 241,308 | | |
| 213,274 | |
| Non-current | |
| 161 | | |
| 119 | |
| | |
| 241,469 | | |
| 213,393 | |
The fair value of current accounts is approximate
to their book value due to short-term maturities. The non-current part mainly includes non-financial liabilities such as advances received
from customers; the remaining balance is not significant in the financial statements.
AENZA S.A.A. and Subsidiaries
Notes to the Interim Condensed Consolidated Financial Statements
As of December 31, 2023, and June 30, 2024
The balance of this caption as of December 31,
2023 and June 30, 2024 is as follows:
| | |
As of | | |
As of | |
| | |
December 31, | | |
June 30, | |
| In thousands of soles | |
2023 | | |
2024 | |
| Legal claims | |
| 91,530 | | |
| 94,876 | |
| Tax claims | |
| 59,362 | | |
| 60,346 | |
| Provision for well closure | |
| 64,261 | | |
| 66,678 | |
| | |
| 215,153 | | |
| 221,900 | |
| | |
| | | |
| | |
| Current portion | |
| 117,086 | | |
| 116,631 | |
| Non-current portion | |
| 98,067 | | |
| 105,269 | |
| | |
| 215,153 | | |
| 221,900 | |
For the periods ended June 30, 2023 and 2024,
the changes in this caption are as follows:
| | |
| | |
| | |
Provision | | |
| |
| | |
Legal | | |
Tax | | |
for well | | |
| |
| In thousands of soles | |
claims | | |
claims | | |
closure | | |
Total | |
| | |
| | |
| | |
| | |
| |
| As of January 1, 2023 | |
| 580,215 | | |
| 53,578 | | |
| 68,160 | | |
| 701,953 | |
| Additions | |
| 8,397 | | |
| 503 | | |
| 222 | | |
| 9,122 | |
| Present value | |
| 564 | | |
| - | | |
| 3,240 | | |
| 3,804 | |
| Reversals of provisions | |
| (2,541 | ) | |
| (1,637 | ) | |
| (548 | ) | |
| (4,726 | ) |
| Reclasification | |
| (6 | ) | |
| (4,196 | ) | |
| - | | |
| (4,202 | ) |
| Payments | |
| (4,922 | ) | |
| - | | |
| (38 | ) | |
| (4,960 | ) |
| Translation adjustments / Exchange difference | |
| (7,941 | ) | |
| - | | |
| (1,206 | ) | |
| (9,147 | ) |
| As of June 30, 2023 | |
| 573,766 | | |
| 48,248 | | |
| 69,830 | | |
| 691,844 | |
| | |
| | | |
| | | |
| | | |
| | |
| As of January 1, 2024 | |
| 91,530 | | |
| 59,362 | | |
| 64,261 | | |
| 215,153 | |
| Additions | |
| 8,245 | | |
| 984 | | |
| 841 | | |
| 10,070 | |
| Present value | |
| 90 | | |
| - | | |
| 2,258 | | |
| 2,348 | |
| Reversals of provisions | |
| (1,300 | ) | |
| - | | |
| - | | |
| (1,300 | ) |
| Reclasification | |
| (75 | ) | |
| - | | |
| (148 | ) | |
| (223 | ) |
| Payments | |
| (3,811 | ) | |
| - | | |
| (1,044 | ) | |
| (4,855 | ) |
| Translation adjustments / Exchange difference | |
| 197 | | |
| - | | |
| 510 | | |
| 707 | |
| As of June 30, 2024 | |
| 94,876 | | |
| 60,346 | | |
| 66,678 | | |
| 221,900 | |
As of June 30, 2024, the provisions held by the
Corporation are substantially the same as of December 31, 2023.
AENZA S.A.A. and Subsidiaries
Notes to the Interim Condensed Consolidated Financial Statements
As of December 31, 2023, and June 30, 2024
On December 27, 2023,
the Company issued 174,984,912 new common shares, at a price per share of S/0.4971, increasing the Company’s capital stock from S/1,196,979,979
to S/1,371,964,891. The total shares were fully subscribed and paid in two pre-emptive subscription rounds and in the Private Offering.
A placement loss of S/87,999,912 was determined, equivalent to the difference between the nominal value of the new common shares issued
and the total amount paid. On February 1, 2024, the capital increase was registered in the Company’s
registry.
On October 31, 2023, the Board
of Directors of AENZA approve to initiate the delisting process of shares, represented by American Depositary Securities (ADSs), on the
New York Stock Exchange (NYSE), and the deregistration process of such instruments with the Securities and Exchange Commission of the
United States of America (SEC) and the termination of the ADS Programme. On December 7, 2023 was the last trading day of the ADSs on the
NYSE. As of December 31, 2023, a total of 70,312,080 shares were represented by ADSs, equivalent to 4,687,472 ADSs at a ratio of 15 shares
per ADS. At the end of 2023, there were no shares represented in ADSs.
The changes in deferred income taxes are as follows:
| In thousands of soles | |
2023 | | |
2024 | |
| Balance as of January 1 | |
| 167,330 | | |
| 67,069 | |
| Debit (credit) to income statement (note 27) | |
| (25,110 | ) | |
| (8,398 | ) |
| Other movements | |
| (216 | ) | |
| 1,142 | |
| Balance as of June, 30 | |
| 142,004 | | |
| 59,813 | |
| 23. | Revenue from Contracts with Customers |
The corporation’s income is derived principally from the following:
| | |
For the three-month period | | |
For the six-month period | |
| | |
ended June 30 | | |
ended June 30 | |
| In thousands of soles | |
2023 | | |
2024 | | |
2023 | | |
2024 | |
| | |
| | |
| | |
| | |
| |
| Construction activities | |
| 589,395 | | |
| 547,282 | | |
| 1,038,038 | | |
| 1,093,265 | |
| Services provided | |
| 259,763 | | |
| 253,942 | | |
| 516,343 | | |
| 532,576 | |
| Sale of real estate and goods | |
| 187,763 | | |
| 169,992 | | |
| 332,678 | | |
| 342,660 | |
| Revenue from contracts with customers | |
| 1,036,921 | | |
| 971,216 | | |
| 1,887,059 | | |
| 1,968,501 | |
AENZA S.A.A. and Subsidiaries
Notes to the Interim Condensed Consolidated Financial Statements
As of December 31, 2023, and June 30, 2024
| A. | Revenues from contracts with customers are mainly broken down
by the following periods: |
| For the three-month period ended June 30, | |
Engineering and construction | | |
Energy | | |
Infrastructure | | |
Real estate | | |
Parent Company operations | | |
Total | |
| In thousands of soles | |
2023 | | |
2024 | | |
2023 | | |
2024 | | |
2023 | | |
2024 | | |
2023 | | |
2024 | | |
2023 | | |
2024 | | |
2023 | | |
2024 | |
| Primary geographical markets | |
| | |
| | |
| | |
| | |
| | |
| | |
| | |
| | |
| | |
| | |
| | |
| |
| Peru | |
| 356,264 | | |
| 354,646 | | |
| 146,116 | | |
| 181,562 | | |
| 170,855 | | |
| 172,814 | | |
| 76,546 | | |
| 32,610 | | |
| 6,193 | | |
| 6,302 | | |
| 755,974 | | |
| 747,934 | |
| Chile | |
| 184,075 | | |
| 65,930 | | |
| - | | |
| - | | |
| - | | |
| - | | |
| - | | |
| - | | |
| - | | |
| - | | |
| 184,075 | | |
| 65,930 | |
| Colombia | |
| 96,872 | | |
| 157,352 | | |
| - | | |
| - | | |
| - | | |
| - | | |
| - | | |
| - | | |
| - | | |
| - | | |
| 96,872 | | |
| 157,352 | |
| | |
| 637,211 | | |
| 577,928 | | |
| 146,116 | | |
| 181,562 | | |
| 170,855 | | |
| 172,814 | | |
| 76,546 | | |
| 32,610 | | |
| 6,193 | | |
| 6,302 | | |
| 1,036,921 | | |
| 971,216 | |
| Major products/ service lines | |
| | | |
| | | |
| | | |
| | | |
| | | |
| | | |
| | | |
| | | |
| | | |
| | | |
| | | |
| | |
| Construction activities | |
| 589,395 | | |
| 547,282 | | |
| - | | |
| - | | |
| - | | |
| - | | |
| - | | |
| - | | |
| - | | |
| - | | |
| 589,395 | | |
| 547,282 | |
| Engineering services | |
| 47,816 | | |
| 30,646 | | |
| - | | |
| - | | |
| - | | |
| - | | |
| - | | |
| - | | |
| - | | |
| - | | |
| 47,816 | | |
| 30,646 | |
| Oil and gas extraction, storage and dispatching services | |
| - | | |
| - | | |
| 33,754 | | |
| 42,819 | | |
| - | | |
| - | | |
| - | | |
| - | | |
| - | | |
| - | | |
| 33,754 | | |
| 42,819 | |
| Transportation services | |
| - | | |
| - | | |
| - | | |
| - | | |
| 102,035 | | |
| 102,763 | | |
| - | | |
| - | | |
| - | | |
| - | | |
| 102,035 | | |
| 102,763 | |
| Road concession services | |
| - | | |
| - | | |
| - | | |
| - | | |
| 67,604 | | |
| 68,870 | | |
| - | | |
| - | | |
| - | | |
| - | | |
| 67,604 | | |
| 68,870 | |
| Water treatment service | |
| - | | |
| - | | |
| - | | |
| - | | |
| 1,216 | | |
| 1,181 | | |
| - | | |
| - | | |
| - | | |
| - | | |
| 1,216 | | |
| 1,181 | |
| Property rental | |
| - | | |
| - | | |
| - | | |
| - | | |
| - | | |
| - | | |
| 1,145 | | |
| 1,361 | | |
| - | | |
| - | | |
| 1,145 | | |
| 1,361 | |
| Parent company services and others | |
| - | | |
| - | | |
| - | | |
| - | | |
| - | | |
| - | | |
| - | | |
| - | | |
| 6,193 | | |
| 6,302 | | |
| 6,193 | | |
| 6,302 | |
| Sale of real estate and lots | |
| - | | |
| - | | |
| - | | |
| - | | |
| - | | |
| - | | |
| 75,401 | | |
| 31,249 | | |
| - | | |
| - | | |
| 75,401 | | |
| 31,249 | |
| Sale of oil and gas | |
| - | | |
| - | | |
| 112,362 | | |
| 138,743 | | |
| - | | |
| - | | |
| - | | |
| - | | |
| - | | |
| - | | |
| 112,362 | | |
| 138,743 | |
| | |
| 637,211 | | |
| 577,928 | | |
| 146,116 | | |
| 181,562 | | |
| 170,855 | | |
| 172,814 | | |
| 76,546 | | |
| 32,610 | | |
| 6,193 | | |
| 6,302 | | |
| 1,036,921 | | |
| 971,216 | |
| Timing of revenue recognition | |
| | | |
| | | |
| | | |
| | | |
| | | |
| | | |
| | | |
| | | |
| | | |
| | | |
| | | |
| | |
| Transferred at a point in time | |
| - | | |
| - | | |
| 146,116 | | |
| 181,562 | | |
| - | | |
| - | | |
| 76,546 | | |
| 32,610 | | |
| 6,193 | | |
| 6,302 | | |
| 228,855 | | |
| 220,474 | |
| Transferred over time | |
| 637,211 | | |
| 577,928 | | |
| - | | |
| - | | |
| 170,855 | | |
| 172,814 | | |
| - | | |
| - | | |
| - | | |
| - | | |
| 808,066 | | |
| 750,742 | |
| | |
| 637,211 | | |
| 577,928 | | |
| 146,116 | | |
| 181,562 | | |
| 170,855 | | |
| 172,814 | | |
| 76,546 | | |
| 32,610 | | |
| 6,193 | | |
| 6,302 | | |
| 1,036,921 | | |
| 971,216 | |
| Revenue from contracts with customers | |
| 637,211 | | |
| 577,928 | | |
| 146,116 | | |
| 181,562 | | |
| 170,855 | | |
| 172,814 | | |
| 76,546 | | |
| 32,610 | | |
| 6,193 | | |
| 6,302 | | |
| 1,036,921 | | |
| 971,216 | |
AENZA S.A.A. and Subsidiaries
Notes to the Interim Condensed Consolidated Financial Statements
As of December 31, 2023, and June 30, 2024
| For the six-month period ended June 30, | |
Engineering
and construction | | |
Energy | | |
Infrastructure | | |
Real
estate | | |
Parent
Company operations | | |
Total | |
| In thousands of soles | |
2023 | | |
2024 | | |
2023 | | |
2024 | | |
2023 | | |
2024 | | |
2023 | | |
2024 | | |
2023 | | |
2024 | | |
2023 | | |
2024 | |
| Primary geographical markets | |
| | |
| | |
| | |
| | |
| | |
| | |
| | |
| | |
| | |
| | |
| | |
| |
| Peru | |
| 588,342 | | |
| 691,127 | | |
| 310,992 | | |
| 353,937 | | |
| 340,904 | | |
| 370,835 | | |
| 94,196 | | |
| 76,431 | | |
| 11,695 | | |
| 12,482 | | |
| 1,346,129 | | |
| 1,504,812 | |
| Chile | |
| 349,546 | | |
| 122,136 | | |
| - | | |
| - | | |
| - | | |
| - | | |
| - | | |
| - | | |
| - | | |
| - | | |
| 349,546 | | |
| 122,136 | |
| Colombia | |
| 191,384 | | |
| 341,553 | | |
| - | | |
| - | | |
| - | | |
| - | | |
| - | | |
| - | | |
| - | | |
| - | | |
| 191,384 | | |
| 341,553 | |
| | |
| 1,129,272 | | |
| 1,154,816 | | |
| 310,992 | | |
| 353,937 | | |
| 340,904 | | |
| 370,835 | | |
| 94,196 | | |
| 76,431 | | |
| 11,695 | | |
| 12,482 | | |
| 1,887,059 | | |
| 1,968,501 | |
| Major
products/ service lines | |
| | | |
| | | |
| | | |
| | | |
| | | |
| | | |
| | | |
| | | |
| | | |
| | | |
| | | |
| | |
| Construction activities | |
| 1,038,038 | | |
| 1,093,265 | | |
| - | | |
| - | | |
| - | | |
| - | | |
| - | | |
| - | | |
| - | | |
| - | | |
| 1,038,038 | | |
| 1,093,265 | |
| Engineering services | |
| 91,234 | | |
| 61,551 | | |
| - | | |
| - | | |
| - | | |
| - | | |
| - | | |
| - | | |
| - | | |
| - | | |
| 91,234 | | |
| 61,551 | |
| Oil and gas extraction, storage
and dispatching services | |
| - | | |
| - | | |
| 70,253 | | |
| 85,172 | | |
| - | | |
| - | | |
| - | | |
| - | | |
| - | | |
| - | | |
| 70,253 | | |
| 85,172 | |
| Transportation services | |
| - | | |
| - | | |
| - | | |
| - | | |
| 203,606 | | |
| 204,427 | | |
| - | | |
| - | | |
| - | | |
| - | | |
| 203,606 | | |
| 204,427 | |
| Road concession services | |
| - | | |
| - | | |
| - | | |
| - | | |
| 134,819 | | |
| 163,966 | | |
| - | | |
| - | | |
| - | | |
| - | | |
| 134,819 | | |
| 163,966 | |
| Water treatment service | |
| - | | |
| - | | |
| - | | |
| - | | |
| 2,479 | | |
| 2,442 | | |
| - | | |
| - | | |
| - | | |
| - | | |
| 2,479 | | |
| 2,442 | |
| Property rental | |
| - | | |
| - | | |
| - | | |
| - | | |
| - | | |
| - | | |
| 2,257 | | |
| 2,536 | | |
| - | | |
| - | | |
| 2,257 | | |
| 2,536 | |
| Parent company services and
others | |
| - | | |
| - | | |
| - | | |
| - | | |
| - | | |
| - | | |
| - | | |
| - | | |
| 11,695 | | |
| 12,482 | | |
| 11,695 | | |
| 12,482 | |
| Sale of real estate and lots | |
| - | | |
| - | | |
| - | | |
| - | | |
| - | | |
| - | | |
| 91,939 | | |
| 73,895 | | |
| - | | |
| - | | |
| 91,939 | | |
| 73,895 | |
| Sale
of oil and gas | |
| - | | |
| - | | |
| 240,739 | | |
| 268,765 | | |
| - | | |
| - | | |
| - | | |
| - | | |
| - | | |
| - | | |
| 240,739 | | |
| 268,765 | |
| | |
| 1,129,272 | | |
| 1,154,816 | | |
| 310,992 | | |
| 353,937 | | |
| 340,904 | | |
| 370,835 | | |
| 94,196 | | |
| 76,431 | | |
| 11,695 | | |
| 12,482 | | |
| 1,887,059 | | |
| 1,968,501 | |
| Timing
of revenue recognition | |
| | | |
| | | |
| | | |
| | | |
| | | |
| | | |
| | | |
| | | |
| | | |
| | | |
| | | |
| | |
| Transferred at a point in
time | |
| - | | |
| - | | |
| 310,992 | | |
| 353,937 | | |
| - | | |
| - | | |
| 94,196 | | |
| 76,431 | | |
| 11,695 | | |
| 12,482 | | |
| 416,883 | | |
| 442,850 | |
| Transferred
over time | |
| 1,129,272 | | |
| 1,154,816 | | |
| - | | |
| - | | |
| 340,904 | | |
| 370,835 | | |
| - | | |
| - | | |
| - | | |
| - | | |
| 1,470,176 | | |
| 1,525,651 | |
| | |
| 1,129,272 | | |
| 1,154,816 | | |
| 310,992 | | |
| 353,937 | | |
| 340,904 | | |
| 370,835 | | |
| 94,196 | | |
| 76,431 | | |
| 11,695 | | |
| 12,482 | | |
| 1,887,059 | | |
| 1,968,501 | |
| Revenue
from contracts with customers | |
| 1,129,272 | | |
| 1,154,816 | | |
| 310,992 | | |
| 353,937 | | |
| 340,904 | | |
| 370,835 | | |
| 94,196 | | |
| 76,431 | | |
| 11,695 | | |
| 12,482 | | |
| 1,887,059 | | |
| 1,968,501 | |
AENZA S.A.A. and Subsidiaries
Notes to the Interim Condensed Consolidated Financial Statements
As of December 31, 2023, and June 30, 2024
| B. | Balances of contract assets and liabilities is mainly comprised
of: |
| | |
| |
As of | | |
As of | |
| | |
| |
December 31, | | |
June 30, | |
| In thousands of soles | |
Note | |
2023 | | |
2024 | |
| | |
| |
| | |
| |
| Receivables | |
10.a | |
| 204,167 | | |
| 267,601 | |
| Unbilled receivables | |
10.b and c | |
| 1,626,605 | | |
| 1,603,117 | |
| Guarantee deposits | |
12.e | |
| 82,230 | | |
| 71,474 | |
| Advances received from customers | |
19.b | |
| (241,469 | ) | |
| (213,393 | ) |
Contract assets primarily relate to rights to
consideration for work performed, but not billed at the reporting date. Contract liabilities relate primarily to advance consideration
received from customers for which revenue is recognized over time.
The following is a detail of the movement of contract
liabilities:
| | |
For the three-month period | | |
For the six-month period | |
| | |
ended June 30 | | |
ended June 30 | |
| In thousands of soles | |
2023 | | |
2024 | | |
2023 | | |
2024 | |
| | |
| | |
| | |
| | |
| |
| Balance as beginning of period | |
| 378,457 | | |
| 238,113 | | |
| 365,730 | | |
| 241,456 | |
| Advances received from customers | |
| 210,071 | | |
| 73,271 | | |
| 313,863 | | |
| 162,467 | |
| Compensation of customer advances | |
| (117,366 | ) | |
| (97,991 | ) | |
| (208,431 | ) | |
| (190,530 | ) |
| Balance as of June, 30 | |
| 471,162 | | |
| 213,393 | | |
| 471,162 | | |
| 213,393 | |
Revenue from contract liabilities recognized as
of June 30, 2024, is S/190.5 million (S/208.4 million as of June 30, 2023).
For the periods ended June 30, 2023 and 2024,
this caption comprises the following:
| | |
| |
For the three-month period | | |
For the six month period | |
| | |
| |
ended June 30 | | |
ended June 30 | |
| | |
| |
Cost | | |
| | |
| | |
Cost | | |
| | |
| |
| | |
| |
of goods | | |
Administrative | | |
| | |
of goods | | |
Administrative | | |
| |
| In thousands of soles | |
Note | |
and services | | |
expenses | | |
Total | | |
and services | | |
expenses | | |
Total | |
| 2023 | |
| |
| | |
| | |
| | |
| | |
| | |
| |
| Salaries, wages and fringe benefits | |
| |
| 251,801 | | |
| 31,917 | | |
| 283,718 | | |
| 507,878 | | |
| 61,080 | | |
| 568,958 | |
| Services provided by third-parties | |
| |
| 348,308 | | |
| 16,839 | | |
| 365,147 | | |
| 606,853 | | |
| 26,274 | | |
| 633,127 | |
| Purchase of goods | |
| |
| 149,318 | | |
| - | | |
| 149,318 | | |
| 259,661 | | |
| - | | |
| 259,661 | |
| Other management charges | |
| |
| 93,963 | | |
| 1,622 | | |
| 95,585 | | |
| 183,967 | | |
| 4,414 | | |
| 188,381 | |
| Depreciation | |
15.a | |
| 12,811 | | |
| 4,631 | | |
| 17,442 | | |
| 27,488 | | |
| 7,890 | | |
| 35,378 | |
| Amortization | |
15.b | |
| 38,787 | | |
| 988 | | |
| 39,775 | | |
| 73,083 | | |
| 1,978 | | |
| 75,061 | |
| Impairment of accounts receivable | |
| |
| 1,289 | | |
| 891 | | |
| 2,180 | | |
| 1,289 | | |
| 891 | | |
| 2,180 | |
| Taxes | |
| |
| 6,358 | | |
| 172 | | |
| 6,530 | | |
| 11,632 | | |
| 396 | | |
| 12,028 | |
| | |
| |
| 902,635 | | |
| 57,060 | | |
| 959,695 | | |
| 1,671,851 | | |
| 102,923 | | |
| 1,774,774 | |
| | |
| |
Cost | | |
| | |
| | |
Cost | | |
| | |
| |
| | |
| |
of goods | | |
Administrative | | |
| | |
of goods | | |
Administrative | | |
| |
| In thousands of soles | |
Note | |
and services | | |
expenses | | |
Total | | |
and services | | |
expenses | | |
Total | |
| 2024 | |
| |
| | |
| | |
| | |
| | |
| | |
| |
| Salaries, wages and fringe benefits | |
| |
| 213,253 | | |
| 32,219 | | |
| 245,472 | | |
| 402,616 | | |
| 62,356 | | |
| 464,972 | |
| Services provided by third-parties | |
| |
| 287,240 | | |
| 14,714 | | |
| 301,954 | | |
| 599,733 | | |
| 26,537 | | |
| 626,270 | |
| Purchase of goods | |
| |
| 210,184 | | |
| - | | |
| 210,184 | | |
| 430,794 | | |
| - | | |
| 430,794 | |
| Other management charges | |
| |
| 93,669 | | |
| 2,884 | | |
| 96,553 | | |
| 191,293 | | |
| 5,880 | | |
| 197,173 | |
| Depreciation | |
15.a | |
| 11,881 | | |
| 2,993 | | |
| 14,874 | | |
| 22,512 | | |
| 5,982 | | |
| 28,494 | |
| Amortization | |
15.b | |
| 33,253 | | |
| 1,595 | | |
| 34,848 | | |
| 62,962 | | |
| 3,143 | | |
| 66,105 | |
| Taxes | |
| |
| 5,699 | | |
| 286 | | |
| 5,985 | | |
| 14,555 | | |
| 566 | | |
| 15,121 | |
| | |
| |
| 855,179 | | |
| 54,691 | | |
| 909,870 | | |
| 1,724,465 | | |
| 104,464 | | |
| 1,828,929 | |
AENZA S.A.A. and Subsidiaries
Notes to the Interim Condensed Consolidated Financial Statements
As of December 31, 2023, and June 30, 2024
| 25. | Other Income and Expenses, Net |
For the periods ended June 30, 2023, and 2024,
this item comprises:
| | |
For the three-month period | | |
For the six-month period | |
| | |
ended June 30, | | |
ended June 30, | |
| In thousands of soles | |
2023 | | |
2024 | | |
2023 | | |
2024 | |
| Other income: | |
| | |
| | |
| | |
| |
| Sale of assets and intangibles | |
| 2,957 | | |
| 5,239 | | |
| 4,000 | | |
| 5,955 | |
| Recovery of provisions and impairments | |
| 557 | | |
| 328 | | |
| 1,900 | | |
| 674 | |
| Penalty income | |
| 167 | | |
| 119 | | |
| 326 | | |
| 584 | |
| Insurance compensation | |
| 316 | | |
| 51 | | |
| 2,978 | | |
| 75 | |
| Supplier debt forgiveness | |
| 13 | | |
| - | | |
| 158 | | |
| - | |
| Others | |
| 1,619 | | |
| 1,263 | | |
| 2,757 | | |
| 2,485 | |
| | |
| 5,629 | | |
| 7,000 | | |
| 12,119 | | |
| 9,773 | |
| | |
| | | |
| | | |
| | | |
| | |
| Other expenses: | |
| | | |
| | | |
| | | |
| | |
| Net cost of fixed assets disposal | |
| 1,515 | | |
| 4,384 | | |
| 2,138 | | |
| 4,613 | |
| Administrative sanctions and legal processes | |
| 1,999 | | |
| 1,073 | | |
| 6,847 | | |
| 4,339 | |
| Disposal of assets | |
| 394 | | |
| 336 | | |
| 596 | | |
| 363 | |
| Others | |
| 1,153 | | |
| 633 | | |
| 1,537 | | |
| 914 | |
| | |
| 5,061 | | |
| 6,426 | | |
| 11,118 | | |
| 10,229 | |
| Other income and expenses, net | |
| 568 | | |
| 574 | | |
| 1,001 | | |
| (456 | ) |
| 26. | Financial Income and Expenses |
| A. | Financial Income and Expenses |
For the periods ended June 30, 2023 and 2024,
this caption comprises the following:
| | |
For the three-month period | | |
For the six-month period | |
| | |
ended June 30, | | |
ended June 30, | |
| In thousands of soles | |
2023 | | |
2024 | | |
2023 | | |
2024 | |
| | |
| | |
| | |
| | |
| |
| Financial income: | |
| | |
| | |
| | |
| |
| Interest on bank deposits | |
| 6,768 | | |
| 5,402 | | |
| 13,187 | | |
| 12,711 | |
| Exchange difference gain, net (note 4.A.a.i) | |
| 1,083 | | |
| - | | |
| 12,379 | | |
| - | |
| Others | |
| 281 | | |
| 324 | | |
| 598 | | |
| 564 | |
| | |
| 8,132 | | |
| 5,726 | | |
| 26,164 | | |
| 13,275 | |
| | |
| | | |
| | | |
| | | |
| | |
| Financial expenses: | |
| | | |
| | | |
| | | |
| | |
| Interest expense on: | |
| | | |
| | | |
| | | |
| | |
| - Bank loans | |
| 23,337 | | |
| 18,289 | | |
| 44,708 | | |
| 41,555 | |
| - Bonds | |
| 4,628 | | |
| 18,405 | | |
| 9,417 | | |
| 22,320 | |
| - Loans from third parties | |
| 1,988 | | |
| 7,528 | | |
| 4,819 | | |
| 12,838 | |
| - Financial lease right-of-use | |
| 1,168 | | |
| 833 | | |
| 2,476 | | |
| 1,744 | |
| - Financial lease | |
| 1 | | |
| - | | |
| 9 | | |
| - | |
| Commissions and collaterals | |
| 4,143 | | |
| 2,119 | | |
| 8,925 | | |
| 7,561 | |
| Interests from Tax Administration | |
| 7,417 | | |
| 5,136 | | |
| 10,483 | | |
| 8,854 | |
| Exchange difference loss, net (note 4.A.a.i) | |
| - | | |
| 3,817 | | |
| - | | |
| 19,300 | |
| Other financial expenses | |
| 1,943 | | |
| 2,035 | | |
| 5,600 | | |
| 4,348 | |
| | |
| 44,625 | | |
| 58,162 | | |
| 86,437 | | |
| 118,520 | |
As of June 30, 2024, the increase corresponds
mainly to accrued interests and the amortization of prepaid interest and costs incurred on the bonds issued by the Company on May 14,
2024, for US$210 million (Note 17.a).
AENZA S.A.A. and Subsidiaries
Notes to the Interim Condensed Consolidated Financial Statements
As of December 31, 2023, and June 30, 2024
| B. | Gain (loss) from present value of financial assets or liabilities |
For the periods ended June 30, 2023, and 2024
comprises:
| | |
For the three-month period | | |
For the six-month period | |
| | |
ended June 30, | | |
ended June 30, | |
| In thousands of soles | |
2023 | | |
2024 | | |
2023 | | |
2024 | |
| | |
| | |
| | |
| | |
| |
| Interest income for present value of financial asset or liability (a) | |
| 6,910 | | |
| 755 | | |
| 24,549 | | |
| 1,769 | |
| Interest expenses for present value of financial asset or liability (b) | |
| (553 | ) | |
| (13,189 | ) | |
| (4,386 | ) | |
| (16,508 | ) |
| | |
| 6,357 | | |
| (12,434 | ) | |
| 20,163 | | |
| (14,739 | ) |
For the period ended June 30, 2024, there is a
net decrease compared to the same period of the previous year mainly due to:
| a) | Decrease due to the adjustment in the present value of the
account receivable from Gasoducto Sur Peruano S.A. for S/18 million due to the decrease in the discount rate applied from 5.86% to 4.98%
as of June 30, 2023. |
| b) | Increase due to adjustment to the fair value of the loan from
BCI in Inversiones en Autopistas S.A. for S/12.4 million due to the increase in the discount rate applied from 9.23% to 9.97% as of June
30, 2024. |
A. For
the periods ended June 30, 2023 and 2024, the income tax expense shown in the consolidated statement of profit comprises:
| | |
For the three-month period | | |
For the six-month period | |
| | |
ended June 30, | | |
ended June 30, | |
| In thousands of soles | |
2023 | | |
2024 | | |
2023 | | |
2024 | |
| | |
| | |
| | |
| | |
| |
| Current income tax | |
| 11,289 | | |
| 14,352 | | |
| 47,303 | | |
| 49,627 | |
| Deferred income tax (note 22) | |
| 28,743 | | |
| 21,248 | | |
| 25,110 | | |
| 8,398 | |
| Income tax expense | |
| 40,032 | | |
| 35,600 | | |
| 72,413 | | |
| 58,025 | |
B. For
the periods ended June 30, 2023 and 2024, the Corporation’s income tax differs from the notional amount that would result from applying
the Corporation’s weighted average corporate income tax rate to consolidated pretax income as follows:
| | |
For the three-month period | | |
For the six-month period | |
| | |
ended June 30, | | |
ended June 30, | |
| In thousands of soles | |
2023 | | |
2024 | | |
2023 | | |
2024 | |
| | |
| | |
| | |
| | |
| |
| Profit (loss) before income tax | |
| 48,450 | | |
| (2,128 | ) | |
| 74,832 | | |
| 20,762 | |
| Income tax by applying local applicable tax | |
| | | |
| | | |
| | | |
| | |
| rates on profit generated in the respective countries | |
| 15,057 | | |
| (3,410 | ) | |
| 23,297 | | |
| 2,383 | |
| Tax effect on: | |
| | | |
| | | |
| | | |
| | |
| - Non-deductible expenses | |
| 6,328 | | |
| 19,052 | | |
| 8,435 | | |
| 29,800 | |
| - Unrecognized deferred income tax asset | |
| 12,386 | | |
| (1,235 | ) | |
| 31,397 | | |
| 2,740 | |
| - Equity method | |
| (234 | ) | |
| (243 | ) | |
| (489 | ) | |
| (481 | ) |
| - Provision of tax contingencies | |
| 4,724 | | |
| - | | |
| 4,724 | | |
| - | |
| - Change in prior years estimations | |
| 1,771 | | |
| 16,573 | | |
| 5,049 | | |
| 18,720 | |
| - Others | |
| - | | |
| 4,863 | | |
| - | | |
| 4,863 | |
| Income tax | |
| 40,032 | | |
| 35,600 | | |
| 72,413 | | |
| 58,025 | |
AENZA S.A.A. and Subsidiaries
Notes to the Interim Condensed Consolidated Financial Statements
As of December 31, 2023, and June 30, 2024
| 28. | Contingencies, Commitments and Guarantees |
Under Management’s opinion and of its legal
advisors, provisions recognized mainly for civil lawsuits, labor disputes, tax claims, contentious and administrative processes are sufficient
to cover the results of these probable contingencies (note 20), and the balance of possible contingencies is S/484.1 million (S/482.3
million as of December 31, 2023).
As of June 30, 2024, the Corporation maintains
guarantees and letters of credit in force in several financial entities guaranteeing operations for US$554.74 million (US$538.3 million,
as of December 31, 2023).
| 29. | Non-Controlling Interests |
The following table summarizes information regarding each of the Corporation’s
subsidiaries that have significant noncontrolling interests, prior to any intragroup elimination. any intragroup elimination.
| At June 30, 2023 | |
VIVA Negocio inmobiliario S.A.C. and subsidiaries | | |
Red Vial 5 S.A. | | |
Tren Urbano de Lima S.A. | | |
Cumbra Ingenieria S.A. and subsidiaries | | |
Unna Energia S.A. | | |
Cumbra Peru S.A. and subsidiaries | | |
Promotora Larcomar S.A. | | |
Other individually immaterial subsidiaries | | |
Intra-group eliminations | | |
Total | |
| In thousands of soles | |
| | |
| | |
| | |
| | |
| | |
| | |
| | |
| | |
| | |
| |
| Percentage of non-controlling
interest | |
| 0.46 | % | |
| 33.00 | % | |
| 25.00 | % | |
| 10.59 | % | |
| 5.00 | % | |
| 0.61 | % | |
| 53.45 | % | |
| | | |
| | | |
| | |
| Current assets | |
| 486,343 | | |
| 91,235 | | |
| 307,026 | | |
| 132,723 | | |
| 191,493 | | |
| 1,317,830 | | |
| 299 | | |
| | | |
| | | |
| | |
| Non-current assets | |
| 181,724 | | |
| 301,350 | | |
| 731,270 | | |
| 9,140 | | |
| 691,177 | | |
| 840,114 | | |
| 13,368 | | |
| | | |
| | | |
| | |
| Current liabilities | |
| (216,560 | ) | |
| (59,547 | ) | |
| (109,076 | ) | |
| (108,965 | ) | |
| (218,634 | ) | |
| (1,750,499 | ) | |
| (51 | ) | |
| | | |
| | | |
| | |
| Non-current liabilities | |
| (71,813 | ) | |
| (162,374 | ) | |
| (701,532 | ) | |
| (1,298 | ) | |
| (207,676 | ) | |
| (138,888 | ) | |
| (7,729 | ) | |
| | | |
| | | |
| | |
| Net assets | |
| 379,694 | | |
| 170,664 | | |
| 227,688 | | |
| 31,600 | | |
| 456,360 | | |
| 268,557 | | |
| 5,887 | | |
| | | |
| | | |
| | |
| Net assets atributable to non-controlling interest | |
| 95,692 | | |
| 56,319 | | |
| 56,922 | | |
| 3,341 | | |
| 32,720 | | |
| 878 | | |
| 3,147 | | |
| (115 | ) | |
| 31 | | |
| 248,935 | |
| Revenues | |
| 94,373 | | |
| 102,279 | | |
| 204,678 | | |
| 99,187 | | |
| 310,992 | | |
| 1,039,497 | | |
| - | | |
| | | |
| | | |
| | |
| Profit of the period | |
| 12,704 | | |
| 15,585 | | |
| 39,410 | | |
| 27 | | |
| 21,958 | | |
| (78,508 | ) | |
| 58 | | |
| | | |
| | | |
| | |
| Other comprehensive income | |
| - | | |
| - | | |
| - | | |
| (45 | ) | |
| - | | |
| 9,011 | | |
| - | | |
| 286 | | |
| - | | |
| 9,252 | |
| Total comprehensive income for
the period | |
| 12,704 | | |
| 15,585 | | |
| 39,410 | | |
| (18 | ) | |
| 21,958 | | |
| (69,497 | ) | |
| 58 | | |
| | | |
| | | |
| | |
| Profit (loss) of the period, allocated to non-controlling interest | |
| 7,203 | | |
| 5,143 | | |
| 9,853 | | |
| 11 | | |
| 3,337 | | |
| (611 | ) | |
| 31 | | |
| (176 | ) | |
| 190 | | |
| 24,981 | |
| Other comprehensive income, allocated to non-controlling interest | |
| - | | |
| - | | |
| - | | |
| (5 | ) | |
| - | | |
| 40 | | |
| - | | |
| - | | |
| - | | |
| 35 | |
AENZA S.A.A. and Subsidiaries
Notes to the Interim Condensed Consolidated Financial Statements
As of December 31, 2023, and June 30, 2024
| At
June 30, 2024 | |
VIVA
Negocio inmobiliario S.A.C. and subsidiaries | | |
Red
Vial 5 S.A. | | |
Tren
Urbano de Lima S.A. | | |
Cumbra
Ingenieria S.A. and subsidiaries | | |
Unna
Energia S.A. | | |
Cumbra
Peru S.A. and subsidiaries | | |
Promotora
Larcomar S.A. | | |
Other
individually immaterial subsidiaries | | |
Intra-group
eliminations | | |
Total | |
| In thousands of soles | |
| | |
| | |
| | |
| | |
| | |
| | |
| | |
| | |
| | |
| |
| Percentage
of non-controlling interest | |
| 0.46 | % | |
| 33.00 | % | |
| 25.00 | % | |
| 10.59 | % | |
| 5.00 | % | |
| 0.47 | % | |
| 53.45 | % | |
| | | |
| | | |
| | |
| Current assets | |
| 395,619 | | |
| 118,952 | | |
| 307,695 | | |
| 119,637 | | |
| 278,236 | | |
| 1,246,663 | | |
| 298 | | |
| | | |
| | | |
| | |
| Non-current assets | |
| 184,833 | | |
| 219,406 | | |
| 773,461 | | |
| 6,785 | | |
| 682,788 | | |
| 701,213 | | |
| 13,368 | | |
| | | |
| | | |
| | |
| Current liabilities | |
| (129,487 | ) | |
| (120,852 | ) | |
| (130,922 | ) | |
| (97,100 | ) | |
| (275,763 | ) | |
| (1,304,675 | ) | |
| (53 | ) | |
| | | |
| | | |
| | |
| Non-current
liabilities | |
| (71,713 | ) | |
| (113,294 | ) | |
| (693,989 | ) | |
| (136 | ) | |
| (195,277 | ) | |
| (136,075 | ) | |
| (7,756 | ) | |
| | | |
| | | |
| | |
| Net
assets | |
| 379,252 | | |
| 104,212 | | |
| 256,245 | | |
| 29,186 | | |
| 489,984 | | |
| 507,126 | | |
| 5,857 | | |
| | | |
| | | |
| | |
| Net
assets atributable to non-controlling interest | |
| 87,018 | | |
| 34,390 | | |
| 64,061 | | |
| 3,080 | | |
| 35,217 | | |
| 2,247 | | |
| 3,130 | | |
| (111 | ) | |
| (1,948 | ) | |
| 227,084 | |
| Revenues | |
| 76,537 | | |
| 117,196 | | |
| 205,540 | | |
| 61,550 | | |
| 353,937 | | |
| 1,101,361 | | |
| - | | |
| | | |
| | | |
| | |
| Profit of the period | |
| 10,204 | | |
| 25,120 | | |
| 39,340 | | |
| 450 | | |
| 33,765 | | |
| (69,555 | ) | |
| (18 | ) | |
| | | |
| | | |
| | |
| Other
comprehensive income | |
| - | | |
| - | | |
| - | | |
| 70 | | |
| - | | |
| (3,946 | ) | |
| - | | |
| (701 | ) | |
| - | | |
| (4,577 | ) |
| Total
comprehensive income for the period | |
| 10,204 | | |
| 25,120 | | |
| 39,340 | | |
| 520 | | |
| 33,765 | | |
| (73,501 | ) | |
| (18 | ) | |
| | | |
| | | |
| | |
| Profit (loss) of the period,
allocated to non-controlling interest | |
| 7,911 | | |
| 8,290 | | |
| 9,835 | | |
| 48 | | |
| 3,872 | | |
| (335 | ) | |
| (10 | ) | |
| 15 | | |
| - | | |
| 29,626 | |
| Other comprehensive income,
allocated to non-controlling interest | |
| - | | |
| - | | |
| - | | |
| 8 | | |
| - | | |
| (20 | ) | |
| - | | |
| - | | |
| - | | |
| (12 | ) |
AENZA S.A.A. and Subsidiaries
Notes to the Interim Condensed Consolidated Financial Statements
As of December 31, 2023, and June 30, 2024
In compliance with certain
covenants applicable as of to this date produced by agreements subscribed by the corporation, the Company will not pay, except for transactions
with non-controlling interests. Certain of our debt or other contractual obligations may restrict our ability to pay dividends in the
future.
Additionally, the Collaboration
and Benefits Agreement does not allow the distribution of dividends until 40% of the total amount of the committed civil penalty described
in note 1.C has been paid.
For the period ended
June 30, 2024, the Corporation’s subsidiaries have paid dividends to its non-controlling interests of S/24.6 million and paid S/6.8
million plus S/8.1 million for dividends declared in 2023 (as of June 30, 2023, the subsidiaries paid S/50.7 million to its non-controlled
interests).
The basic (loss) gain
per common share has been calculated by dividing the loss of the period attributable to the Corporate’s common shareholders by the
weighted average of the number of common shares outstanding during that period.
For the periods ended
June 30, 2023, and 2024, the basic loss per common share is as follows:
| | |
| |
For the three-month period | | |
For the six-month period | |
| | |
| |
ended June 30, | | |
ended June 30, | |
| In thousands of soles | |
| |
2023 | | |
2024 | | |
2023 | | |
2024 | |
| Loss attributable to owners of the
Company during the period | |
| |
| (5,174 | ) | |
| (51,349 | ) | |
| (22,562 | ) | |
| (66,889 | ) |
| Weighted average number of shares
in issue at S/1.00 each, at June 30, | |
| |
| 1,196,979,979 | | |
| 1,371,964,891 | | |
| 1,196,979,979 | | |
| 1,371,964,891 | |
| Basic loss per share (in S/) | |
(*) | |
| (0.004 | ) | |
| (0.038 | ) | |
| (0.019 | ) | |
| (0.049 | ) |
| Weighted average number of shares
(diluted) in issue at S/1.00 each, at June 30, | |
| |
| 1,196,979,979 | | |
| 1,371,964,891 | | |
| 1,196,979,979 | | |
| 1,371,964,891 | |
| Diluted loss per share (in S/) | |
(*) | |
| (0.004 | ) | |
| (0.038 | ) | |
| (0.019 | ) | |
| (0.049 | ) |
| (*) | The Corporation does not have common shares with dilutive
effects as of June 30, 2023 and 2024. |
| 32. | Events after the date of the interim condensed financial statement |
From July 1, 2024, through the date
of issuance of this report, the following significant event has occurred:
Capital Increase
On July 24, 2024, the Board of Directors agreed to call a general shareholders'
meeting, on first call on August 20, 2024, on second call on August 26, 2024, and on third call on September 2, 2024, respectively. The
purpose of this meeting is to submit a capital increase through new cash contributions, up to an amount in local currency equivalent to
US$55 million. Likewise, the meeting will also address the terms for the exercise of the corresponding pre-emptive subscription right
and the delegation of powers to the Board of Directors for the definition of the terms of the capital increase.
In addition to this event, no additional material facts or events have
occurred that would require adjustments or disclosures in the consolidated financial statements as of June 30, 2024.
July 24, 2024
SIGNATURES
Pursuant to the requirements of the Exchange Act, the registrant has
duly caused this report to be signed on its behalf by the undersigned, thereunto duly authorized.
AENZA S.A.A.
| By: |
/s/ CRISTIAN RESTREPO HERNANDEZ |
|
| Name: |
Cristian Restrepo Hernandez |
|
| Title: |
VP of Corporate Finance |
|
| Date: |
July 24, 2024 |
|
Consolidated Results Report 2Q2024 July 24, 2024
Consolidated Results Report - Third Quarter of 2014 Consolidated Results Report - 2Q2024 This management discussion and analysis (MD&A) should be used in combination with the fi - nancial statements for the second quarter 2024 (2Q 2024). The aforementioned financial statements can be downloaded from our website: https://investorrelations.aenza.com.pe/reportes/estados - financieros/consolidados Financial results include adjustments to the revenue and cost recognition methodology in the subsidiaries of the Engineering & Construction business unit . As of December 31 , 2023 , the Com - pany recognized service revenue from construction contracts on a percentage - of - completion ba - sis in accordance with the product method ; however, given the current terms of customer con - tracts awarded beginning in 2024 , management believes that the method that best reflects and measures the transfer of control of goods and services to its customers and full satisfaction of the performance obligation is the recourse method . Therefore, beginning in 2024 , the Company applies the recourse method to measure the progress of all of its contractual performance obli - gations being satisfied over time . Page 2
Consolidated Results Report - Third Quarter of 2014 1. Page 3 Full and timely compliance with our legal and civil commitments to the Peruvian prosecutor (Fiscalía) and the Peruvian General Attorney (Procuraduría), including payment of civil reparations and/or fines according to the schedule agreed with these two institutions; 2. Enhances our compliance best practices, such as the continued strengthening of a strong compliance structure, policies, procedures and training in line with the U . S . Foreign Corrupt Practices Act, other applicable anti - corruption rules and regulations, and Anti - Money Laundering standards, supported by the redesign and implementation of new committee structures . 3. Strengthening the company’s corporate governance structure with best practices, including changes to the organization of our Board of Direc - tors, which now consist of four committees, that will allow for a comprehensive corporate oversight and demonstrate the company’s commit - ment to the highest corporate governance standards ; 4. Execution of our proposed corporate reorganization, which involves the creation of two holding companies, one of which will be a regional infra - structure development platform . At the same time, we will continue to seek opportunities to complement our portfolio and strengthen our mar - ket position, with the goal of becoming a leading concession management company in the region ; and 5. Continue ongoing discussions with the Peruvian government on new projects associated with Line 1 and Norvial. Consolidated Results Report - 2Q2024 Strategy Our strategy is to strengthen our business units, with the goal of becoming one of the leading Latin American infrastructure development platforms . Considering the high entry barriers that the infrastructure business entails, the company’s plan is to build on top of the leadership as an infrastructure company in Peru, expanding its business to nearby countries like Chile, Colombia, and Brazil, through new concessions and PPPs from third parties . We intend to participate in new tenders and acquisitions in Peru and other countries in the region, including Chile, Colombia and Brazil, with the goal of creating one of the largest regional platform for the development of infrastructure projects . In addition, as part of our strategy for the next years, we will also enhance our other business units. In our Energy business we will continue to deliver refined hydrocarbons from the terminals that we operate, and we will seek to advance production from Blocks III and IV and our Gas Plant in Talara. Our Real Estate business will seek to grow in the affordable housing sector. Finally, our Engineering and Construction business will work to consolidate its position in Chile and Colombia and continue to strengthen its focus in Peru, while we explore options for a strategic partnership. Our strategy for the next years is to focus on the following initiatives:
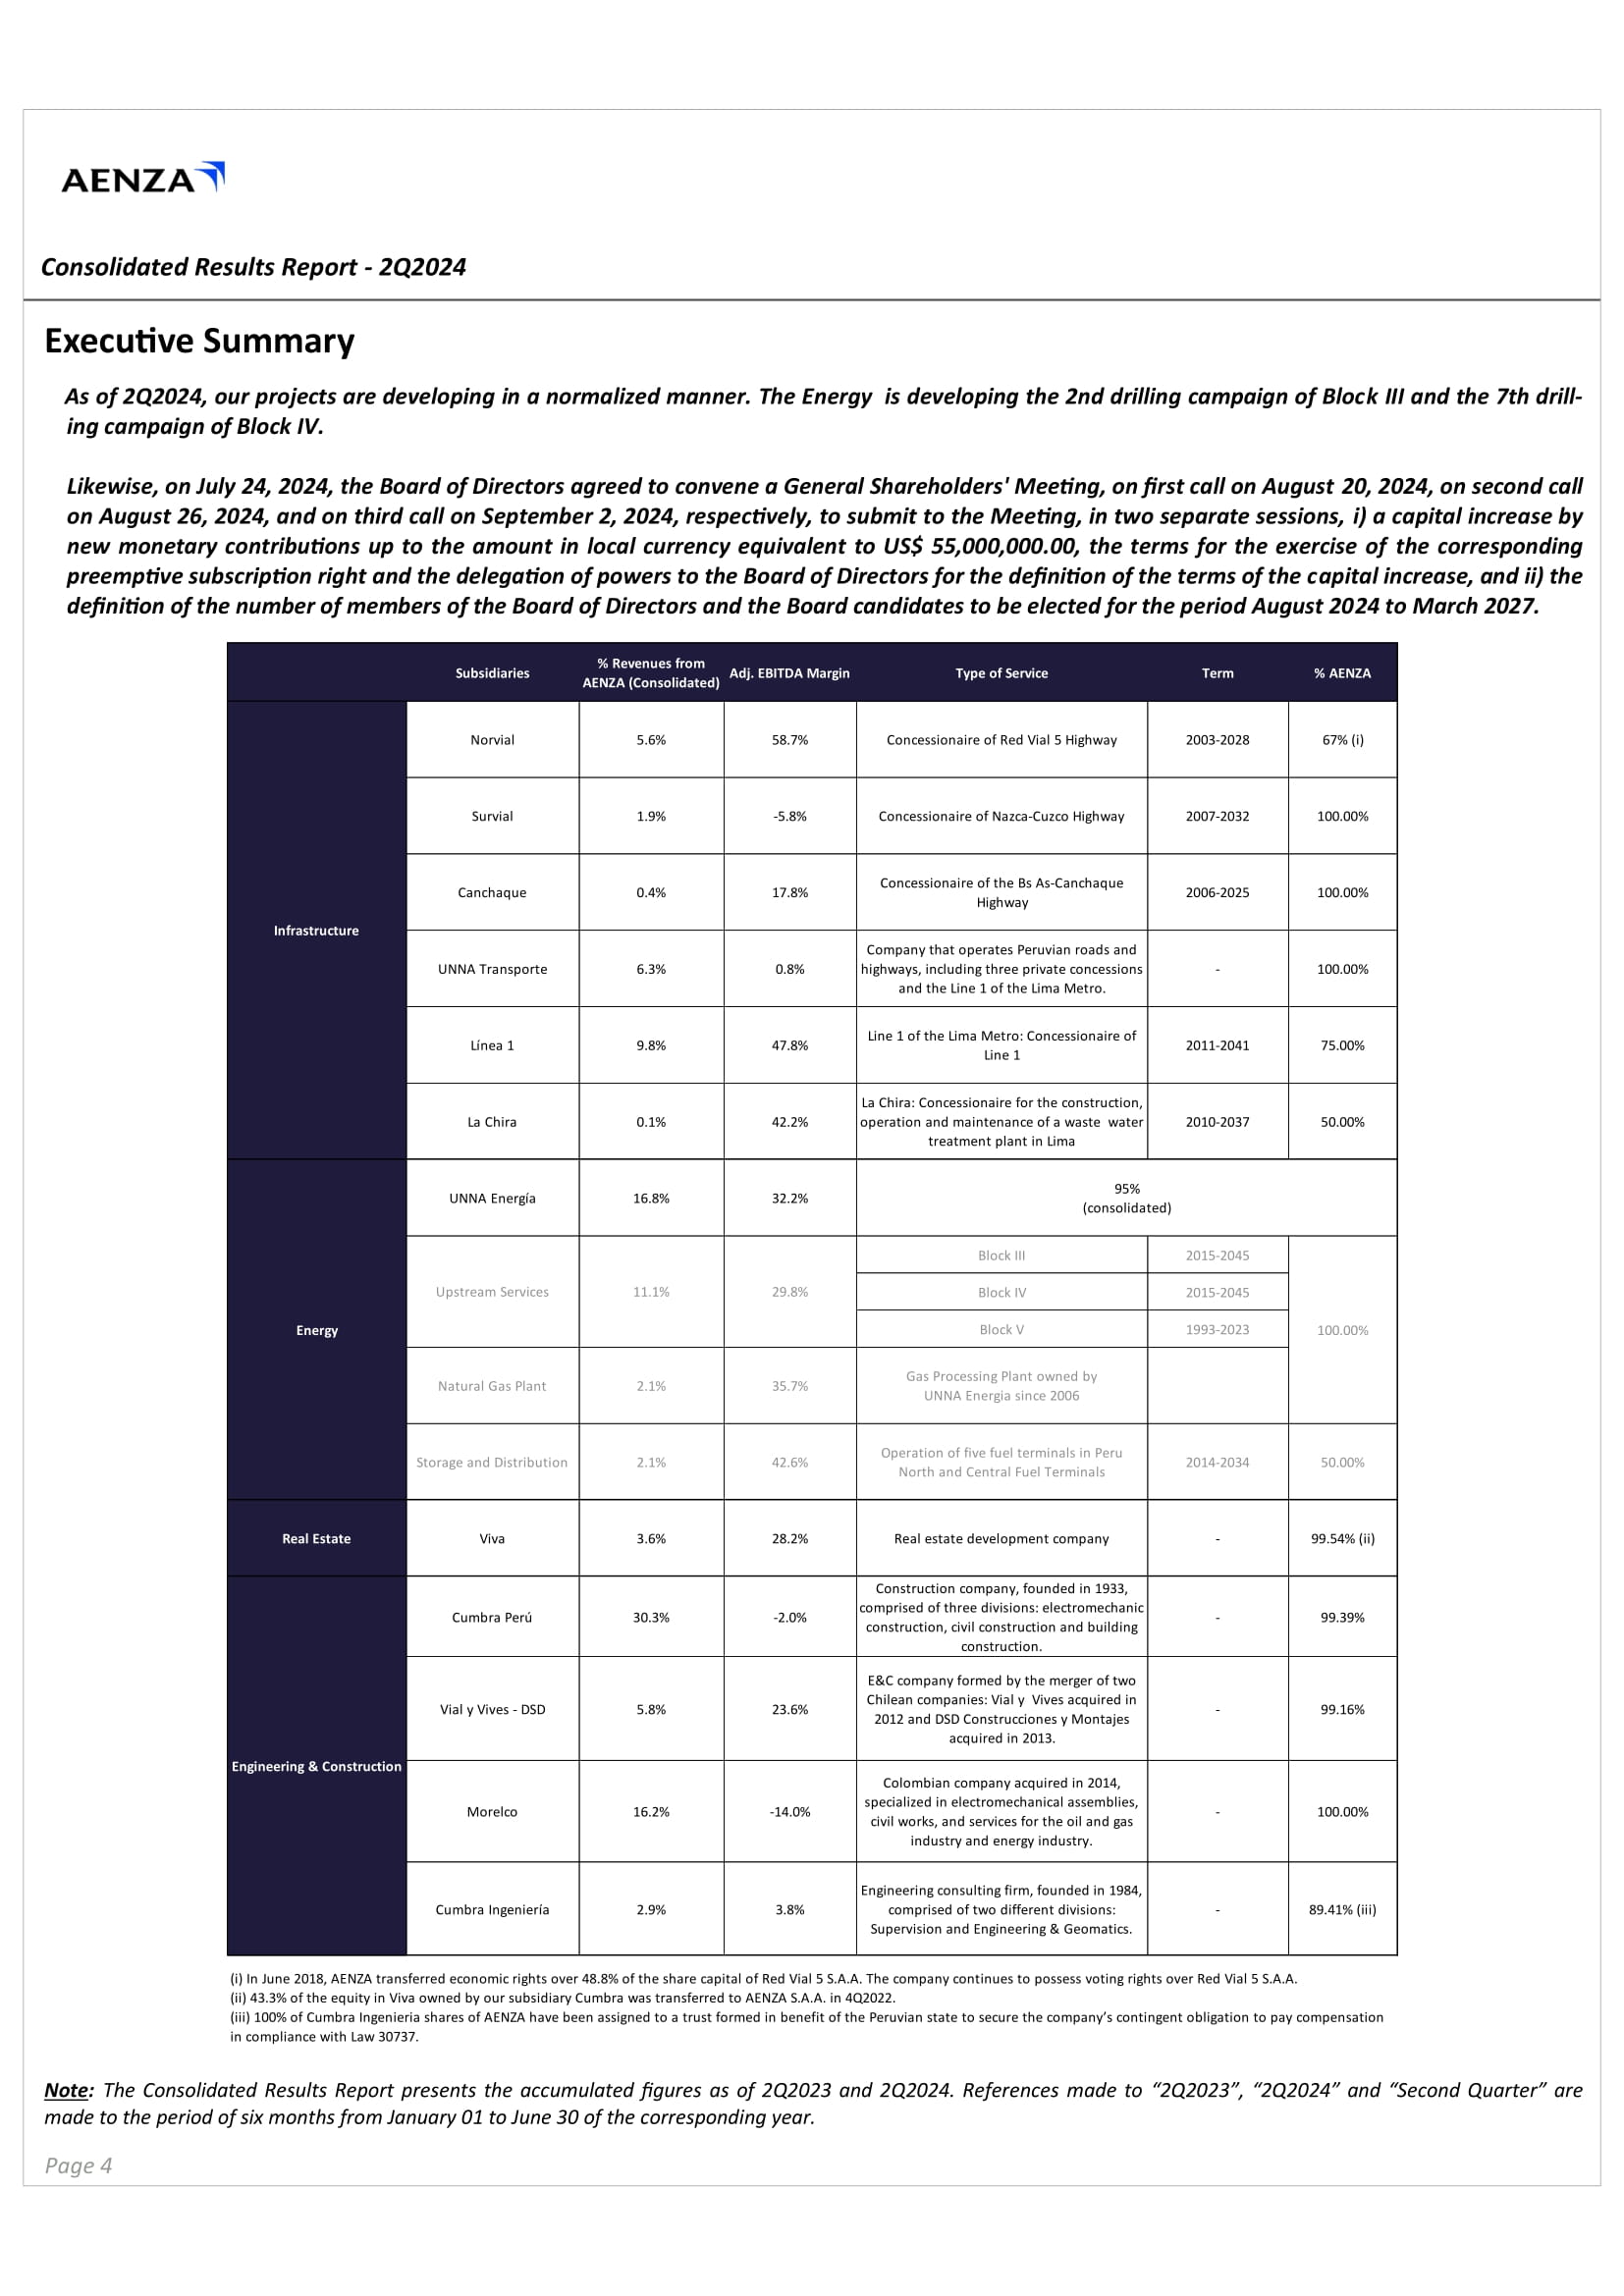
Consolidated Results Report - Third Quarter of 2014 Consolidated Results Report - 2Q2024 Executive Summary As of 2 Q 2024 , our projects are developing in a normalized manner . The Energy is developing the 2 nd drilling campaign of Block III and the 7 th drill - ing campaign of Block IV . Likewise, on July 24 , 2024 , the Board of Directors agreed to convene a General Shareholders' Meeting, on first call on August 20 , 2024 , on second call on August 26 , 2024 , and on third call on September 2 , 2024 , respectively, to submit to the Meeting, in two separate sessions, i) a capital increase by new monetary contributions up to the amount in local currency equivalent to US $ 55 , 000 , 000 . 00 , the terms for the exercise of the corresponding preemptive subscription right and the delegation of powers to the Board of Directors for the definition of the terms of the capital increase, and ii) the definition of the number of members of the Board of Directors and the Board candidates to be elected for the period August 2024 to March 2027 . Page 4 (i) In June 2018, AENZA transferred economic rights over 48.8% of the share capital of Red Vial 5 S.A.A. The company continues to possess voting rights over Red Vial 5 S.A.A. (ii) 43.3% of the equity in Viva owned by our subsidiary Cumbra was transferred to AENZA S.A.A. in 4Q2022. (iii) 100% of Cumbra Ingenieria shares of AENZA have been assigned to a trust formed in benefit of the Peruvian state to secure the company’s contingent obligation to pay compensation in compliance with Law 30737. Note : The Consolidated Results Report presents the accumulated figures as of 2Q2023 and 2Q2024. References made to “2Q2023”, “2Q2024” and “Second Quarter” are made to the period of six months from January 01 to June 30 of the corresponding year. % AENZA Term Type of Service Adj. EBITDA Margin % Revenues from AENZA (Consolidated) Subsidiaries 67 % ( i ) 2003 - 2028 Concessionaire of Red Vial 5 Highway 58.7% 5.6% Norvial Infrastructure 100.00% 2007 - 2032 Concessionaire of Nazca - Cuzco Highway - 5.8% 1.9% Survial 100.00% 2006 - 2025 Concessionaire of the Bs As - Canchaque Highway 17.8% 0.4% Canchaque 100.00% - Company that operates Peruvian roads and highways, including three private concessions and the Line 1 of the Lima Metro. 0.8% 6.3% UNNA Transporte 75.00% 2011 - 2041 Line 1 of the Lima Metro: Concessionaire of Line 1 47.8% 9.8% Línea 1 50.00% 2010 - 2037 La Chira: Concessionaire for the construction, operation and maintenance of a waste water treatment plant in Lima 42.2% 0.1% La Chira 95% (consolidated) 32.2% 16.8% UNNA Energía Energy 100.00% 2015 - 2045 B lo c k I I I 29.8% 11.1% Upstream Services 2015 - 2045 B lo c k IV 1993 - 2023 B lo c k V Gas Processing Plant owned by UNNA Energia since 2006 35.7% 2.1% Natural Gas Plant 50.00% 2014 - 2034 Operation of five fuel terminals in Peru North and Central Fuel Terminals 42.6% 2.1% Storage and Distribution 99. 5 4 % ( i i ) - Real estate development company 28.2% 3.6% Viva Real Estate 99.39% - Construction company, founded in 1933, comprised of three divisions: electromechanic construction, civil construction and building construction. - 2.0% 30.3% Cumbra Perú Engineering & Construction 99.16% - E&C company formed by the merger of two Chilean companies: Vial y Vives acquired in 2012 and DSD Construcciones y Montajes acquired in 2013. 23.6% 5.8% Vial y Vives - DSD 100.00% - Colombian company acquired in 2014, specialized in electromechanical assemblies, civil works, and services for the oil and gas industry and energy industry. - 14.0% 16.2% Morelco 89. 4 1 % ( i ii ) - Engineering consulting firm, founded in 1984, comprised of two different divisions: Supervision and Engineering & Geomatics. 3.8% 2.9% Cumbra Ingeniería
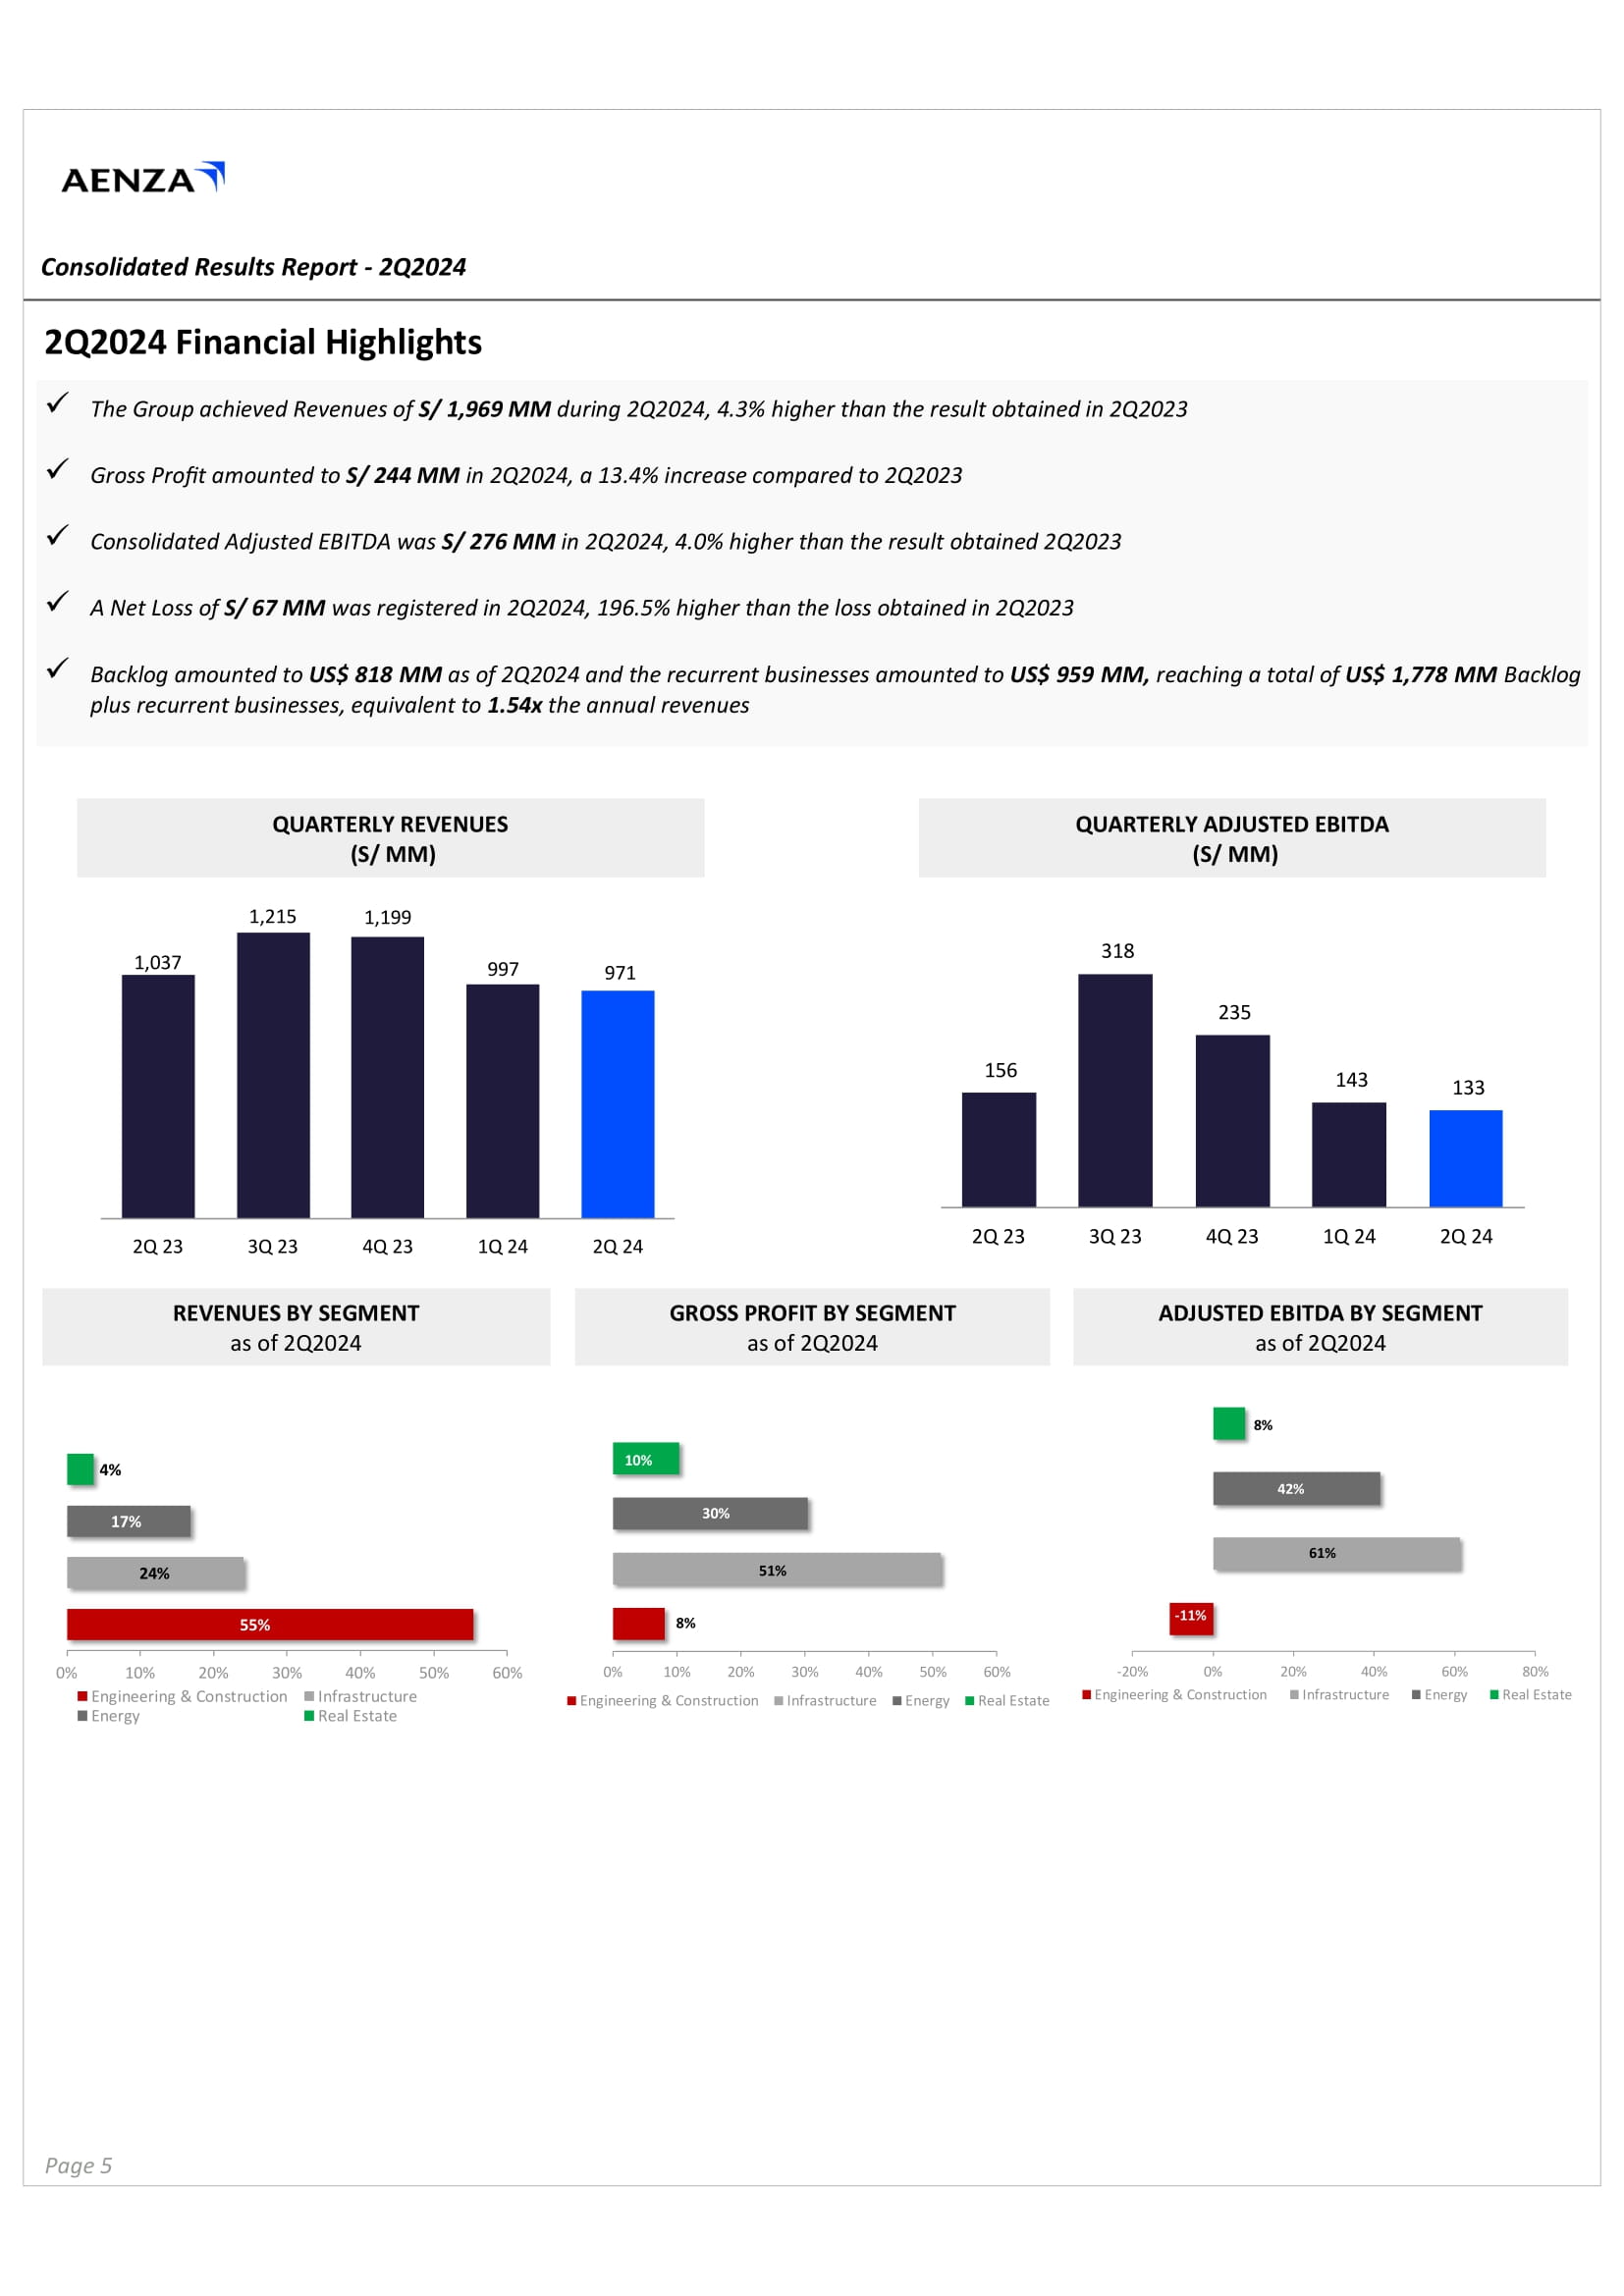
Consolidated Results Report - Third Quarter of 2014 Q U A RT E R LY REVE N UES (S/ MM) REVENUES BY SEGMENT as of 2Q2024 ADJUSTED EBITDA BY SEGMENT as of 2Q2024 GROSS PROFIT BY SEGMENT as of 2Q2024 QUARTERLY ADJUSTED EBITDA (S/ MM) Consolidated Results Report - 2Q2024 2Q2024 Financial Highlights x The Group achieved Revenues of S/ 1,969 MM during 2Q2024, 4.3% higher than the result obtained in 2Q2023 x Gross Profit amounted to S/ 244 MM in 2Q2024, a 13.4% increase compared to 2Q2023 x Consolidated Adjusted EBITDA was S/ 276 MM in 2Q2024, 4.0% higher than the result obtained 2Q2023 x A Net Loss of S/ 67 MM was registered in 2Q2024, 196.5% higher than the loss obtained in 2Q2023 x Backlog amounted to US$ 818 MM as of 2Q2024 and the recurrent businesses amounted to US$ 959 MM, reaching a total of US$ 1,778 MM Backlog plus recurrent businesses, equivalent to 1.54x the annual revenues 1 , 03 7 1,21 5 1 , 19 9 997 971 2 Q 2 3 3 Q 2 3 4 Q 2 3 1 Q 2 4 2 Q 2 4 156 318 235 143 133 2 Q 2 3 3 Q 2 3 4 Q 2 3 1 Q 2 4 2 Q 2 4 55% 24% 17% 4% 50% 60% 0 % 10 % 20 % 30% E n g i n ee r i n g & C on s t r u c t i o n Energy 40% I n f r as t r u c t u r e Real Estate 51% 30% 10% 8% 0% 10% 20% Engineering & Construction 30 % 40% Infrastructure 50% Energy 60% Real Estate - 11% 61% 42% 8% - 20% 0% Engineering & Construction 20 % 40% Infrastructure 60% E n e r g y 80% Real Estate Page 5
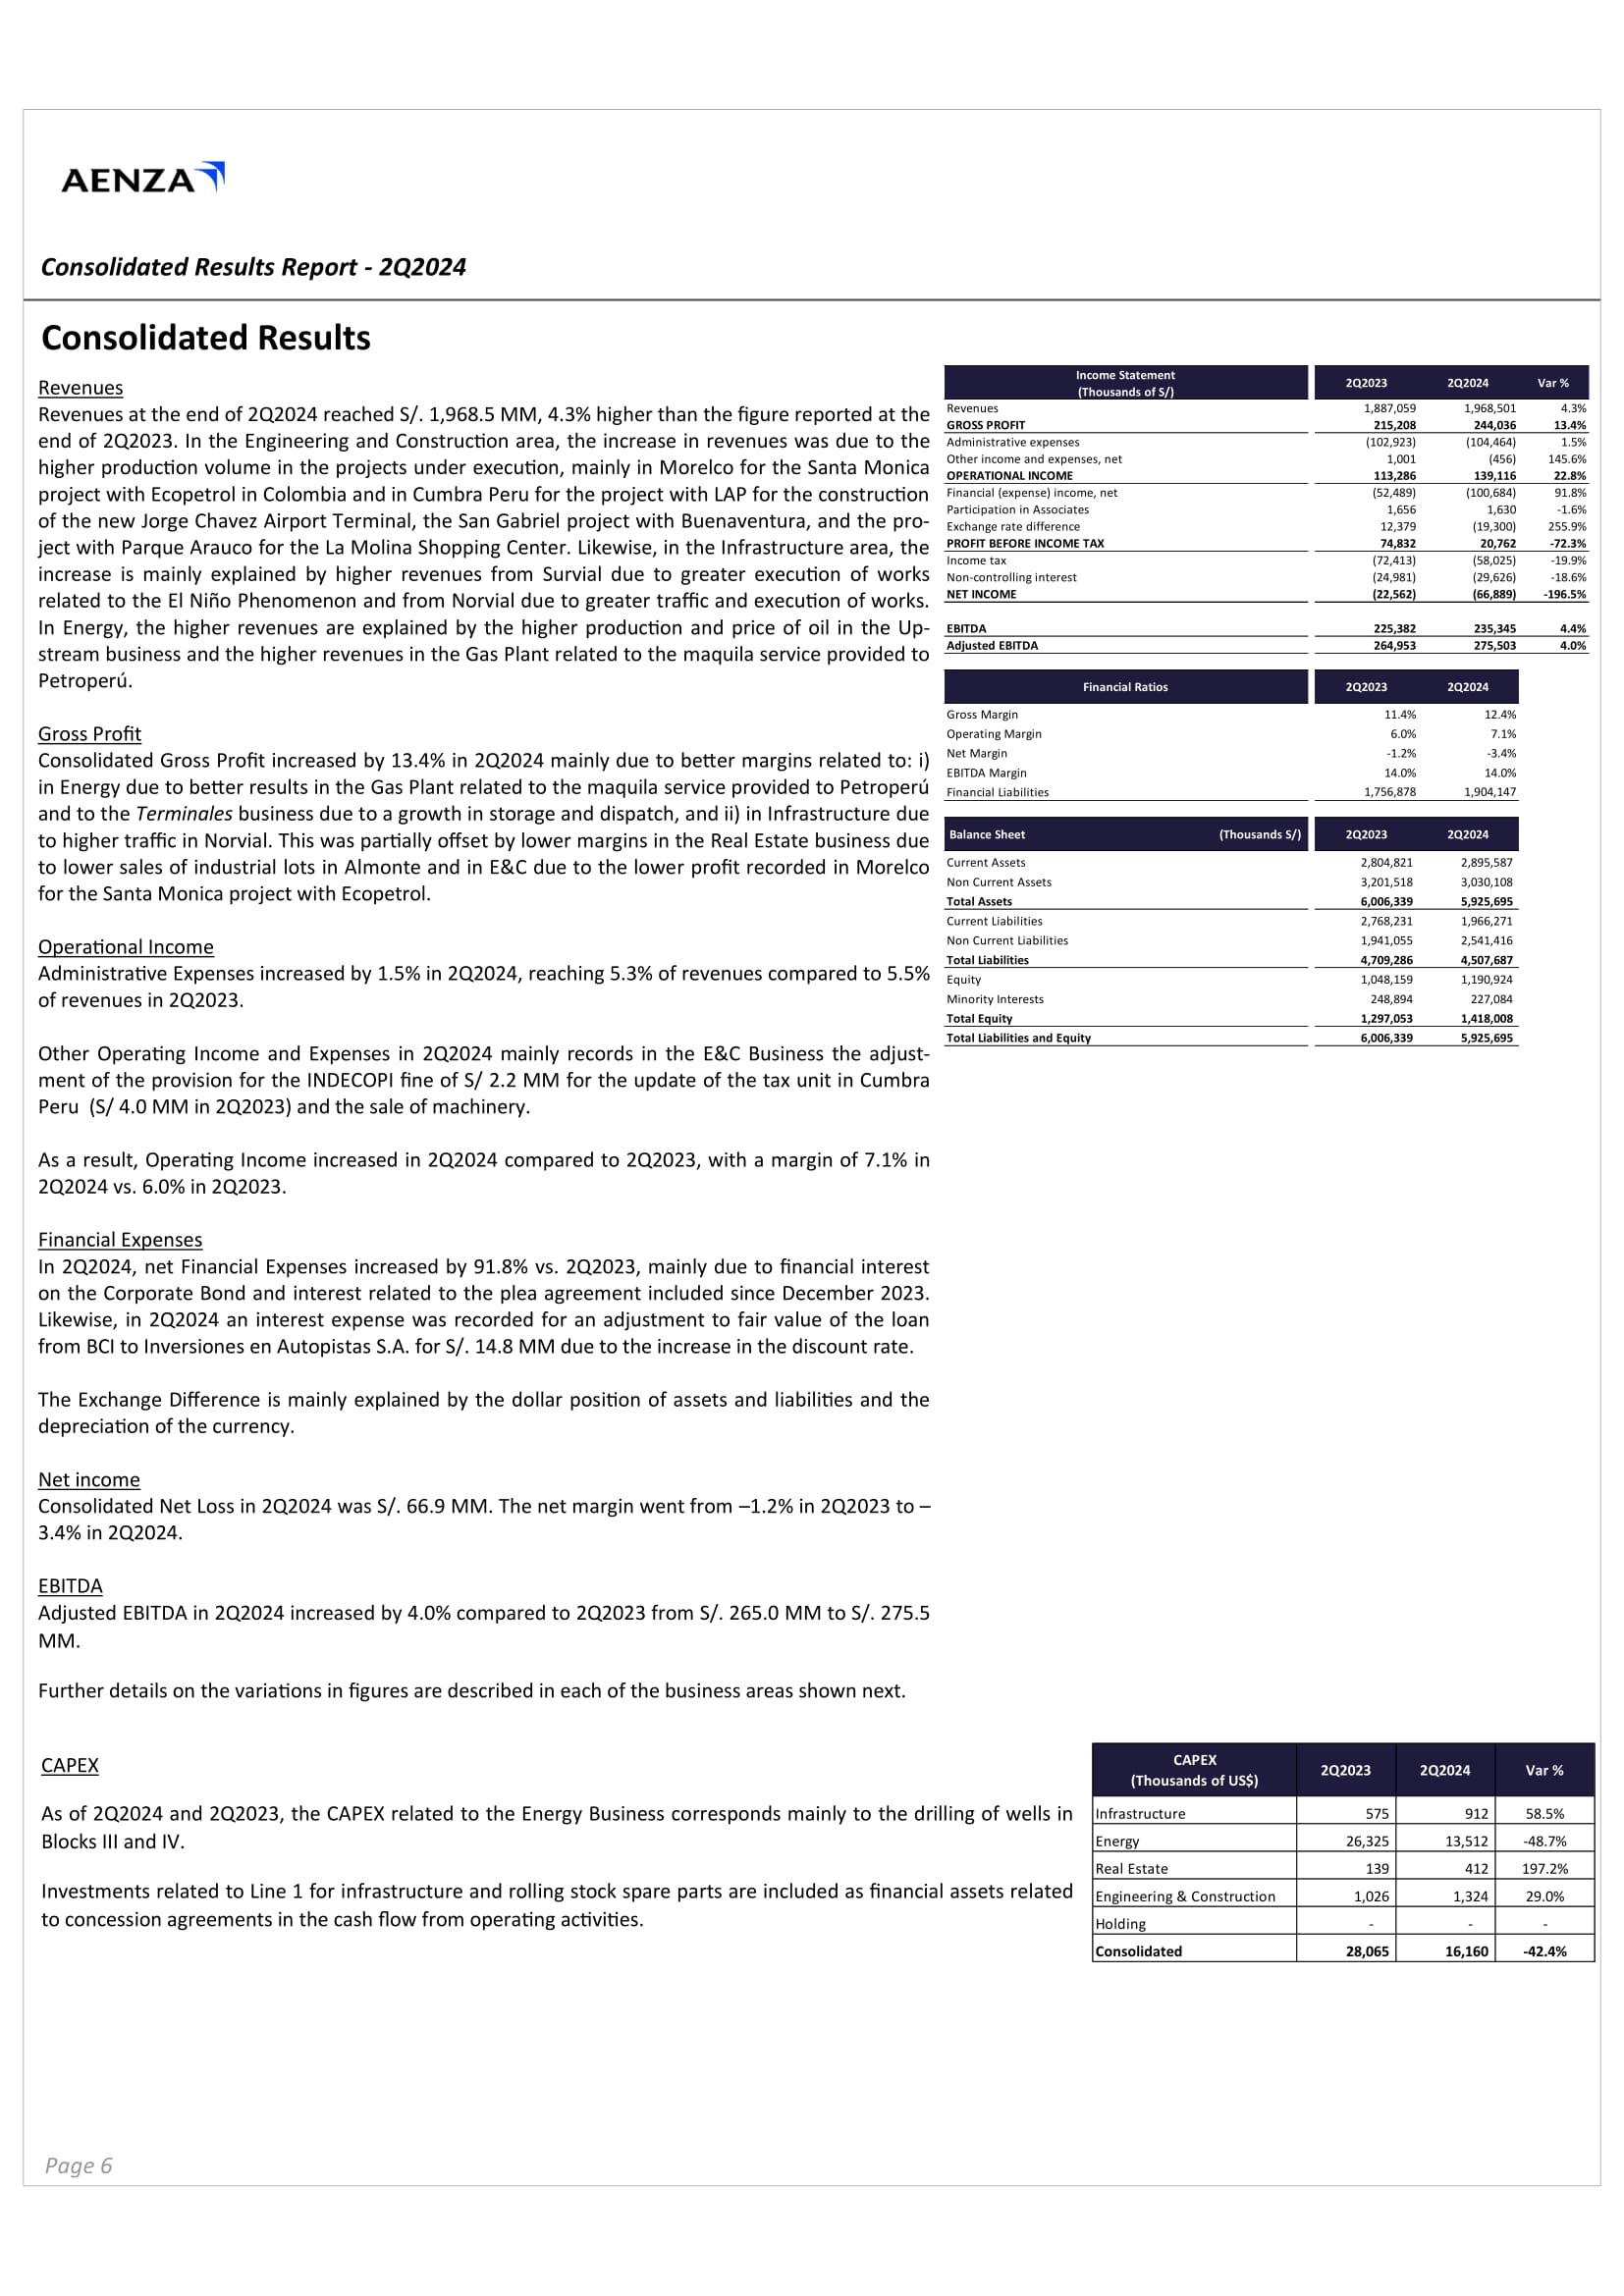
Consolidated Results Report - Third Quarter of 2014 Consolidated Results Report - 2Q2024 Consolidated Results Revenues Revenues at the end of 2 Q 2024 reached S/ . 1 , 968 . 5 MM, 4 . 3 % higher than the figure reported at the end of 2 Q 2023 . In the Engineering and Construction area, the increase in revenues was due to the higher production volume in the projects under execution, mainly in Morelco for the Santa Monica project with Ecopetrol in Colombia and in Cumbra Peru for the project with LAP for the construction of the new Jorge Chavez Airport Terminal, the San Gabriel project with Buenaventura, and the pro - ject with Parque Arauco for the La Molina Shopping Center . Likewise, in the Infrastructure area, the increase is mainly explained by higher revenues from Survial due to greater execution of works related to the El Niño Phenomenon and from Norvial due to greater traffic and execution of works . In Energy, the higher revenues are explained by the higher production and price of oil in the Up - stream business and the higher revenues in the Gas Plant related to the maquila service provided to Petroperú . Gross Profit Consolidated Gross Profit increased by 13.4% in 2Q2024 mainly due to better margins related to: i) in Energy due to better results in the Gas Plant related to the maquila service provided to Petroperú and to the Terminales business due to a growth in storage and dispatch, and ii) in Infrastructure due to higher traffic in Norvial . This was partially offset by lower margins in the Real Estate business due to lower sales of industrial lots in Almonte and in E&C due to the lower profit recorded in Morelco for the Santa Monica project with Ecopetrol . Operational Income Administrative Expenses increased by 1.5% in 2Q2024, reaching 5.3% of revenues compared to 5.5% of revenues in 2Q2023. Other Operating Income and Expenses in 2 Q 2024 mainly records in the E&C Business the adjust - ment of the provision for the INDECOPI fine of S/ 2 . 2 MM for the update of the tax unit in Cumbra Peru (S/ 4 . 0 MM in 2 Q 2023 ) and the sale of machinery . As a result, Operating Income increased in 2 Q 2024 compared to 2 Q 2023 , with a margin of 7 . 1 % in 2 Q 2024 vs . 6 . 0 % in 2 Q 2023 . Financial Expenses In 2 Q 2024 , net Financial Expenses increased by 91 . 8 % vs . 2 Q 2023 , mainly due to financial interest on the Corporate Bond and interest related to the plea agreement included since December 2023 . Likewise, in 2 Q 2024 an interest expense was recorded for an adjustment to fair value of the loan from BCI to Inversiones en Autopistas S . A . for S/ . 14 . 8 MM due to the increase in the discount rate . The Exchange Difference is mainly explained by the dollar position of assets and liabilities and the depreciation of the currency . Net income Consolidated Net Loss in 2Q2024 was S/. 66.9 MM. The net margin went from – 1.2% in 2Q2023 to – 3.4% in 2Q2024. EBITDA Adjusted EBITDA in 2Q2024 increased by 4.0% compared to 2Q2023 from S/. 265.0 MM to S/. 275.5 MM. Further details on the variations in figures are described in each of the business areas shown next. CAPEX As of 2Q2024 and 2Q2023, the CAPEX related to the Energy Business corresponds mainly to the drilling of wells in Blocks III and IV. Investments related to Line 1 for infrastructure and rolling stock spare parts are included as financial assets related to concession agreements in the cash flow from operating activities. Var % 2Q2024 2Q2023 CAPEX (Thousands of US$) 58.5% 912 575 Infrastructure - 48.7% 13,512 26,325 Energy 197.2% 412 139 Real Estate 29.0% 1,324 1,026 Engineering & Construction - - - Holding - 42.4% 16,160 28,065 Consolidated Page 6
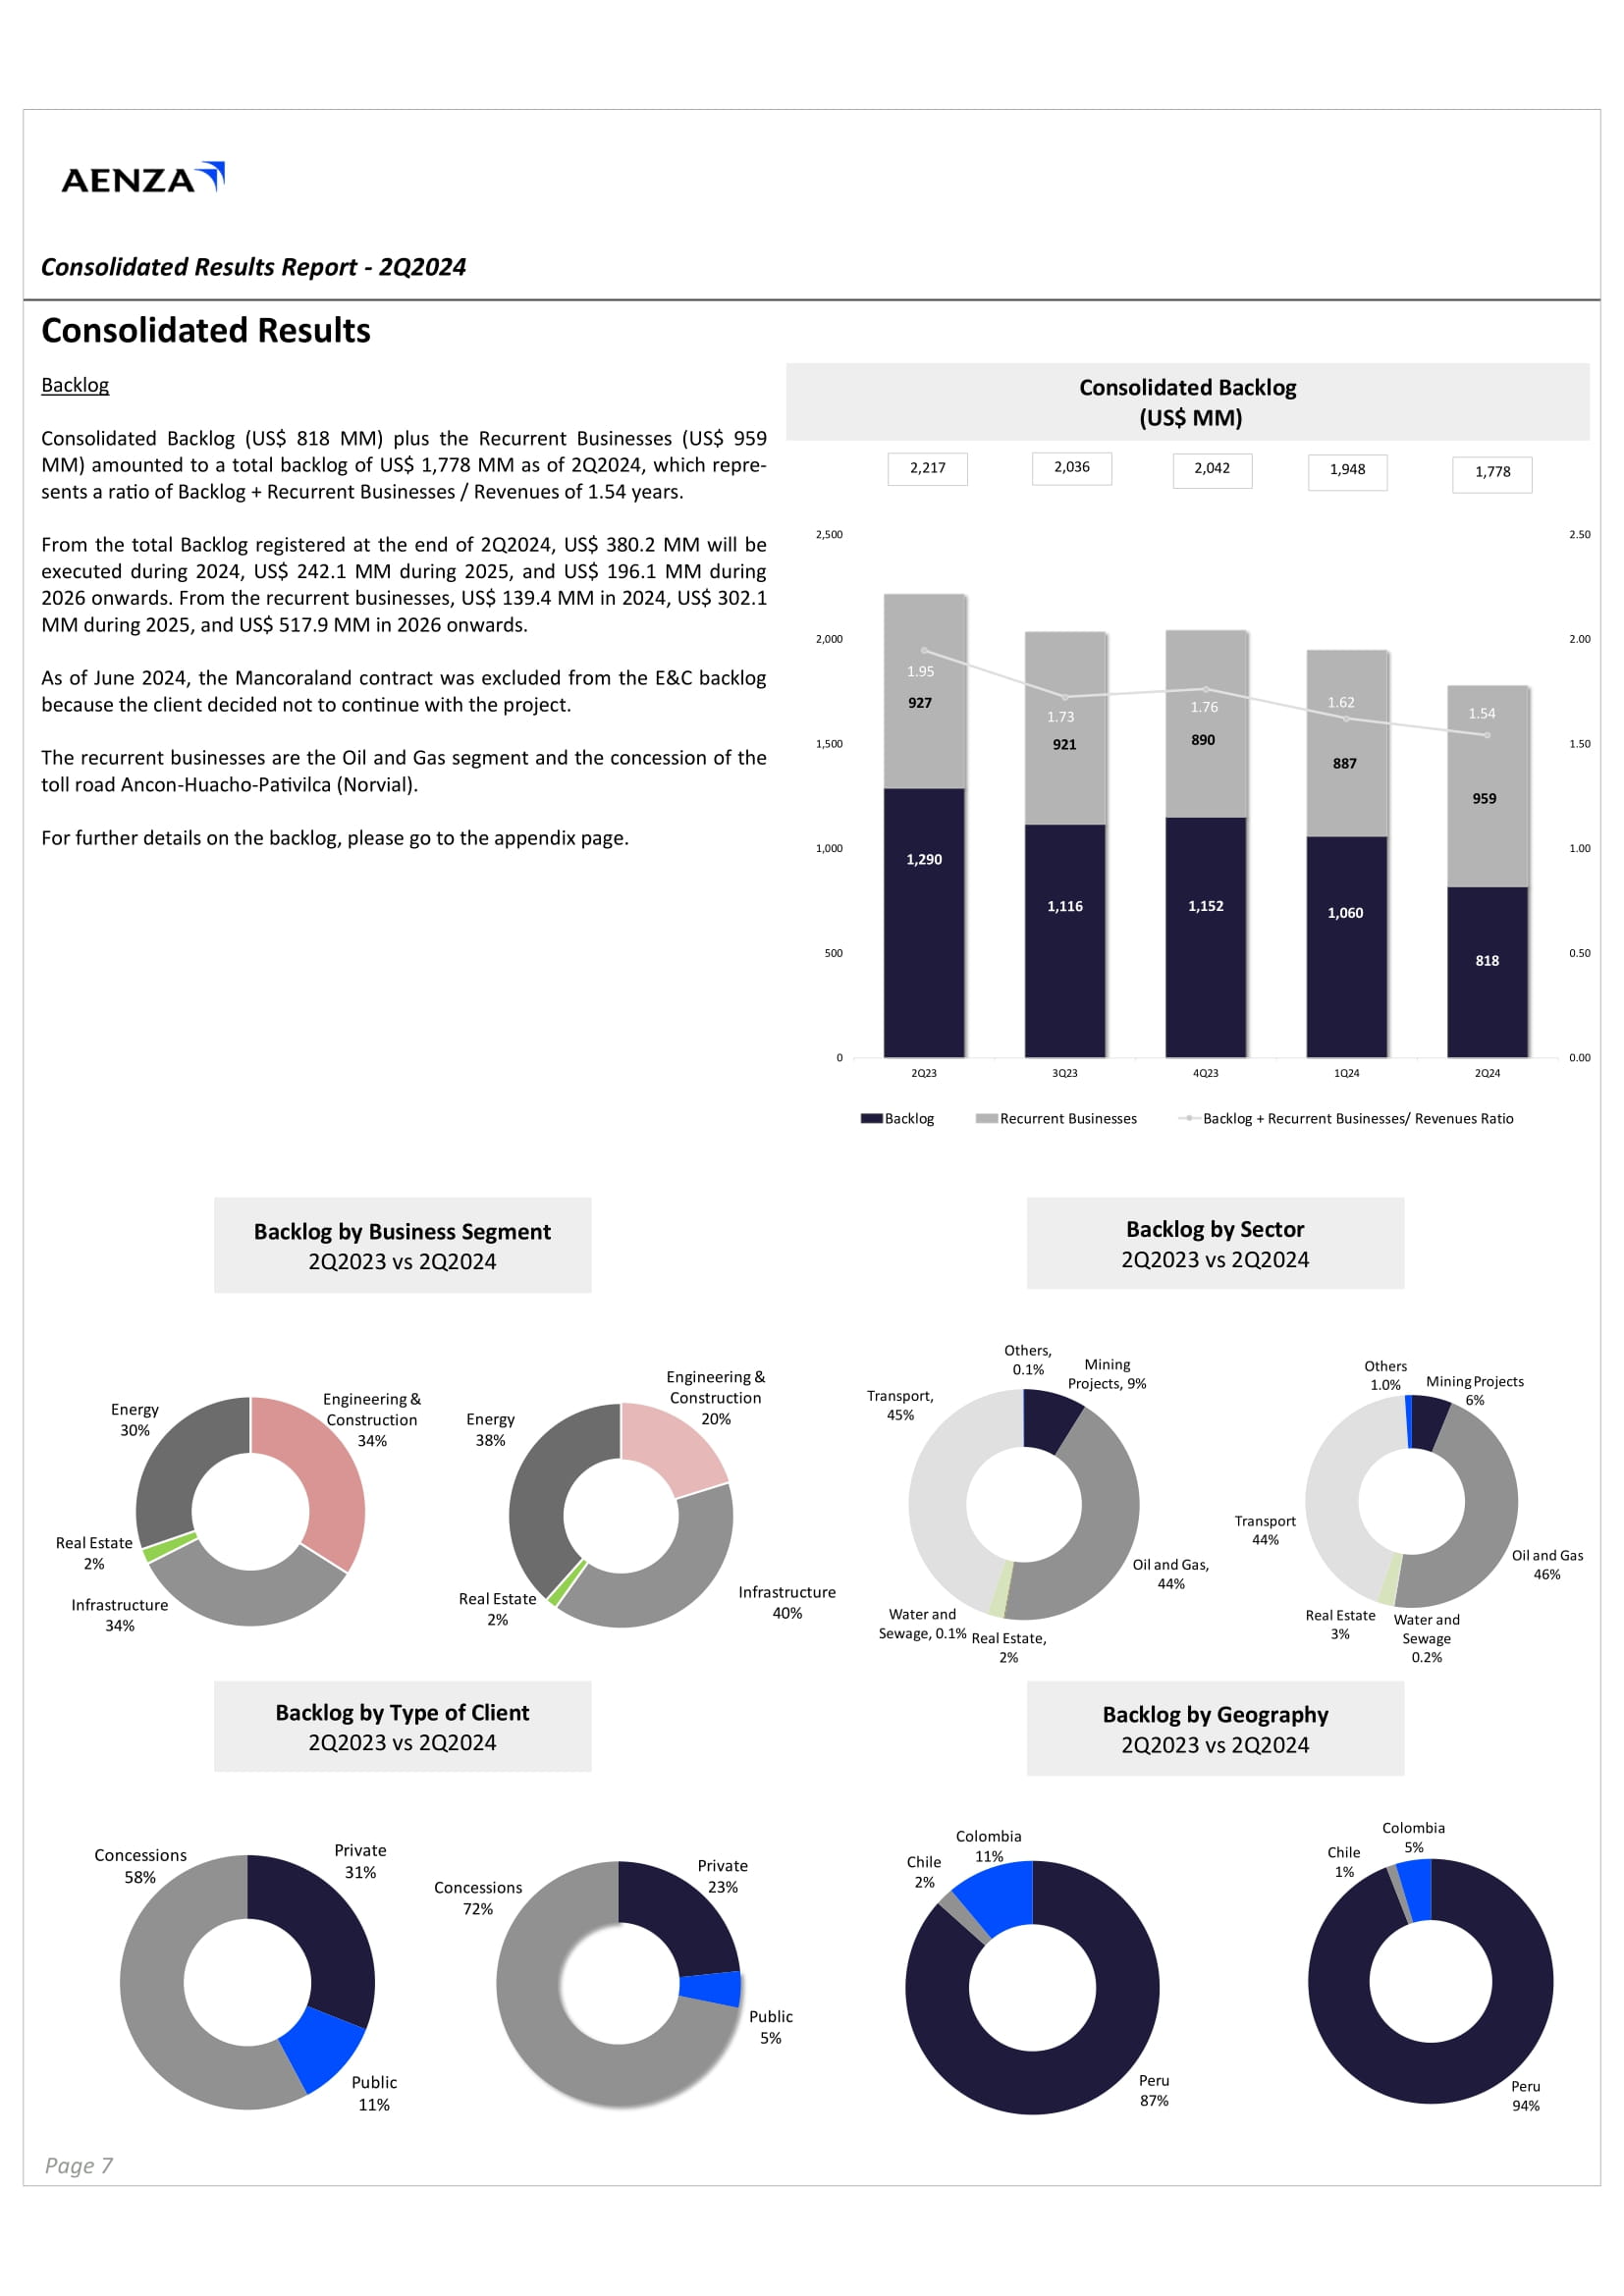
Consolidated Results Report - Third Quarter of 2014 Consolidated Results Report - 2Q2024 Consolidated Results Backlog Consolidated Backlog (US $ 818 MM) plus the Recurrent Businesses (US $ 959 MM) amounted to a total backlog of US $ 1 , 778 MM as of 2 Q 2024 , which repre - sents a ratio of Backlog + Recurrent Businesses / Revenues of 1 . 54 years . From the total Backlog registered at the end of 2Q2024, US$ 380.2 MM will be executed during 2024, US$ 242.1 MM during 2025, and US$ 196.1 MM during 2026 onwards. From the recurrent businesses, US$ 139.4 MM in 2024, US$ 302.1 MM during 2025, and US$ 517.9 MM in 2026 onwards. As of June 2024, the Mancoraland contract was excluded from the E&C backlog because the client decided not to continue with the project. The recurrent businesses are the Oil and Gas segment and the concession of the toll road Ancon - Huacho - Pativilca (Norvial). For further details on the backlog, please go to the appendix page. Consolidated Backlog (US$ MM) Backlog by Type of Client 2Q2023 vs 2Q2024 Backlog by Business Segment 2Q2023 vs 2Q2024 Backlog by Sector 2Q2023 vs 2Q2024 Backlog by Geography 2Q2023 vs 2Q2024 1,29 0 1,11 6 1,15 2 1,060 818 927 890 887 959 1.9 5 1.73 921 1.7 6 1.6 2 1.5 4 0 . 0 0 0 . 5 0 1 . 0 0 1 . 5 0 2 . 0 0 2 . 5 0 0 5 0 0 1 , 0 0 0 1 , 5 0 0 2 , 0 0 0 2 , 5 0 0 2 Q 2 3 3 Q 2 3 4 Q 2 3 1 Q 2 4 2 Q 2 4 B a c kl o g Recurrent Businesses Backlog + Recurrent Businesses/ Revenues Ratio 2,036 2,042 1,948 1,778 2,217 En g i n ee r i n g & Construction 20% I n fr a s t r u ct u r e 40% Re a l E s t a te 2% En e rg y 38% Mi n i n g Pr oj e c ts 6% Oi l a n d G a s 46% Sew a g e 0.2% Re a l E s t a te W a ter a n d 3% T r an s po r t 44% Ot h e r s 1.0% P r i v a te 23% P ub li c 5% C on c e ss i on s 72% P e r u 94% C h il e 1% Co l omb i a 5% E n g in ee r in g & Construction 34% Re a l E s t a te 2% I n fr a s t r u c t u r e 34% En e rg y 30% Mining Projects, 9% O i l a n d G a s , 44% W a ter a n d Sewage, 0.1% Real Estate, 2% T r a n s po r t, 45% Ot h e rs , 0.1% Pr i v a te 31% P ubli c 11% Co n c e ss io n s 58% P e r u 87% Page 7 Chil e 2% Colo m bi a 11%
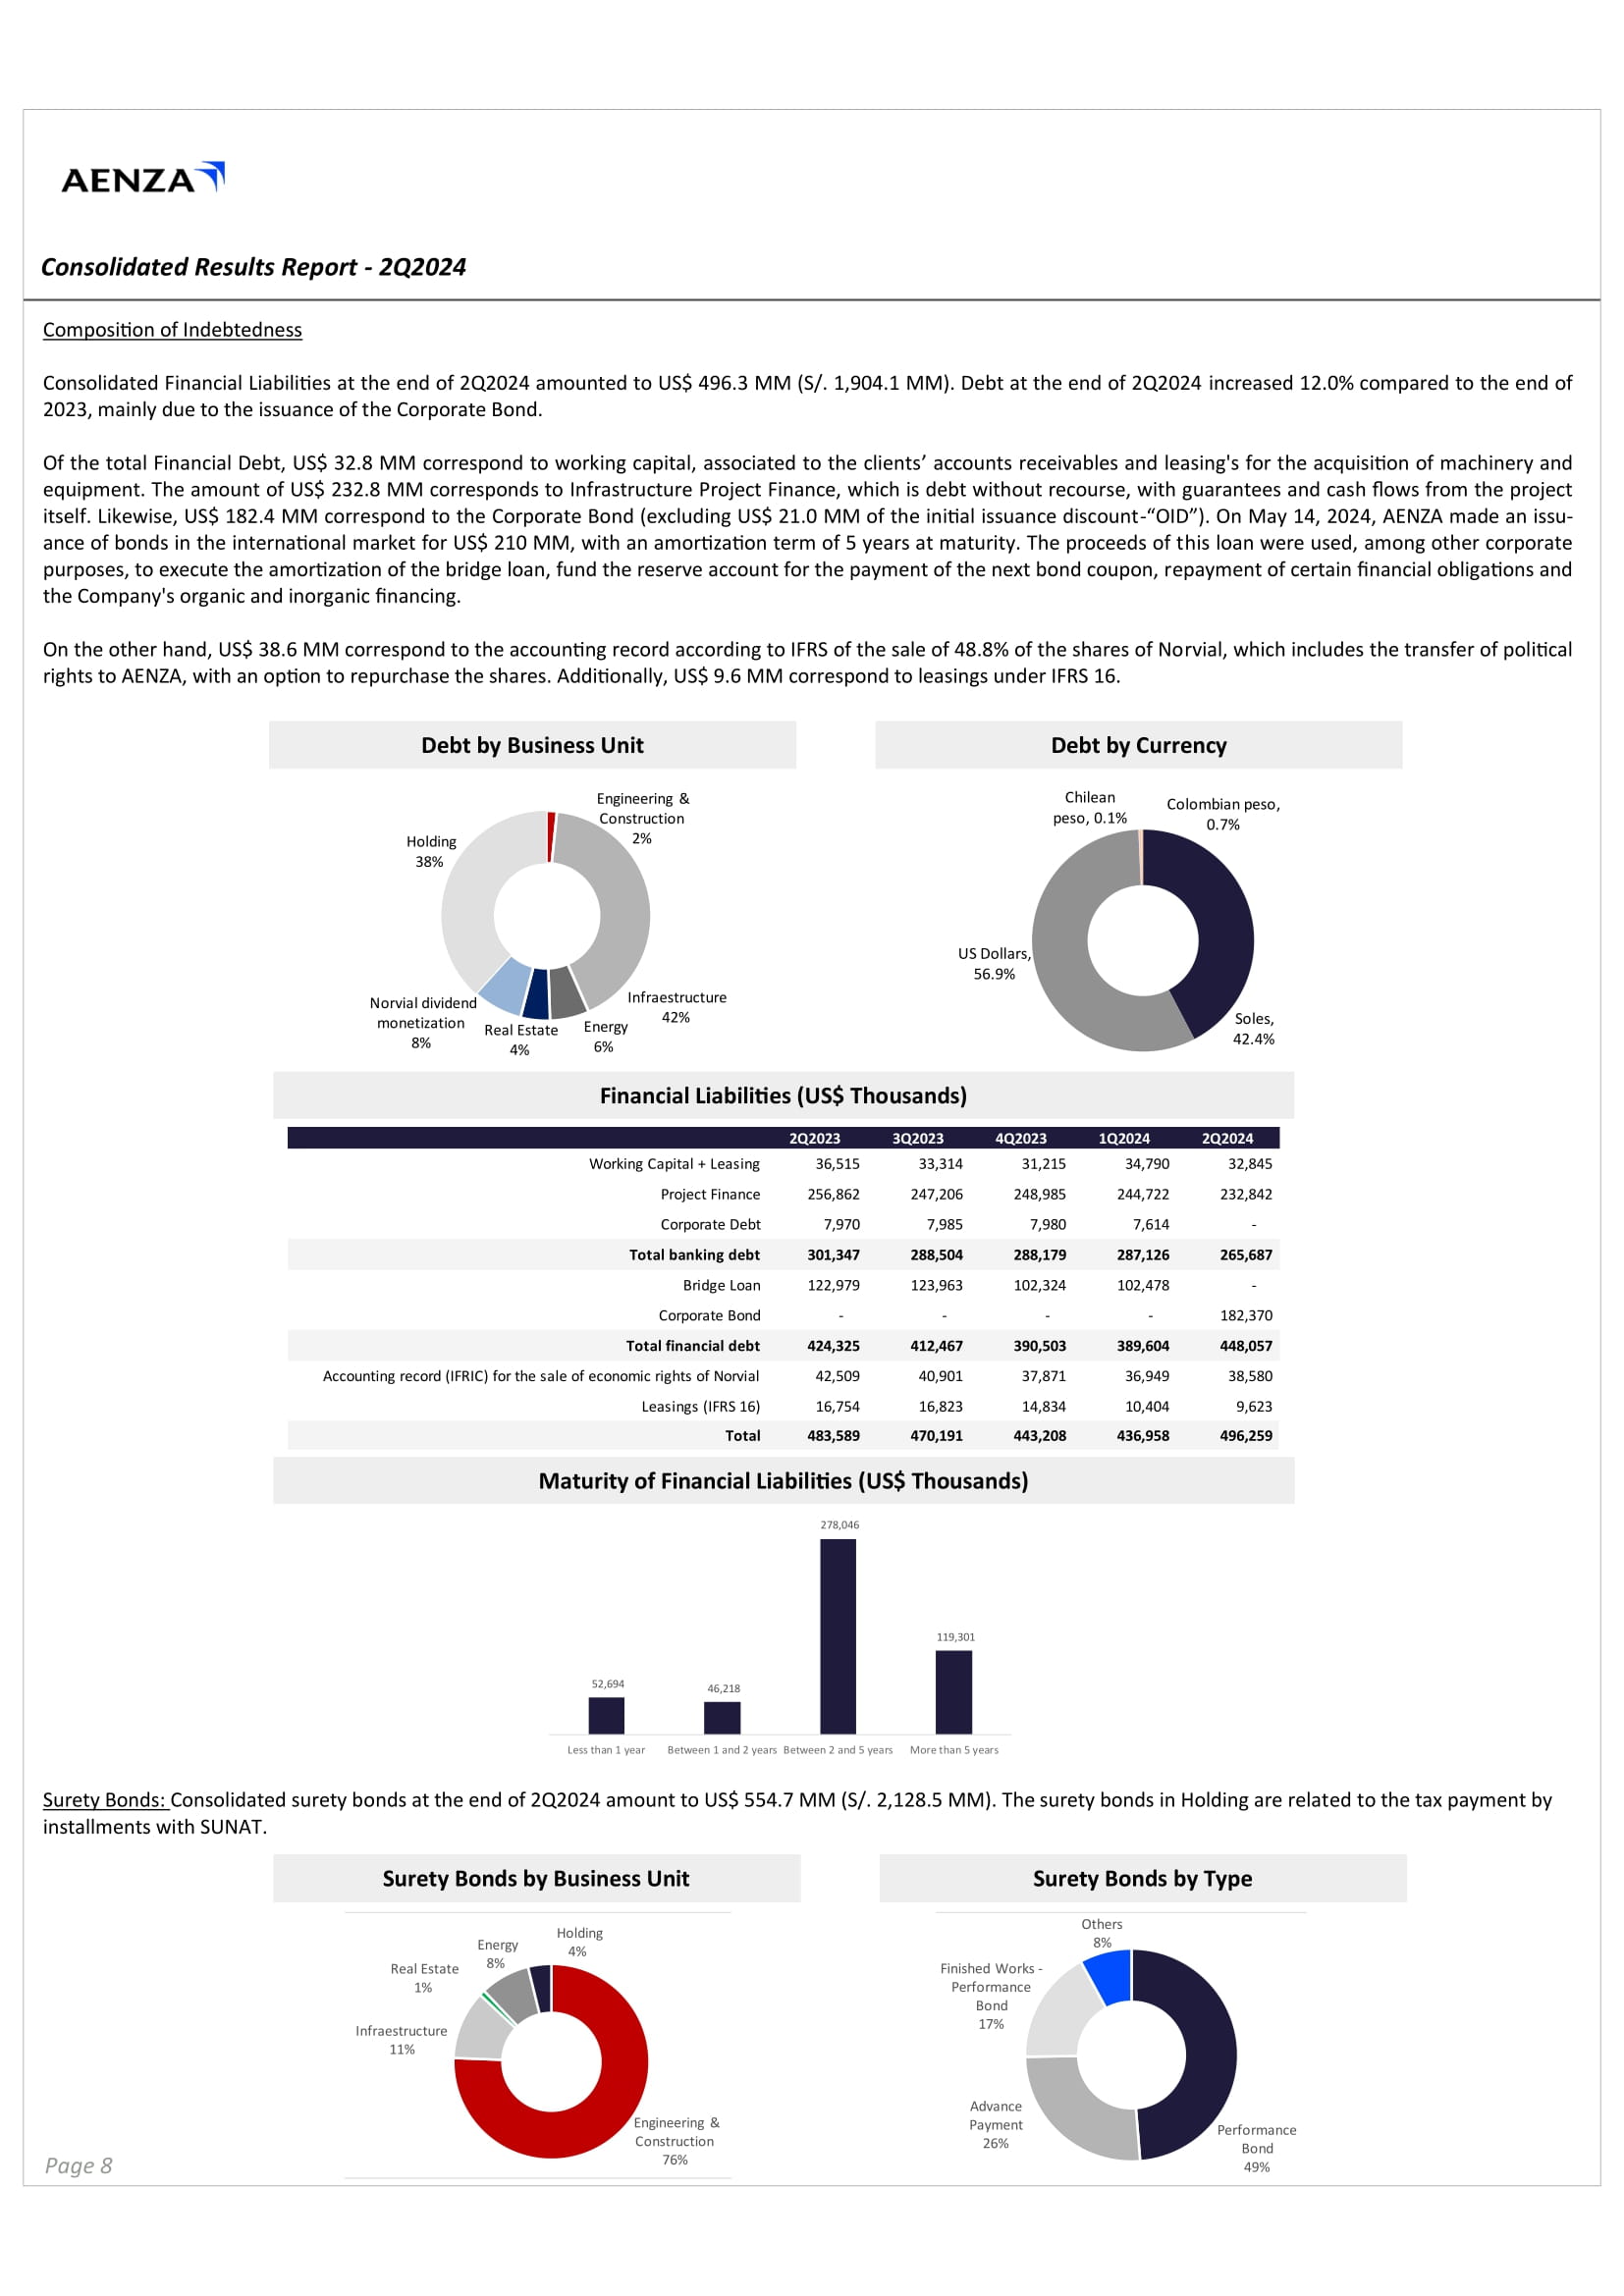
Consolidated Results Report - Third Quarter of 2014 P a ge 8 Consolidated Results Report - 2Q2024 Composition of Indebtedness Consolidated Financial Liabilities at the end of 2 Q 2024 amounted to US $ 496 . 3 MM (S/ . 1 , 904 . 1 MM) . Debt at the end of 2 Q 2024 increased 12 . 0 % compared to the end of 2023 , mainly due to the issuance of the Corporate Bond . Of the total Financial Debt, US $ 32 . 8 MM correspond to working capital, associated to the clients’ accounts receivables and leasing's for the acquisition of machinery and equipment . The amount of US $ 232 . 8 MM corresponds to Infrastructure Project Finance, which is debt without recourse, with guarantees and cash flows from the project itself . Likewise, US $ 182 . 4 MM correspond to the Corporate Bond (excluding US $ 21 . 0 MM of the initial issuance discount - “OID”) . On May 14 , 2024 , AENZA made an issu - ance of bonds in the international market for US $ 210 MM, with an amortization term of 5 years at maturity . The proceeds of this loan were used, among other corporate purposes, to execute the amortization of the bridge loan, fund the reserve account for the payment of the next bond coupon, repayment of certain financial obligations and the Company's organic and inorganic financing . On the other hand, US $ 38 . 6 MM correspond to the accounting record according to IFRS of the sale of 48 . 8 % of the shares of Norvial, which includes the transfer of political rights to AENZA, with an option to repurchase the shares . Additionally, US $ 9 . 6 MM correspond to leasings under IFRS 16 . Maturity of Financial Liabilities (US$ Thousands) Debt by Currency Debt by Business Unit Surety Bonds by Type Surety Bonds by Business Unit Surety Bonds: Consolidated surety bonds at the end of 2Q2024 amount to US$ 554.7 MM (S/. 2,128.5 MM). The surety bonds in Holding are related to the tax payment by installments with SUNAT. E ng i n ee r i n g & Construction 2% N o H o l d i n g 38% S o l es, 42 . 4 % U S D o ll a r s, 56.9% Chilean peso, 0.1% C o l o m b i a n p es o , 0.7% Financial Liabilities (US$ Thousands) 2Q2024 1Q2024 4Q2023 3Q2023 2Q2023 32,845 34,790 31,215 33,314 36,515 Working Capital + Leasing 232,842 244,722 248,985 247,206 256,862 P r o j e c t F i n a n c e - 7,614 7,980 7,985 7,970 C o r po r a t e De b t 265,687 287,126 288,179 288,504 301,347 Total banking debt - 102,478 102,324 123,963 122,979 B r i d g e L o a n 182,370 - - - - C o r po r a t e B on d 448,057 389,604 390,503 412,467 424,325 Total financial debt 38,580 36,949 37,871 40,901 42,509 Accounting record (IFRIC) for the sale of economic rights of Norvial 9,623 10,404 14,834 16,823 16,754 Leasings (IFRS 16) 496,259 436,958 443,208 470,191 483,589 Total 52 , 69 4 46 , 21 8 278,046 119,301 Less than 1 year B e t w een 1 a n d 2 y e a r s B e t w een 2 a n d 5 y e a r s M o r e t h a n 5 y e a r s Engineering & Construction 76% I n f r a es t r u c t u r e 11% R e a l E s t a te 1% E n e r g y 8% H o l d i n g 4% P e r fo rm a n c e Bond 49% Ad v a n c e P a ym e n t 26% F i n is h ed W o rk s - Performance Bond 17% Ot h e r s 8%
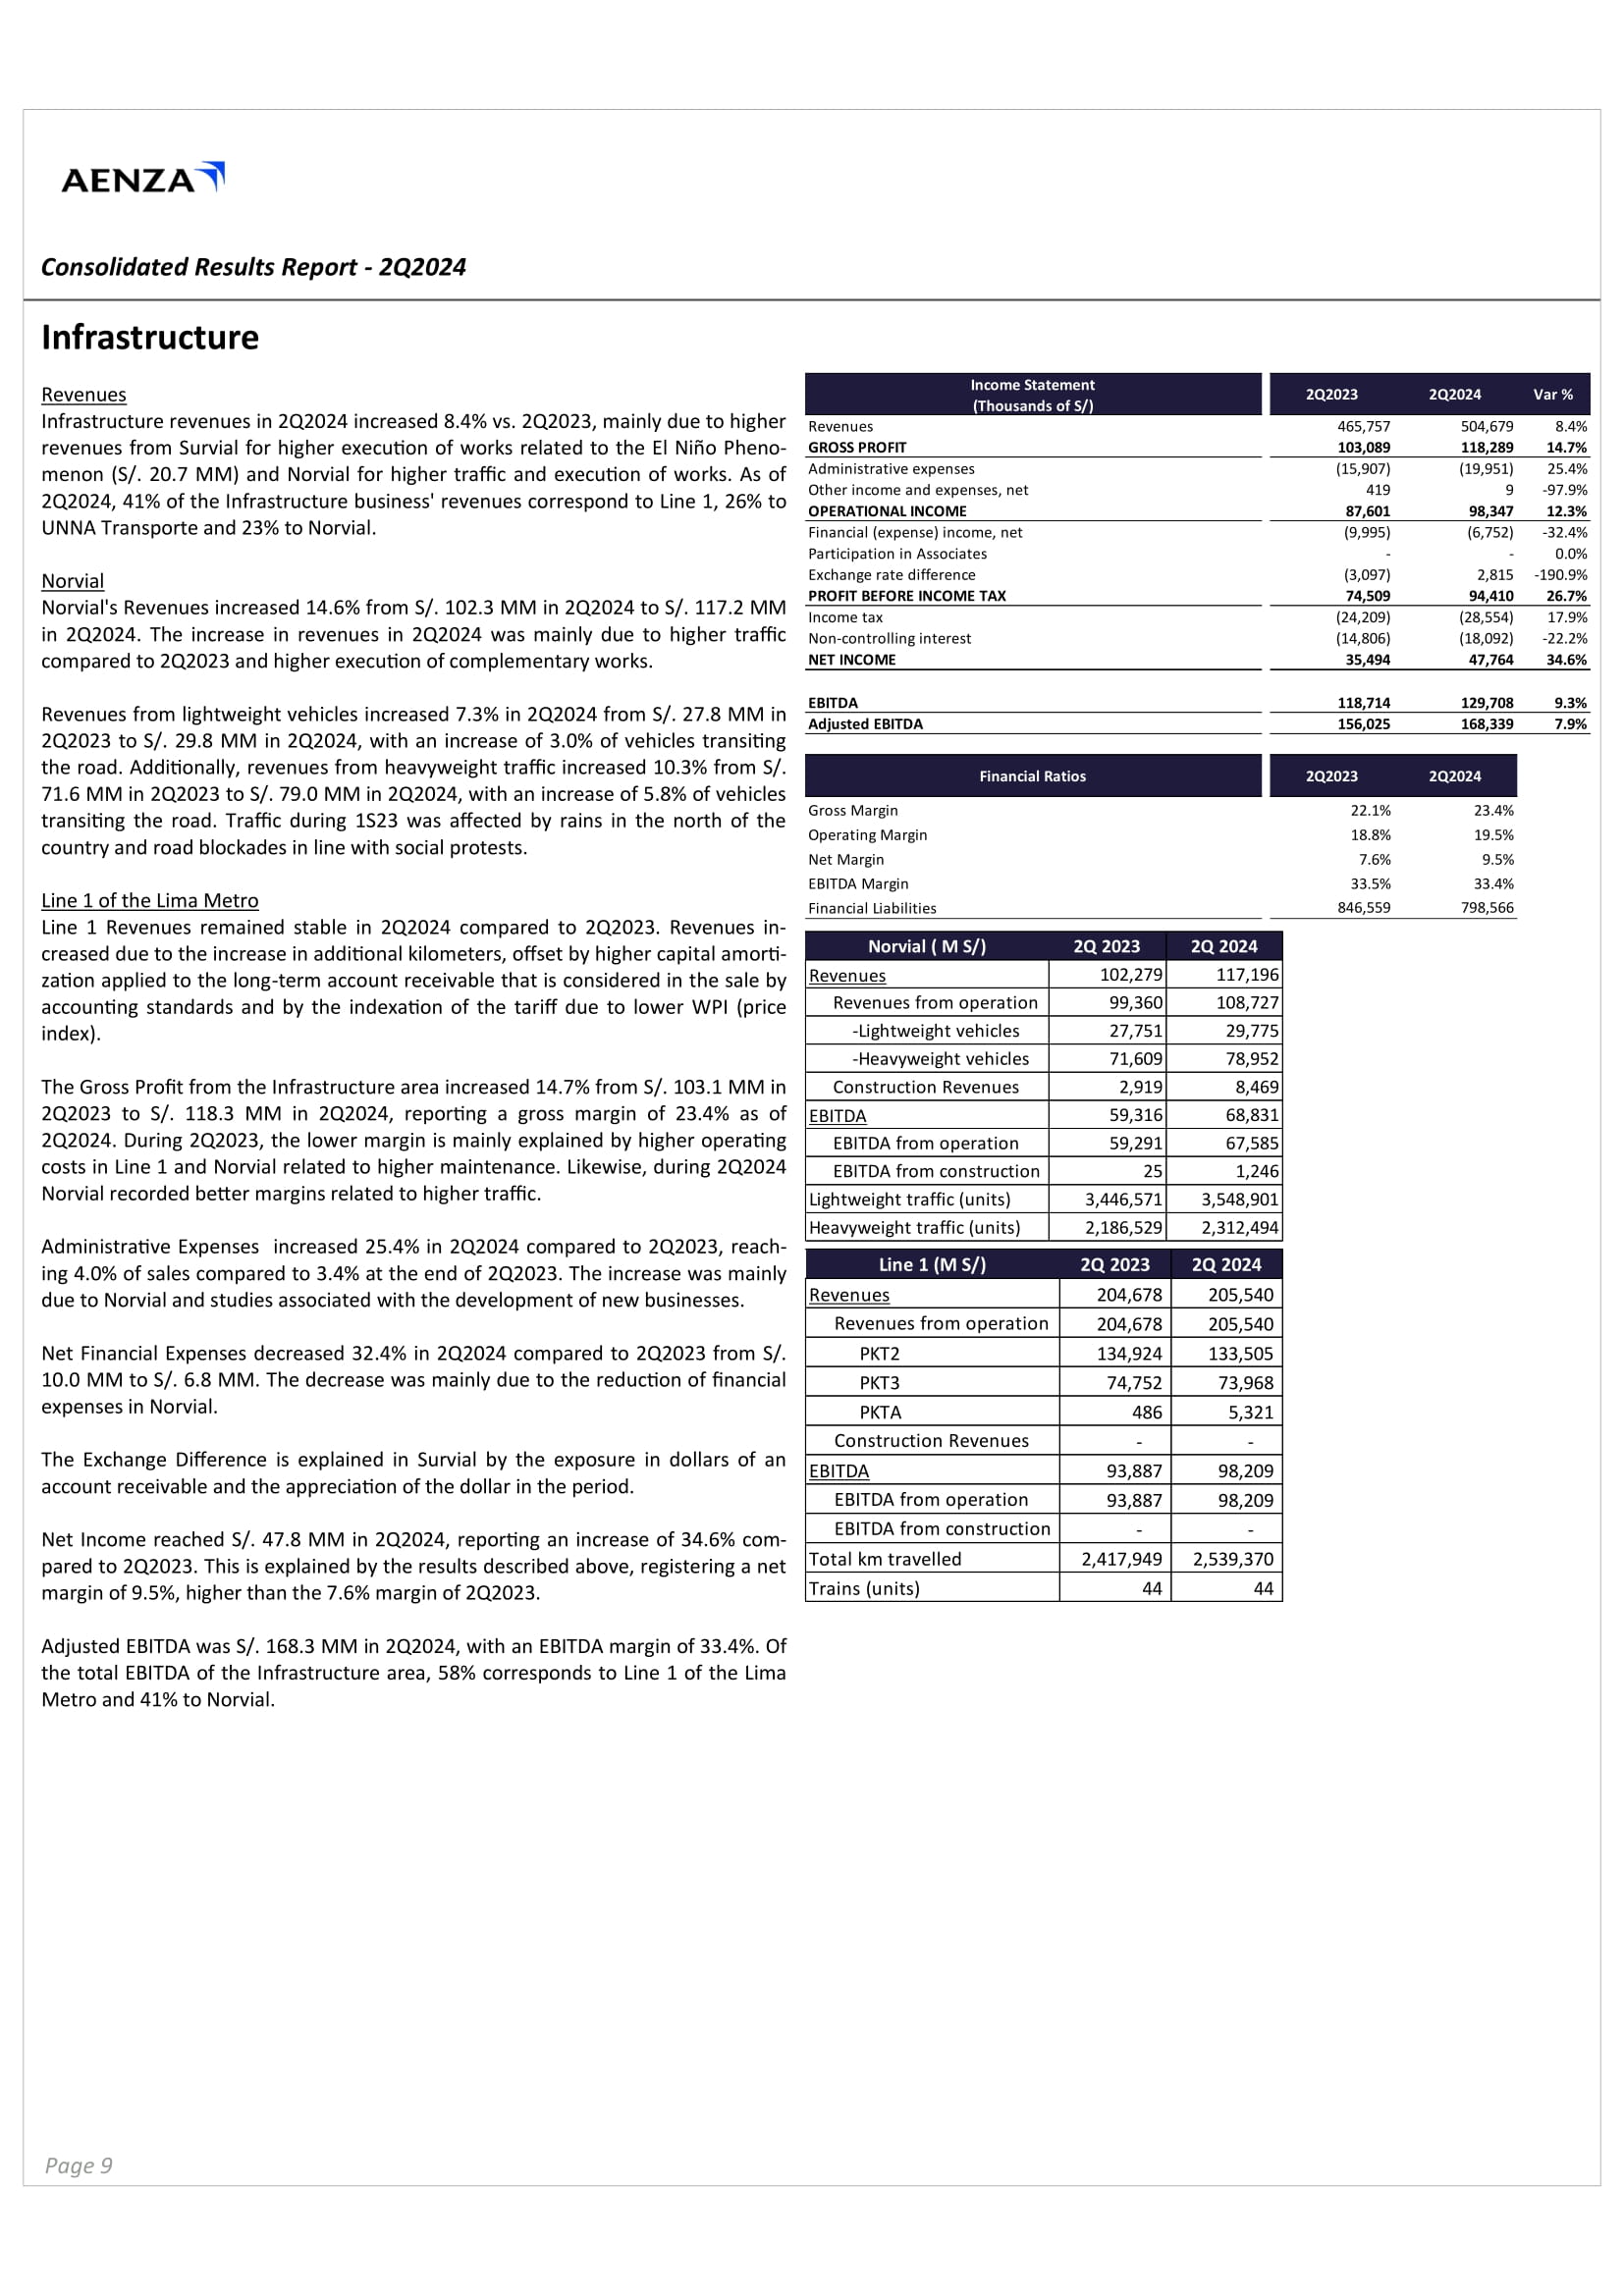
Consolidated Results Report - Third Quarter of 2014 Consolidated Results Report - 2Q2024 Infrastructure Revenues Infrastructure revenues in 2Q2024 increased 8.4% vs. 2Q2023, mainly due to higher menon (S/ . 20 . 7 MM) and Norvial for higher traffic and execution of works . As of 2 Q 2024 , 41 % of the Infrastructure business' revenues correspond to Line 1 , 26 % to UNNA Transporte and 23 % to Norvial . Norvi a l in 2Q2024. The increase in revenues in 2Q2024 was mainly due to higher traffic compared to 2Q2023 and higher execution of complementary works. 2 Q 2023 to S/ . 29 . 8 MM in 2 Q 2024 , with an increase of 3 . 0 % of vehicles transiting the road . Additionally, revenues from heavyweight traffic increased 10 . 3 % from S/ . 71 . 6 MM in 2 Q 2023 to S/ . 79 . 0 MM in 2 Q 2024 , with an increase of 5 . 8 % of vehicles transiting the road . Traffic during 1 S 23 was affected by rains in the north of the country and road blockades in line with social protests . Line 1 of the Lima Metro Line 1 Revenues remained stable in 2 Q 2024 compared to 2 Q 2023 . Revenues in - creased due to the increase in additional kilometers, offset by higher capital amorti - zation applied to the long - term account receivable that is considered in the sale by accounting standards and by the indexation of the tariff due to lower WPI (price index) . The Gross Profit from the Infrastructure area increased 14 . 7 % from S/ . 103 . 1 MM in 2 Q 2023 to S/ . 118 . 3 MM in 2 Q 2024 , reporting a gross margin of 23 . 4 % as of 2 Q 2024 . During 2 Q 2023 , the lower margin is mainly explained by higher operating costs in Line 1 and Norvial related to higher maintenance . Likewise, during 2 Q 2024 Norvial recorded better margins related to higher traffic . Administrative Expenses increased 25 . 4 % in 2 Q 2024 compared to 2 Q 2023 , reach - ing 4 . 0 % of sales compared to 3 . 4 % at the end of 2 Q 2023 . The increase was mainly due to Norvial and studies associated with the development of new businesses . Net Financial Expenses decreased 32.4% in 2Q2024 compared to 2Q2023 from S/. 10.0 MM to S/. 6.8 MM. The decrease was mainly due to the reduction of financial expenses in Norvial. The Exchange Difference is explained in Survial by the exposure in dollars of an account receivable and the appreciation of the dollar in the period. Net Income reached S/ . 47 . 8 MM in 2 Q 2024 , reporting an increase of 34 . 6 % com - pared to 2 Q 2023 . This is explained by the results described above, registering a net margin of 9 . 5 % , higher than the 7 . 6 % margin of 2 Q 2023 . Adjusted EBITDA was S/ . 168 . 3 MM in 2 Q 2024 , with an EBITDA margin of 33 . 4 % . Of the total EBITDA of the Infrastructure area, 58 % corresponds to Line 1 of the Lima Metro and 41 % to Norvial . I n c o m e S tate m e n t ( T hou sa nd s o f S / ) 2 Q 202 3 2 Q 202 4 Var Revenues 465,757 504,679 revenues from Survial for higher execution of works related to the El Niño Pheno - GROSS PROFIT 103,089 1 18 Administrative expenses Other income and expenses, net (15,907) 419 O PE R A T I O N A L I N CO M E 87,6 0 1 ( 9 , Financial (expense) income, net Participation in Associates Exchange rate difference Norvial's Revenues increased 14.6% from S/. 102.3 MM in 2Q2024 to S/. 117.2 MM PROFIT BEFORE INCOME TAX Income tax Non - controlling interest NET INCOME Revenues from lightweight vehicles increased 7.3% in 2Q2024 from S/. 27.8 MM in EBITDA Adjusted EBITDA F i n an Gross Margin O p er a t in g M a r g i n Net Margin EBITDA Fi 2Q 2024 Norvial ( M S/) 2Q 2023 117,196 102,279 Revenues 108,727 99,360 Revenues from operation 29,775 27,751 - Lightweight vehicles 78,952 71,609 - Heavyweight vehicles 8,469 2,919 Construction Revenues 68,831 59,316 EBITDA 67,585 59,291 EBITDA from operation 1,246 25 EBITDA from construction 3,548,901 3,446,571 Lightweight traffic (units) 2,312,494 2,186,529 Heavyweight traffic (units) 2Q 2024 Line 1 (M S/) 2Q 2023 205,540 204,678 Revenues 205,540 204,678 Revenues from operation 133,505 134,924 PKT2 73,968 74,752 PKT3 5,321 486 PKTA - - Construction Revenues 98,209 93,887 EBITDA 98,209 93,887 EBITDA from operation - - EBITDA from construction 2,539,370 2,417,949 Total km travelled 44 44 Trains (units) Page 9
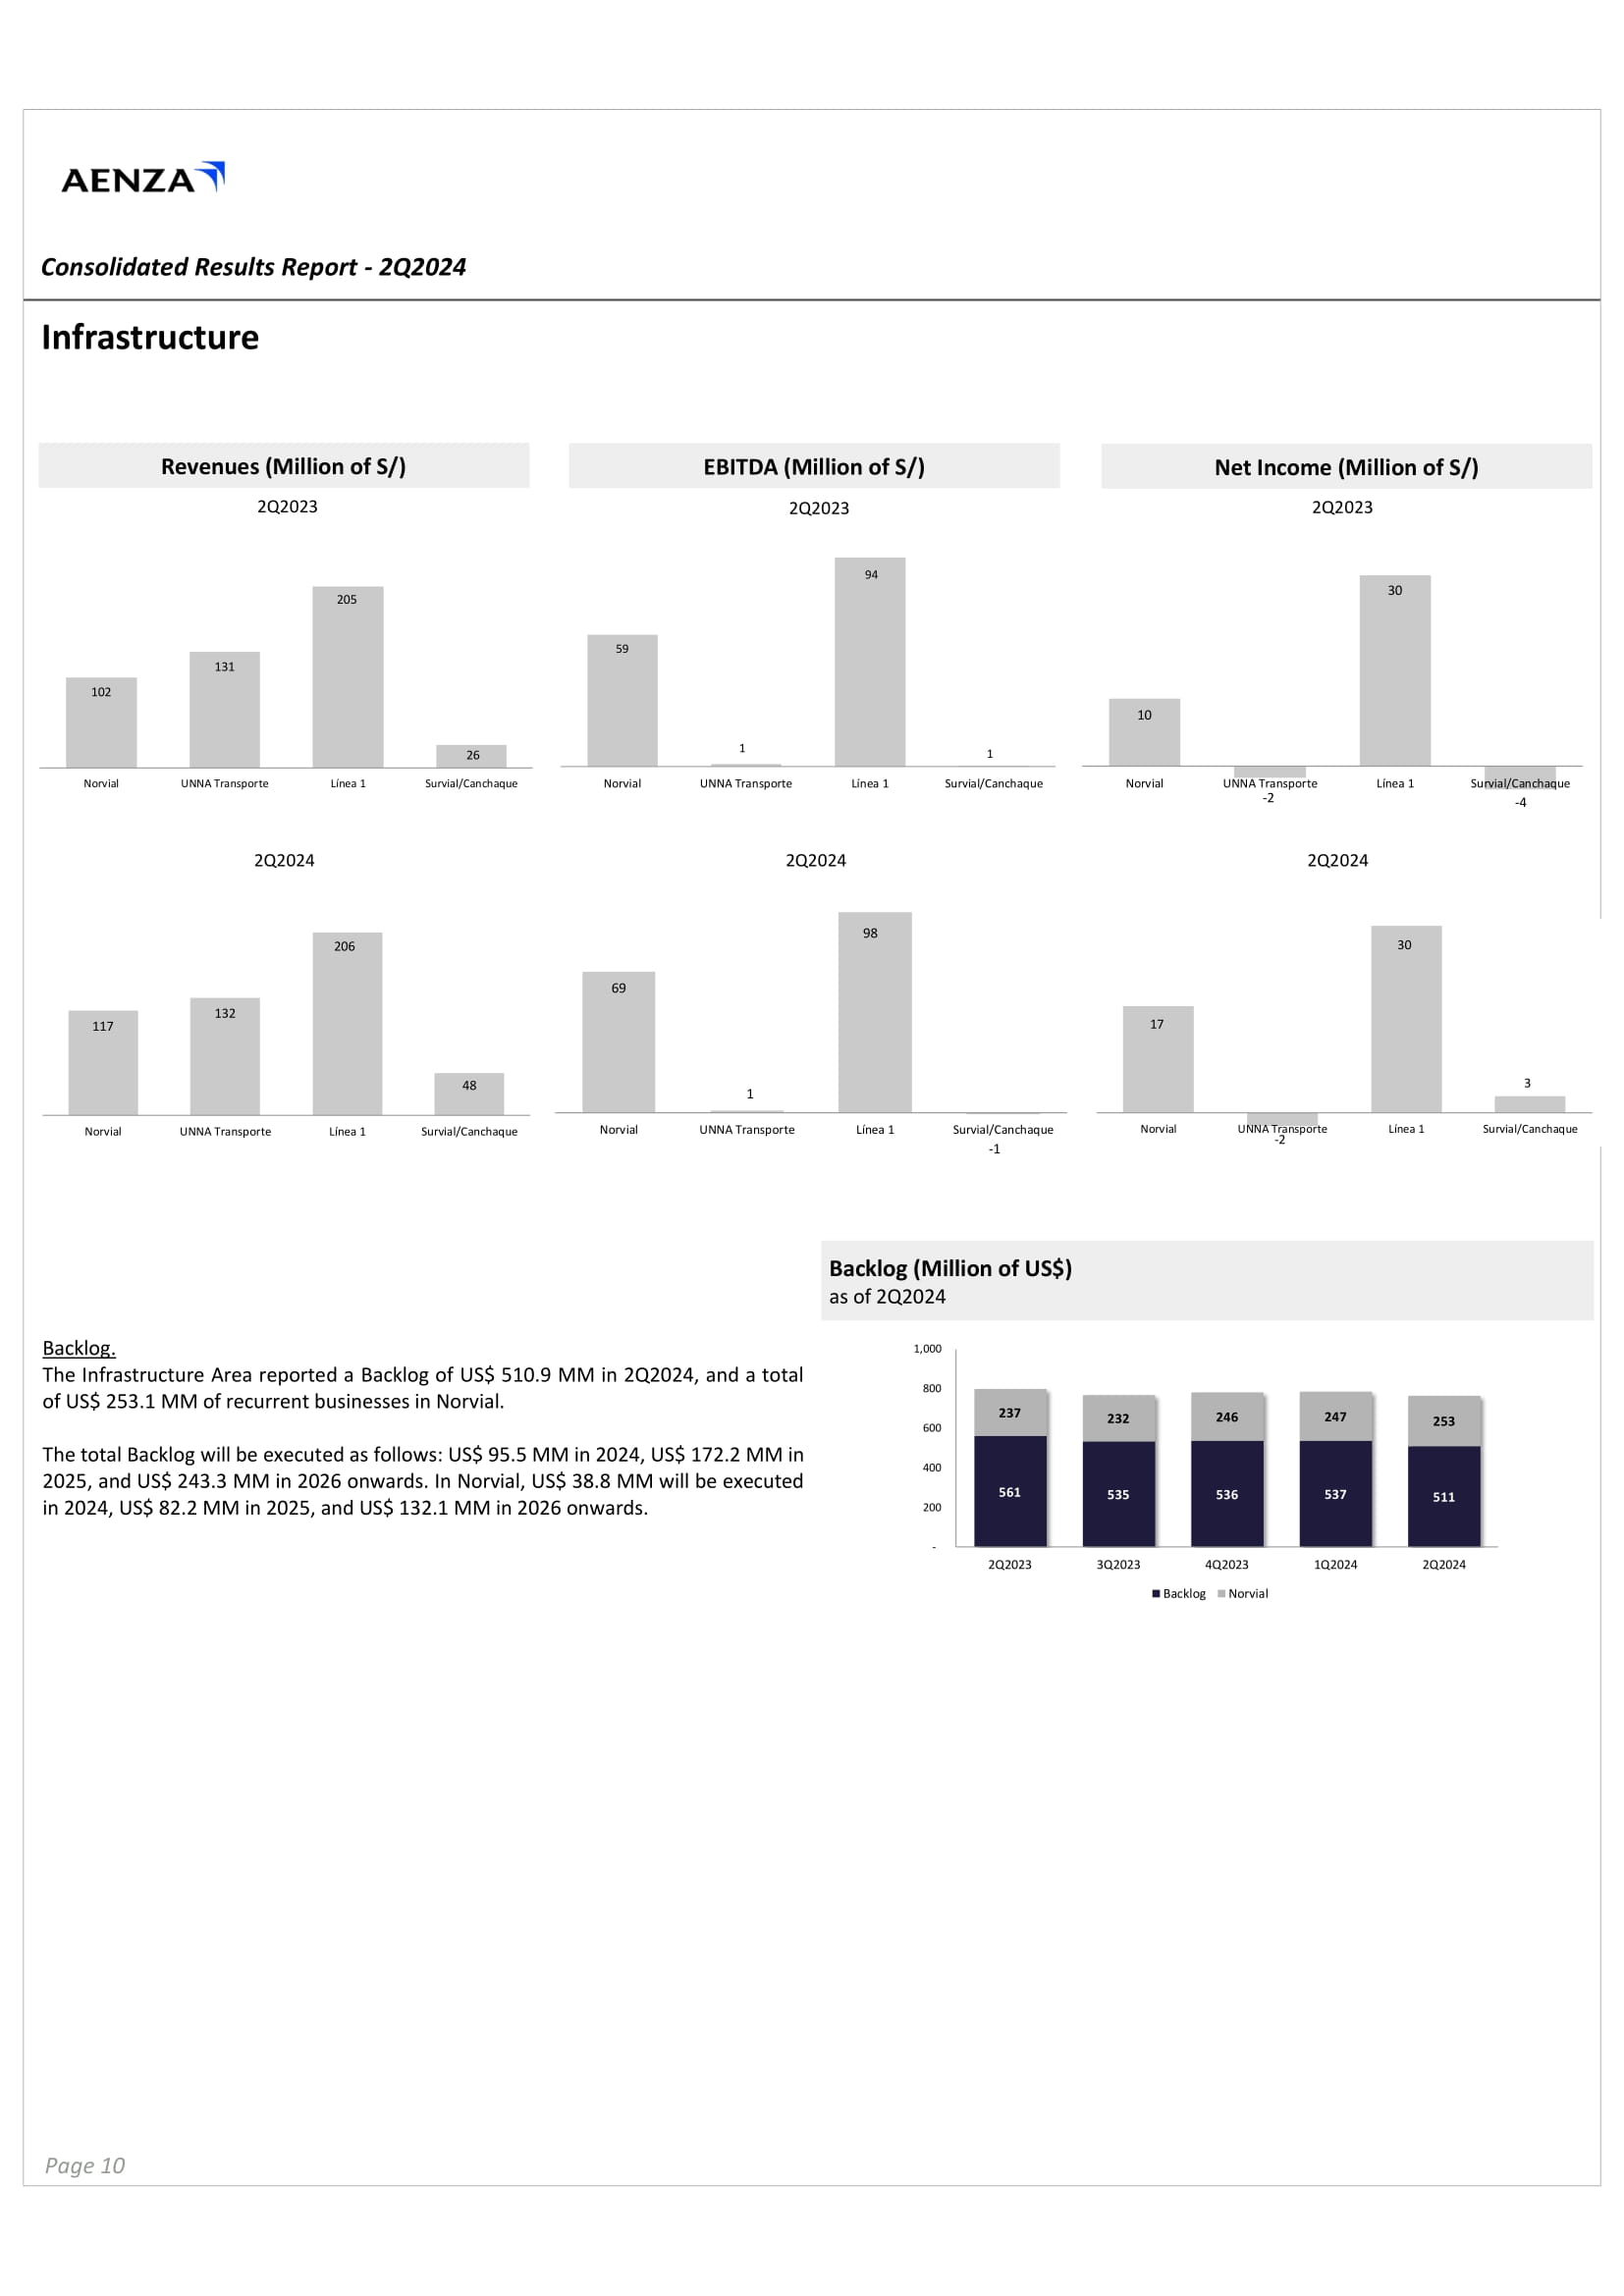
Consolidated Results Report - Third Quarter of 2014 Consolidated Results Report - 2Q2024 Infrastructure Backlog . The Infrastructure Area reported a Backlog of US$ 510.9 MM in 2Q2024, and a total of US$ 253.1 MM of recurrent businesses in Norvial. The total Backlog will be executed as follows : US $ 95 . 5 MM in 2024 , US $ 172 . 2 MM in 2025 , and US $ 243 . 3 MM in 2026 onwards . In Norvial, US $ 38 . 8 MM will be executed in 2024 , US $ 82 . 2 MM in 2025 , and US $ 132 . 1 MM in 2026 onwards . Backlog (Million of US$) as of 2Q2024 Revenues (Million of S/) EBITDA (Million of S/) Net Income (Million of S/) 2 Q 20 2 3 2 Q 20 2 4 2 Q 20 2 3 2 Q 20 2 4 2 Q 2 0 2 3 2 Q 2 0 2 4 117 132 206 48 Norvial U N N A T r a n s p o r te L í n ea 1 Survial/Canchaque 69 1 98 N or v i a l U N N A T r a n s p o r te Línea 1 Survial/Canchaque - 1 10 - 2 30 - 4 Norvial U N N A T r a n s p o r te L ín ea 1 S u r vial/Canchaq u e 17 30 3 N o r v i a l U N N A T r a n s p o r te L í n ea 1 - 2 Survial/Canchaque 561 535 536 537 511 237 232 246 247 253 - 20 0 40 0 60 0 80 0 1 , 00 0 2 Q 202 3 3 Q 202 3 4 Q 202 3 1 Q 202 4 2 Q 202 4 Backlog Norvial Page 10
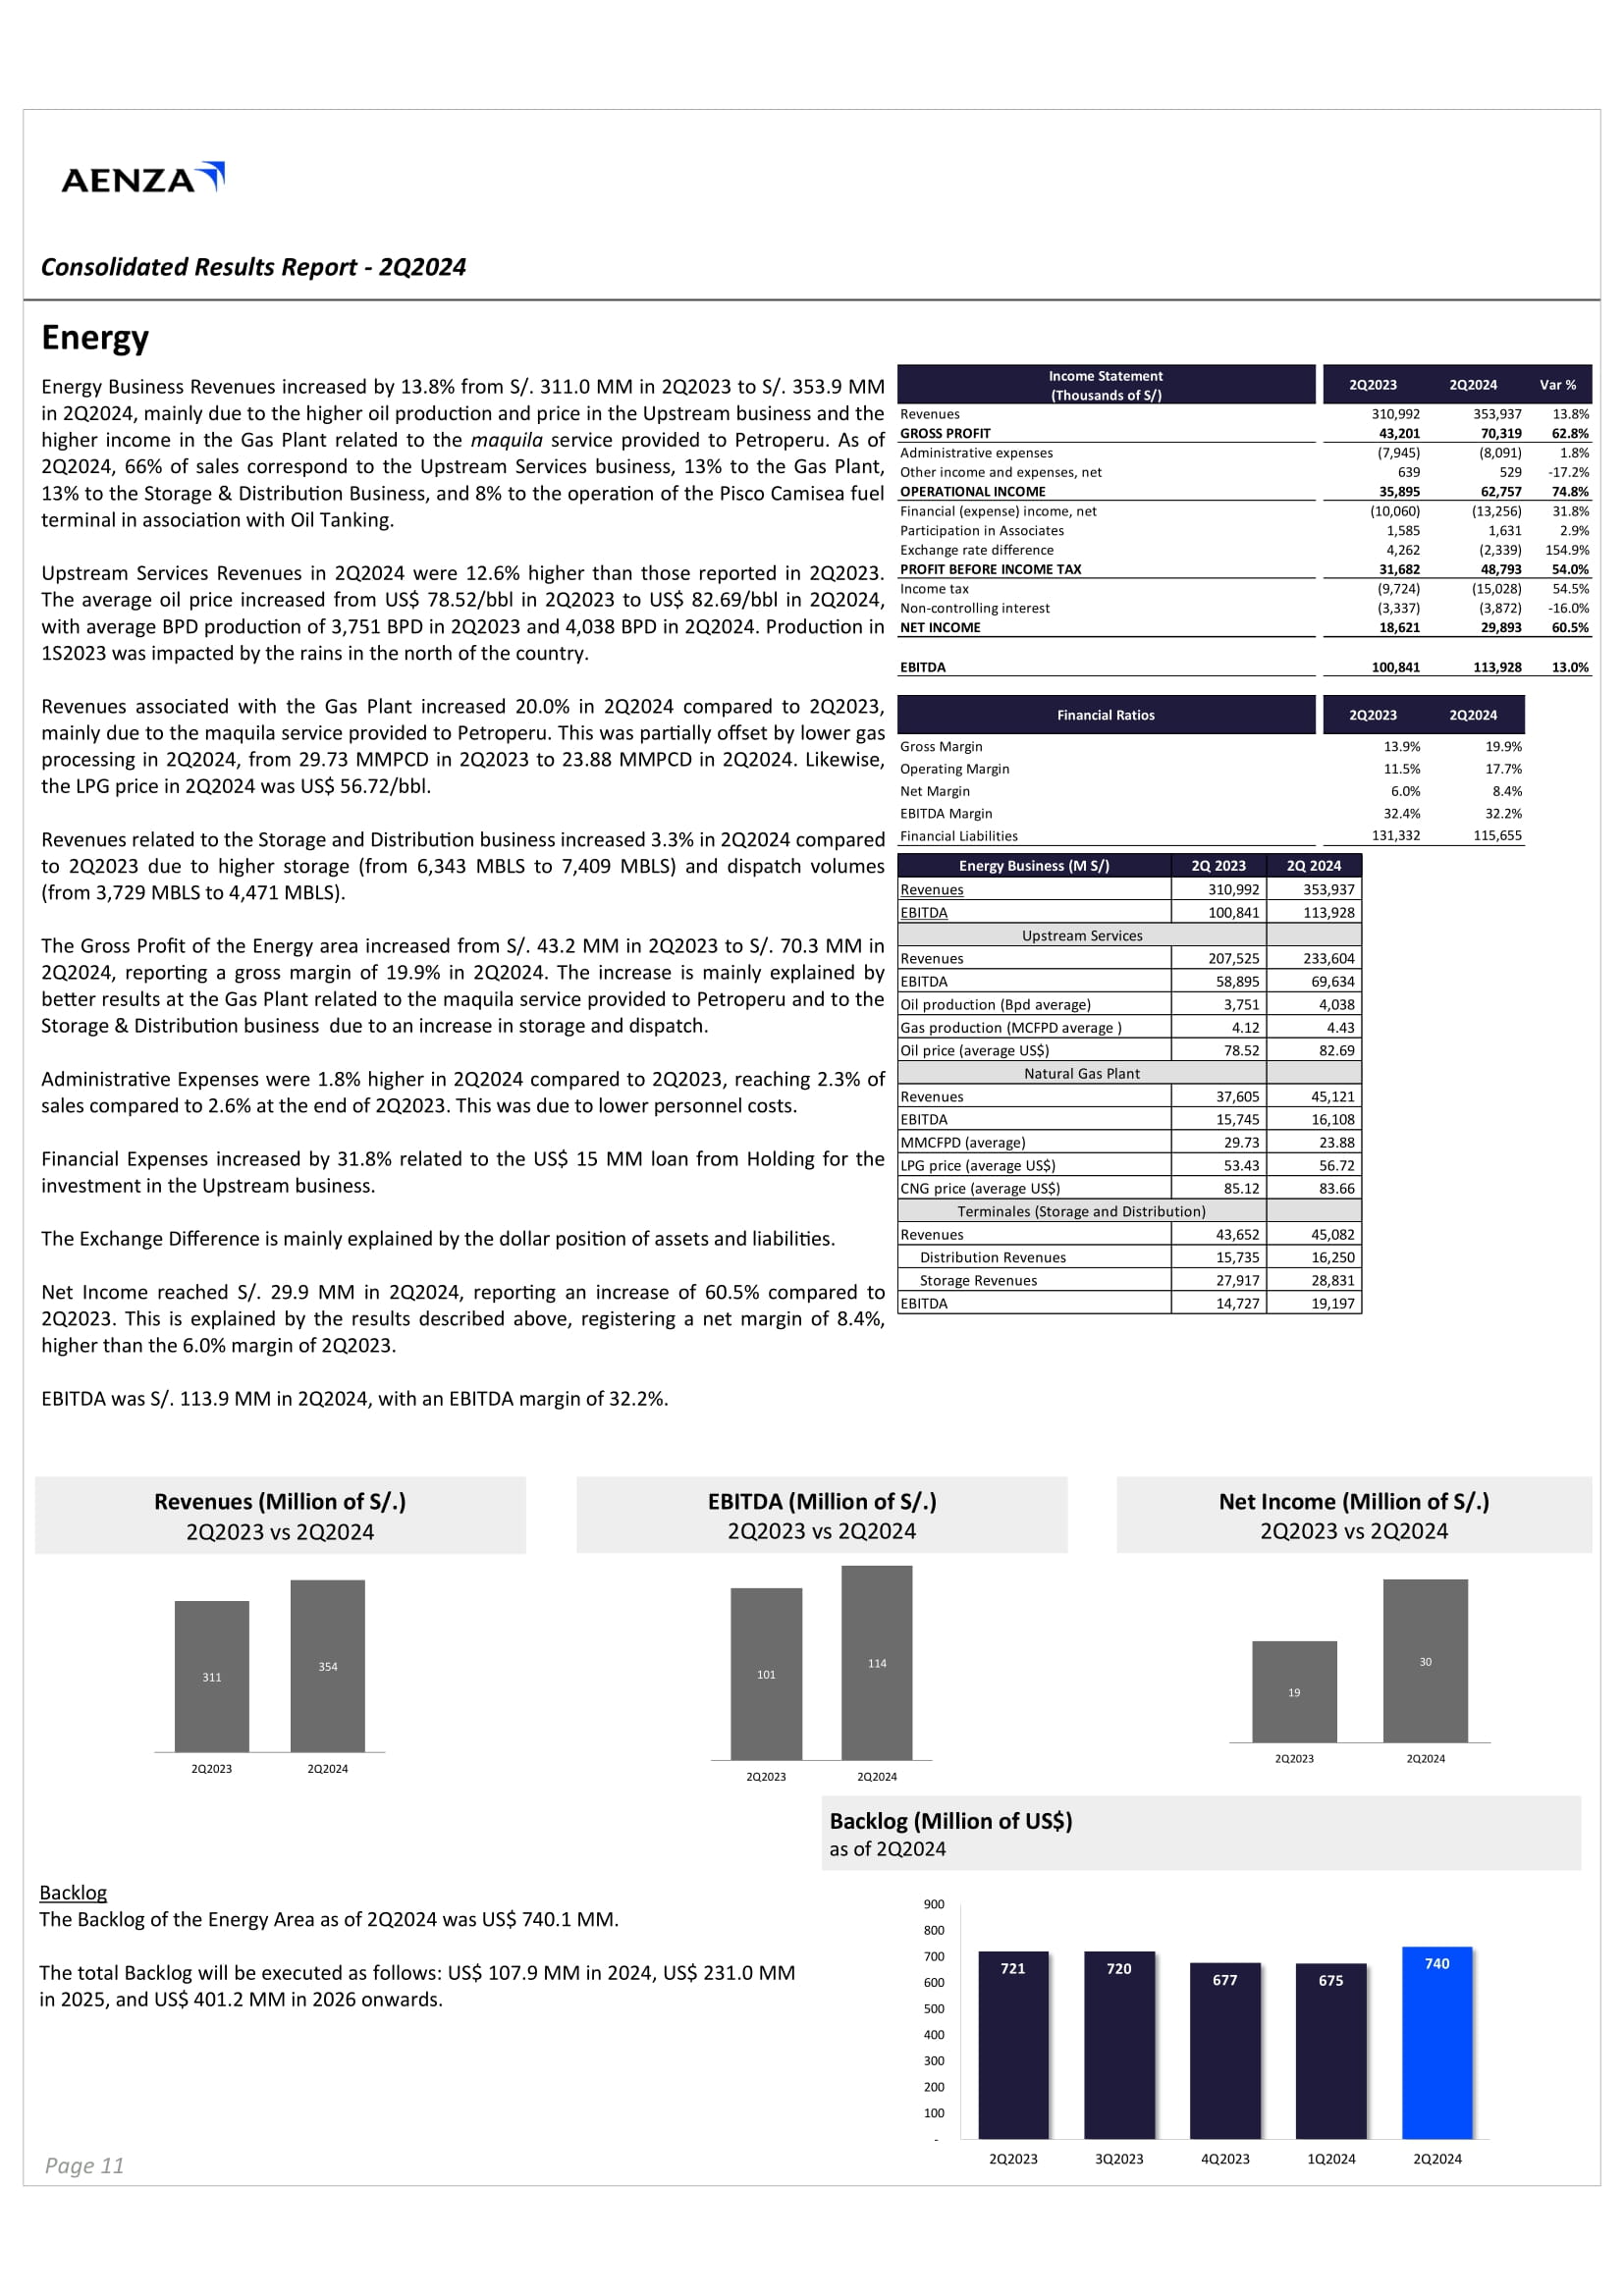
Consolidated Results Report - Third Quarter of 2014 P a ge 11 to 2 Q 2023 due to higher storage (from 6 , 343 MBLS to 7 , 409 MBLS) and dispatch volumes (from 3 , 729 MBLS to 4 , 471 MBLS) . The Gross Profit of the Energy area increased from S/ . 43 . 2 MM in 2 Q 2023 to S/ . 70 . 3 MM in 2 Q 2024 , reporting a gross margin of 19 . 9 % in 2 Q 2024 . The increase is mainly explained by better results at the Gas Plant related to the maquila service provided to Petroperu and to the Storage & Distribution business due to an increase in storage and dispatch . Administrative Expenses were 1 . 8 % higher in 2 Q 2024 compared to 2 Q 2023 , reaching 2 . 3 % of sales compared to 2 . 6 % at the end of 2 Q 2023 . This was due to lower personnel costs . Financial Expenses increased by 31 . 8 % related to the US $ 15 MM loan from Holding for the investment in the Upstream business . The Exchange Difference is mainly explained by the dollar position of assets and liabilities . Net Income reached S/ . 29 . 9 MM in 2 Q 2024 , reporting an increase of 60 . 5 % compared to 2 Q 2023 . This is explained by the results described above, registering a net margin of 8 . 4 % , higher than the 6 . 0 % margin of 2 Q 2023 . EBITDA was S/ . 113 . 9 MM in 2 Q 2024 , with an EBITDA margin of 32 . 2 % . Revenues (Million of S/.) 2Q2023 vs 2Q2024 EBITDA (Million of S/.) 2Q2023 vs 2Q2024 Net Income (Million of S/.) 2Q2023 vs 2Q2024 Backlog The Backlog of the Energy Area as of 2Q2024 was US$ 740.1 MM. The total Backlog will be executed as follows: US$ 107.9 MM in 2024, US$ 231.0 MM in 2025, and US$ 401.2 MM in 2026 onwards. Backlog (Million of US$) as of 2Q2024 Consolidated Results Report - 2Q2024 Energy Energy Business Revenues increased by 13 . 8 % from S/ . 311 . 0 MM in 2 Q 2023 to S/ . 353 . 9 MM in 2 Q 2024 , mainly due to the higher oil production and price in the Upstream business and the higher income in the Gas Plant related to the maquila service provided to Petroperu . As of 2 Q 2024 , 66 % of sales correspond to the Upstream Services business, 13 % to the Gas Plant, 13 % to the Storage & Distribution Business, and 8 % to the operation of the Pisco Camisea fuel terminal in association with Oil Tanking . Upstream Services Revenues in 2 Q 2024 were 12 . 6 % higher than those reported in 2 Q 2023 . The average oil price increased from US $ 78 . 52 /bbl in 2 Q 2023 to US $ 82 . 69 /bbl in 2 Q 2024 , with average BPD production of 3 , 751 BPD in 2 Q 2023 and 4 , 038 BPD in 2 Q 2024 . Production in 1 S 2023 was impacted by the rains in the north of the country . Revenues associated with the Gas Plant increased 20 . 0 % in 2 Q 2024 compared to 2 Q 2023 , mainly due to the maquila service provided to Petroperu . This was partially offset by lower gas processing in 2 Q 2024 , from 29 . 73 MMPCD in 2 Q 2023 to 23 . 88 MMPCD in 2 Q 2024 . Likewise, the LPG price in 2 Q 2024 was US $ 56 . 72 /bbl . Var % 2Q2024 2Q2023 I n c o m e S tate m e n t ( T hou sa nd s o f S / ) 13.8% 353,937 310,992 Revenues 62.8% 70,319 43,201 G R O S S P R O FI T 1.8% (8,091) (7,945) Administrative expenses - 17.2% 529 639 Other income and expenses, net 74.8% 62,757 35,895 OPERATIONAL INCOME 31.8% (13,256) (10,060) Financial (expense) income, net 2.9% 1,631 1,585 Participation in Associates 154.9% (2,339) 4,262 Exchange rate difference 54.0% 48,793 31,682 PROFIT BEFORE INCOME TAX 54.5% (15,028) (9,724) Income tax - 16.0% (3,872) (3,337) Non - controlling interest 60.5% 29,893 18,621 NET INCOME 13.0% 113,928 100,841 EBITDA 2Q2024 2Q2023 Financial Ratios 19.9% 13.9% Gross Margin 17.7% 11.5% Operating Margin 8.4% 6.0% Net Margin 32.2% 32.4% EBITDA Margin Revenues related to the Storage and Distribution business increased 3.3% in 2Q2024 compared Financial Liabilities 131 , 33 2 115 , 65 5 2Q 2024 2Q 2023 Energy Business (M S/) 353,937 310,992 Revenues 113,928 100,841 EBITDA Upstream Services 233,604 207,525 Revenues 69,634 58,895 EBITDA 4,038 3,751 Oil production (Bpd average) 4.43 4.12 Gas production (MCFPD average ) 82.69 78.52 Oil price (average US$) Natural Gas Plant 45,121 37,605 Revenues 16,108 15,745 EBITDA 23.88 29.73 MMCFPD (average) 56.72 53.43 LPG price (average US$) 83.66 85.12 CNG price (average US$) Terminales (Storage and Distribution) 45,082 43,652 Revenues 16,250 15,735 Distribution Revenues 28,831 27,917 Storage Revenues 19,197 14,727 EBITDA 311 354 2 Q 202 3 2 Q 202 4 101 114 2 Q 202 3 2 Q 202 4 19 30 2 Q 202 3 2 Q 202 4 721 720 677 675 740 300 200 100 - 50 0 40 0 80 0 70 0 60 0 90 0 2 Q 202 3 3 Q 202 3 4 Q 202 3 1 Q 202 4 2 Q 202 4
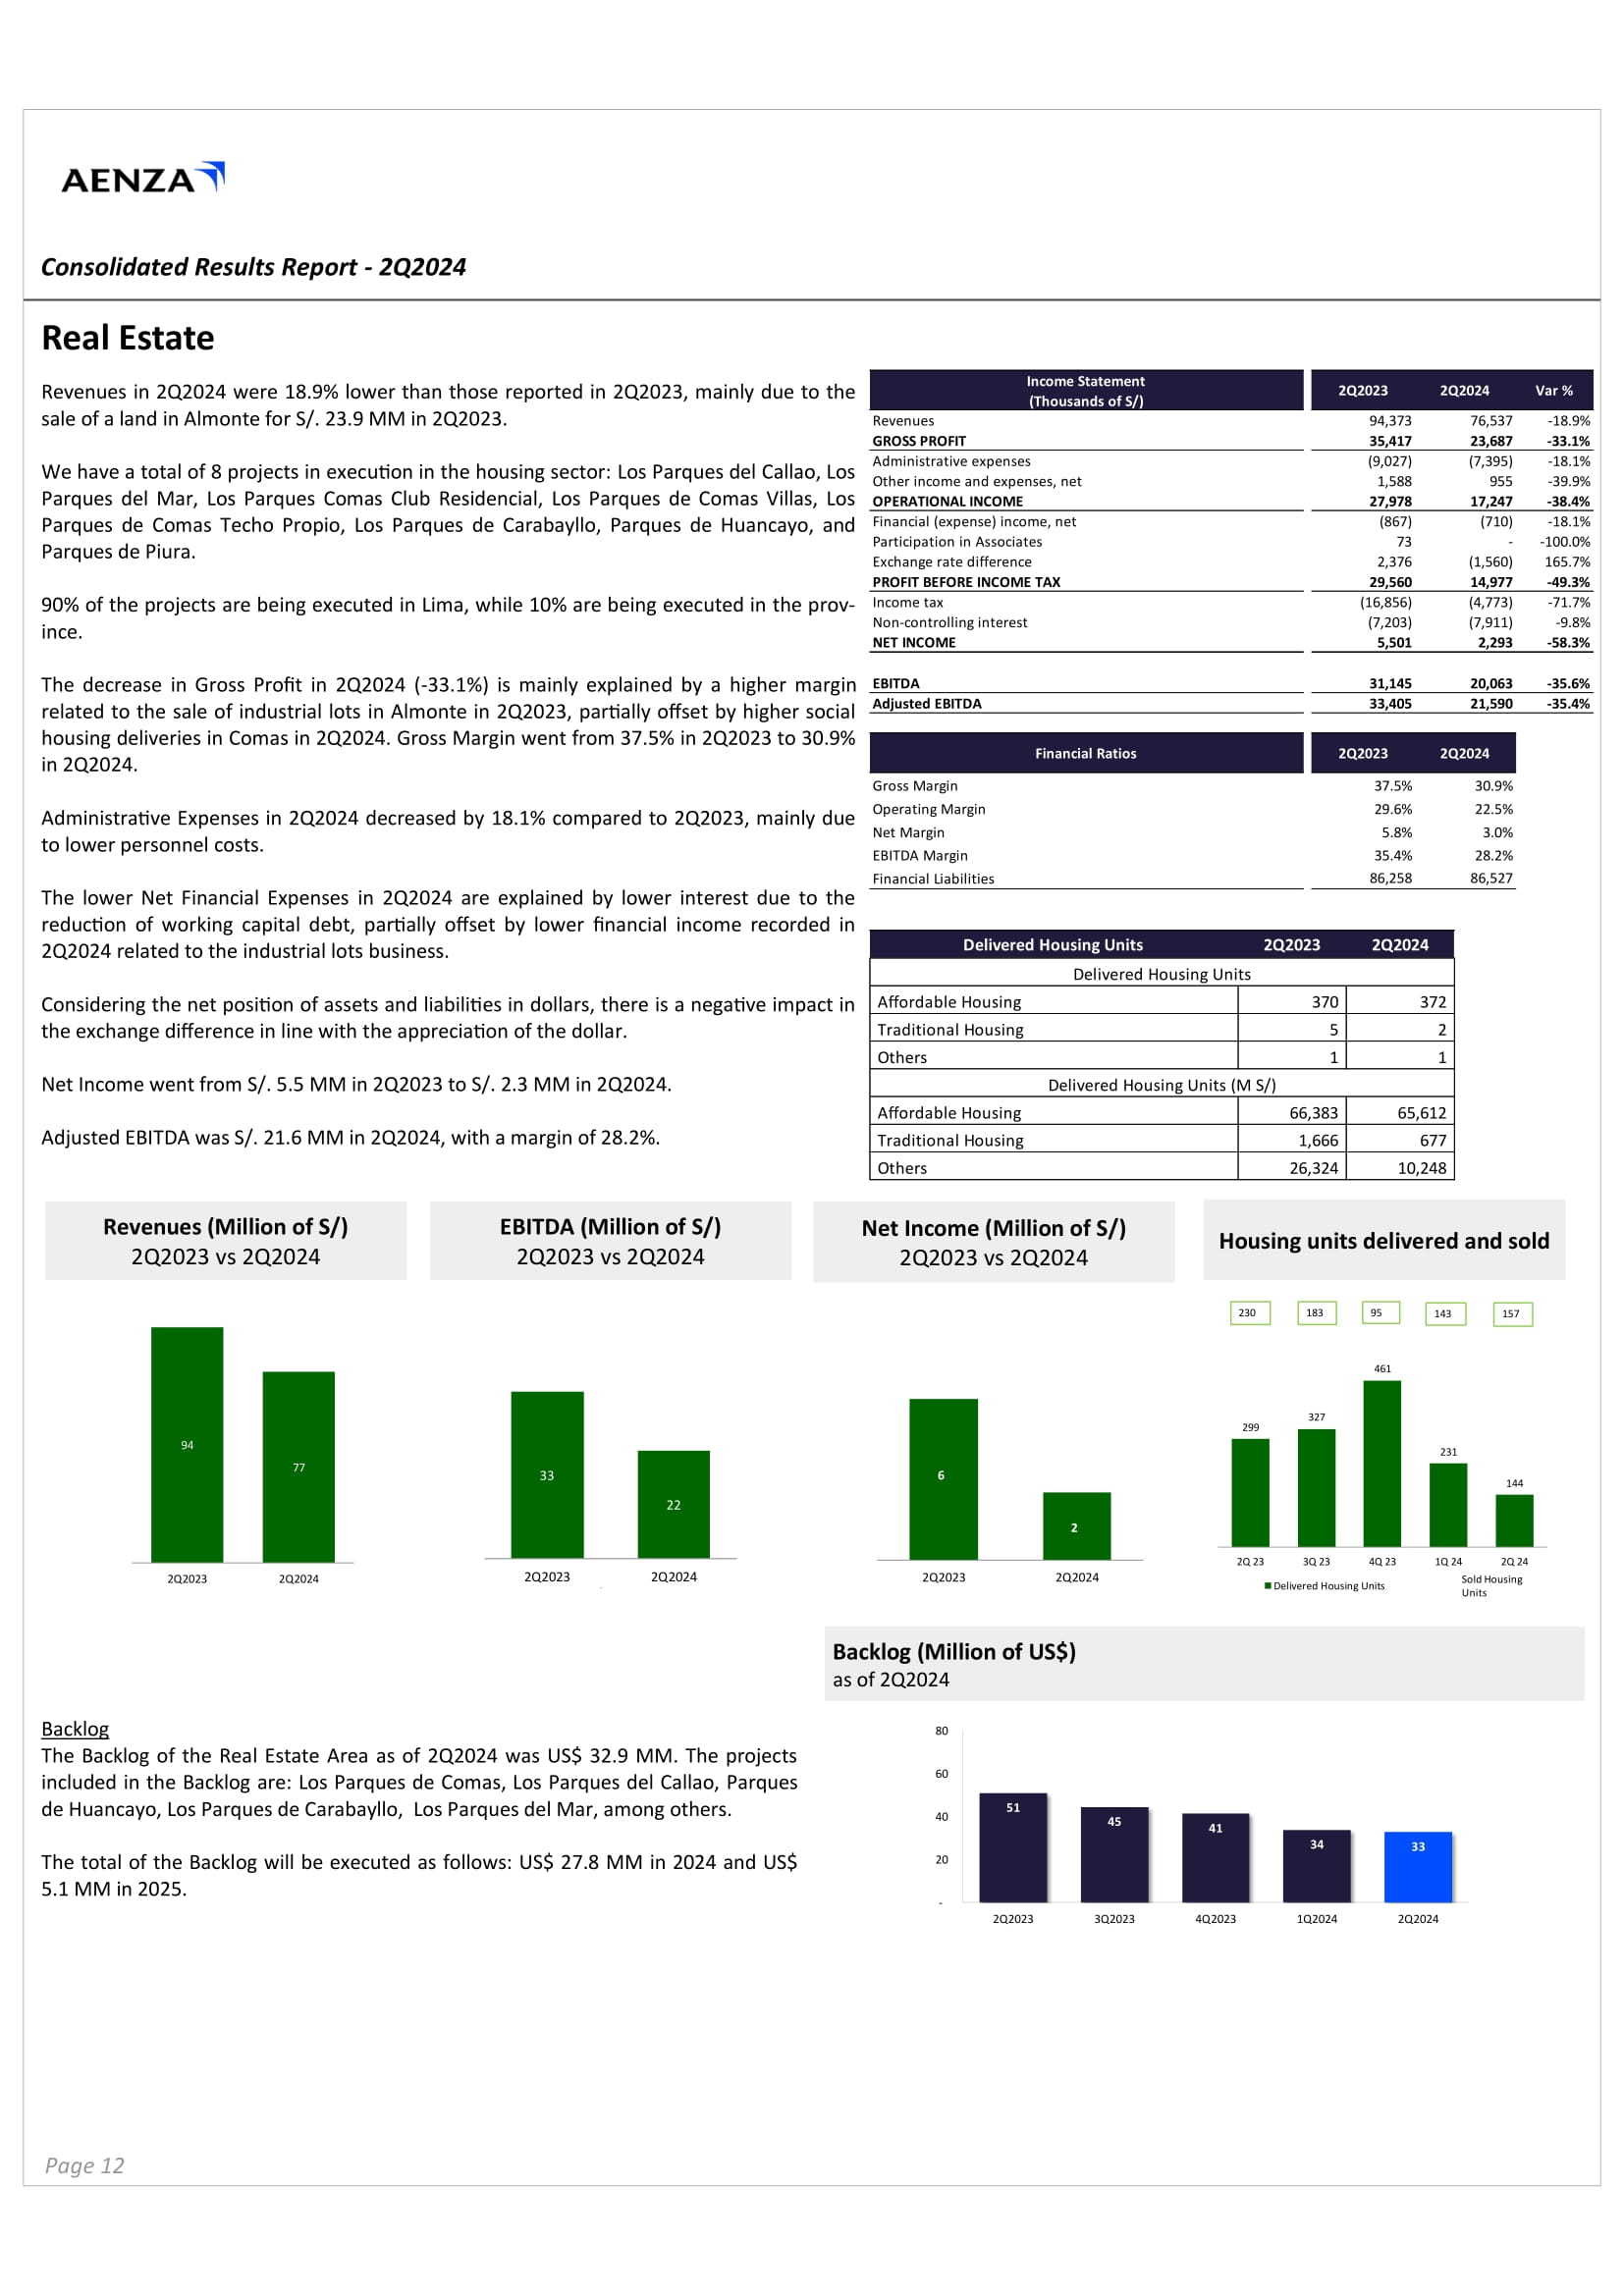
Consolidated Results Report - Third Quarter of 2014 Consolidated Results Report - 2Q2024 Real Estate Revenues in 2 Q 2024 were 18 . 9 % lower than those reported in 2 Q 2023 , mainly due to the sale of a land in Almonte for S/ . 23 . 9 MM in 2 Q 2023 . We have a total of 8 projects in execution in the housing sector : Los Parques del Callao, Los Parques del Mar, Los Parques Comas Club Residencial, Los Parques de Comas Villas, Los Parques de Comas Techo Propio, Los Parques de Carabayllo, Parques de Huancayo, and Parques de Piura . 90% of the projects are being executed in Lima, while 10% are being executed in the prov - ince. The decrease in Gross Profit in 2 Q 2024 ( - 33 . 1 % ) is mainly explained by a higher margin related to the sale of industrial lots in Almonte in 2 Q 2023 , partially offset by higher social housing deliveries in Comas in 2 Q 2024 . Gross Margin went from 37 . 5 % in 2 Q 2023 to 30 . 9 % in 2 Q 2024 . Administrative Expenses in 2 Q 2024 decreased by 18 . 1 % compared to 2 Q 2023 , mainly due to lower personnel costs . The lower Net Financial Expenses in 2 Q 2024 are explained by lower interest due to the reduction of working capital debt, partially offset by lower financial income recorded in 2 Q 2024 related to the industrial lots business . Considering the net position of assets and liabilities in dollars, there is a negative impact in the exchange difference in line with the appreciation of the dollar . Net Income went from S/. 5.5 MM in 2Q2023 to S/. 2.3 MM in 2Q2024. Adjusted EBITDA was S/. 21.6 MM in 2Q2024, with a margin of 28.2%. Backlog The Backlog of the Real Estate Area as of 2 Q 2024 was US $ 32 . 9 MM . The projects included in the Backlog are : Los Parques de Comas, Los Parques del Callao, Parques de Huancayo, Los Parques de Carabayllo, Los Parques del Mar, among others . The total of the Backlog will be executed as follows: US$ 27.8 MM in 2024 and US$ 5.1 MM in 2025. Backlog (Million of US$) as of 2Q2024 Revenues (Million of S/) 2Q2023 vs 2Q2024 EBITDA (Million of S/) 2Q2023 vs 2Q2024 Net Income (Million of S/) 2Q2023 vs 2Q2024 Housing units delivered and sold Delivered Housing Units 2Q2023 2Q2024 Delivered Housing Units 372 370 Affordable Housing 2 5 Traditional Housing 1 1 Others Delivered Housing Units (M S/) 65,612 66,383 Affordable Housing 677 1,666 Traditional Housing 10,248 26,324 Others 94 77 2 Q 202 3 2 Q 202 4 33 22 2 Q 202 3 2 Q 202 4 6 2 2 Q 202 3 2 Q 202 4 327 299 461 231 144 2 Q 2 3 1 Q 2 4 2 Q 2 4 3 Q 2 3 4 Q 2 3 Delivered Housing Units S old H ou s in g Units 157 230 183 95 143 51 Page 12 45 41 34 33 - 2 0 4 0 6 0 8 0 2 Q 202 3 3 Q 202 3 4 Q 202 3 1 Q 202 4 2 Q 202 4
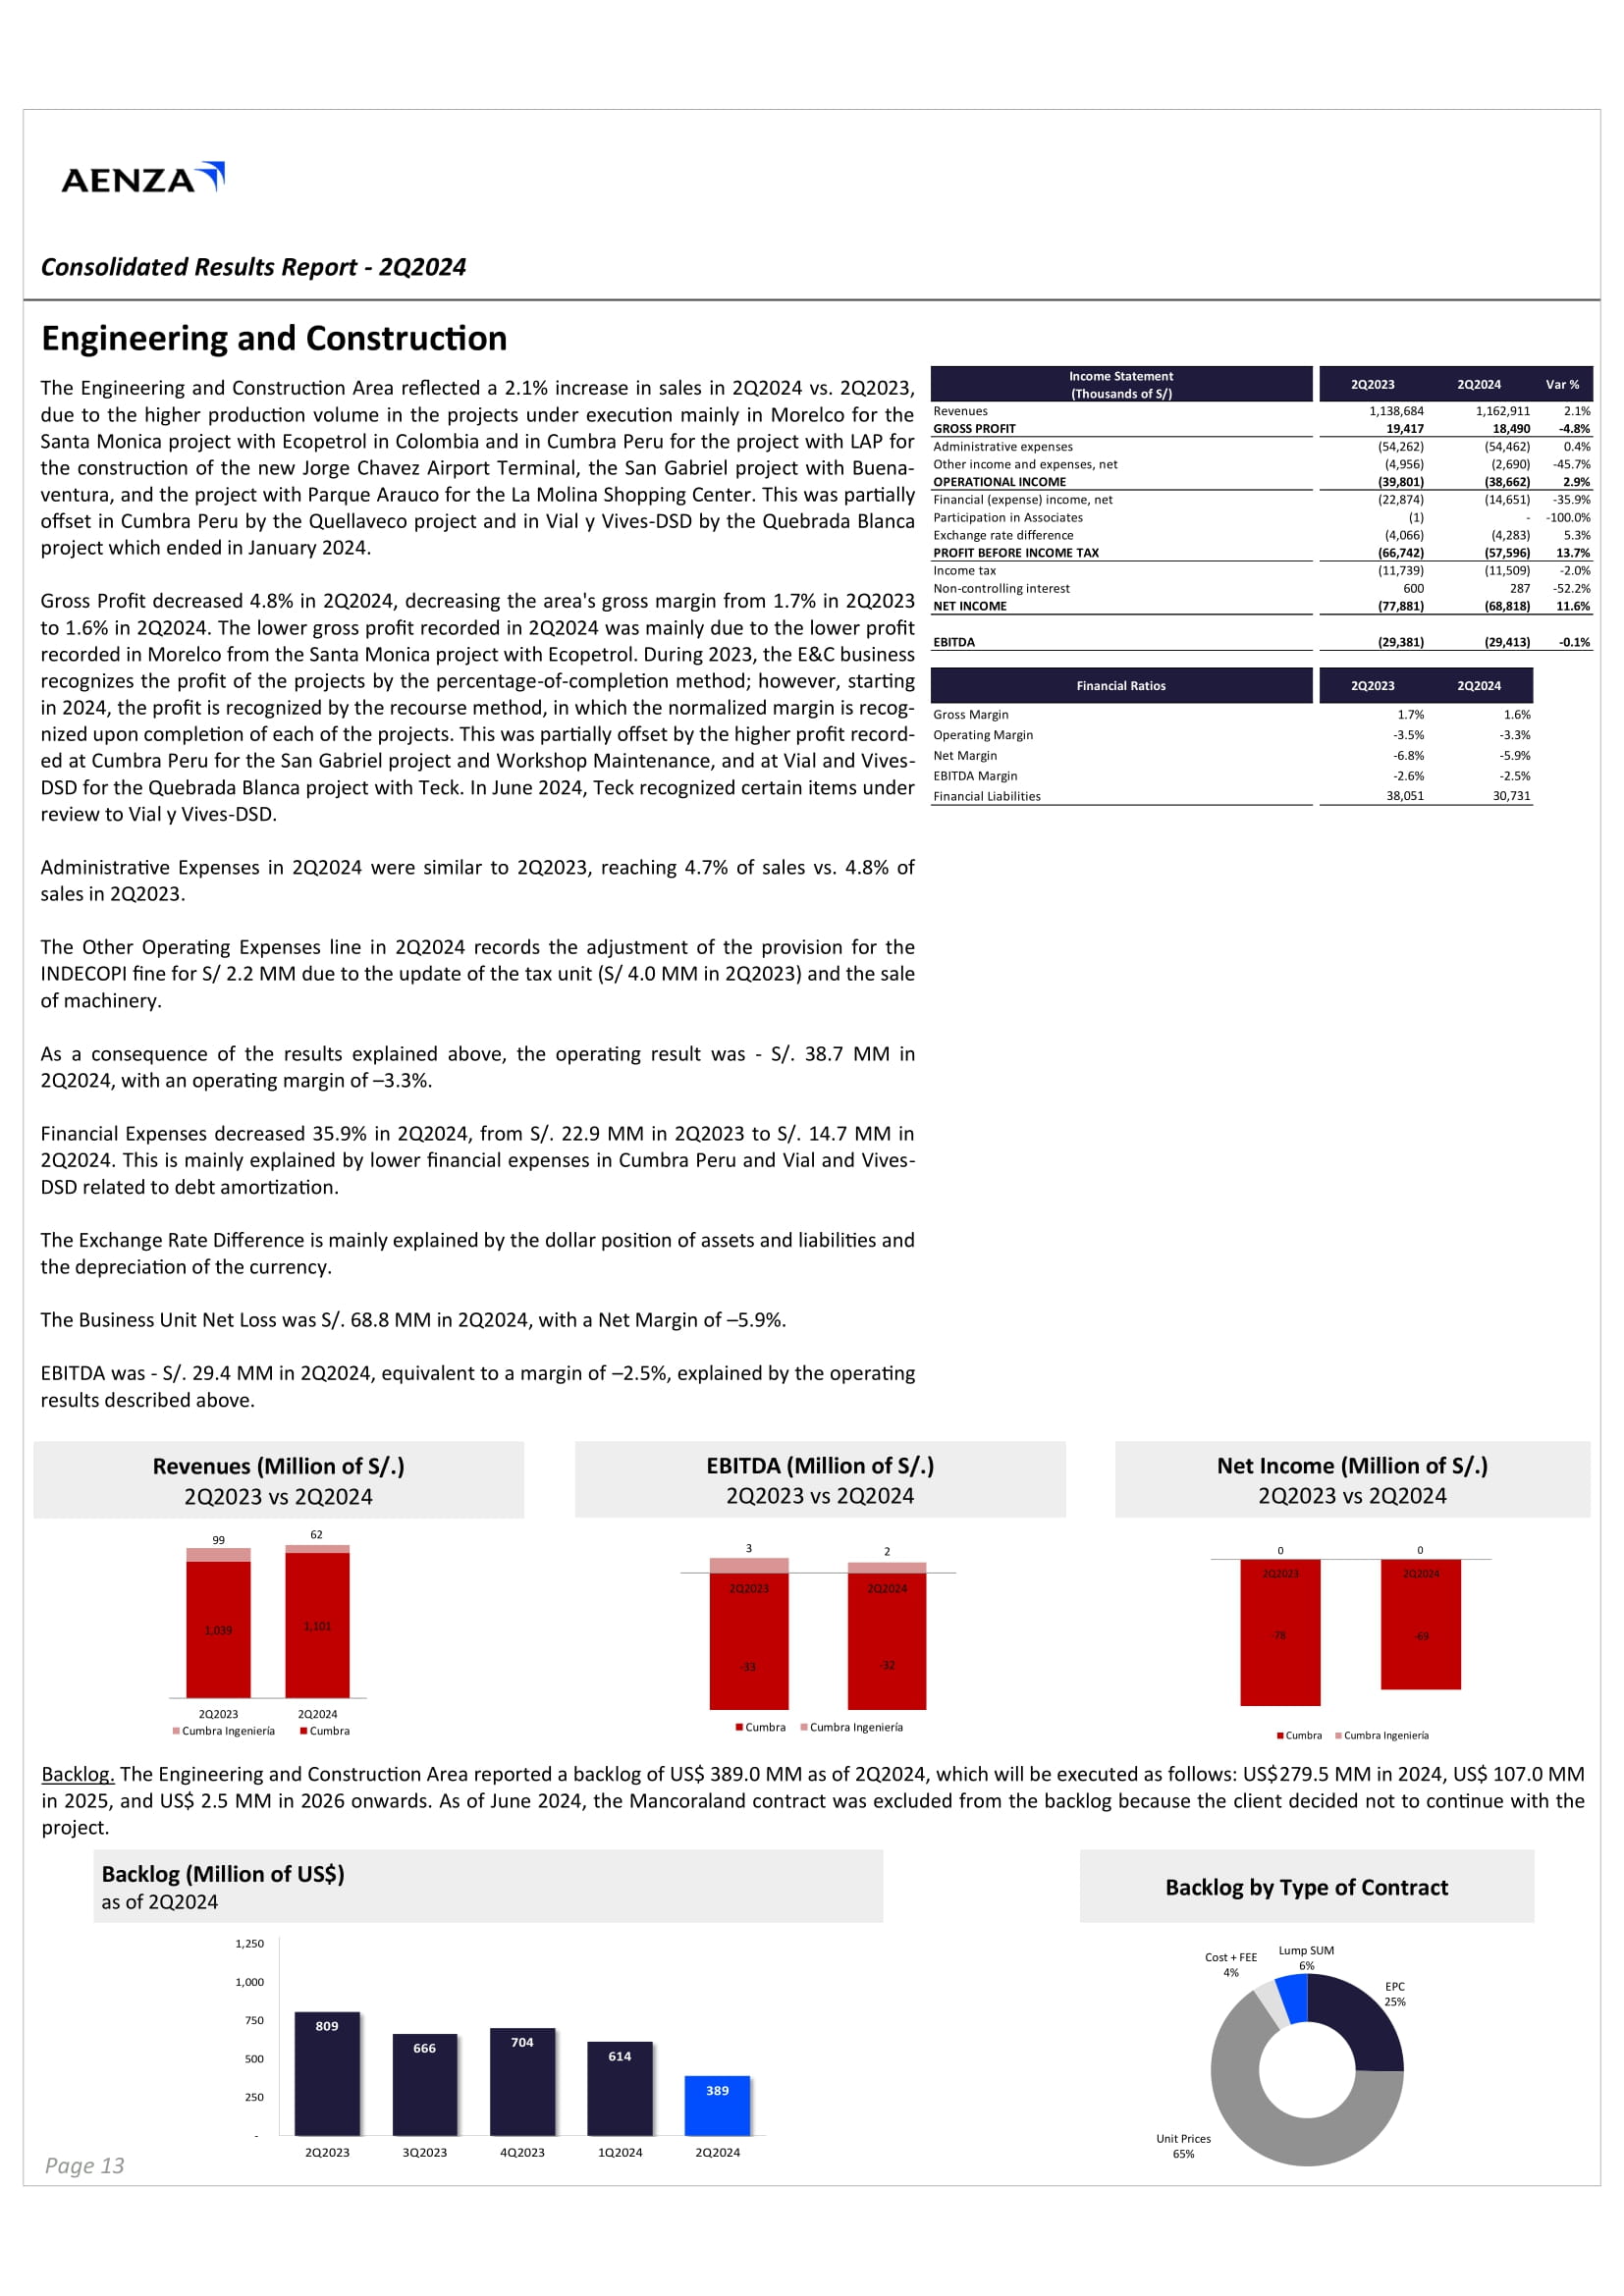
Consolidated Results Report - Third Quarter of 2014 Consolidated Results Report - 2Q2024 Engineering and Construction The Engineering and Construction Area reflected a 2.1% increase in sales in 2Q2024 vs. 2Q2023, due to the higher production volume in the projects under execution mainly in Morelco for the the construction of the new Jorge Chavez Airport Terminal, the San Gabriel project with Buena - project which ended in January 2024. Administrative Expenses in 2 Q 2024 were similar to 2 Q 2023 , reaching 4 . 7 % of sales vs . 4 . 8 % of sales in 2 Q 2023 . The Other Operating Expenses line in 2 Q 2024 records the adjustment of the provision for the INDECOPI fine for S/ 2 . 2 MM due to the update of the tax unit (S/ 4 . 0 MM in 2 Q 2023 ) and the sale of machinery . As a consequence of the results explained above, the operating result was - S/. 38.7 MM in 2Q2024, with an operating margin of – 3.3%. Financial Expenses decreased 35 . 9 % in 2 Q 2024 , from S/ . 22 . 9 MM in 2 Q 2023 to S/ . 14 . 7 MM in 2 Q 2024 . This is mainly explained by lower financial expenses in Cumbra Peru and Vial and Vives - DSD related to debt amortization . The Exchange Rate Difference is mainly explained by the dollar position of assets and liabilities and the depreciation of the currency . The Business Unit Net Loss was S/. 68.8 MM in 2Q2024, with a Net Margin of – 5.9%. EBITDA was - S/ . 29 . 4 MM in 2 Q 2024 , equivalent to a margin of – 2 . 5 % , explained by the operating results described above . Backlog . The Engineering and Construction Area reported a backlog of US $ 389 . 0 MM as of 2 Q 2024 , which will be executed as follows : US $ 279 . 5 MM in 2024 , US $ 107 . 0 MM in 2025 , and US $ 2 . 5 MM in 2026 onwards . As of June 2024 , the Mancoraland contract was excluded from the backlog because the client decided not to continue with the project . Backlog by Type of Contract Backlog (Million of US$) as of 2Q2024 Revenues (Million of S/.) 2Q2023 vs 2Q2024 EBITDA (Million of S/.) 2Q2023 vs 2Q2024 Net Income (Million of S/.) 2Q2023 vs 2Q2024 I n c o m e S tate m e n t ( T hou sa nd s o f S / ) 2 Q 202 3 2 Q 202 4 Var Reve nu es 1,138,68 4 1,162,91 1 G R O S S P R O F I T 19,41 7 1 Santa Monica project with Ecopetrol in Colombia and in Cumbra Peru for the project with LAP for Administrative expenses Other income and expenses, net (54,262 ) (4,956 ) O PE R A T I O N A L IN C O M E ( 39,8 0 1 ventura, and the project with Parque Arauco for the La Molina Shopping Center. This was partially Financial (expense) income, net (2 2 offset in Cumbra Peru by the Quellaveco project and in Vial y Vives - DSD by the Quebrada Blanca Participation in Associates Exchange rate difference PROFIT BEFORE INCOME TAX Income tax Non - controlling interest Gross Profit decreased 4.8% in 2Q2024, decreasing the area's gross margin from 1.7% in 2Q2023 NET INCOME to 1.6% in 2Q2024. The lower gross profit recorded in 2Q2024 was mainly due to the lower profit recorded in Morelco from the Santa Monica project with Ecopetrol. During 2023, the E&C business EBITDA F i n a n c recognizes the profit of the projects by the percentage - of - completion method; however, starting in 2024, the profit is recognized by the recourse method, in which the normalized margin is recog - Gross Margin EBIT D A nized upon completion of each of the projects. This was partially offset by the higher profit record - Operating Margin ed at Cumbra Peru for the San Gabriel project and Workshop Maintenance, and at Vial and Vives - Net Margin DSD for the Quebrada Blanca project with Teck. In June 2024, Teck recognized certain items under Fin review to Vial y Vives - DSD. 1,039 1,101 99 62 2Q2023 Cumbra Ingeniería 2Q2024 C u m b ra - 33 - 32 3 2 2 Q 202 3 2 Q 202 4 C u m b ra C u m b ra I n g e n i er í a 0 0 2Q2023 - 78 2Q2024 - 69 Cumbra Cumbra Ingeniería 809 666 704 614 389 - 25 0 50 0 75 0 1,00 0 1,25 0 2 Q 202 3 3 Q 202 3 4 Q 202 3 1 Q 202 4 2 Q 202 4 E P C 25% Page 13 U ni t Pr i ces 65% C o s t + FEE 4% L u m p S U M 6%
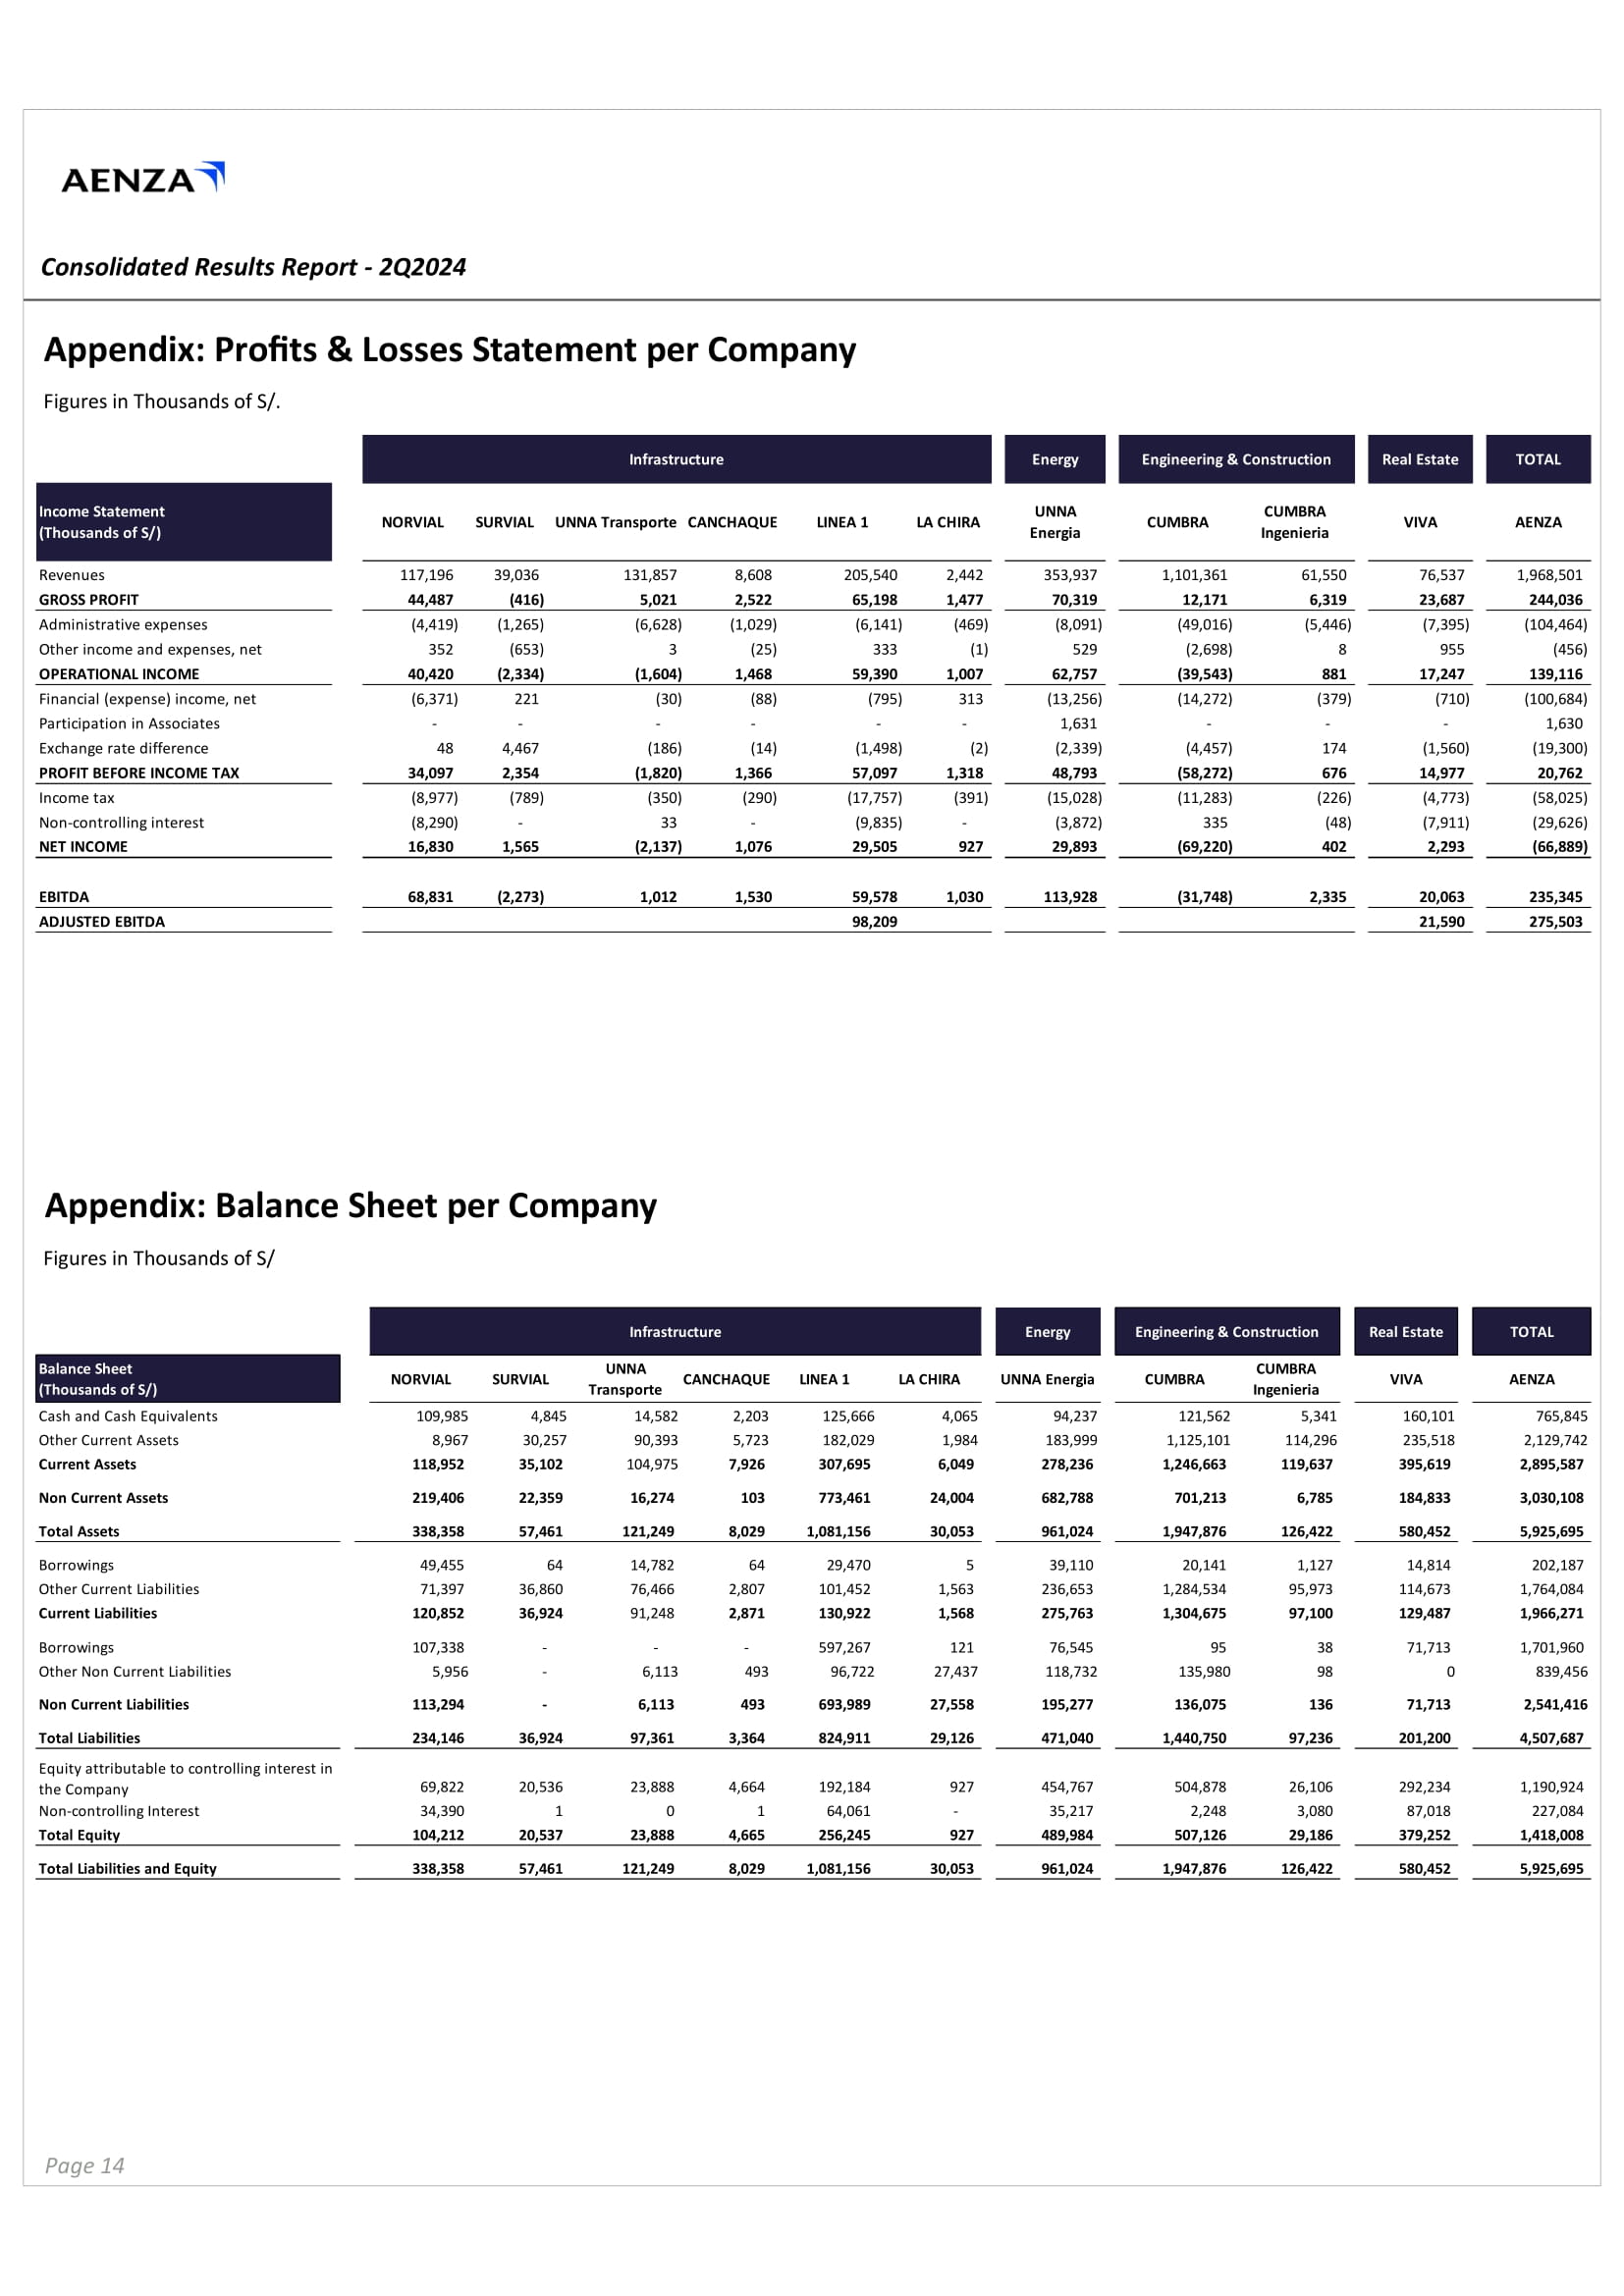
Consolidated Results Report - Third Quarter of 2014 Appendix: Balance Sheet per Company Figures in Thousands of S/ Consolidated Results Report - 2Q2024 Appendix: Profits & Losses Statement per Company Figures in Thousands of S/. Revenues G R O S S P R O F I T 117 , 1 9 6 44,487 39,036 (416) 131,857 5,021 8 , 6 0 8 2,522 205 , 5 4 0 65,198 2 , 4 4 2 1,477 353,937 1,101,361 61,550 76,537 1,968,501 70,319 12,171 6,319 23,687 244,036 (104,464) (7,395) (5,446) (49,016) (8,091) (469) (6,141) (1,029) (6,628) (1,265) (4,419) Administrative expenses (456) 955 8 (2,698) 529 (1) 333 (25) 3 (653) 352 Other income and expenses, net 62,757 (39,543) 881 17,247 139,116 1,007 59,390 1,468 (1,604) (2,334) 40,420 OPERATIONAL INCOME (100,684) (710) (379) (14,272) (13,256) 313 (795) (88) (30) 221 (6,371) Financial (expense) income, net 1,630 - - - 1,631 - - - - - - Participation in Associates (19,300) (1,560) 174 (4,457) (2,339) (2) (1,498) (14) (186) 4,467 48 Exchange rate difference 48,793 (58,272) 676 14,977 20,762 1,318 57,097 1,366 (1,820) 2,354 34,097 PROFIT BEFORE INCOME TAX (58,025) (4,773) (226) (11,283) (15,028) (391) (17,757) (290) (350) (789) (8,977) Income tax (29,626) (7,911) (48) 335 (3,872) - (9,835) - 33 - (8,290) Non - controlling interest (66,889) 2,293 402 (69,220) 29,893 927 29,505 1,076 (2,137) 1,565 16,830 NET INCOME EBITDA A DJ U S T E D E B I T D A 68,831 (2,273) 1,012 1,530 59,578 1,030 113,928 (31,748) 2,335 20,063 235,345 98,209 21,590 275,503 Income Statement (Thousands of S/) Engineering & Construction C U M BR A CUMBRA Ingenieria UNNA En er g ia TOTAL A E N Z A N O R V I A L S U R V I A L U NN A T r a n s po r te C A N C H A Q U E LI N E A 1 L A C H I R A Infrastructure Energy V I VA Real Estate Ingenieria TOTAL AENZA Real Estate VIVA Engineering & Construction CUMBRA CUMBRA Energy UNNA Energia Infrastructure SURVIAL UNNA CANCHAQUE LINEA 1 LA CHIRA Transporte NORVIAL Balance Sheet (Thousands of S/) 765,845 160,101 5,341 121,562 94,237 4,065 125,666 2,203 14,582 4,845 109,985 Cash and Cash Equivalents 2,129,742 235,518 114,296 1,125,101 183,999 1,984 182,029 5,723 90,393 30,257 8,967 Other Current Assets 2,895,587 395,619 119,637 1,246,663 278,236 6,049 307,695 7,926 104,975 35,102 118,952 Current Assets 3,030,108 184,833 6,785 701,213 682,788 24,004 773,461 103 16,274 22,359 219,406 Non Current Assets 5,925,695 580,452 1,947,876 126,422 961,024 30,053 1,081,156 8,029 121,249 57,461 338,358 Total Assets 202,187 14,814 1,127 20,141 39,110 5 29,470 64 14,782 64 49,455 Borrowings 1,764,084 114,673 95,973 1,284,534 236,653 1,563 101,452 2,807 76,466 36,860 71,397 Other Current Liabilities 1,966,271 129,487 97,100 1,304,675 275,763 1,568 130,922 2,871 91,248 36,924 120,852 Current Liabilities 1,701,960 71,713 38 95 76,545 121 597,267 - - - 107,338 Borrowings 839,456 0 98 135,980 118,732 27,437 96,722 493 6,113 - 5,956 Other Non Current Liabilities 2,541,416 71,713 136 136,075 195,277 27,558 693,989 493 6,113 - 113,294 Non Current Liabilities 4,507,687 201,200 1,440,750 97,236 471,040 29,126 824,911 3,364 97,361 36,924 234,146 Total Liabilities Equity attributable to controlling interest in 1,190,924 292,234 26,106 504,878 454,767 927 192,184 4,664 23,888 20,536 69,822 the Company 227,084 87,018 3,080 2,248 35,217 - 64,061 1 0 1 34,390 Non - controlling Interest 1,418,008 379,252 507,126 29,186 489,984 927 256,245 4,665 23,888 20,537 104,212 Total Equity 5,925,695 580,452 1,947,876 126,422 961,024 30,053 1,081,156 8,029 121,249 57,461 338,358 Total Liabilities and Equity Page 14
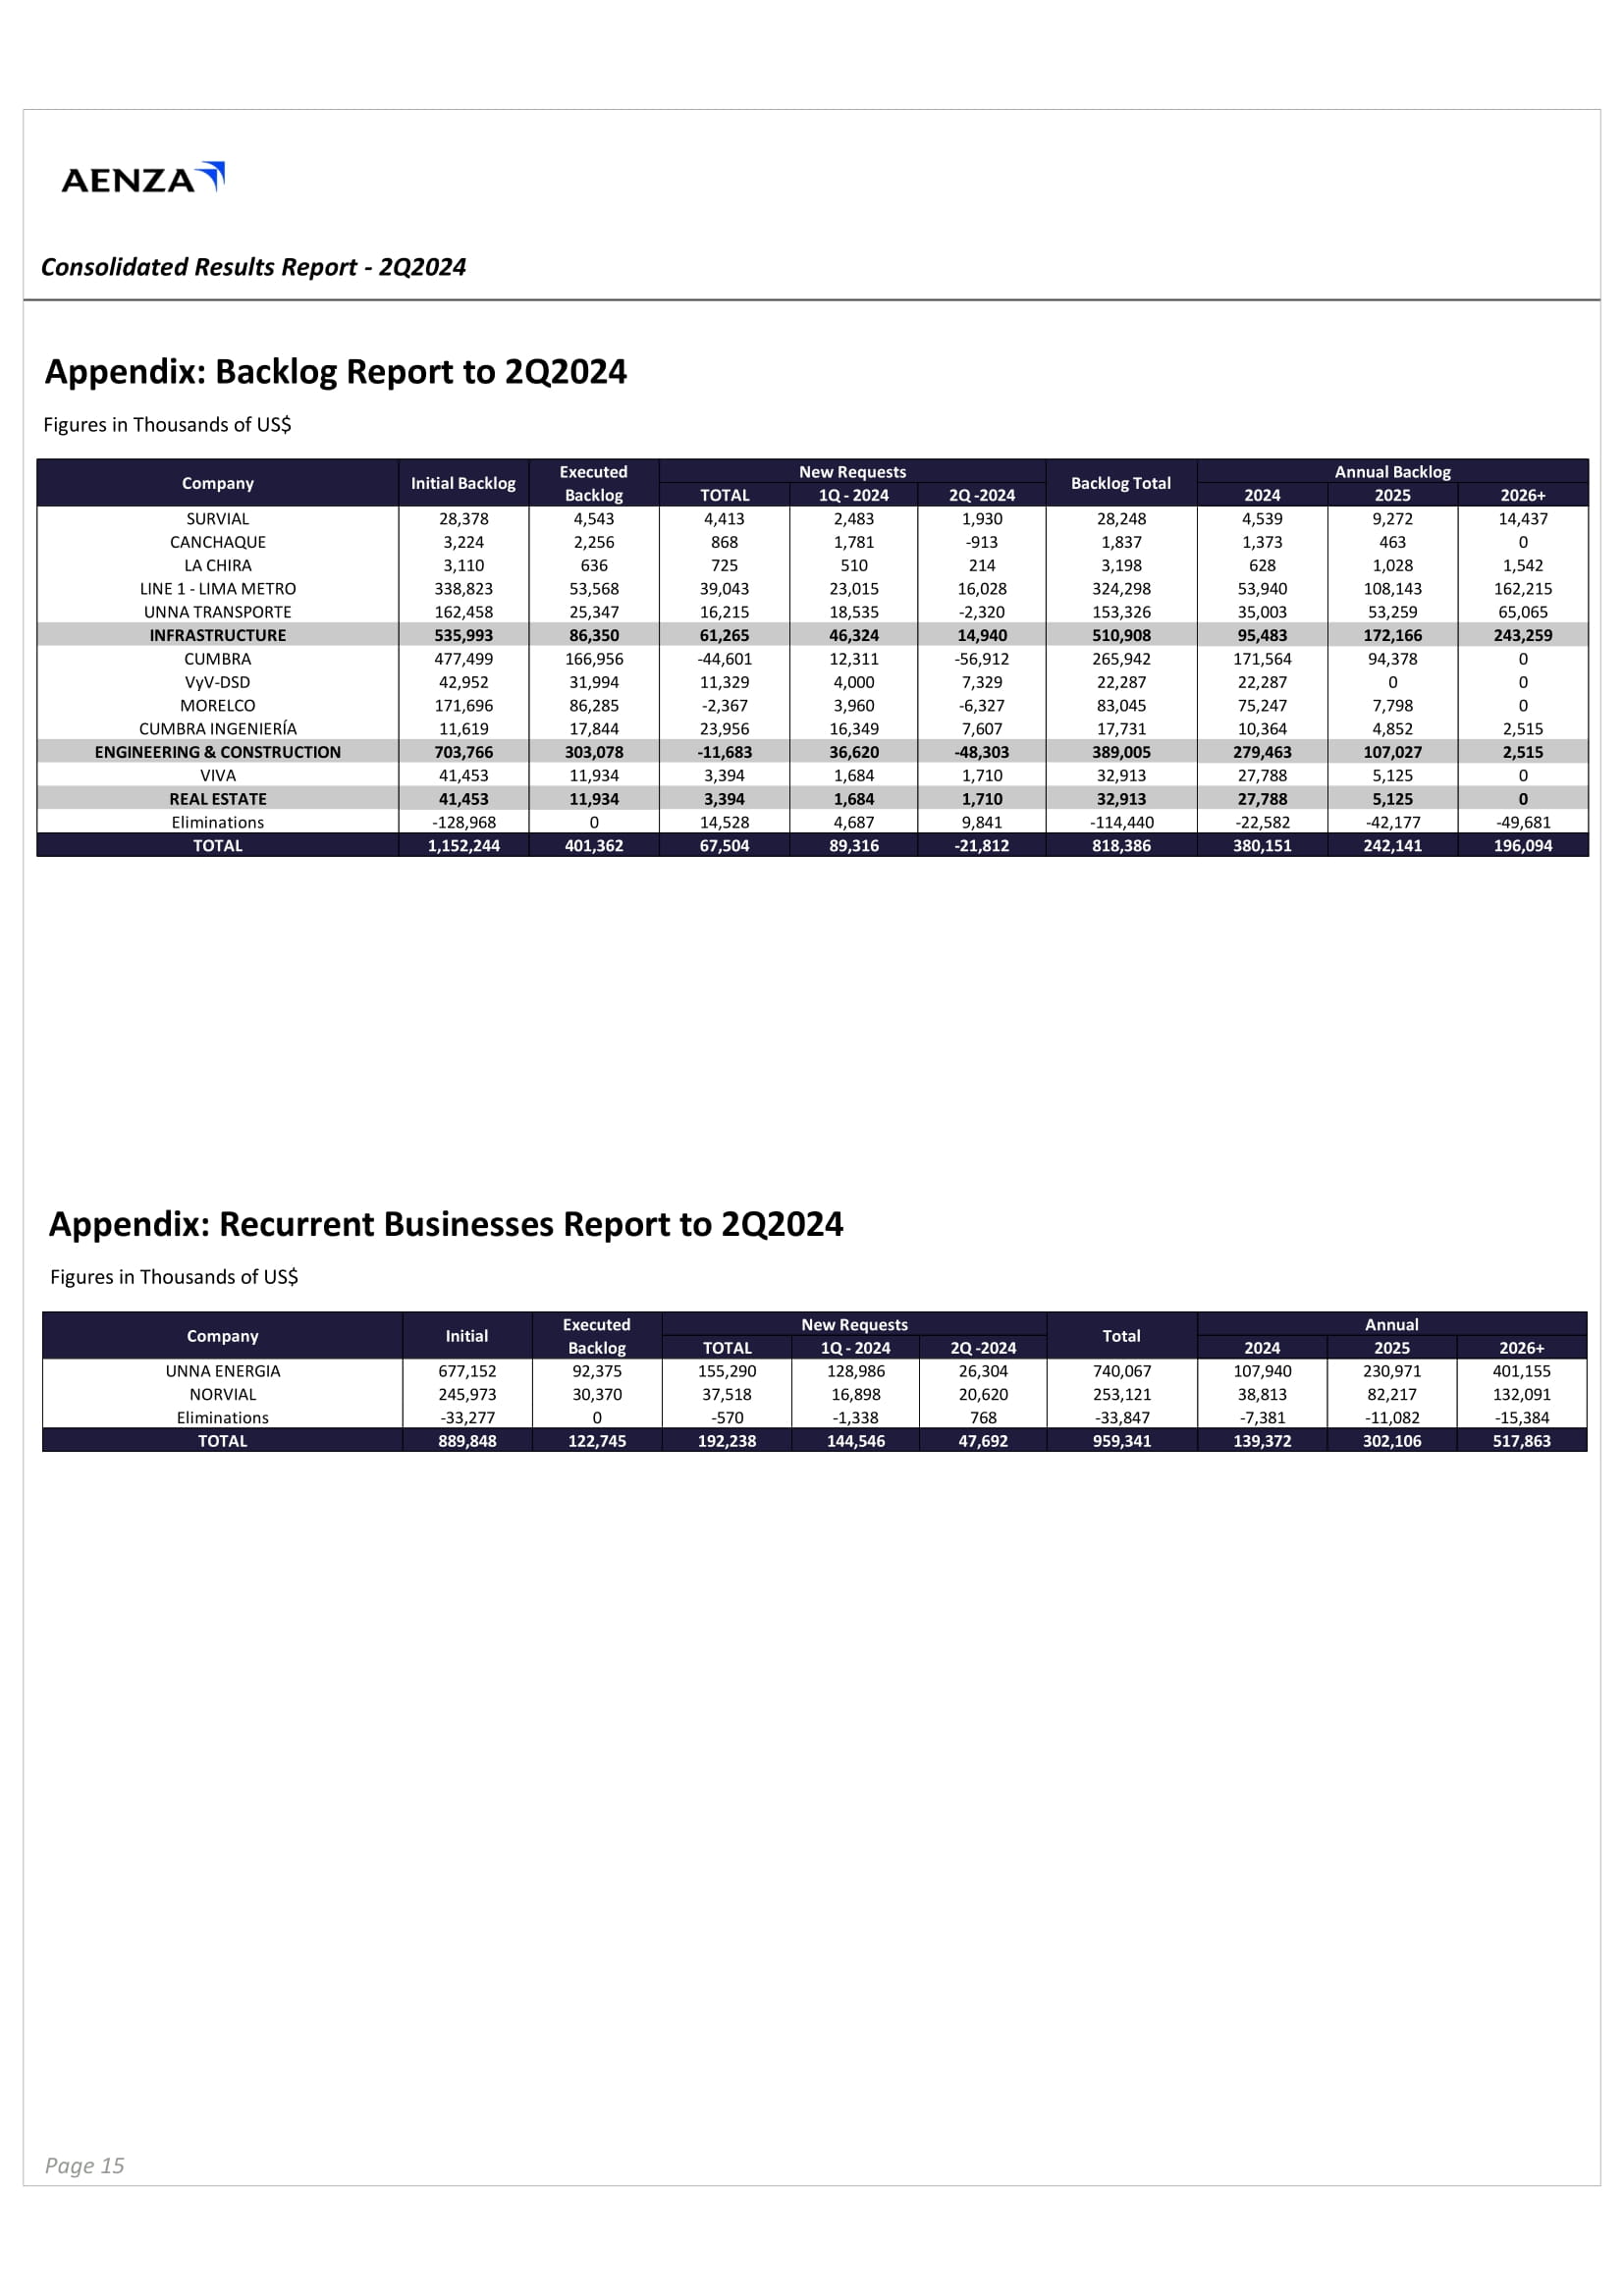
Consolidated Results Report - Third Quarter of 2014 Consolidated Results Report - 2Q2024 Appendix: Backlog Report to 2Q2024 Figures in Thousands of US$ Page 15 Appendix: Recurrent Businesses Report to 2Q2024 Figures in Thousands of US$ A nnual B a c k log B a c k log To t al N e w R e qu e s t s Executed Backlog I ni t ial B a c k log Company 2026+ 2025 2024 2 Q - 202 4 1 Q - 202 4 TOTAL 14,437 9,272 4,539 28,248 1,930 2,483 4,413 4,543 28,378 SURVIAL 0 463 1,373 1,837 - 913 1,781 868 2,256 3,224 CANCHAQUE 1,542 1,028 628 3,198 214 510 725 636 3,110 L A CHI R A 162,215 108,143 53,940 324,298 16,028 23,015 39,043 53,568 338,823 LINE 1 - LIMA METRO 65,065 53,259 35,003 153,326 - 2,320 18,535 16,215 25,347 162,458 U NN A T RA N S P OR T E 243,259 172,166 95,483 510,908 14,940 46,324 61,265 86,350 535,993 INFRASTRUCTURE 0 94,378 171,564 265,942 - 56,912 12,311 - 44,601 166,956 477,499 CUMBRA 0 0 22,287 22,287 7,329 4,000 11,329 31,994 42,952 VyV - DSD 0 7,798 75,247 83,045 - 6,327 3,960 - 2,367 86,285 171,696 MORELCO 2,515 4,852 10,364 17,731 7,607 16,349 23,956 17,844 11,619 CUMBRA INGENIERÍA 2,515 107,027 279,463 389,005 - 48,303 36,620 - 11,683 303,078 703,766 E N G I N EE R I NG & C O N S T R UC T I O N 0 5,125 27,788 32,913 1,710 1,684 3,394 11,934 41,453 VIVA 0 5,125 27,788 32,913 1,710 1,684 3,394 11,934 41,453 R E A L E S T A TE - 49,681 - 42,177 - 22,582 - 114,440 9,841 4,687 14,528 0 - 128,968 Eliminations 196,094 242,141 380,151 818,386 - 21,812 89,316 67,504 401,362 1,152,244 TOTAL
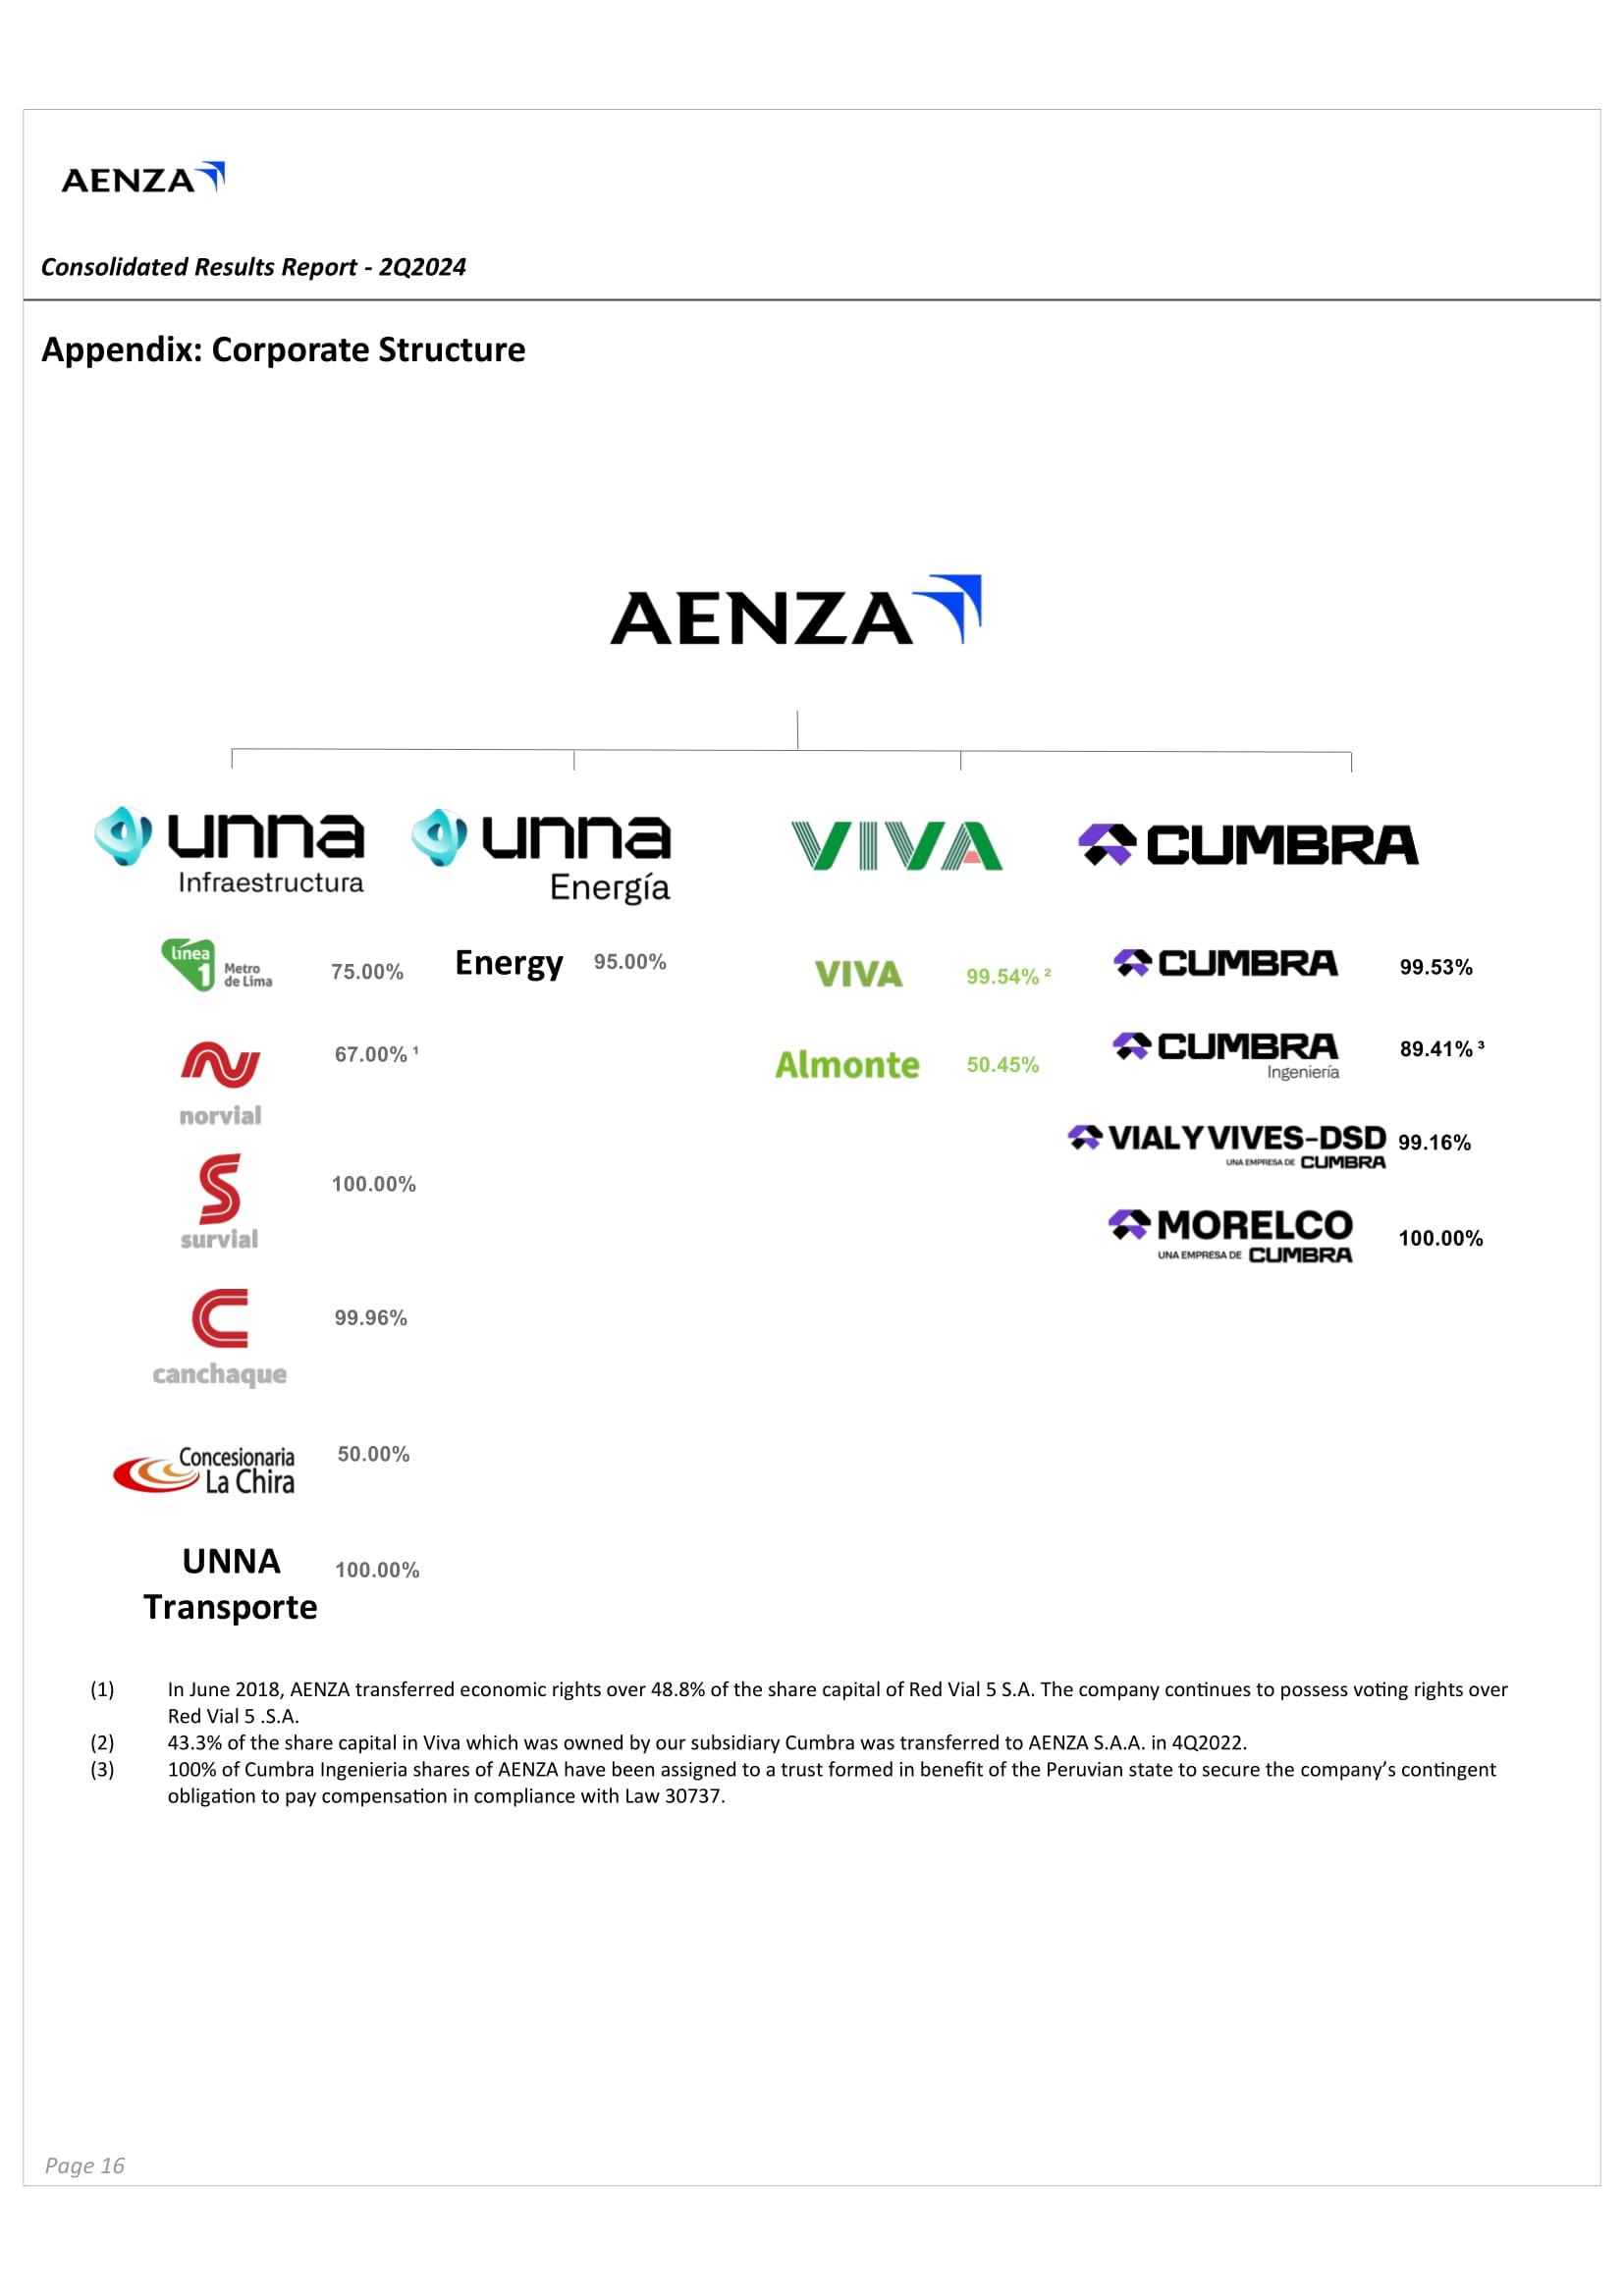
Consolidated Results Report - Third Quarter of 2014 Consolidated Results Report - 2Q2024 Appendix: Corporate Structure ( 1) ( 2) ( 3) In June 2018, AENZA transferred economic rights over 48.8% of the share capital of Red Vial 5 S.A. The company continues to possess voting rights over Red Vial 5 .S.A. 43.3% of the share capital in Viva which was owned by our subsidiary Cumbra was transferred to AENZA S.A.A. in 4Q2022. 100% of Cumbra Ingenieria shares of AENZA have been assigned to a trust formed in benefit of the Peruvian state to secure the company’s contingent obligation to pay compensation in compliance with Law 30737. 95 . 00 % E n e r gy Page 16 75 . 00% 100 . 00 % 99 . 96% 67 . 00 % ¹
Consolidated Results Report - Third Quarter of 2014 Consolidated Results Report - 2Q2024 Notes to the Consolidated Results Report i) EBITDA As of the information reported in the prospectus regarding the shares issuance registered before the SEC, the international market practice for the EBITDA calculation has been adopted . The EBITDA calculation will start from the net income, figure to which the tax - es, exchange rate differences and interests expenses will be returned to, whilst the depreciation and amortization will be added . This report includes, besides the EBITDA, the adjusted EBITDA, which is calculated as follows : Real Estate EBITDA : the proportional part of the land component of the units delivered during the period, will be added ; Metro de Lima : the financial expenses of the bond considered in the cost of sales by accounting standards, as well as the capital amortization applied to the corresponding long - term account receivable that is considered in the revenues by accounting stand - ards, will be added . ii) Backlog As of the information reported in the prospectus regarding the shares issuance registered before the SEC, the reporting method of the company’s Backlog will have modifications in the Infrastructure and Real Estate segments according to what is following de - scribed . Engineering and Construction will continue to report their backlog according to the local market, therefore the total signed contracts will be reported . Infrastructure : the Oil & Gas business and the Norvial toll road are not included as backlog Real Estate : only the sold units which are pending of delivery are reported as backlog Page 17 Contact: Investor Relations relacion.inversionistas@aenza.com.pe www.aenza.com.pe
Gold Flora (QB) (USOTC:GRAM)
Gráfica de Acción Histórica
De Mar 2025 a Abr 2025
.")
Gold Flora (QB) (USOTC:GRAM)
Gráfica de Acción Histórica
De Abr 2024 a Abr 2025
.")
