Annex V to Exhibit 99.2 –Sinqia financial results for quearter ended on March 31, 2023

| |
|
|
| |
|
|
|
1Q23
HIGHLIGHTS
|
 |
Annualized Net Revenues
R$642 million
R$164.2 million in the quarter, 18.3% higher than 1Q22
|
| |
|
 |
Annualized EBITDA
R$165 million
R$43.8 million in 1Q23, 20.9% higher than 1Q22, with EBITDA margin of 26.7%
|
| |
|
 |
Software ARR
R$556 million
21.7% higher than 1Q22
|
| |
|
|
São Paulo, May 8th, 2023. Sinqia S.A. (B3: SQIA3) (“Company”), a leading provider of technology for the financial system, announces the
consolidated results for the first quarter of 2023 (“1Q23”).
| (R$ '000) |
1Q23 |
1Q22 |
Var.
1Q23/1Q22 |
4Q22 |
Var.
1Q23/4Q22 |
LTM-1Q23 |
LTM-1Q22 |
Var. LTM-
1Q23/LTM-1Q22 |
| ARR |
556,217 |
457,106 |
21.7% |
520,754 |
6.8% |
556,217 |
457,106 |
21.7% |
| Net Revenue |
164,241 |
138,856 |
18.3% |
166,272 |
-1.2% |
641,857 |
423,214 |
51.7% |
| Software |
140,336 |
117,120 |
19.8% |
140,840 |
-0.4% |
545,696 |
341,510 |
59.8% |
| Service |
23,905 |
21,736 |
10.0% |
25,432 |
-6.0% |
96,161 |
81,702 |
17.7% |
| Gross Profit |
67,252 |
58,224 |
15.5% |
72,663 |
-7.4% |
271,976 |
167,739 |
62.1% |
| Gross Margin |
40.9% |
41.9% |
-1.0 p.p. |
43.7% |
-2.8 p.p. |
42.4% |
39.6% |
2.7 p.p. |
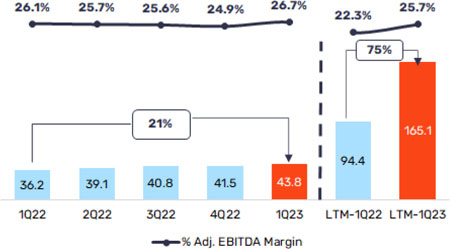
| Adjusted EBITDA |
43,795 |
36,235 |
20.9% |
41,473 |
5.6% |
165,133 |
94,358 |
75.0% |
| Adjusted EBITDA Margin |
26.7% |
26.1% |
0.6 p.p. |
24.9% |
1.7 p.p. |
25.7% |
22.3% |
3.4 p.p. |
| |
|
|
|
|
 |
SQIA3: R$ 15.62 per share
Total shares: 87,941,972
Market cap: R$ 1.37 billion |
 |
EARNINGS CALL
May 09th , 2023 (Tuesday)
11 a.m. (Brasília) / 10 a.m. (NYC) / 3 p.m. (London)
Access the videoconference via QR code or this link |
 |
| |
|
|
|
|

| MESSAGE FROM MANAGEMENT
The results of this first quarter confirm our successful growth trajectory. Since our IPO in 2013, driven by successful acquisitions and integrations, we
have multiplied by 13 our revenues. This significant progress has secured our market leadership. With a comprehensive product portfolio and a broad customer base, we have established a solid path for growth and profitability.
In this quarter, we reached a record in net sales of Software ARR, totaling R$14.7 million, already reaping the benefits of the recent commercial
reorganization, leveraging cross-selling opportunities, and increased investment in R&D. In addition, contractual adjustments for inflation and volume amounted to R$14.1 million, a strong pace despite inflationary slowdown, driven by a
significant increase in consumption. Thus, the Software ARR reached a record of R$556.2 million, a growth of 21.7% compared to the same period last year.
Net revenue in the quarter reached R$164.2 million (+18.3% vs. 1Q22), with Software growing 19.8% and Services 10.0%. As for profitability, Gross Profit
was R$ 67.3 million (+15.5% vs. 1Q22) and Adjusted EBITDA was R$43.8 million (+20.9% vs. 1Q22), with a record Adjusted EBITDA margin of 26.7%.
Efficiency is our watchword for 2023 and we are conducting several initiatives related to pricing, streamlining our cost structure, and optimizing
expenses that will generate significant results as early as the second half of 2023.
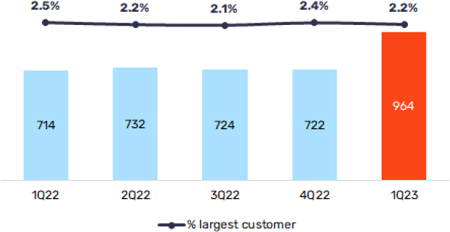
Also in the first quarter, we began the integration of Compliasset, our most recent acquisition and a reference in technological solutions for managing
regulatory compliance programs. With this consolidation, our customer base reached a record (964 clients), an important progress to further increase cross-selling.
Thinking in the long term, we continue to advance in the unification of our product portfolio, implementation agility, and ensuring customer satisfaction.
In terms of M&A, given the current economic scenario, we continue to analyze opportunities available in the market, but in a more selective and careful manner, seeking to maintain a healthy balance between leverage and growth. In the
first quarter, we amortized R$ 94.4 million in debt, maintaining the trend of reducing our financial leverage.
Aware of how seasonality impacts our numbers more noticeably in a scenario where there were no new relevant acquisitions, we are satisfied with the first
quarter, aware of the challenge imposed by the more adverse economic scenario, but confident in the results for the year. Our business is stable, predictable, and resilient.
| RECENT EVENTS
Election of the Board of Directors. At the Annual Shareholders’ Meeting held on April 27, our
shareholders elected the Board of Directors (“BD”) for the next term of office. The BD continues to include 7 members, 6 of which were re-elected and 1 new member joined the body. Mr. Carlos Furlan (Independent Member) no longer belongs to
the Board of Directors, having made valuable contributions to discussions on the Company's innovation program. Mr. Caio Lewkowicz (Independent Member) has joined the staff.
Election of the Fiscal Council. At the Annual Shareholders’ Meeting held on April 27, we
installed, for the 2nd consecutive year, the Fiscal Council (“FC”), whose purpose is to supervise the actions of managers and verify their compliance with
legal and statutory duties and give an opinion on the financial statements and reports of the management, among other attributions described in Art. 163 of the Brazilian Corporation Law. To compose the FC, the Shareholders’ Meeting elected
Messrs. Augusto Frederico Caetano Schaffer (Permanent Member) and Eduardo Sanchez Palma (Alternate); Wesley Montechiari Figueira (Permanent Member) and Cristiana Pereira (Alternate); and Hugo Paulo Ehrentreich (Permanent Member) and Bruno
Cals de Oliveira (Alternate).
Payment of Interest on Shareholders' Equity (“JSCP”). At the Annual Shareholders’ Meeting held
on April 27, we approved the payment of interest on shareholders’ equity for the year 2022, in the total amount of R$4,690,007.39, equivalent to R$0.055404594 per share. Shareholders on the base date of May 5, 2023 will be entitled to JSCP,
and the shares will be traded "ex-JSCP" as from May 8, 2023. JSCP payment will be made in reais, in one single installment, as from August 31, 2023, without monetary adjustment.
| OPERATING PERFORMANCE
Software ARR1
Software ARR reached a record R$556.2 million in 1Q23, 21.7% higher than that reported in 1Q22, representing a total addition of R$99.1 million. Excluding
Compliasset's portfolio of contracts, consolidated in the quarter, in the amount of R$6.7 million, the ARR for the quarter increased by 20.2% in the annual comparison, representing a net addition² of R$92.4 million.
The net addition highlighted above reflected the combination of accumulated balances of: (i) net sales³ in the amount of R$39.1 million, given our
satisfactory sales performance in the last 12 months, with an important contribution from cross-selling; and (ii) inflation and volume adjustments in the amount of R$53.2 million, 36.4% of which corresponded to inflationary transfers and
63.6% to increased volumes.
From the business point of view, the accumulated net addition amounted to R$37.7 million in Funds, R$22.2 million in Digital, R$15.2 million in Pension,
R$11.4 million in Banks and R$5.9 million in Consortium. Therefore, all business units had positive net additions. In the case of the first two units, that is, Funds and Digital, the last 12 months were marked by important sales and
expressive adjustments.
It is worth noting that the net addition in 1Q23 was a record, totaling R$28.7 million. Net sales of R$14.7 million were punctually high in the quarter,
as a result of the closing of some sales opportunities that were expected for 2022, combined with above-average churn, mainly driven by Pension customers especially those whose cancellation was foreseen at the time of the acquisition of
Mercer Seguridade. Inflation and volume adjustments of R$14.1 million remain strong despite the inflationary slowdown.
Software ARR (R$ million)

1 Annualized signed contracts,
implemented or not, which started to generate recurring revenues after completion of the implementation.
2 Result of the sum of
sales, contract cancellations and contractual adjustments.
3 Result of the sum of
sales and contract cancellations.
Number of Customers
The Company ended the first quarter of 2023 with 964 customers in its portfolio, or an increase of 250 customers compared to the same period in 2022, as a
result of the consolidation of Compliasset’s base and new sales. In 1Q23, the largest customer accounted for 2.2% of net revenues, down 0.3 p.p. against the same period of the previous year, reflecting the dilution of the portfolio on the
entry of new customers.
Number of Customers
| FINANCIAL PERFORMANCE
Net Revenues
Net revenues for the quarter reached R$164.2 million, up 18.3% over the same period of the previous year. This result was due to the 19.8% increase in the
Software unit, which totaled R$140.3 million, combined with the 10.0% growth in Services, which reached R$23.9 million. The highlight is the Funds unit, which outperformed the other units, having grown 50.2% compared to 1Q22.
Net Revenues (R$ million)

Recurring Revenues
In 1Q23, recurring revenues reached a record of R$139.5 million, up by 22.9% compared to 1Q22. The level of recurring revenues over total net revenues in
the quarter was 84.9%, up by 3.2 p.p. compared to the same period of the previous year. This performance is explained by both, the implementation of the backlog originated by new sales and the contractual readjustments that occurred in the
quarter.
It is also worth mentioning that the drop in variable revenues in the annual comparison was mainly due to one-off projects carried out in some Services
customers in 1Q22 that were not repeated in 1Q23. In the quarterly comparison, this reduction is explained by the seasonal effect of these revenues, given that Software customers tend to accelerate specific customization projects in the
last quarter, which is not observed in other quarters.
Recurring Revenues (R$ million)

Costs
Costs for the quarter totaled R$97.0 million, 20.3% higher than in 1Q22. This increase was mainly due to the growth in the number of employees and salary
adjustments arising from the collective bargaining agreement that was paid at the beginning of the year to workers located in São Paulo, which represented 67,0% of Company’s staff.
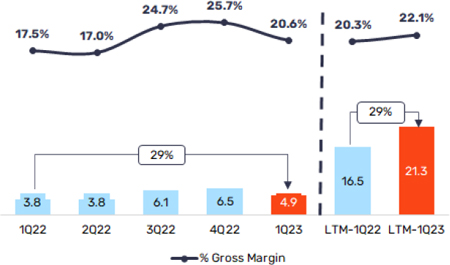
Gross Profit and Gross Margin
Gross profit for the quarter was R$67.3 million, or 15.5% higher than in the same quarter of the previous year, while the gross margin ended 1Q23 at
40.9%, or 1.0 p.p. below that observed in 1Q22. This performance was impacted by the reduction in variable income, and higher costs due to the increase in the number of employees and collective salary adjustments.
Total Gross Profit (R$ million)

| Software Unit
Software Net Revenues
In 1Q23, net revenues from Software reached R$140.3 million, up 19.8% over the same period of the previous year, mainly driven by the good performance
observed in all business units. We highlight that this growth already reflects the current dynamics of our business, in which we see an intensification of cross-selling with sales both between units, especially between (i) Funds and Pension
and (ii) Digital and Consortia, and within the same unit.
Net subscription revenue was R$116.3 million, 24.6% higher than the same period last year, as a result of the good performance of all business units, with
emphasis on Funds, which performed 49.4% above 1Q22, followed by Digital, which grew by 39.6% over the same period observed. Implementation and customization revenues, in turn, reached R$24.1 million, up by 1.2% over the same period of the
previous year.
Software Net Revenues (R$ thousand)

Software Costs
Software costs in the quarter totaled R$78.0 million, 24.4% higher than those reported in 1Q22, mainly reflecting the increase in teams in the period and
the salary adjustment in January for employees in São Paulo.
Depreciation and Amortization costs totaled R$2.1 million in the quarter.
Software Gross Profit and Gross Margin
Gross profit in the quarter reached R$62.3 million, up by 14.5% compared to 1Q22. The gross margin was 44.4% in the period, 2.0 p.p. below that reported
in the previous year, due to the increase in costs against revenues, as explained above.
Software Gross Profit (R$ million)

| Services Unit
Net Revenues from Services
Net Revenues from Services reached R$23.9 million in the quarter, up by 10.0% over the same period of the previous year. Outsourcing revenues was R$23.3
million, up by 15.3% over 1Q22, driven by the increase in operations within the customer’s base. The Projects line, in turn, totaled R$0.7 million, down by 56.0% compared to the amounts reported in 1Q22, mainly impacted by one-off projects
observed in 1Q22 that were not repeated in the current quarter.
Net Revenues from Services (R$ million)

Services Costs
The costs of services totaled R$19.0 million in the quarter, 5.9% above the amount reported in 1Q22, mainly as a result of the increase in expenses
related to the expansion of operations in some customers of the base.
Depreciation and Amortization costs in 1Q23 amounted to R$0.9 million.
Gross Profit and Gross Margin from Services
Gross profit from Services in 1Q23 reached R$4.9 million, up by 29.3% over the same period of the previous year, while the gross margin ended the quarter
at 20.6%, 3.1 p.p. higher than in 1Q22. This result is explained by the good performance of Outsourcing and the stabilization of turnover against the same period of the previous year. The margin expansion demonstrates that the offer of more
specialized services and the expansion of the customer base has proven to be an efficient strategy to circumvent the challenging scenario, where we see customers being more cautious due to the macroeconomic situation.
Gross Profit from Services (R$ million)
Operational Expenses
Selling, General & Administrative Expenses
Selling, general and administrative expenses totaled R$28.4 million, 17.2% higher
than in 1Q22. In the quarter, expenses represented 17.3% as a proportion of net revenues, remaining stable against the same period of the previous year, even considering higher expenses with senior management and the sales and corporate
teams, as well as the impacts of the annual collective bargaining agreement applied to the salary base in São Paulo as from Jan/23.
The main variations observed in the annual comparison occurred in the Sales and
Administrative lines, which, together, recorded a 34.8% growth against 1Q22, reflecting, as mentioned above, the increase in expenses due to the restructuring of the sales area, the reinforcement of the staff and senior management in
2022, and the impact of the annual collective bargaining agreement in São Paulo. Additionally, IT and Facilities expenses grew by 67.1% compared to the same period of the previous year, due to the increase in the number of employees and
salary adjustments, in addition to the increase in expenses with Information Security systems.
These increases were offset by the reduction in expenses with: (i) M&A, due to
the lower volume of ongoing transactions; (ii) R&DI, given the activation of expenses relating to project development, which amounted R$2.0 million; and (iii) Other expenses, which were positively impacted by the reversal of the
provision for labor and civil contingencies in the amount of R$2.3 million, with no cash impact.
General and Administrative Expenses (R$ thousand)
| (R$ ‘000) |
1Q23 |
1Q22 |
1Q23x1Q22 |
4Q22 |
1Q23x4Q22 |
LTM-1Q23 |
LTM-1Q22 |
LTM-1Q23 x
LTM-1Q22 |
| SG&A
Expenses |
(28,413) |
(24,238) |
17.2% |
(34,496) |
-17.6% |
(122,875) |
(81,561) |
50.7% |
| % of Revenue |
17.3% |
17.5% |
2.0 p.p. |
20.7% |
-3.4 p.p. |
19.1% |
19.3% |
-0.1 p.p. |
| Commercial |
(6,931) |
(5,817) |
19.2% |
(7,032) |
-1.4% |
(28,464) |
(17,357) |
64.0% |
| Marketing |
(991) |
(918) |
7.9% |
(1,613) |
-38.6% |
(5,052) |
(2,636) |
91.7% |
| Administrative |
(10,367) |
(7,014) |
47.8% |
(10,947) |
-5.3% |
(38,563) |
(22,880) |
68.5% |
| IT
and Facilities |
(5,982) |
(3,581) |
67.1% |
(5,449) |
9.8% |
(21,690) |
(14,318) |
51.5% |
| M&A |
(474) |
(1,394) |
-66.0% |
(469) |
1.2% |
(1,560) |
(4,282) |
-63.6% |
| R&DI |
(2,028) |
(2,709) |
-25.1% |
(1,520) |
33.5% |
(7,444) |
(10,647) |
-30.1% |
| Other
expenses |
(1,639) |
(2,805) |
-41.5% |
(7,466) |
-78.0% |
(20,102) |
(9,442) |
112.9% |
Depreciation and amortization
In the quarter, total depreciation and amortization, which includes the portion that
transits in costs and expenses, amounted to R$22.7 million, an increase of 41.2% over 1Q22. Depreciation of property and equipment totaled R$2.7 million, up by 9.9% compared to 1Q22, explained by the expansion in the lines of computers
and peripherals and property leases. Amortization, in turn, amounted to R$19.9 million, increase of 47.0%, mainly impacted by the addition of intangible assets in the period, arising from the acquisitions made by the Company.
Other amortizations were mainly impacted by the increase in the right of use of
leases, given the higher expenses with servers.
Depreciation and Amortization (R$ thousand)
| (R$ ’000) |
1Q23 |
1Q22 |
1Q23 x1Q22 |
4Q22 |
1Q23 x4Q22 |
LTM-1Q23 |
LTM-1Q22 |
LTM-1Q23 x
LTM-1Q22 |
| Depreciation and Amortization |
22,662 |
16,048 |
41.2% |
26,130 |
-13.3% |
101,740 |
57,463 |
77.1% |
| Depreciation |
2,746 |
2,498 |
9.9% |
4,445 |
-38.2% |
15,323 |
12,093 |
26.7% |
| Amortization |
19,916 |
13,550 |
47.0% |
21,685 |
-8.2% |
86,417 |
45,366 |
90.5% |
| Amortization of acquisitions (Sinqia) |
10,883 |
5,690 |
91.3% |
12,402 |
-12.2% |
50,490 |
22,596 |
123.4% |
| Amortization of acquisitions (minority interests) |
1,712 |
1,832 |
-6.6% |
1,693 |
1.1% |
7,076 |
4,147 |
70.6% |
| Other amortizations |
7,321 |
6,028 |
21.4% |
7,591 |
-3.6% |
28,851 |
18,623 |
54.9% |
EBITDA and Adjusted EBITDA
Adjusted EBITDA reached a record R$43.8 million in the quarter, up by 20.9% over the
same period of the previous year, with a 0.6 p.p. expansion in the EBITDA margin, which reached a record 26.7%. This performance is explained by the consolidation of results from the acquisitions carried out in recent quarters, combined
with scale gains obtained in the period, as well as the dilution of expenses.
The adjustment made in the quarter in the amount of R$2.0 million is related to
specific commitments assumed in the Company's recent acquisitions, and therefore, are not part of the day-to-day business and were adjusted accordingly.
Adjusted EBITDA (R$ million)
EBITDA reconciliation2 and Adjusted EBITDA3 (R$ thousand)
| (R$
'000) |
1Q23 |
1Q22 |
1Q23 x
1Q22 |
4Q22 |
1Q23 x
4Q22 |
LTM-1Q23 |
LTM-1Q22 |
LTM-1Q23
x
LTM-1Q22 |
| EBITDA |
41,770 |
36,235 |
15.3% |
41,473 |
0.7% |
161,763 |
92,997 |
73.9% |
| (+) Extraordinary expenses - earnout |
2,025 |
- |
n.a |
- |
n.a |
2,674 |
1.361 |
96.4% |
| (+} Extraordinary costs - integration |
- |
- |
n.a |
- |
n.a |
696 |
- |
n.a |
| Adjusted EBITDA |
43,795 |
36,235 |
20.9% |
41,473 |
5.6% |
165,133 |
94,358 |
75.0% |
| Adj. EBITDA Margin |
26.7% |
26.1% |
0.6 p.p. |
24.9% |
1.7 p.p. |
25.7% |
22.3% |
3.4 p.p. |
2EBITDA is a non-accounting measurement prepared by the Company in accordance with CVM Instruction 527/12, which consists of the net result for the period, plus taxes on profit, financial result, and depreciation and
amortization.
3Adjusted EBITDA, in turn, corresponds to EBITDA, plus extraordinary effects from acquisitions and non-recurring events.
Financial Result
The financial result for the quarter was negative by R$14.5 million. Financial income
reached R$5.9 million, up by 11.4% compared to 1Q22, explained by the increase in income from financial investments resulting from higher in interest rates. Financial expenses, in turn, totaled R$20.4 million, up by 14.4% over the same
period of the previous year. This performance is explained by the growth in: (i) interest on loans, impacted by both, the increase in debt due to the issuance of debentures in Jul/22 and the increase in interest on the outstanding
balance; and (ii) interest on investment acquisitions relating to obligations incurred in acquisitions made by the Company.
Due to the accounting of the options for the remaining installments of share capital
of the partial acquisitions carried out by the Company (FEPWeb, QuiteJá, LOTE45 and Compliasset), the financial result started to be impacted by the adjustment to present value of the options, however, without impact on cash. In 1Q23, the
net impact was negative by R$4.9 million, against R$7.2 million in 1Q22.
Financial Result (R$ thousand)
| (R$ '000) |
1Q23 |
1Q22 |
1Q23 x 1Q22 |
4Q22 |
1Q23 x 4Q22 |
LTM-1Q23 |
LTM-1Q22 |
LTM-1Q23 x LTM-
1Q22
|
| Financial Result |
(14,503) |
(12,532) |
15.7% |
12,389 |
n.a |
(29,939) |
(7,547) |
296.7% |
| Financial revenues |
5,896 |
5,292 |
11.4% |
34,073 |
-82.7% |
51,535 |
29,118 |
77.0% |
| Financial expenses |
(20,399) |
(17,824) |
14.4% |
(21,684) |
-5.9% |
(81,474) |
(36,665) |
122.2% |
Income Tax and Social Contribution
Income tax and social contribution amounted to R$2.8 million in 1Q23. Current taxes
amounted to R$3.4 million, down by 49.8% compared to 1Q22, mainly including the result of acquired companies that still operate on a presumed profit basis (FEPWeb, LOTE45 and Compliasset). Deferred taxes were positive by R$0.6 million,
with no cash impact, consisting of temporary differences, mainly due to the tax loss of subsidiaries that have fiscal goodwill amortization (R$ 6.3 million in 1Q23).
Income Tax and Social Contribution (R$ thousand)
| (R$ '000) |
1Q23 |
1Q22 |
1Q23 x 1Q22 |
4Q22 |
1Q23 x 4Q22 |
LTM-1Q23 |
LTM-1Q22 |
LTM-1Q23 x LTM-
1Q22
|
| Income Tax and Social
Contribution |
(2,836) |
(2,704) |
4.9% |
(12,474) |
-77.3% |
(15,709) |
(3,602) |
336.1% |
| Current |
(3,428) |
(6,824) |
-49.8% |
(7,268) |
-52.8% |
(22,979) |
(26,052) |
-11.8% |
| Defered |
592 |
4,120 |
-85.6% |
(5,206) |
n.a |
7,270 |
22,450 |
-67.6% |
Net Income
Net income attributable to Sinqia shareholders was R$0.7 million in 1Q23, explained by
the following variations: (i) increase of R$5.5 million in EBITDA; (ii) deterioration of R$6.6 million in Depreciation and Amortization; (iii) deterioration of R$2.0 million in the financial result; (iv) deterioration of R$132
thousand in income tax and social contribution; and (v) increase of R$1.0 million in non-controlling interest, relating to the portion of results of FEPWeb, QuiteJá, LOTE45 and Compliasset held by other partners.
Adjusted Net Income (R$ thousand)
| (R$ '000) |
1Q23 |
1Q22 |
1Q23 x 1Q22 |
4Q22 |
1Q23 x 4Q22 |
LTM-1Q23 |
LTM-1Q22 |
LTM-1Q23 x LTM-
1Q22
|
| Net income (attributable to shareholders) |
681 |
4,911 |
-86.1% |
14,672 |
-95.4% |
12,555 |
24,311 |
-48.4% |
| (+) Extraordinary effects |
2,025 |
- |
n.a |
- |
n.a |
3,370 |
1,361 |
147.5% |
| (+) Intangible Amortization from acquisitions |
7,183 |
3,755 |
91.3% |
8,185 |
-12.2% |
33,323 |
14,913 |
123.4% |
| (+) Recognition of put options (non-cash impact) |
3,252 |
4,754 |
-31.6% |
(13,748) |
n.a |
(3,291) |
4,754 |
n.a |
| Adjusted net income |
13,141 |
13,420 |
-2.1% |
9,109 |
44.3% |
45,958 |
45,340 |
1.4% |
| (+) Def. income tax/Social Contr. (goodwill on
acquisitions) |
4,140 |
1,951 |
112.2% |
2,099 |
97.3% |
10,142 |
5,625 |
80.3% |
Note: amounts net of tax calculated at a rate of 34% on the deductible
portion.
Excluding the items highlighted in the table above – relating to extraordinary
effects, amortization of intangible assets generated from acquisitions, and recognition of put options – the adjusted net income would have reached R$13.1 million.
Additionally, in the table above, it is possible to verify the breakdown of the tax
benefit of R$4.1 million resulting from the amortization of goodwill generated from the merger of the acquired companies into the Company in the quarter.
| FINANCIAL POSITION
Debt / Cash Position
The first quarter of the year showed an accelerated pace of financial deleveraging.
At the end of the period the Company disbursed R$94.4 million connected to the amortizations od debentures and the payment of obligations contracted through the M&A transactions.
At the end of 1Q23, the gross cash balance was R$97.8 million, R$92.0 million lower
than in 4Q22. In addition to the cash outflow mentioned above, the Company also disbursed R$18.0 million related to the upfront payment for Compliasset.
Adding the amount of R$24.9 million assigned as guarantee for the acquisition of ISP
and issuance of debentures and the balance of R$58.2 million related to Treasury Stocks, the Company ended the quarter with an adjusted gross cash balance of R$180.8 million.
Regarding gross debt, the balance at the end of the quarter totaled R$350.6 million,
a reduction of R$76.7 million compared to the balance at the end of 4Q22. This variation was due, as explained above, to debt amortization and payment of obligations related to M&As.
It is worth mentioning that, for gross debt calculation purposes, the balance
regarding the accounting of the potential purchase of the remaining stakes in FEPWeb, LOTE45, QuiteJá and Compliasset, classified under the caption “Option to sell non-controlling interest”, was not considered in non-current liabilities
in the balance sheet. Including this item in the gross debt balance, the adjusted gross debt was R$509.6 million.
At the end of 1Q23, the Company had a net debt of R$252.9 million, R$15.2 million
lower than in 4Q22, representing an indebtedness of 1.5x adjusted EBITDA of LTM-1Q23. Including adjustments to gross cash and debt, we ended the period with an adjusted net debt of R$328.8 million, representing a debt level of 2.0x
adjusted EBITDA of LTM-1Q23.
| (R$ '000) |
1Q23 |
4Q22 |
1Q23 x 4Q22 |
1Q22 |
1Q23 x 1Q22 |
| Liquidity |
|
|
|
|
|
| (+) Cash and cash
equivalents |
83,984 |
37,941 |
121.4% |
29,745 |
182.3% |
| (+) Financial investments |
13,772 |
151,766 |
-90.9% |
75,082 |
-81.7% |
| Cash and Investments |
97,756 |
189,707 |
-48.5% |
104,827 |
-6.7% |
| (+) Collateral balance |
24,873 |
38,563 |
-35.5% |
32,069 |
-22.4% |
| (+) Treasury stock |
58,194 |
58,174 |
n/a |
55,457 |
4.9% |
| Adjusted Gross Cash |
180,823 |
286,444 |
-36.9% |
192,353 |
-100.0% |
| Indebtedness |
|
|
|
|
|
| (-) Loans and financing |
218,163 |
236,656 |
-7.8% |
170,916 |
27.6% |
| (-) Investment
acquisition obligations |
132,483 |
190,738 |
-30.5% |
189,710 |
-30.2% |
| Gross Debt |
350,646 |
427,394 |
-18.0% |
360,626 |
-2.8% |
| (-) Non-controlling
interest put option |
158,945 |
142,270 |
11.7% |
150,349 |
5.7% |
| Adjusted Gross Debt |
509,591 |
569,664 |
-10.5% |
510,975 |
-0.3% |
| Leverage |
|
|
|
|
|
| (+) Adjusted Ebitda LTM |
165,133 |
157,573 |
4.8% |
94,358 |
75.0% |
| (-) Net debt |
252,890 |
237,687 |
6.4% |
255,799 |
-1.1% |
| Adjusted Net
Debt/Adjusted EBITDA LTM |
1.5 |
1.5 |
1.5% |
2.7 |
-43.5% |
| (-) Adjusted Net Debt |
328,768 |
283,220 |
16.1% |
318,622 |
3.2% |
| Adjusted Net
Debt/Adjusted EBITDA LTM |
2.0 |
1.8 |
10.8% |
3.4 |
-41.0% |
Cash Flow
The Company's cash flow, measured by Adjusted EBITDA less expenses related to
operations not captured by the indicator, namely those related to taxes, leasing, and Capex, totaled R$26,4 million. We highlight that Capex began to be impacted by the activation of a portion of R&D, in line with the strategy
signaled by the Company to use these investments to accelerate the integration of solutions and boost cross-sell sales.
It is important to note that, from a managerial perspective, the conversion of
Adjusted EBITDA into cash was 60.3%, a healthy level of profitability, demonstrating the predictability and security of our business model.
| (R$ '000) |
1Q23 |
| Adjusted EBITDA |
43,795 |
| Income Tax and Social Contribution |
(3,571) |
| Investments (Capex) |
(7,999) |
| Operating Lease |
(5,824) |
| Adjusted Cash Flow |
26,401 |
| CAPITAL MARKET
Share Performance
The Company’s shares (NM: SQIA3) ended the first quarter of 2023 quoted at R$15.74,
up by 4.7% compared to the quotation registered in the last quarter of 2022, of R$15.03. In the annual comparison, the quotation was 20.5% below that registered in the same quarter of 2022, of R$19.79.
Average Daily Traded Volume (ADTV)
The company’s shares experienced a reduction in liquidity during the first three
months of 2023, with an average trading volume of R$9.3 million, compared to R$ R$14.0 million in 4Q22, and R$17.6 million in 1Q22.
Shareholding Base
The shareholding base ended 1Q23 with 73.7 thousand shareholders, down by 5.3%
compared to 77.8 thousand in 4Q22, and down by 21.0% compared to 93.3 thousand in 1Q22.
Outstanding Shares (free float)
We ended 1Q23 with 81.1% of our shares in free float, 0.5p.p. lower than that
reported in 4Q22, which reached 81.6%, and -0.9p.p. less than that disclosed in the 1Q22, when we ended the quarter with a free float of 82.0%.
Statement from the Executive Board. According to items V and VI of article 27 of CVM Resolution 80/22, the Executive Board of Sinqia S.A. hereby declares that it has reviewed, discussed, and agreed on (i) the opinions
expressed in the independent auditors’ report, and (ii) the Financial Statements for the period ended March 30, 2023.
| EXHIBIT – FINANCIAL STATEMENTS
Exhibit I – Income Statement (Consolidated)
| (R$ '000) |
1Q23 |
1Q22 |
1Q23 x 1Q22 |
4Q22 |
1Q23 x 4Q22 |
LTM-1Q23 |
LTM-1Q22 |
LTM-1Q23 x
LTM-1Q22 |
| Gross Revenues |
182,731 |
153,689 |
18.9% |
184,072 |
-0.7% |
710,535 |
472,693 |
50.3% |
| Software |
155,867 |
129,253 |
20.6% |
155,505 |
0.2% |
602,515 |
380,866 |
58.2% |
| Subscription |
129,561 |
103,286 |
25.4% |
123,569 |
4.8% |
490,298 |
322,642 |
52.0% |
| Implementation |
26,306 |
25,967 |
1.3% |
31,937 |
-17.6% |
112,216 |
58,224 |
92.7% |
| Services |
26,864 |
24,437 |
9.9% |
28,567 |
-6.0% |
108,021 |
91,827 |
17.6% |
| Outsourcing |
26,080 |
22,650 |
15.1% |
27,867 |
-6.4% |
104,534 |
87,599 |
19.3% |
| Projects |
784 |
1,787 |
-56.1% |
700 |
12.0% |
3,487 |
4,228 |
-17.5% |
| Sales taxes |
(18,490) |
(14,833) |
24.7% |
(17,800) |
3.9% |
(68,678) |
(49,481) |
38.8% |
| Software |
(15,530) |
(12,133) |
28.0% |
(14,663) |
5.9% |
(56,817) |
(39,357) |
44.4% |
| Subscription |
(13,291) |
(9,954) |
33.5% |
(12,203) |
8.9% |
(47,889) |
(33,424) |
43.3% |
| Implementation |
(2,240) |
(2,179) |
2.8% |
(2,460) |
-8.9% |
(8,928) |
(5,932) |
50.5% |
| Services |
(2,959) |
(2,700) |
9.6% |
(3,137) |
-5.7% |
(11,862) |
(10,124) |
17.2% |
| Outsourcing |
(2,885) |
(2,524) |
14.3% |
(3,068) |
-6.0% |
(11,518) |
(9,700) |
18.7% |
| Projects |
(74) |
(176) |
-57.6% |
(67) |
11.7% |
(341) |
(424) |
-19.5% |
| Net Revenues |
164,241 |
138,856 |
18.3% |
166,272 |
-1.2% |
641,857 |
423,212 |
51.7% |
| Software |
140,336 |
117,120 |
19.8% |
140,842 |
-0.4% |
545,698 |
341,509 |
59.8% |
| Subscription |
116,270 |
93,331 |
24.6% |
111,365 |
4.4% |
442,409 |
289,218 |
53.0% |
| Implementation |
24,066 |
23,788 |
1.2% |
29,477 |
-18.4% |
103,288 |
52,292 |
97.5% |
| Services |
23,905 |
21,736 |
10.0% |
25,430 |
-6.0% |
96,159 |
81,703 |
17.7% |
| Outsourcing |
23,195 |
20,125 |
15.3% |
24,798 |
-6.5% |
93,015 |
77,899 |
19.4% |
| Projects |
709 |
1,611 |
-56.0% |
633 |
12.0% |
3,146 |
3,804 |
-17.3% |
| Net Revenues |
164,241 |
138,856 |
18.3% |
166,272 |
-1.2% |
641,857 |
423,212 |
51.7% |
| Recurring |
139,465 |
113,457 |
22.9% |
136,162 |
2.4% |
535,424 |
367,117 |
45.8% |
| Variable |
24,776 |
25,400 |
-2.5% |
30,109 |
-17.7% |
106,433 |
56,095 |
89.7% |
| % of Recurrence |
84.9% |
81.7% |
3.2 p.p. |
81.9% |
3.0 p.p. |
83.4% |
86.7% |
-3.3 p.p. |
| Costs |
(96,989) |
(80,632) |
20.3% |
(93,609) |
3.6% |
(369,881) |
(255,472) |
44.8% |
| Software |
(78,003) |
(62,701) |
24.4% |
(74,704) |
4.4% |
(295,003) |
(190,320) |
55.0% |
| Services |
(18,986) |
(17,931) |
5.9% |
(18,906) |
0.4% |
(74,878) |
(65,154) |
14.9% |
| Outsourcing |
(18,506) |
(16,806) |
10.1% |
(18,379) |
0.7% |
(71,799) |
(62,819) |
14.3% |
| Projects |
(480) |
(1,125) |
-57.3% |
(527) |
-9.0% |
(3,079) |
(2,334) |
31.9% |
| Gross profit |
67,252 |
58,225 |
15.5% |
72,663 |
-7.4% |
271,976 |
167,740 |
62.1% |
| Gross margin |
40.9% |
41.9% |
-1.0 p.p. |
43.7% |
-2.8 p.p. |
42.4% |
39.6% |
2.7 p.p. |
| Software |
62,333 |
54,418 |
14.5% |
66,136 |
-5.8% |
250,693 |
151,190 |
65.8% |
| Software gross mg. |
44.4% |
46.5% |
-2.0 p.p. |
47.0% |
-2.5 p.p. |
45.9% |
44.3% |
1.7 p.p. |
| Services |
4,919 |
3,805 |
29.3% |
6,526 |
-24.6% |
21,283 |
16,548 |
28.6% |
| Services gross mg. |
20.6% |
17.5% |
3.1 p.p. |
25.7% |
-5.1 p.p. |
22.1% |
20.3% |
1.9 p.p. |
| Outsourcing |
4,689 |
3,319 |
41.3% |
6,420 |
-27.0% |
21,216 |
15,079 |
40.7% |
| Outsourcing gross mg. |
20.2% |
16.5% |
3.7 p.p. |
25.9% |
-5.7 p.p. |
22.8% |
19.4% |
3.5 p.p. |
| Projects |
230 |
486 |
-52.8% |
106 |
116.3% |
67 |
1,469 |
-95.4% |
| Projects gross mg. |
32.4% |
30.2% |
0.1 p.p. |
16.8% |
15.6 p.p. |
2.1% |
38.6% |
-0.9 p.p. |
| Expenses |
(48,144) |
(38,037) |
26.6% |
(57,321) |
-16.0% |
(211,954) |
(132,204) |
60.3% |
| % of net revenues |
29.3% |
27.4% |
1.9 p.p. |
34.5% |
-5.2 p.p. |
33.0% |
31.2% |
1.8 p.p. |
| General/administrative |
(28,413) |
(24,238) |
17.2% |
(34,496) |
-17.6% |
(122,875) |
(81,561) |
50.7% |
| % of net revenues |
17.3% |
17.5% |
-0.2 p.p. |
20.7% |
-3.4 p.p. |
19.1% |
19.3% |
-0.1 p.p. |
| Depreciation/amort. |
(19,731) |
(13,799) |
43.0% |
(22,825) |
-13.6% |
(89,079) |
(50,643) |
75.9% |
| % of net revenues |
12.0% |
9.9% |
2.1 p.p. |
13.7% |
-1.7 p.p. |
13.9% |
12.0% |
0.2 p.p. |
| EBIT |
19,108 |
20,187 |
-5.3% |
15,342 |
24.5% |
60,022 |
35,535 |
68.9% |
| Financial result |
(14,503) |
(12,532) |
15.7% |
12,389 |
n.a |
(29,939) |
(7,547) |
296.7% |
| Financial income |
5,510 |
5,292 |
4.1% |
34,073 |
-83.8% |
51,149 |
29,118 |
75.7% |
| Financial expenses |
(20,012) |
(17,824) |
12.3% |
(21,684) |
-7.7% |
(81,087) |
(36,665) |
121.2% |
| EBT |
4,605 |
7,655 |
-39.8% |
27,731 |
-83.4% |
30,082 |
27,988 |
7.5% |
| Income tax/social contribution |
(2,836) |
(2,704) |
4.9% |
(12,474) |
-77.3% |
(15,709) |
(3,602) |
336.1% |
| Current |
(3,428) |
(6,824) |
-49.8% |
(7,268) |
-52.8% |
(22,979) |
(26,052) |
-11.8% |
| Deferred |
592 |
4,120 |
-85.6% |
(5,206) |
n.a |
7,270 |
22,450 |
-67.6% |
| Results after IT and SC |
1,769 |
4,951 |
-64.3% |
15,257 |
-88.4% |
14,374 |
24,385 |
-41.1% |
| Net margin |
1.1% |
3.6% |
-2.5 p.p. |
9.2% |
-8.1 p.p. |
2.2% |
5.8% |
-3.5 p.p. |
| Assigned to: |
|
|
|
|
|
|
|
|
| Sinqia's shareholders |
681 |
4,911 |
-86.1% |
14,672 |
-95.4% |
12,555 |
24,311 |
-48.4% |
| Net margin |
0.4% |
3.5% |
-3.1 p.p. |
8.8% |
-8.4 p.p. |
2.0% |
5.7% |
-3.8 p.p. |
| Minority interest |
1,088 |
40 |
2620.1% |
585 |
86.0% |
1,819 |
74 |
2358.1% |
| (R$ '000) |
1Q23 |
1Q22 |
1Q23 x 1Q22 |
4Q22 |
1Q23 x 4Q22 |
LTM-1Q23 |
LTM-1Q22 |
LTM-1Q23 x
LTM-1Q22 |
| |
|
|
|
|
|
|
|
|
| EBITDA |
41.770 |
36.235 |
15,3% |
41.473 |
0,7% |
161.763 |
92.997 |
73,9% |
| EBITDA margin |
25,4% |
26,1% |
-0,7 p.p. |
24,9% |
0,5 p.p. |
25,2% |
22,0% |
3,2 p.p. |
| (+) Extraordinary expenses |
2.025 |
- |
n.a |
- |
n.a |
2.674 |
1.361 |
n.a |
| (+) Extraordinary costs |
- |
- |
n.a |
- |
n.a |
696 |
- |
n.a |
| Adjusted EBITDA |
43.795 |
36.235 |
20,9% |
41.473 |
5,6% |
165.133 |
94.358 |
75,0% |
| Adj.
EBITDA Margin |
26,7% |
26,1% |
0,6 p.p. |
24,9% |
1,7 p.p. |
25,7% |
22,3% |
3,4 p.p. |
| |
|
|
|
|
|
|
|
|
| Net
income (attributable to shareholders) |
681 |
4.911 |
-86,1% |
14.672 |
-95,4% |
12.555 |
24.311 |
-48,4% |
| (+) Extraordinary effects |
2.025 |
- |
n.a |
- |
n.a |
3.370 |
1.361 |
147,5% |
| (+) Intangible Amortization from
acquisitions |
7.183 |
3.755 |
91,3% |
8.185 |
-12,2% |
33.323 |
14.913 |
123,4% |
| (+)Recognition of put options
(non-cash impact) |
3.252 |
4.754 |
-31,6% |
(13.748) |
n.a |
(3.291) |
4.754 |
n.a |
| Adjusted Net Income |
13.141 |
13.420 |
-2,1% |
22.857 |
-42,5% |
45.958 |
45.340 |
1,4% |
| (+)
Def. income tax/Social Contr. (goodwill on acquisitions) |
4.140 |
1.951 |
112,2% |
2.099 |
97,3% |
10.142 |
5.625 |
80,3% |
| Note: amounts net of tax calculated at a rate of 34% on
the deductible portion. |
|
|
|
|
|
|
Exhibit II – Balance Sheet (Consolidated)
| (R$ '000) |
03.31.2023 |
12.31.2022 |
Var. |
03.31.2022 |
Var. YoY |
| ASSETS |
1,483,013 |
1,555,313 |
-5% |
1,500,781 |
-1% |
| Current |
173,764 |
251,050 |
-31% |
167,574 |
4% |
| Cash and cash equivalents |
83,984 |
37,941 |
121% |
29,745 |
182% |
| Financial Investments |
13,772 |
151,766 |
-91% |
75,082 |
-82% |
| Receivables |
52,550 |
40,881 |
29% |
43,035 |
22% |
| Advanced expenses |
2,300 |
1,761 |
31% |
3,547 |
-35% |
| Taxes and contributions recoverable |
19,897 |
15,840 |
26% |
11,935 |
67% |
| Other receivables |
1,261 |
2,861 |
-56% |
4,230 |
-70% |
| Non-current |
1,309,249 |
1,304,263 |
0% |
1,333,207 |
-1.8% |
| Taxes and contributions recoverable |
1,505 |
1,321 |
14% |
3,051 |
-51% |
| Securities |
91,385 |
99,267 |
-8% |
93,241 |
-2% |
| Deposits in court |
126 |
197 |
-36% |
174 |
-28% |
| Deferred income tax and social contrib. |
79,217 |
78,625 |
1% |
74,782 |
6% |
| Property and equipment |
47,272 |
46,740 |
1% |
52,778 |
-10% |
| Intangible assets |
1,089,744 |
1,078,113 |
1% |
1,109,181 |
-1.8% |
| LIABILITIES AND EQUITY |
1,483,013 |
1,555,313 |
-5% |
1,500,781 |
-1% |
| Current |
253,859 |
278,582 |
-9% |
190,371 |
33.3% |
| Loans and financing |
74,552 |
74,500 |
0% |
36,746 |
102.9% |
| Leasing |
23,970 |
24,334 |
-1% |
16,804 |
43% |
| Trade payables |
8,213 |
4,724 |
74% |
9,675 |
-15% |
| Advances from customers |
14,356 |
19,363 |
-26% |
10,372 |
38% |
| Labor liabilities |
69,628 |
62,234 |
12% |
53,781 |
29% |
| Undistributed dividends |
4,690 |
7,720 |
-39% |
5,638 |
-17% |
| Tax liabilities |
6,415 |
6,115 |
5% |
10,200 |
-37% |
| Liabilities arising from invest. acquisition |
51,714 |
79,101 |
-35% |
46,620 |
10.9% |
| Other obligations |
321 |
491 |
-35% |
535 |
-40% |
| Non-current |
560,348 |
606,358 |
-8% |
637,321 |
-12% |
| Loans and financing |
143,611 |
162,156 |
-11% |
134,170 |
7% |
| Leasing |
42,559 |
47,439 |
-10% |
59,419 |
-28% |
| Provisions for legal proceedings |
134,464 |
139,866 |
-4% |
142,325 |
-6% |
| Advances from customers |
- |
2,990 |
- |
7,968 |
- |
| Liabilities arising from invest. acquisition |
80,769 |
111,637 |
-28% |
143,090 |
-44% |
| Non-controlling interest put option |
158,945 |
142,270 |
12% |
150,349 |
6% |
| Equity |
668,806 |
670,373 |
0% |
673,089 |
-1% |
| Share capital |
813,303 |
813,303 |
0% |
813,303 |
0% |
| Treasury shares |
(58,194) |
(58,174) |
0% |
(55,457) |
5% |
| Shares issue expenses |
(48,890) |
(48,890) |
0% |
(48,890) |
0% |
| Transactions with minority shareholders |
(136,563) |
(126,810) |
- |
(126,810) |
8% |
| Capital reserve |
12,643 |
11,867 |
7% |
12,329 |
3% |
| Earnings reserve |
59,010 |
59,010 |
0% |
46,915 |
26% |
| Retained Earnings |
681 |
- |
- |
4,911 |
-86% |
| Total Equity of controlling shareholders |
641,990 |
650,306 |
-1% |
646,301 |
-1% |
| Non-controlling interests |
26,816 |
20,067 |
34% |
26,788 |
0% |

Sinqia S.A. and Subsidiaries
Quarterly Information as of
March 31, 2023 and
Independent Auditor’s review report
TABLE OF CONTENTS
| Message from Management |
3 |
| Independent Auditor's Report on the Interim Financial Information |
4 |
| |
|
| Interim Financial Information |
|
| |
|
| Balance Sheet |
6 |
| Income Statements for the Periods |
9 |
| Statements of Comprehensive Income |
10 |
| Statement of Changes in Shareholders' Equity |
11 |
| Statements of Cash Flows |
12 |
| Statements of Value Added |
14 |
| Notes |
15 |
MESSAGE FROM MANAGEMENT
Dear Shareholders and other interested parties,
In compliance with legal provisions, Sinqia S.A., a provider of technology for
the financial sector, hereby submits to its shareholders and other interested parties for review the Management Report and the corresponding Interim Financial Information, together with the independent auditor's review report, for the
quarter ended March 31, 2023, prepared in accordance with CPC Technical Pronouncement No. 21 – Interim Statements and the international standard IAS 34 – Interim Financial Reporting.
RELATIONSHIP WITH INDEPENDENT AUDITORS
The Company's policy on contracting services not related to the external audit
with the independent auditors is based on principles that preserve their independence. These principles consist of internationally accepted standards, in which: (a) the auditor should not audit their own work; (b) the auditor should not
hold any management position at their client; and (c) the auditor must not create any conflicts with the interests of their clients.
Procedures used by the Company pursuant to article 17 of CVM Resolution No.
162 of July 13, 2022, the Company and its subsidiaries, as a formal procedure, prior to contracting professional services other than those related to external accounting auditing, consults with the independent auditors and the Board of
Directors to ensure that the provision of those other services does not affect their independence and objectivity, as necessary for the performance of audit services, and to obtain approval from its Board of Directors.
 |
Deloitte Touche Tohmatsu
Dr. Chucri Zaidan Avenue, 1.240 -
4th to 12th floors - Golden Tower
04711-130 - São Paulo - SP
Brazil
Tel.: + 55 (11) 5186-1000
Fax: + 55 (11) 5181-2911
www.deloitte.com.br |
(Convenience Translation into English from the Original
Previously Issued in Portuguese)
REPORT ON REVIEW OF INTERIM FINANCIAL INFORMATION
To the Shareholders, Board of Directors and Management of
Sinqia S.A.
Introduction
We have reviewed the accompanying individual and consolidated
interim financial information of Sinqia S.A. ( “Company”), included in the Interim Financial Information Form (ITR), for the three-month period ended March 31, 2023, which comprises the individual and consolidated balance sheet as at
March 31, 2023, and the corresponding individual and consolidated statements of income and comprehensive income, statements of changes in equity and individual and consolidated statements of cash flows for the three-month period then
ended, including the explanatory notes.
Management is responsible for the preparation of the individual
and consolidated interim financial information in accordance with technical pronouncement CPC 21 - Interim Financial Information and international standard IAS 34 - Interim Financial Reporting, issued by the International Accounting
Standards Board - IASB, as well as for the presentation of such information in accordance with the standards issued by the Brazilian Securities Commission (CVM), applicable to the preparation of Interim Financial Information (ITR). Our
responsibility is to express a conclusion on this interim financial information based on our review.
Scope of review
We conducted our review in accordance with Brazilian and
international standards on review of interim financial information (NBC TR 2410 and ISRE 2410 - Review of Interim Financial Information Performed by the Independent Auditor of the Entity, respectively). A review of interim financial
information consists of making inquiries, primarily of persons responsible for financial and accounting matters, and applying analytical and other review procedures. A review is substantially less in scope than an audit conducted in
accordance with the standards on auditing and, consequently, does not enable us to obtain assurance that we would become aware of all significant matters that might be identified in an audit. Accordingly, we do not express an audit
opinion.
Conclusion on the individual and consolidated interim
financial information
Based on our review, nothing has come to our attention that
causes us to believe that the accompanying individual and consolidated interim financial information included in the ITR referred to above was not prepared, in all material respects, in accordance with technical pronouncement CPC 21 and
international standard IAS 34, applicable to the preparation of ITR, and presented in accordance with the standards issued by CVM.
Deloitte refers to one or more of Deloitte Touche Tohmatsu
Limited (“DTTL”), its global network of member firms, and their related entities (collectively, the “Deloitte organization”). DTTL (also referred to as “Deloitte Global”) and each of its member firms and related entities are legally
separate and independent entities, which cannot obligate or bind each other in respect of third parties. DTTL and each DTTL member firm and related entity is liable only for its own acts and omissions, and not those of each other. DTTL
does not provide services to clients. Please see www.deloitte.com/about to learn more.
Deloitte is a leading global provider of audit and assurance,
consulting, financial advisory, risk advisory, tax and related services. Our global network of member firms and related entities in more than 150 countries and territories (collectively, the “Deloitte organization”) serves four out of
five Fortune Global 500® companies. Learn how Deloitte’s approximately 345,000 people make an impact that matters at www.deloitte.com.
© 2023. For information, contact Deloitte Global.

Emphasis of matter
Restatement of the corresponding figures for the quarter
ended March 31, 2022
As mentioned in note 1.4 to the individual and consolidated
financial statements, the corresponding figures for the quarter ended March 31, 2022, presented for purposes of comparison, were adjusted and are being restated as provided for in technical pronouncement CPC 23 - Accounting Policies,
Changes in Accounting Estimates and Errors. Our opinion is not qualified in respect of this matter.
Other matters
Statements of value added
The interim financial information referred to above includes the
individual and consolidated statements of value added for the three-month period ended March 31, 2023, prepared under the responsibility of the Company’s Management and presented as supplemental information for the purposes of
international standard IAS 34. These statements were subject to the review procedures performed together with the review of the ITR to reach a conclusion on whether they are reconciled with the interim financial information and the
accounting records, as applicable, and if their form and content are consistent with the criteria set forth in technical pronouncement CPC 09 - Statement of Value Added. Based on our review, nothing has come to our attention that causes
us to believe that these statements of value added were not prepared, in all material respects, in accordance with the criteria set out in this standard and consistently with respect to the individual and consolidated interim financial
information taken as a whole.
The accompanying individual and consolidated interim financial
information has been translated into English for the convenience of readers outside Brazil.
São Paulo, May 8, 2023
 |
 |
| DELOITTE TOUCHE TOHMATSU |
Fernando Augusto Lopes Silva |
| Auditores Independentes Ltda. |
Engagement Partner |
2023SP022976
© 2023. For information, contact Deloitte Global.
SINQIA S.A. AND SUBSIDIARIES
BALANCE SHEET AS OF MARCH 31, 2023 AND DECEMBER 31, 2022
(In thousands of Reais – R$)
| |
|
|
|
|
|
|
|
Individual |
|
|
|
|
|
Consolidated |
|
| |
|
Note |
|
|
03/31/2023 |
|
|
12/31/2022 |
|
|
03/31/2023 |
|
|
12/31/2022 |
|
| ASSETS |
|
|
|
|
|
|
|
|
|
|
|
|
|
|
|
| Current |
|
|
|
|
|
|
|
|
|
|
|
|
|
|
|
| Cash and cash equivalents |
|
|
6.a) |
|
|
|
48,828 |
|
|
|
11,769 |
|
|
|
83,984 |
|
|
|
37,941 |
|
| Financial investments |
|
|
6.b) |
|
|
|
13,772 |
|
|
|
98,369 |
|
|
|
13,772 |
|
|
|
151,766 |
|
| Accounts receivable |
|
|
7 |
|
|
|
25,983 |
|
|
|
19,335 |
|
|
|
52,550 |
|
|
|
40,881 |
|
| Prepaid expenses |
|
|
|
|
|
|
508 |
|
|
|
611 |
|
|
|
2,300 |
|
|
|
1,761 |
|
| Taxes and contributions recoverable |
|
|
8 |
|
|
|
14,332 |
|
|
|
11,743 |
|
|
|
19,897 |
|
|
|
15,840 |
|
| Other receivables |
|
|
|
|
|
|
292 |
|
|
|
1,009 |
|
|
|
1,261 |
|
|
|
2,861 |
|
| |
|
|
|
|
|
|
|
|
|
|
|
|
|
|
|
|
|
|
|
|
| Total current assets |
|
|
|
|
|
|
103,715 |
|
|
|
142,836 |
|
|
|
173,764 |
|
|
|
251,050 |
|
| |
|
|
|
|
|
|
|
|
|
|
|
|
|
|
|
|
|
|
|
|
| Non-current |
|
|
|
|
|
|
|
|
|
|
|
|
|
|
|
|
|
|
|
|
| Accounts receivable from related parties |
|
|
9.a) |
|
|
|
619 |
|
|
|
3,393 |
|
|
|
- |
|
|
|
- |
|
| Taxes and contributions recoverable |
|
|
8 |
|
|
|
1,328 |
|
|
|
945 |
|
|
|
1,505 |
|
|
|
1,321 |
|
| Financial assets |
|
|
6.c) |
|
|
|
39,848 |
|
|
|
52,972 |
|
|
|
91,385 |
|
|
|
99,267 |
|
| Court deposits |
|
|
16 |
|
|
|
104 |
|
|
|
187 |
|
|
|
126 |
|
|
|
197 |
|
| Deferred income tax and social contribution |
|
|
22.b) |
|
|
|
30,754 |
|
|
|
25,606 |
|
|
|
79,217 |
|
|
|
78,625 |
|
| Investments |
|
|
5 |
|
|
|
648,030 |
|
|
|
628,688 |
|
|
|
- |
|
|
|
- |
|
| Property and equipment |
|
|
10 |
|
|
|
17,924 |
|
|
|
17,410 |
|
|
|
47,272 |
|
|
|
46,740 |
|
| Intangible assets |
|
|
11 |
|
|
|
252,790 |
|
|
|
256,929 |
|
|
|
1,089,744 |
|
|
|
1,078,113 |
|
| |
|
|
|
|
|
|
|
|
|
|
|
|
|
|
|
|
|
|
|
|
| Total non-current assets |
|
|
|
|
|
|
991,397 |
|
|
|
986,130 |
|
|
|
1,309,249 |
|
|
|
1,304,263 |
|
| |
|
|
|
|
|
|
|
|
|
|
|
|
|
|
|
|
|
|
|
|
| TOTAL ASSETS |
|
|
|
|
|
|
1,095,112 |
|
|
|
1,128,966 |
|
|
|
1,483,013 |
|
|
|
1,555,313 |
|
The notes are an integral part of the financial information.
SINQIA S.A. AND SUBSIDIARIES
BALANCE SHEET AS OF MARCH 31, 2023 AND DECEMBER 31, 2022
(In thousands of Reais – R$)
| |
|
|
|
|
|
|
|
Individual |
|
|
|
|
|
Consolidated |
|
| |
|
Note |
|
|
03/31/2023 |
|
|
12/31/2022 |
|
|
03/31/2023 |
|
|
12/31/2022 |
|
| LIABILITIES |
|
|
|
|
|
|
|
|
|
|
|
|
|
|
|
| CURRENT |
|
|
|
|
|
|
|
|
|
|
|
|
|
|
|
| Debentures |
|
|
12 |
|
|
|
74,552 |
|
|
|
74,500 |
|
|
|
74,552 |
|
|
|
74,500 |
|
| Lease purchase |
|
|
24 |
|
|
|
18,452 |
|
|
|
18,937 |
|
|
|
23,970 |
|
|
|
24,334 |
|
| Trade accounts payable |
|
|
|
|
|
|
5,825 |
|
|
|
3,313 |
|
|
|
8,213 |
|
|
|
4,724 |
|
| Advances from customers |
|
|
|
|
|
|
6,968 |
|
|
|
7,945 |
|
|
|
14,356 |
|
|
|
19,363 |
|
| Labor liabilities |
|
|
13 |
|
|
|
45,639 |
|
|
|
38,619 |
|
|
|
69,628 |
|
|
|
62,234 |
|
| Earnings distributable |
|
|
17.2.b) |
|
|
|
4,690 |
|
|
|
4,690 |
|
|
|
4,690 |
|
|
|
7,720 |
|
| Tax liabilities |
|
|
14 |
|
|
|
1,216 |
|
|
|
1,065 |
|
|
|
6,415 |
|
|
|
6,115 |
|
| Investment acquisition liabilities |
|
|
15 |
|
|
|
14,680 |
|
|
|
14,384 |
|
|
|
51,714 |
|
|
|
79,101 |
|
| Other accounts payable |
|
|
|
|
|
|
327 |
|
|
|
61 |
|
|
|
321 |
|
|
|
491 |
|
| |
|
|
|
|
|
|
|
|
|
|
|
|
|
|
|
|
|
|
|
|
| Total current liabilities |
|
|
|
|
|
|
172,349 |
|
|
|
163,514 |
|
|
|
253,859 |
|
|
|
278,582 |
|
| |
|
|
|
|
|
|
|
|
|
|
|
|
|
|
|
|
|
|
|
|
| NON-CURRENT |
|
|
|
|
|
|
|
|
|
|
|
|
|
|
|
|
|
|
|
|
| Debentures |
|
|
12 |
|
|
|
143,611 |
|
|
|
162,156 |
|
|
|
143,611 |
|
|
|
162,156 |
|
| Lease purchase |
|
|
24 |
|
|
|
24,770 |
|
|
|
29,684 |
|
|
|
42,559 |
|
|
|
47,439 |
|
| Provisions for lawsuits |
|
|
16 |
|
|
|
33,664 |
|
|
|
36,607 |
|
|
|
134,464 |
|
|
|
139,866 |
|
| Advances from customers |
|
|
|
|
|
|
- |
|
|
|
- |
|
|
|
- |
|
|
|
2,990 |
|
| Investment acquisition liabilities |
|
|
15 |
|
|
|
25,845 |
|
|
|
35,918 |
|
|
|
80,769 |
|
|
|
111,637 |
|
| Non-controlling interest put option |
|
|
25 |
|
|
|
52,883 |
|
|
|
50,781 |
|
|
|
158,945 |
|
|
|
142,270 |
|
| |
|
|
|
|
|
|
|
|
|
|
|
|
|
|
|
|
|
|
|
|
| Total non-current liabilities |
|
|
|
|
|
|
280,773 |
|
|
|
315,146 |
|
|
|
560,348 |
|
|
|
606,358 |
|
SINQIA S.A. AND SUBSIDIARIES
BALANCE SHEET AS OF MARCH 31, 2023 AND DECEMBER 31, 2022
(In thousands of Reais – R$)
| |
|
|
|
|
|
|
|
Individual |
|
|
|
|
|
Consolidated |
|
| |
|
Note |
|
|
03/31/2023 |
|
|
12/31/2022 |
|
|
03/31/2023 |
|
|
12/31/2022 |
|
| |
|
|
|
|
|
|
|
|
|
|
|
|
|
|
|
| SHAREHOLDERS’ EQUITY |
|
|
|
|
|
|
|
|
|
|
|
|
|
|
|
|
|
|
|
|
| Capital stock |
|
|
17.1 |
|
|
|
813,303 |
|
|
|
813,303 |
|
|
|
813,303 |
|
|
|
813,303 |
|
| Treasury shares |
|
|
17.4 |
|
|
|
(58,194) |
|
|
|
(58,174) |
|
|
|
(58,194) |
|
|
|
(58,174) |
|
| Share issuing costs |
|
|
17.5 |
|
|
|
(48,890) |
|
|
|
(48,890) |
|
|
|
(48,890) |
|
|
|
(48,890) |
|
| Transactions with non-controlling shareholders |
|
|
|
|
|
|
(136,563) |
|
|
|
(126,810) |
|
|
|
(136,563) |
|
|
|
(126,810) |
|
| Capital reserve |
|
|
17.3 |
|
|
|
12,643 |
|
|
|
11,867 |
|
|
|
12,643 |
|
|
|
11,867 |
|
| Revenue reserves |
|
|
17.2 |
|
|
|
59,010 |
|
|
|
59,010 |
|
|
|
59,010 |
|
|
|
59,010 |
|
| Retained earnings |
|
|
|
|
|
|
681 |
|
|
|
- |
|
|
|
681 |
|
|
|
- |
|
| |
|
|
|
|
|
|
|
|
|
|
|
|
|
|
|
|
|
|
|
|
| Total controlling shareholders' equity |
|
|
|
|
|
|
641,990 |
|
|
|
650,306 |
|
|
|
641,990 |
|
|
|
650,306 |
|
| |
|
|
|
|
|
|
|
|
|
|
|
|
|
|
|
|
|
|
|
|
| Non-controlling interest |
|
|
|
|
|
|
- |
|
|
|
- |
|
|
|
26,816 |
|
|
|
20,067 |
|
| |
|
|
|
|
|
|
|
|
|
|
|
|
|
|
|
|
|
|
|
|
| Total shareholders’ equity |
|
|
|
|
|
|
641,990 |
|
|
|
650,306 |
|
|
|
668,806 |
|
|
|
670,373 |
|
| |
|
|
|
|
|
|
|
|
|
|
|
|
|
|
|
|
|
|
|
|
| TOTAL LIABILITIES AND SHAREHOLDERS' EQUITY |
|
|
|
|
|
|
1,095,112 |
|
|
|
1,128,966 |
|
|
|
1,483,013 |
|
|
|
1,555,313 |
|
The notes are an integral part of the financial information.
SINQIA S.A. AND SUBSIDIARIES
INCOME STATEMENTS
FOR THE QUARTERS ENDED MARCH 31, 2023 AND 2022
(In thousands of Reais (R$), except basic/diluted earnings per share)
| |
|
|
|
|
|
|
|
Individual |
|
|
|
|
|
Consolidated |
|
| |
|
Note |
|
|
03/31/2023 |
|
|
03/31/2022 |
|
|
03/31/2023 |
|
|
03/31/2022 |
|
| |
|
|
|
|
|
|
|
(Restated) |
|
|
|
|
|
(Restated) |
|
| |
|
|
|
|
|
|
|
|
|
|
|
|
|
|
|
| NET REVENUES |
|
|
18 |
|
|
|
72,054 |
|
|
|
67,834 |
|
|
|
164,241 |
|
|
|
138,856 |
|
| |
|
|
|
|
|
|
|
|
|
|
|
|
|
|
|
|
|
|
|
|
| Cost of services provided |
|
|
19 |
|
|
|
(51,216) |
|
|
|
(35,711) |
|
|
|
(96,989) |
|
|
|
(80,632) |
|
| |
|
|
|
|
|
|
|
|
|
|
|
|
|
|
|
|
|
|
|
|
| GROSS PROFIT |
|
|
|
|
|
|
20,838 |
|
|
|
32,123 |
|
|
|
67,252 |
|
|
|
58,224 |
|
| |
|
|
|
|
|
|
|
|
|
|
|
|
|
|
|
|
|
|
|
|
| General, administrative and selling expenses |
|
|
20 |
|
|
|
(29,753) |
|
|
|
(14,584) |
|
|
|
(48,144) |
|
|
|
(38,037) |
|
| Equity pickup |
|
|
5 |
|
|
|
14,793 |
|
|
|
(52) |
|
|
|
- |
|
|
|
- |
|
| |
|
|
|
|
|
|
|
|
|
|
|
|
|
|
|
|
|
|
|
|
| OPERATING PROFIT BEFORE FINANCIAL RESULT |
|
|
|
|
|
|
5,878 |
|
|
|
17,487 |
|
|
|
19,108 |
|
|
|
20,187 |
|
| |
|
|
|
|
|
|
|
|
|
|
|
|
|
|
|
|
|
|
|
|
| Financial result, net |
|
|
21 |
|
|
|
(10,346) |
|
|
|
(9,219) |
|
|
|
(14,503) |
|
|
|
(12,532) |
|
| |
|
|
|
|
|
|
|
|
|
|
|
|
|
|
|
|
|
|
|
|
| PROFIT/(LOSS) BEFORE INCOME TAX AND SOCIAL CONTRIBUTION |
|
|
|
|
|
|
(4,468) |
|
|
|
8,268 |
|
|
|
4,605 |
|
|
|
7,655 |
|
| |
|
|
|
|
|
|
|
|
|
|
|
|
|
|
|
|
|
|
|
|
| INCOME TAX AND SOCIAL CONTRIBUTION |
|
|
|
|
|
|
|
|
|
|
|
|
|
|
|
|
|
|
|
|
| Current |
|
|
22.a) |
|
|
|
- |
|
|
|
(2,307) |
|
|
|
(3,428) |
|
|
|
(6,824) |
|
| Deferred |
|
|
22.a) |
|
|
|
5,149 |
|
|
|
(1,050) |
|
|
|
592 |
|
|
|
4,120 |
|
| |
|
|
|
|
|
|
|
|
|
|
|
|
|
|
|
|
|
|
|
|
| NET INCOME FOR THE PERIOD |
|
|
|
|
|
|
681 |
|
|
|
4,911 |
|
|
|
1,769 |
|
|
|
4,951 |
|
| ATTRIBUTABLE TO: |
|
|
|
|
|
|
|
|
|
|
|
|
|
|
|
|
|
|
|
|
| Controlling shareholders’ interest |
|
|
|
|
|
|
681 |
|
|
|
4,911 |
|
|
|
681 |
|
|
|
4,911 |
|
| Non-controlling shareholders’ interest |
|
|
|
|
|
|
- |
|
|
|
- |
|
|
|
1,088 |
|
|
|
40 |
|
| EARNINGS PER SHARE (in Reais (R$)) |
|
|
|
|
|
|
|
|
|
|
|
|
|
|
|
|
|
|
|
|
| Basic - attributable earnings per share for the period |
|
|
23 |
|
|
|
0.008 |
|
|
|
0.058 |
|
|
|
0.008 |
|
|
|
0.058 |
|
| Diluted - attributable earnings per share for the period |
|
|
23 |
|
|
|
0.008 |
|
|
|
0.057 |
|
|
|
0.008 |
|
|
|
0.057 |
|
The notes are an integral part of the financial information.
SINQIA S.A. AND SUBSIDIARIES
STATEMENTS OF COMPREHENSIVE INCOME
FOR THE QUARTERS ENDED MARCH 31, 2023 AND 2022
(In thousands of Reais – R$)
| |
|
|
|
|
Individual |
|
|
Consolidated |
|
| |
|
|
03/31/2023 |
|
|
|
03/31/2022 |
|
|
|
03/31/2023 |
|
|
|
03/31/2022 |
|
| |
|
|
|
|
|
|
(Restated) |
|
|
|
|
|
|
|
(Restated) |
|
| |
|
|
|
|
|
|
|
|
|
|
|
|
|
|
|
|
| NET INCOME FOR THE PERIOD |
|
|
681 |
|
|
|
4,911 |
|
|
|
1,769 |
|
|
|
4,951 |
|
| |
|
|
|
|
|
|
|
|
|
|
|
|
|
|
|
|
| Other comprehensive income |
|
|
- |
|
|
|
- |
|
|
|
- |
|
|
|
- |
|
| |
|
|
|
|
|
|
|
|
|
|
|
|
|
|
|
|
| TOTAL COMPREHENSIVE INCOME FOR THE PERIOD |
|
|
681 |
|
|
|
4,911 |
|
|
|
1,769 |
|
|
|
4,951 |
|
| |
|
|
|
|
|
|
|
|
|
|
|
|
|
|
|
|
| ATTRIBUTABLE TO: |
|
|
|
|
|
|
|
|
|
|
|
|
|
|
|
|
| Controlling shareholders |
|
|
681 |
|
|
|
4,911 |
|
|
|
681 |
|
|
|
4,911 |
|
| Non-controlling shareholders |
|
|
- |
|
|
|
- |
|
|
|
1,088 |
|
|
|
40 |
|
The notes are an integral part of the financial information.
SINQIA S.A. AND SUBSIDIARIES
STATEMENT OF CHANGES IN SHAREHOLDERS' EQUITY
FOR THE QUARTERS ENDED MARCH 31, 2023 AND 2022
(In thousands of Reais – R$)
| |
|
|
|
|
|
|
|
|
|
|
|
|
|
Revenue Reserves |
|
|
|
|
|
|
|
|
|
| |
|
Note |
|
Capital stock |
|
Capital reserve |
|
Treasury shares |
|
Share issuing costs |
|
Transactions with non-controlling shareholders |
|
Legal reserve |
|
Profit retention |
|
Retained earnings |
|
Shareholders’
equity
|
|
Non-controlling interest |
|
Consolidated Shareholders' Equity |
|
| Balances as of December 31, 2021 (Restated) |
|
|
|
813,303 |
|
12,227 |
|
(40,896) |
|
(48,890) |
|
(61,208) |
|
3,542 |
|
43,373 |
|
- |
|
721,451 |
|
19,081 |
|
740,532 |
|
| |
|
|
|
|
|
|
|
|
|
|
|
|
|
|
|
|
|
|
|
|
|
|
|
|
|
| Net income for the period |
|
|
|
- |
|
- |
|
- |
|
- |
|
- |
|
- |
|
- |
|
4,911 |
|
4,911 |
|
40 |
|
4,951 |
|
| Non-controlling interest put option |
|
|
|
- |
|
- |
|
- |
|
- |
|
(65,602) |
|
- |
|
- |
|
- |
|
(65,602) |
|
- |
|
(65,602) |
|
| Acquisition of non-controlling interest |
|
|
|
- |
|
- |
|
- |
|
- |
|
- |
|
- |
|
- |
|
- |
|
- |
|
7,666 |
|
7,666 |
|
| Share-based compensation |
|
17 |
|
- |
|
102 |
|
- |
|
- |
|
- |
|
- |
|
- |
|
- |
|
102 |
|
- |
|
102 |
|
| Purchase of treasury shares |
|
17 |
|
- |
|
- |
|
(14,561) |
|
- |
|
- |
|
- |
|
- |
|
- |
|
(14,561) |
|
- |
|
(14,561) |
|
| Balances as of March 31, 2022 (Restated) |
|
|
|
813,303 |
|
12,329 |
|
(55,457) |
|
(48,890) |
|
(126,810) |
|
3,542 |
|
43,373 |
|
4,911 |
|
646,301 |
|
26,787 |
|
673,088 |
|
| |
|
|
|
|
|
|
|
|
|
|
|
|
|
Revenue Reserves |
|
|
|
|
|
|
|
|
|
| |
|
Note |
|
Capital stock |
|
Capital reserve |
|
Treasury shares |
|
Share issuing costs |
|
Transactions with non-controlling shareholders |
|
Legal reserve |
|
Profit retention |
|
Retained earnings |
|
Shareholders’
equity
|
|
Non-controlling interest |
|
Consolidated Shareholders' Equity |
|
| Balances as of December 31, 2022 |
|
|
|
813,303 |
|
11,867 |
|
(58,174) |
|
(48,890) |
|
(126,810) |
|
4,381 |
|
54,629 |
|
- |
|
650,306 |
|
20,067 |
|
670,373 |
|
| |
|
|
|
|
|
|
|
|
|
|
|
|
|
|
|
|
|
|
|
|
|
|
|
|
|
| Net income for the period |
|
|
|
- |
|
- |
|
- |
|
- |
|
- |
|
- |
|
- |
|
681 |
|
681 |
|
1,088 |
|
1,769 |
|
| Non-controlling interest put option |
|
|
|
- |
|
- |
|
- |
|
- |
|
(9,753) |
|
- |
|
- |
|
- |
|
(9,753) |
|
- |
|
(9,753) |
|
| Acquisition of non-controlling interests |
|
|
|
- |
|
- |
|
- |
|
- |
|
- |
|
- |
|
- |
|
- |
|
- |
|
5,661 |
|
5,661 |
|
| Purchase of treasury shares |
|
17 |
|
- |
|
- |
|
(45) |
|
- |
|
- |
|
- |
|
- |
|
- |
|
(45) |
|
- |
|
(45) |
|
| Share-based compensation |
|
|
|
- |
|
141 |
|
- |
|
- |
|
- |
|
- |
|
- |
|
- |
|
141 |
|
- |
|
141 |
|
| Stock options exercised |
|
|
|
- |
|
635 |
|
25 |
|
- |
|
- |
|
- |
|
- |
|
- |
|
660 |
|
- |
|
660 |
|
| Balances as of March 31, 2023 |
|
|
|
813,303 |
|
12,643 |
|
(58,194) |
|
(48,890) |
|
(136,563) |
|
4,381 |
|
54,629 |
|
681 |
|
641,990 |
|
26,816 |
|
668,806 |
|
The notes are an integral part of the financial information.
SINQIA S.A. AND SUBSIDIARIES
STATEMENT CASH FLOWS
FOR THE QUARTERS ENDED ON MARCH 31, 2023 AND 2022
(In thousands of Reais – R$)
| |
|
|
|
Individual |
|
|
|
Consolidated |
|
| |
|
03/31/2023 |
|
03/31/2022 |
|
03/31/2023 |
|
03/31/2022 |
|
| |
|
|
|
(Restated) |
|
|
|
(Restated) |
|
| CASH FLOW FROM OPERATING ACTIVITIES |
|
|
|
|
|
|
|
|
|
| |
|
|
|
|
|
|
|
|
|
| Net income for the period |
|
681 |
|
4,911 |
|
1,769 |
|
4,951 |
|
| Adjustments to reconcile net income: |
|
|
|
|
|
|
|
|
|
| Equity pickup |
|
(14,793) |
|
52 |
|
- |
|
- |
|
| Share-based compensation plan |
|
810 |
|
102 |
|
810 |
|
102 |
|
| Depreciation and amortization |
|
11,307 |
|
10,512 |
|
22,662 |
|
16,048 |
|
| Return on financial investments |
|
(3,584) |
|
(3,310) |
|
(4,720) |
|
(4,048) |
|
| Provision (reversal of provision) for estimated |
|
|
|
|
|
|
|
|
|
| losses on doubtful debts |
|
2 |
|
(174) |
|
478 |
|
(341) |
|
| Reversal of provision for lawsuits |
|
(2,786) |
|
(41) |
|
(7,319) |
|
(1,057) |
|
| Interest and inflation adjustment of lawsuits |
|
231 |
|
196 |
|
231 |
|
242 |
|
| Provision for bonuses and profit sharing |
|
4,391 |
|
1907 |
|
7,618 |
|
3,174 |
|
| Interest and AVP incurred |
|
14,319 |
|
13,474 |
|
20,070 |
|
17,366 |
|
| Remeasurement of call and put options |
|
(567) |
|
(1,224) |
|
(664) |
|
(1,174) |
|
| Deferred income tax and social contribution |
|
(5,149) |
|
1,050 |
|
(592) |
|
(4,120) |
|
| Provision for current income tax and social contribution |
|
- |
|
2,307 |
|
3,428 |
|
6,824 |
|
| |
|
|
|
|
|
|
|
|
|
| Changes in operating asset and liability accounts |
|
|
|
|
|
|
|
|
|
| Accounts receivable |
|
(6,650) |
|
614 |
|
(14,497) |
|
(1,253) |
|
| Court deposits |
|
83 |
|
- |
|
71 |
|
- |
|
| Taxes and contributions recoverable |
|
(2,971) |
|
(2,461) |
|
(4,098) |
|
(3,960) |
|
| Other receivables |
|
724 |
|
1,544 |
|
1,205 |
|
(9,956) |
|
| Trade accounts payable |
|
2,778 |
|
2,604 |
|
3,286 |
|
7,511 |
|
| Labor liabilities |
|
2,629 |
|
2,577 |
|
(359) |
|
4,971 |
|
| Tax liabilities |
|
151 |
|
521 |
|
136 |
|
2,083 |
|
| Lawsuits paid |
|
(388) |
|
(334) |
|
(718) |
|
(336) |
|
| Advances from customers |
|
(977) |
|
(2,680) |
|
(5,007) |
|
3,064 |
|
| Receipts (payment) from related parties |
|
2,774 |
|
1,689 |
|
- |
|
- |
|
| |
|
|
|
|
|
|
|
|
|
| CASH FROM OPERATIONS |
|
3,015 |
|
33,836 |
|
23,790 |
|
40,091 |
|
| |
|
|
|
|
|
|
|
|
|
| Income tax and social contribution paid |
|
- |
|
(1,230) |
|
(3,571) |
|
(3,187) |
|
| interest paid |
|
(11,812) |
|
(8,264) |
|
(15,181) |
|
(9,683) |
|
| |
|
|
|
|
|
|
|
|
|
| NET CASH FROM (USED IN) OPERATIONS |
|
(8,797) |
|
24,342 |
|
5,038 |
|
27,221 |
|
SINQIA S.A. AND SUBSIDIARIES
STATEMENT CASH FLOWS
FOR THE QUARTERS ENDED ON MARCH 31, 2023 AND 2022
(In thousands of Reais – R$)
| |
|
|
|
Individual |
|
|
|
Consolidated |
|
| |
|
03/31/2023 |
|
03/31/2022 |
|
03/31/2023 |
|
03/31/2022 |
|
| |
|
|
|
(Restated) |
|
|
|
(Restated) |
|
| CASH FLOW FROM INVESTING ACTIVITIES |
|
|
|
|
|
|
|
|
|
| |
|
|
|
|
|
|
|
|
|
| Property and equipment and intangible assets purchased |
|
(7,657) |
|
(2,419) |
|
(7,999) |
|
(5,808) |
|
| Business acquisitions, net of acquired cash |
|
- |
|
- |
|
(17,058) |
|
(438,637) |
|
| Payment of investment acquisition obligations |
|
- |
|
(7,791) |
|
- |
|
(9,359) |
|
| Capital contribution to subsidiaries |
|
(15,377) |
|
(463,151) |
|
- |
|
- |
|
| Financial investments |
|
88,181 |
|
474,460 |
|
142,714 |
|
465,966 |
|
| Financial assets - Securities |
|
13,691 |
|
(4,952) |
|
12,956 |
|
(8,980) |
|
| |
|
|
|
|
|
|
|
|
|
| NET CASH FROM (USED IN) INVESTING ACTIVITIES |
|
78,838 |
|
(3,853) |
|
130,613 |
|
3,182 |
|
| |
|
|
|
|
|
|
|
|
|
| CASH FLOW FROM FINANCING ACTIVITIES |
|
|
|
|
|
|
|
|
|
| |
|
|
|
|
|
|
|
|
|
| Debenture amortization |
|
(18,511) |
|
(3,125) |
|
(18,511) |
|
(3,125) |
|
| Leases paid |
|
(4,740) |
|
(5,277) |
|
(5,824) |
|
(6,331) |
|
| Treasury shares purchased |
|
(54) |
|
(14,562) |
|
(54) |
|
(14,562) |
|
| Dividends paid |
|
- |
|
- |
|
(3,030) |
|
(832) |
|
| Investment acquisition obligations paid |
|
(9,677) |
|
- |
|
(62,189) |
|
- |
|
| |
|
|
|
|
|
|
|
|
|
| NET CASH USED IN FINANCING ACTIVITIES |
|
(32,982) |
|
(22,964) |
|
(89,608) |
|
(24,850) |
|
| |
|
|
|
|
|
|
|
|
|
| INCREASE (DECREASE) IN CASH AND CASH EQUIVALENTS |
|
37,059 |
|
(2,475) |
|
46,043 |
|
5,553 |
|
| |
|
|
|
|
|
|
|
|
|
| Cash and cash equivalents at the beginning of the period |
|
11,769 |
|
10,354 |
|
37,941 |
|
24,192 |
|
| |
|
|
|
|
|
|
|
|
|
| Cash and cash equivalents at the end of the period |
|
48,828 |
|
7,879 |
|
83,984 |
|
29,745 |
|
| |
|
|
|
|
|
|
|
|
|
| INCREASE (DECREASE) IN CASH AND CASH EQUIVALENTS |
|
37,059 |
|
(2,475) |
|
46,043 |
|
5,553 |
|
The notes are an integral part of the financial information.
SINQIA S.A. AND SUBSIDIARIES.
STATEMENT OF VALUE ADDED
FOR THE QUARTERS ENDED ON MARCH 31, 2023 AND 2022
(In thousands of Reais – R$)
| |
|
|
|
Individual |
|
Consolidated |
|
| |
|
03/31/2023 |
|
03/31/2022 |
|
03/31/2023 |
|
03/31/2022 |
|
| |
|
|
|
(Restated) |
|
|
|
(Restated) |
|
| |
|
|
|
|
|
|
|
|
|
| REVENUES |
|
80,865 |
|
76,350 |
|
182,253 |
|
154,028 |
|
| Sales of products and services |
|
80,867 |
|
76,176 |
|
182,731 |
|
153,687 |
|
| Estimated loss on doubtful debts - Reversal (Formation) |
|
(2) |
|
174 |
|
(478) |
|
341 |
|
| |
|
|
|
|
|
|
|
|
|
| INPUTS PURCHASED FROM THIRD |
|
(9,801) |
|
(8,887) |
|
(16,178) |
|
(19,839) |
|
| PARTIES (ICMS, IPI, PIS and COFINS) |
|
|
|
|
|
|
|
|
|
| Cost of goods and services sold |
|
(6,046) |
|
(6,411) |
|
(10,631) |
|
(14,419) |
|
| Materials, energy, third-party services and others |
|
(3,755) |
|
(2,476) |
|
(5,547) |
|
(5,420) |
|
| |
|
|
|
|
|
|
|
|
|
| GROSS VALUE ADDED |
|
71,064 |
|
67,463 |
|
166,075 |
|
134,189 |
|
| |
|
|
|
|
|
|
|
|
|
| DEPRECIATION AND AMORTIZATION |
|
(11,307) |
|
(10,512) |
|
(22,662) |
|
(16,048) |
|
| |
|
|
|
|
|
|
|
|
|
| NET VALUE ADDED PRODUCED BY THE COMPANY |
|
59,757 |
|
56,951 |
|
143,413 |
|
118,141 |
|
| |
|
|
|
|
|
|
|
|
|
| ADDED VALUE RECEIVED ON TRANSFER |
|
|
|
|
|
|
|
|
|
| |
|
18,604 |
|
4,493 |
|
5,081 |
|
5,292 |
|
| |
|
|
|
|
|
|
|
|
|
| Equity pickup |
|
14,793 |
|
(52) |
|
- |
|
- |
|
| Financial revenues |
|
3,811 |
|
4,545 |
|
5,081 |
|
5,292 |
|
| |
|
|
|
|
|
|
|
|
|
| TOTAL VALUE ADDED DISTRIBUTABLE |
|
78,361 |
|
61,444 |
|
148,494 |
|
123,433 |
|
| |
|
|
|
|
|
|
|
|
|
| VALUE ADDED DISTRIBUTION |
|
78,361 |
|
61,444 |
|
148,494 |
|
123,433 |
|
| |
|
|
|
|
|
|
|
|
|
| Personnel |
|
59,539 |
|
31,672 |
|
104,986 |
|
82,423 |
|
| Direct compensation |
|
47,194 |
|
33,686 |
|
85,474 |
|
66,297 |
|
| Benefits |
|
9,161 |
|
(4,203) |
|
13,952 |
|
11,925 |
|
| FGTS |
|
3,184 |
|
2,189 |
|
5,560 |
|
4,201 |
|
| |
|
|
|
|
|
|
|
|
|
| Taxes, levies and contributions |
|
3,885 |
|
11,895 |
|
21,610 |
|
17,711 |
|
| Federal |
|
1,634 |
|
9,765 |
|
16,496 |
|
13,292 |
|
| Municipal |
|
2,251 |
|
2,130 |
|
5,114 |
|
4,419 |
|
| |
|
|
|
|
|
|
|
|
|
| Return on borrowed capital |
|
14,256 |
|
12,966 |
|
20,129 |
|
18,348 |
|
| Interest |
|
12,502 |
|
12,445 |
|
17,445 |
|
16,435 |
|
| Rents |
|
1754 |
|
521 |
|
2,684 |
|
1913 |
|
| |
|
|
|
|
|
|
|
|
|
| Return on equity |
|
681 |
|
4,911 |
|
1,769 |
|
4,951 |
|
| Retained earnings for the period |
|
681 |
|
4,911 |
|
681 |
|
4,911 |
|
| Non-controlling shareholders’ interest in |
|
- |
|
- |
|
1,088 |
|
40 |
|
| retained earnings |
|
|
|
|
|
|
|
|
|
The notes are an integral part of the financial information.
SINQIA S.A. AND SUBSIDIARIES.
MANAGEMENT’S NOTES TO THE INTERIM INFORMATION FOR THE QUARTERS ENDED MARCH 31, 2023 AND 2022 AND DECEMBER
31, 2022
(In thousands of Reais – R$)
Section A - GENERAL INFORMATION
Sinqia S.A. (“Company”) is a publicly-held corporation,
headquartered at Rua Bela Cintra No. 755, 7th floor, in the City of São Paulo, State of São Paulo, having its shares traded on B3 – Brasil, Bolsa, Balcão in the Novo Mercado listing segment.
The Company was incorporated in 1996 for the primary
purpose of providing technology for the financial sector.
The Company is the parent of Sinqia Tecnologia Ltda.,
Torq Inovação Digital Ltda., Homie do Brasil Informática Ltda., Rosk Software S.A. and indirectly controls Lote45 Participações S.A. and Compliasset Software e Soluções Digitais S.A., companies whose purpose is to engage in activities
complementary to the Company's business.
These quarterly statements are approved to be issued and
authorized for disclosure by the Board of Directors on May 5, 2023.
| 1.2 |
Basis for preparation, presentation of the Quarterly Information, and summary of principal accounting practices |
The individual and consolidated interim financial
information was prepared and presented in accordance with CPC Technical Pronouncement 21 (R1) - Interim Statements, IAS 34 - Interim Financial Reporting, issued by the International Accounting Standards Board (IASB), and consistent with
the rules issued by the Brazilian Securities Commission, as applicable to the preparation of Quarterly Information. The accounting practices in place in Brazil comprise those included in Brazilian corporate laws and in pronouncements,
guidelines and interpretations issued by the Accounting Pronouncements Committee (CPC) and approved by the Brazilian Securities Commission (CVM). The quarterly information should be read in conjunction with the financial statements for
the year ended December 31, 2022 (hereinafter referred to as “December 31, 2022 financial statements”), published on March 9, 2023 and made available through the following websites: www.gov.br/cvm, www.b3.com.br and www.sinqia.com/ri.
There was no change in the principal accounting policies
in relation to those described in note 29 to the financial statements for the year ended December 31, 2022.
The financial statements were prepared using the
historical cost as a base value, except for the valuation of certain assets and liabilities, such as those arising from financial instruments that are measured at fair value.
The preparation of the interim financial information
requires the use of certain critical accounting estimates and the exercise of judgment by the Company's management in the process of applying its accounting policies. Those areas that require a higher level of judgment and are more
complex, as well as the areas in which assumptions and estimates are significant for the financial information, are disclosed in Note 2.
SINQIA S.A. AND SUBSIDIARIES.
MANAGEMENT’S NOTES TO THE INTERIM INFORMATION FOR THE QUARTERS ENDED MARCH 31, 2023 AND 2022 AND DECEMBER
31, 2022
(In thousands of Reais – R$)
The presentation of the individual Statement of Value
Added (or VAS) is required by Brazilian corporate laws and by the accounting practices in place in Brazil, as applicable to publicly-held companies. The VAS was prepared in accordance with the criteria set forth in CPC Technical
Pronouncement 9 – “Statement of Value Added”. IAS 34 - Interim Financial Reporting does not require the presentation of this statement. As a result, under IFRS, this statement is presented as supplementary information, without prejudice
to the set of accounting information.
The Company consolidates all entities over which it has
control, that is, when it is exposed or has rights to variable returns from its involvement with the investee and has the capacity to direct the relevant activities of the investee.
The subsidiaries included in the consolidation are
described in Note 5.
| 1.4 |
Restatement of comparative balances |
The Company's Management is restating the quarterly
statements for the quarter ended March 31, 2022 due to adjustments related to: (i) accounting for call and put options related to business combinations involving the companies Homie do Brasil Informática Ltda., Rosk Software S.A. and
Lote45 Participações S.A.; (ii) measurement and inclusion of the amount attributable to the non-controlling shareholders in the companies Homie do Brasil Informática Ltda., Rosk Software S.A. and Lote45 Participações S.A., and consequent
impacts on the intangible assets and liabilities assumed.
Said adjustments do not have a material impact on the
performance of operations, but they have a material effect on the equity position of the Company and its subsidiaries as previously presented in the financial statements for the year ended March 31, 2022. That said, Management understands
that the adjustments in equity position and performance of its operations could distort the understanding of the Company's results. Therefore, adjustments were made retrospectively as set forth in CPC Technical Pronouncement 23 -
Accounting Practices, Changes in Estimates and Error Corrections. There are no impacts on the opening shareholders' equity of the earliest period presented, which is why the Company is restating only the column for 03/31/2022.
SINQIA S.A. AND SUBSIDIARIES.
MANAGEMENT’S NOTES TO THE INTERIM INFORMATION FOR THE QUARTERS ENDED MARCH 31, 2023 AND 2022 AND
DECEMBER 31, 2022
(In thousands of Reais – R$)
The following tables summarize the impacts in the Company's previous period:
INCOME STATEMENT
| |
|
|
|
|
|
|
|
Individual |
|
|
|
|
|
|
Consolidated |
|
| |
|
Note |
|
|
|
|
|
03/31/2022 |
|
|
|
|
|
|
03/31/2022 |
|
| |
|
|
|
Published |
|
Adjustment |
|
Restated |
|
|
Published |
|
Adjustment |
|
Restated |
|
| |
|
|
|
|
|
|
|
|
|
|
|
|
|
|
|
|
| General, administrative and selling expenses |
|
20 |
|
(14,584) |
|
- |
|
(14,584) |
|
|
(36,205) |
|
(1832) |
|
(38,037) |
|
| Equity pickup |
|
5 |
|
1,522 |
|
(1,574) |
|
(52) |
|
|
- |
|
- |
|
- |
|
| |
|
|
|
|
|
|
|
|
|
|
|
|
|
|
|
|
| Result of operations before financial result |
|
|
|
19,061 |
|
(1,574) |
|
17,487 |
|
|
22,019 |
|
(1832) |
|
20,187 |
|
| |
|
|
|
|
|
|
|
|
|
|
|
|
|
|
|
|
| Financial result, net |
|
21 |
|
(4,401) |
|
(4,818) |
|
(9,219) |
|
|
(5,329) |
|
(7,203) |
|
(12,532) |
|
| |
|
|
|
|
|
|
|
|
|
|
|
|
|
|
|
|
| Profit (loss) before income tax and social contribution |
|
|
|
14,660 |
|
(6,392) |
|
8,268 |
|
|
16,690 |
|
(9,035) |
|
7,655 |
|
| |
|
|
|
|
|
|
|
|
|
|
|
|
|
|
|
|
| Deferred income tax and social contribution |
|
22 |
|
(2,688) |
|
1,638 |
|
(1,050) |
|
|
1,671 |
|
2,449 |
|
4,120 |
|
| |
|
|
|
|
|
|
|
|
|
|
|
|
|
|
|
|
| Profit after income tax and social contribution |
|
|
|
9,665 |
|
(4,754) |
|
4,911 |
|
|
11,537 |
|
(6,586) |
|
4,951 |
|
| |
|
|
|
|
|
|
|
|
|
|
|
|
|
|
|
|
| Non-controlling interest |
|
|
|
- |
|
- |
|
- |
|
|
(1872) |
|
1832 |
|
(40) |
|
| |
|
|
|
|
|
|
|
|
|
|
|
|
|
|
|
|
| Net income for the period |
|
|
|
9,665 |
|
(4,754) |
|
4,911 |
|
|
9,665 |
|
(4,754) |
|
4,911 |
|
| |
|
|
|
|
|
|
|
|
|
|
|
|
|
|
|
|
| Basic earnings per share – in Reais |
|
23 |
|
0.114 |
|
(0.056) |
|
0.058 |
|
|
0.114 |
|
(0.056) |
|
0.058 |
|
| Diluted earnings per share – in Reais |
|
23 |
|
0.113 |
|
(0.056) |
|
0.057 |
|
|
0.113 |
|
(0.056) |
|
0.057 |
|
STATEMENT OF COMPREHENSIVE INCOME
| |
|
|
|
|
|
Individual |
|
|
|
|
|
|
Consolidated |
|
| |
|
|
|
|
|
03/31/2022 |
|
|
|
|
|
|
03/31/2022 |
|
| |
|
Published |
|
Adjustment |
|
Restated |
|
|
Published |
|
Adjustment |
|
Restated |
|
| |
|
|
|
|
|
|
|
|
|
|
|
|
|
|
| Net income for the period |
|
9,665 |
|
(4,754) |
|
4,911 |
|
|
11,537 |
|
(6,586) |
|
4,951 |
|
| |
|
|
|
|
|
|
|
|
|
|
|
|
|
|
| Total comprehensive income for the period |
|
9,665 |
|
(4,754) |
|
4,911 |
|
|
11,537 |
|
(6,586) |
|
4,951 |
|
| |
|
|
|
|
|
|
|
|
|
|
|
|
|
|
| ATTRIBUTED TO: |
|
|
|
|
|
|
|
|
|
|
|
|
|
|
| Controlling shareholders |
|
9,665 |
|
(4,754) |
|
4,911 |
|
|
9,665 |
|
(4,754) |
|
4,911 |
|
| Non-controlling shareholders |
|
- |
|
- |
|
- |
|
|
1872 |
|
(1832) |
|
40 |
|
STATEMENT OF CHANGES IN SHAREHOLDERS’ EQUITY
| |
|
Shareholders’ Equity |
|
| |
|
Published |
|
Adjustment |
|
Restated |
|
| Balances as of December 31, 2021 (Restated) |
|
782,659 |
|
(61,208) |
|
721,451 |
|
| |
|
|
|
|
|
|
|
| Net income for the period |
|
9,665 |
|
(4,754) |
|
4,911 |
|
| Non-controlling interest put option |
|
- |
|
(65,602) |
|
(65,602) |
|
| Balances as of March 31, 2022 (Restated) |
|
777,865 |
|
(131,564) |
|
646,301 |
|
SINQIA S.A. AND SUBSIDIARIES.
MANAGEMENT’S NOTES TO THE INTERIM INFORMATION FOR THE QUARTERS ENDED MARCH 31, 2023 AND 2022 AND
DECEMBER 31, 2022
(In thousands of Reais – R$)
| |
|
Non-controlling
interest |
|
Non-controlling
interest |
|
Non-controlling
interest |
|
|
Consolidated
Shareholders'
Equity |
|
Non-controlling
interest |
|
Consolidated
Shareholders'
Equity |
|
| |
|
Published |
|
Adjustment |
|
Restated |
|
|
Published |
|
Adjustment |
|
Restated |
|
| Balances as of December 31, 2021 (Restated) |
|
2,797 |
|
16,284 |
|
19,081 |
|
|
785,456 |
|
(44,924) |
|
740,532 |
|
| |
|
|
|
|
|
|
|
|
|
|
|
|
|
|
| Net income for the period |
|
1872 |
|
(1832) |
|
40 |
|
|
11,537 |
|
(6,586) |
|
4,951 |
|
| Non-controlling interest put option |
|
- |
|
- |
|
- |
|
|
- |
|
(65,602) |
|
(65,602) |
|
| Non-controlling interests acquired |
|
(354) |
|
8,020 |
|
7,666 |
|
|
(354) |
|
8,020 |
|
7,666 |
|
| Balances as of March 31, 2022 (Restated) |
|
4,315 |
|
22,472 |
|
26,787 |
|
|
782,180 |
|
(109,092) |
|
673,088 |
|
STATEMENT OF CASH FLOWS
| |
|
|
|
|
|
Individual |
|
|
|
|
|
|
Consolidated |
|
| |
|
|
|
|
|
03/31/2022 |
|
|
|
|
|
|
03/31/2022 |
|
| |
|
Published |
|
Adjustment |
|
Restated |
|
|
Published |
|
Adjustment |
|
Restated |
|
| |
|
|
|
|
|
|
|
|
|
|
|
|
|
|
| Net income for the period |
|
9,665 |
|
(4,754) |
|
4,911 |
|
|
11,537 |
|
(6,586) |
|
4,951 |
|
| Equity pickup |
|
(1,522) |
|
1,574 |
|
52 |
|
|
- |
|
- |
|
- |
|
| Depreciation and amortization |
|
10,512 |
|
- |
|
10,512 |
|
|
14,216 |
|
1832 |
|
16,048 |
|
| Financial investments |
|
- |
|
(3,310) |
|
(3,310) |
|
|
- |
|
(4,048) |
|
(4,048) |
|
| Interest and inflation adjustment of lawsuits |
|
- |
|
196 |
|
196 |
|
|
- |
|
242 |
|
242 |
|
| Interest and AVP incurred |
|
7,628 |
|
5,846 |
|
13,474 |
|
|
9,231 |
|
8,135 |
|
17,366 |
|
| Remeasurement of call and put options |
|
- |
|
(1,224) |
|
(1,224) |
|
|
- |
|
(1,174) |
|
(1,174) |
|
| Deferred income tax and social contribution |
|
2,687 |
|
(1,637) |
|
1,050 |
|
|
(1,737) |
|
(2,383) |
|
(4,120) |
|
| |
|
|
|
|
|
|
|
|
|
|
|
|
|
|
| Changes in operating asset and liability accounts |
|
|
|
|
|
|
|
|
|
|
|
|
|
|
| Tax liabilities |
|
522 |
|
(1) |
|
521 |
|
|
2,149 |
|
(66) |
|
2,083 |
|
| |
|
|
|
|
|
|
|
|
|
|
|
|
|
|
| CASH FROM OPERATIONS |
|
37,146 |
|
(3,310) |
|
33,836 |
|
|
44,139 |
|
(4,048) |
|
40,091 |
|
| |
|
|
|
|
|
|
|
|
|
|
|
|
|
|
| NET CASH FROM (USED IN) OPERATIONS |
|
27,652 |
|
(3,310) |
|
24,342 |
|
|
31,269 |
|
(4,048) |
|
27,221 |
|
| |
|
|
|
|
|
|
|
|
|
|
|
|
|
|
| CASH FLOW FROM INVESTING ACTIVITIES |
|
|
|
|
|
|
|
|
|
|
|
|
|
|
| |
|
|
|
|
|
|
|
|
|
|
|
|
|
|
| Financial investments |
|
471,150 |
|
3,310 |
|
474,460 |
|
|
461,918 |
|
4,048 |
|
465,966 |
|
| |
|
|
|
|
|
|
|
|
|
|
|
|
|
|
| NET CASH FROM (USED IN) INVESTING ACTIVITIES |
|
(7,163) |
|
3,310 |
|
(3,853) |
|
|
(866) |
|
4,048 |
|
3,182 |
|
SINQIA S.A. AND SUBSIDIARIES.
MANAGEMENT’S NOTES TO THE INTERIM INFORMATION FOR THE QUARTERS ENDED MARCH 31, 2023 AND 2022 AND
DECEMBER 31, 2022
(In thousands of Reais – R$)
STATEMENT OF VALUE ADDED
| |
|
|
|
|
|
Individual |
|
|
|
|
|
|
Consolidated |
|
| |
|
|
|
|
|
03/31/2022 |
|
|
|
|
|
|
03/31/2022 |
|
| |
|
Published |
|
Adjustment |
|
Restated |
|
|
Published |
|
Adjustment |
|
Restated |
|
| |
|
|
|
|
|
|
|
|
|
|
|
|
|
|
| DEPRECIATION AND AMORTIZATION |
|
(10,512) |
|
- |
|
(10,512) |
|
|
(14,216) |
|
(1832) |
|
(16,048) |
|
| |
|
|
|
|
|
|
|
|
|
|
|
|
|
|
| NET VALUE ADDED PRODUCED BY THE COMPANY |
|
58,175 |
|
- |
|
58,175 |
|
|
121,147 |
|
(1832) |
|
119,315 |
|
| |
|
|
|
|
|
|
|
|
|
|
|
|
|
|
| VALUE ADDED RECEIVED ON TRANSFER |
|
4,843 |
|
(1,574) |
|
3,269 |
|
|
4,118 |
|
- |
|
4,118 |
|
| |
|
|
|
|
|
|
|
|
|
|
|
|
|
|
| Equity pickup |
|
1,522 |
|
(1,574) |
|
(52) |
|
|
- |
|
- |
|
- |
|
| |
|
|
|
|
|
|
|
|
|
|
|
|
|
|
| TOTAL VALUE ADDED DISTRIBUTABLE |
|
63,018 |
|
(1,574) |
|
61,444 |
|
|
125,265 |
|
(1832) |
|
123,433 |
|
| |
|
|
|
|
|
|
|
|
|
|
|
|
|
|
| VALUE ADDED DISTRIBUTION |
|
63,018 |
|
(1,574) |
|
61,444 |
|
|
125,265 |
|
(1832) |
|
123,433 |
|
| |
|
|
|
|
|
|
|
|
|
|
|
|
|
|
| Taxes, levies and contributions |
|
13,533 |
|
(1,638) |
|
11,895 |
|
|
20,160 |
|
(2,449) |
|
17,711 |
|
| Federal |
|
11,403 |
|
(1,638) |
|
9,765 |
|
|
15,741 |
|
(2,449) |
|
13,292 |
|
| |
|
|
|
|
|
|
|
|
|
|
|
|
|
|
| Return on borrowed capital |
|
8,148 |
|
4,818 |
|
12,966 |
|
|
11,145 |
|
7,203 |
|
18,348 |
|
| Interest |
|
7,627 |
|
4,818 |
|
12,445 |
|
|
9,232 |
|
7,203 |
|
16,435 |
|
| |
|
|
|
|
|
|
|
|
|
|
|
|
|
|
| Return on equity |
|
9,665 |
|
(4,754) |
|
4,911 |
|
|
11,537 |
|
(6,586) |
|
4,951 |
|
| Retained earnings for the period |
|
9,665 |
|
(4,754) |
|
4,911 |
|
|
9,665 |
|
(4,754) |
|
4,911 |
|
| Non-controlling shareholders’ interest in retained earnings |
|
- |
|
|
|
- |
|
|
1872 |
|
(1832) |
|
40 |
|
Section B - RISKS
|
2 |
CRITICAL ACCOUNTING ESTIMATES AND JUDGMENTS |
Accounting estimates and judgments are continually evaluated and are
based on historical experience and other factors, including expectations of future events considered reasonable under the circumstances. In the quarter ended March 31, 2023, there were no changes in estimates and assumptions that posed a
significant risk, likely to cause a material adjustment in the carrying amounts of assets and liabilities for the current fiscal year, in relation to those detailed in the annual financial statements.
|
2.1 |
Critical accounting estimates and assumptions |
There was no change in the critical accounting estimates and
assumptions in relation to that described in Note 29 of the financial statements as of December 31, 2022.
SINQIA S.A. AND SUBSIDIARIES.
MANAGEMENT’S NOTES TO THE INTERIM INFORMATION FOR THE QUARTERS ENDED MARCH 31, 2023 AND 2022 AND
DECEMBER 31, 2022
(In thousands of Reais – R$)
|
2.2 |
Critical judgments in the application of accounting policies |
There was no change in critical judgments in the application of
accounting policies in relation to that described in Note 29 of the financial statements as of December 31, 2022.
|
2.3 |
New standards, amendments and interpretations of accounting pronouncements |
The Company's Management assessed the existing new standards,
amendments and interpretations for initial adoption on January 1, 2023 and concluded that there is no material impact on the Company's individual and consolidated interim financial information.
|
3 |
FINANCIAL RISK MANAGEMENT |
|
3.1 |
Financial risk factors |
There was no change in the financial risk factors and the policy for
managing these risks in relation to that described in the financial statements as of December 31, 2022, issued on March 9, 2023.
The purpose of the Company's capital management is to ensure that it
maintains a strong credit rating with institutions and an optimal capital ratio, in order to support the Company's business and maximize shareholder value.
The Company controls its capital structure by making adjustments and
adapting it to current economic conditions. To keep this structure adjusted, the Company may pay dividends, return capital to shareholders, raise new loans, issue promissory notes and contract derivative transactions.
There were no changes regarding the criteria or techniques for
measuring the fair value of assets and liabilities, nor were there any changes as to the classification of the Company’s financial instruments in relation to those disclosed in the financial statements as of December 31, 2022.
|
3.4 |
Offsetting financial instruments |
Financial assets and liabilities are offset (with the same
counterparty), and the net amount reported in the balance sheet, when there is a legal right to offset the recognized amounts and there is an intention either to settle them on a net basis or to realize the asset and settle the
liabilities simultaneously.
SINQIA S.A. AND SUBSIDIARIES.
MANAGEMENT’S NOTES TO THE INTERIM INFORMATION FOR THE QUARTERS ENDED MARCH 31, 2023 AND 2022 AND
DECEMBER 31, 2022
(In thousands of Reais – R$)
Section C - SEGMENT INFORMATION
|
4 |
THE PRESENTATION OF INFORMATION BY SEGMENT |
The purpose of the Company's businesses is to provide information
technology products and services, as well as advisory services, aimed at serving the financial sector. Although the products are intended for various segments within financial institutions, these are not controlled and managed by
Management as independent segments, and the Company's results are tracked, monitored and evaluated in an integrated manner.
SINQIA S.A. AND SUBSIDIARIES.
MANAGEMENT’S NOTES TO THE INTERIM INFORMATION FOR THE QUARTERS ENDED MARCH 31, 2023 AND 2022 AND
DECEMBER 31, 2022
(In thousands of Reais – R$)
Section D - GROUP STRUCTURE
(a) Changes in investments
| |
|
Sinqia Tecnologia
Ltda. |
|
Torq Inovação
Digital Ltda. |
|
Homie do Brasil
Informática Ltda. |
|
Rosk Software S.A. |
|
Total |
|
| Balance as of December 31, 2021 (Restated) |
|
91,369 |
|
34,113 |
|
39,816 |
|
32,713 |
|
198,011 |
|
| Capital increase (i) |
|
491,198 |
|
7,337 |
|
- |
|
- |
|
498,535 |
|
| Investment acquisition |
|
- |
|
- |
|
- |
|
1,438 |
|
1,438 |
|
| Dividend distribution |
|
- |
|
- |
|
(4,333) |
|
- |
|
(4,333) |
|
| Equity pickup |
|
3,053 |
|
87 |
|
4,333 |
|
(704) |
|
6,769 |
|
| Non-controlling interest put option |
|
(65,602) |
|
- |
|
- |
|
- |
|
(65,602) |
|
| Amortization (ii) |
|
- |
|
- |
|
(2,342) |
|
(3,788) |
|
(6,130) |
|
| Balance as of December 31, 2022 |
|
520,018 |
|
41,537 |
|
37,474 |
|
29,659 |
|
628,688 |
|
| Capital contribution (iii) |
|
14,826 |
|
551 |
|
- |
|
- |
|
15,377 |
|
| Equity pickup |
|
13,558 |
|
192 |
|
899 |
|
144 |
|
14,793 |
|
| Non-controlling interest put option |
|
(9,753) |
|
- |
|
- |
|
- |
|
(9,753) |
|
| Amortization (ii) |
|
- |
|
- |
|
(585) |
|
(490) |
|
(1,075) |
|
| Balance as of March 31, 2023 |
|
538,649 |
|
42,280 |
|
37,788 |
|
29,313 |
|
648,030 |
|
(i) In 2022, the capital increase in Sinqia Tecnologia
Ltda. was carried out to make the acquisitions of Lote45 Participações S.A., Mercer Seguridade Ltda. and Newcon Software S.A.
(ii) Amortization of capital gains generated in the
business combination, attributed to non-controlling shareholders.
(iii) In 2023, the capital increase in Sinqia Tecnologia
Ltda. was made for the acquisition of Compliasset Software e Soluções Digitais S.A., as set out in note 27.
SINQIA S.A. AND SUBSIDIARIES.
MANAGEMENT’S NOTES TO THE INTERIM INFORMATION FOR THE QUARTERS ENDED MARCH 31, 2023 AND 2022 AND
DECEMBER 31, 2022
(In thousands of Reais – R$)
|
(b) |
Subsidiary information |
| |
|
|
|
|
|
|
|
|
|
|
|
Total investment |
Equity pickup |
|
| Direct investment |
|
Shareholders’ Equity |
|
Equity interest |
|
Goodwill appreciation |
|
Amortization |
|
Result for the period |
|
03/31/2023 |
|
12/31/2022 |
|
03/31/2023 |
|
03/31/2022 (Restated) |
|
| |
|
|
|
|
|
|
|
|
|
|
|
|
|
|
|
|
|
|
|
| Sinqia Tecnologia Ltda. |
|
538,649 |
|
100% |
|
- |
|
- |
|
13,558 |
|
538,649 |
|
520,018 |
|
13,558 |
|
(1,469) |
|
| Torq Inovação Digital Ltda. |
|
42,280 |
|
100% |
|
- |
|
- |
|
192 |
|
42,280 |
|
41,537 |
|
192 |
|
(40) |
|
| Homie do Brasil Informática Ltda. |
|
1,511 |
|
60% |
|
41,566 |
|
(4,684) |
|
1,499 |
|
37,788 |
|
37,474 |
|
899 |
|
1,398 |
|
| Rosk Software S.A. |
|
1,484 |
|
51% |
|
32,834 |
|
(4,278) |
|
283 |
|
29,313 |
|
29,659 |
|
144 |
|
59 |
|
| |
|
|
|
|
|
|
|
|
|
|
|
648,030 |
|
628,688 |
|
14,793 |
|
(52) |
|
(c) Indirect investments (Direct subsidiaries of Sinqia Tecnologia Ltda.)
| |
|
|
|
|
|
|
|
Total investment |
|
Equity pickup |
| Indirect investment |
|
Shareholders’ equity |
|
Equity interest |
|
Result for the period |
|
03/31/2023 |
|
12/31/2022 |
|
03/31/2023 |
|
03/31/2022 |
| |
|
|
|
|
|
|
|
|
|
|
|
|
|
|
| Sinqia Seguridade Ltda. (i) |
|
at |
|
at |
|
- |
|
- |
|
- |
|
- |
|
1,117 |
| Lote45 Participações S.A. |
|
6,112 |
|
52% |
|
2,551 |
|
3,178 |
|
1,720 |
|
1,326 |
|
983 |
| Newcon Software Ltda. (ii) |
|
at |
|
at |
|
- |
|
- |
|
- |
|
- |
|
4,476 |
| Newcon Tecnologia Ltda. (ii) |
|
at |
|
at |
|
- |
|
- |
|
- |
|
- |
|
(2) |
| Compliasset Software e Soluções Digitais S.A. (iii) |
|
1,256 |
|
60% |
|
87 |
|
754 |
|
- |
|
52 |
|
- |
| |
|
|
|
|
|
|
|
|
|
|
|
|
|
|
| |
|
|
|
|
|
|
|
3,932 |
|
1,720 |
|
1,378 |
|
6,574 |
|
(i) |
On October 1, 2022, Sinqia Seguridade Ltda. was merged into Sinqia Tecnologia Ltda. |
|
(ii) |
On December 31, 2022, Newcon Software S.A. and Newcon Tecnologia e Serviços Ltda. were merged into Sinqia Tecnologia Ltda. |
|
(iii) |
On March 7, 2023, Sinqia Tecnologia acquired 60% of the shares in Compliasset Software e Soluções Digitais Ltda. |
SINQIA S.A. AND SUBSIDIARIES.
MANAGEMENT’S NOTES TO THE INTERIM INFORMATION FOR THE QUARTERS ENDED MARCH 31, 2023 AND 2022 AND
DECEMBER 31, 2022
(In thousands of Reais – R$)
Section E – SELECTED RELEVANT NOTES
|
6 |
CASH AND CASH EQUIVALENTS |
a) Cash and cash equivalents
| |
|
|
|
Individual |
|
|
|
|
Consolidated |
|
| |
|
03/31/2023 |
|
12/31/2022 |
|
|
03/31/2023 |
|
12/31/2022 |
|
| |
|
|
|
|
|
|
|
|
|
|
| Banks |
|
1,988 |
|
332 |
|
|
4,222 |
|
2,143 |
|
| Local currency fixed-income securities (i) |
|
46,840 |
|
11,437 |
|
|
79,762 |
|
35,798 |
|
| |
|
|
|
|
|
|
|
|
|
|
| |
|
48,828 |
|
11,769 |
|
|
83,984 |
|
37,941 |
|
(i) The Company has financial investment policies in place providing
that investments should be concentrated in low-risk securities and substantially remunerated based on percentage changes in the Interbank Deposit Certificate (CDI) rate. Therefore, they refer to investments in fixed-income investment
funds, repurchase transactions and Bank Deposit Certificates (CDB), with yields ranging from 85% to 103% of the CDI rate as of March 31, 2023 and December 31, 2022 and immediate liquidity, that is, no grace period for redemptions.
b) Financial investments
| |
|
|
|
Individual |
|
|
|
|
Consolidated |
|
| |
|
03/31/2023 |
|
12/31/2022 |
|
|
03/31/2023 |
|
12/31/2022 |
|
| |
|
|
|
|
|
|
|
|
|
|
| Local currency fixed-income securities (i) |
|
- |
|
98,369 |
|
|
- |
|
151,766 |
|
| Collateral amounts (ii) |
|
13,772 |
|
- |
|
|
13,772 |
|
- |
|
| |
|
|
|
|
|
|
|
|
|
|
| |
|
13,772 |
|
98,369 |
|
|
13,772 |
|
151,766 |
|
(i) The amounts correspond to cash allocated to investing activities,
including future business combinations. The Company has financial investment policies in place providing that investments should be concentrated in low-risk securities and substantially remunerated based on percentage changes in the
Interbank Deposit Certificate (CDI) rate. Therefore, they refer to investments in fixed-income investment funds, repurchase transactions and Bank Deposit Certificates (CDB), with yields ranging from 85% to 103% of the CDI rate as of
December 31, 2022 and immediate liquidity, that is, no grace period for redemptions.
(ii) The collateral amounts correspond mainly to investments in
fixed-income investment funds, with equivalent average interest ranging from 106.59% to 115.20% of the CDI rate, held as collateral to guarantee the payment of investment acquisition obligations and short-term debentures.
SINQIA S.A. AND SUBSIDIARIES.
MANAGEMENT’S NOTES TO THE INTERIM INFORMATION FOR THE QUARTERS ENDED MARCH 31, 2023 AND 2022 AND
DECEMBER 31, 2022
(In thousands of Reais – R$)
c) Financial assets
| |
|
|
|
Individual |
|
|
|
|
Consolidated |
|
| |
|
03/31/2023 |
|
12/31/2022 |
|
|
03/31/2023 |
|
12/31/2022 |
|
| |
|
|
|
|
|
|
|
|
|
|
| Collateral amounts (i) |
|
24,873 |
|
38,563 |
|
|
24,873 |
|
38,563 |
|
| Investments in private entities (ii) |
|
1,075 |
|
1,075 |
|
|
45,561 |
|
44,828 |
|
| Derivative financial instruments (iii) |
|
13,900 |
|
13,334 |
|
|
20,951 |
|
15,876 |
|
| |
|
|
|
|
|
|
|
|
|
|
| |
|
39,848 |
|
52,972 |
|
|
91,385 |
|
99,267 |
|
(i) The collateral amounts mainly correspond to investments in
fixed-income investment funds, with equivalent average interest ranging from 106.59% to 115.20% of the CDI rate, held as collateral to guarantee payment of investment acquisition obligations and debentures.
(ii) The amounts correspond to the fair value of investments in
preferred shares of Celcoin Pagamentos S.A., Fundos de Investimento em Participações and loans convertible into shares.
(iii) The amounts refer to the call options for non-controlling
shareholders in the subsidiaries Homie do Brasil Informática Ltda., Rosk Software S.A., Lote45 Participações S.A. and Compliasset Software e Soluções Digitais S.A.
| |
|
|
|
Individual |
|
|
|
|
Consolidated |
|
| |
|
03/31/2023 |
|
12/31/2022 |
|
|
03/31/2023 |
|
12/31/2022 |
|
| |
|
|
|
|
|
|
|
|
|
|
| Amounts invoiced |
|
18,303 |
|
16,114 |
|
|
37,509 |
|
34,449 |
|
| Services billable (i) |
|
8,224 |
|
3,763 |
|
|
16,615 |
|
7,511 |
|
| Estimated losses on – doubtful debts |
|
(544) |
|
(542) |
|
|
(1,574) |
|
(1,079) |
|
| |
|
|
|
|
|
|
|
|
|
|
| |
|
25,983 |
|
19,335 |
|
|
52,550 |
|
40,881 |
|
(i) The amount of services billable refers to revenue from services effectively provided to
customers, but which, as of the base date of the accounting information, had not been billed.
SINQIA S.A. AND SUBSIDIARIES.
MANAGEMENT’S NOTES TO THE INTERIM INFORMATION FOR THE QUARTERS ENDED MARCH 31, 2023 AND 2022 AND
DECEMBER 31, 2022
(In thousands of Reais – R$)
(ii) We present below the changes in estimated losses on doubtful accounts:
| |
|
|
|
Individual |
|
|
|
|
Consolidated |
|
| |
|
03/31/2023 |
|
03/31/2022 |
|
|
03/31/2023 |
|
03/31/2022 |
|
| |
|
|
|
|
|
|
|
|
|
|
| Balance at the beginning |
|
(542) |
|
(1,432) |
|
|
(1,079) |
|
(2,578) |
|
| |
|
|
|
|
|
|
|
|
|
|
| Additions due to corporate reorganization (i) |
|
- |
|
(236) |
|
|
- |
|
- |
|
| Additions due to business acquisition (ii) |
|
- |
|
- |
|
|
(25) |
|
- |
|
| Additions |
|
(10) |
|
(67) |
|
|
(547) |
|
(67) |
|
| Write-offs |
|
8 |
|
- |
|
|
69 |
|
- |
|
| Reversals – no effect on income |
|
- |
|
241 |
|
|
8 |
|
408 |
|
| |
|
|
|
|
|
|
|
|
|
|
| Balance at the end of the |
|
(544) |
|
(1,494) |
|
|
(1,574 |
|
(2,237) |
|
(i) Regarding the acquisition and merger of Itaú
Administração Previdenciária Ltda.
(ii) Regarding the acquisition of Compliasset Software e
Soluções Digitais S.A. on March 7, 2023.
The aging list of accounts receivable is represented as
follows:
| |
|
|
|
Individual |
|
|
|
|
Consolidated |
|
| |
|
03/31/2023 |
|
12/31/2022 |
|
|
03/31/2023 |
|
12/31/2022 |
|
| |
|
|
|
|
|
|
|
|
|
|
| Services billable |
|
8,224 |
|
3,763 |
|
|
16,615 |
|
7,511 |
|
| Coming due |
|
15,504 |
|
15,087 |
|
|
29,968 |
|
29,869 |
|
| Overdue: |
|
|
|
|
|
|
|
|
|
|
| Up to 90 days |
|
2,256 |
|
485 |
|
|
4,852 |
|
3,481 |
|
| 91 to 180 days |
|
11 |
|
6 |
|
|
1,594 |
|
248 |
|
| 181 to 270 days |
|
6 |
|
2 |
|
|
215 |
|
33 |
|
| 271 to 360 days |
|
2 |
|
6 |
|
|
49 |
|
20 |
|
| Over 360 days |
|
524 |
|
528 |
|
|
831 |
|
798 |
|
| |
|
|
|
|
|
|
|
|
|
|
| |
|
26,527 |
|
19,877 |
|
|
54,124 |
|
41,960 |
|
SINQIA S.A. AND SUBSIDIARIES.
MANAGEMENT’S NOTES TO THE INTERIM INFORMATION FOR THE QUARTERS ENDED MARCH 31, 2023 AND 2022 AND
DECEMBER 31, 2022
(In thousands of Reais – R$)
|
8 |
TAXES AND CONTRIBUTIONS RECOVERABLE |
| |
|
|
|
Individual |
|
|
|
|
Consolidated |
|
| |
|
03/31/2023 |
|
12/31/2022 |
|
|
03/31/2023 |
|
12/31/2022 |
|
| |
|
|
|
|
|
|
|
|
|
|
| IRRF and IRPJ/CSLL to offset (i) |
|
15,644 |
|
12,671 |
|
|
21,355 |
|
17,046 |
|
| PIS, COFINS and CS |
|
|
|
|
|
|
|
|
|
|
| withheld |
|
- |
|
- |
|
|
24 |
|
47 |
|
| Others |
|
16 |
|
17 |
|
|
23 |
|
68 |
|
| |
|
|
|
|
|
|
|
|
|
|
| |
|
15,660 |
|
12,688 |
|
|
21,402 |
|
17,161 |
|
| |
|
|
|
|
|
|
|
|
|
|
| Current |
|
14,332 |
|
11,743 |
|
|
19,897 |
|
15,840 |
|
| Non-current |
|
1,328 |
|
945 |
|
|
1,505 |
|
1,321 |
|
(i) Refers to withholding income tax and prepayments of income tax and
social contribution.
|
a) |
Related party information |
The table below provides information on outstanding balances as of
March 31, 2023 and December 31, 2022 between the Parent Company, its subsidiaries and the Company's management:
| |
|
|
|
Individual |
|
| Amounts receivable from Related Parties – Assets |
|
03/31/2023 |
|
12/31/2022 |
|
| |
|
|
|
|
|
| Sinqia Tecnologia Ltda. |
|
260 |
|
3,067 |
|
| Homie do Brasil Informática Ltda. |
|
359 |
|
326 |
|
| |
|
|
|
|
|
| Non-current assets |
|
619 |
|
3,393 |
|
| |
|
|
|
|
|
| |
|
|
|
Individual |
|
| Recovery of Expenses (Expenses) – Income |
|
03/31/2023 |
|
12/31/2022 |
|
| |
|
|
|
|
|
| Sinqia S.A. |
|
- |
|
33,575 |
|
| Sinqia Tecnologia Ltda. |
|
- |
|
(11,558) |
|
| Newcon Software S.A. |
|
- |
|
(22.017) |
|
| |
|
|
|
|
|
| |
|
- |
|
- |
|
Transactions between Group companies refer to the sharing of expenses,
mainly administrative, and are carried out based on contracts signed between the parties. There are no purchase and sale transactions involving products or services between the companies.
SINQIA S.A. AND SUBSIDIARIES.
MANAGEMENT’S NOTES TO THE INTERIM INFORMATION FOR THE QUARTERS ENDED MARCH 31, 2023 AND 2022 AND DECEMBER 31, 2022
(In thousands of Reais – R$)
|
b) |
Management compensation |
The Company does not have any additional post-employment
obligations, nor does it offer other long-term benefits, such as leaves and other benefits based on time served. The Company does not offer any benefits upon termination of senior management, either, other than those required by the
applicable labor laws in Brazil.
Short-term benefits
The Annual Shareholders’ Meeting set overall annual
compensation for the Company's managers for the year 2023 in the amount of no more than R$22,778,000 (compared to the amount realized of R$13,003,000 for the year 2022).
Short-term compensation includes salaries, payroll
charges, benefits and variable bonuses and is summarized as follows:
| |
|
Individual and Consolidated |
| |
|
03/31/2023 |
|
|
03/31/2022 |
|
| |
|
(3 months) |
|
|
(3 months) |
|
| |
|
|
|
|
|
|
|
|
| Salaries and payroll charges |
|
|
2,507 |
|
|
|
1,208 |
|
| Benefits |
|
|
360 |
|
|
|
122 |
|
| Variable bonuses and payment in shares |
|
|
- |
|
|
|
23 |
|
| |
|
|
2,867 |
|
|
|
1,353 |
|
The Stock Option Plan (“Plan”) provides for the granting
of options to purchase common shares (“Options”) in the Company. The Plan aims to (a) attract, retain and engage key personnel for the Company's management ("Beneficiaries"), (b) align the Beneficiaries' interests with the interests of
the Company and its shareholders from a long-term perspective and (c) encourage Beneficiaries to contribute to obtaining good results for the Company.
Number of Shares Included in the Plan: The options granted
under the Plan, including those already exercised or not, and excluding those canceled due to termination, death, permanent disability or retirement, may confer rights on common shares representing up to three percent (3%) of the
Company's capital stock as of the date of approval of the Plan.
Exercise of Options: The options granted may be exercised
so long as the terms and conditions stipulated in this Plan and by the Board of Directors are met, as well as the terms and conditions set forth in the relevant Option Agreements. The Beneficiary may exercise all or any part of the
exercisable Options, but it is agreed that, in each partial exercise of the Options, the Beneficiary must exercise at least 25% of the Options that held thereby that are exercisable. The exercise of part of the Options by the Beneficiary
will not affect the exercise of other Options held.
The fair value of options granted is estimated on the date
of grant based on the Black-Scholes option pricing model.
SINQIA S.A. AND SUBSIDIARIES.
MANAGEMENT’S NOTES TO THE INTERIM INFORMATION FOR THE QUARTERS ENDED MARCH 31, 2023 AND 2022 AND DECEMBER 31, 2022
(In thousands of Reais – R$)
The main events related to the current plans, the variables used in the
calculations and the results are:
| |
|
|
Grants |
|
|
|
|
|
|
|
|
Fair value assumptions |
|
| Date |
|
|
Number of Options |
|
|
Exercise price in Reais |
|
|
Fair value of shares in Reais |
|
|
Volatility rate |
|
|
Risk-free rate |
|
|
Maturity period |
|
| 09/30/2019 |
|
|
|
98,646 |
|
|
|
22.08 |
|
|
|
18.70 |
|
|
|
47.82 |
% |
|
|
9.75 |
% |
|
|
4 years |
|
| 03/31/2021 |
|
|
|
200,424 |
|
|
|
17.24 |
|
|
|
25.50 |
|
|
|
48.26 |
% |
|
|
6.00 |
% |
|
|
4 years |
|
| 05/31/2021 |
|
|
|
86,382 |
|
|
|
29.56 |
|
|
|
22.46 |
|
|
|
47.82 |
% |
|
|
7.00 |
% |
|
|
4 years |
|
| 09/02/2021 |
|
|
|
70,044 |
|
|
|
30.03 |
|
|
|
23.10 |
|
|
|
47.82 |
% |
|
|
7.00 |
% |
|
|
4 years |
|
| 04/30/2022 |
|
|
|
273,008 |
|
|
|
14.90 |
|
|
|
19.08 |
|
|
|
47.82 |
% |
|
|
9.38 |
% |
|
|
4 years |
|
|
10 |
PROPERTY AND EQUIPMENT |
The property and equipment of the Company and its
subsidiaries are recorded at acquisition cost, and the depreciation of assets is calculated using the straight-line method and takes into account the estimated economic useful lives of the assets. The details of the Company's property and
equipment are shown in the tables below:
| |
|
|
|
|
|
|
|
|
|
|
|
|
Individual |
|
| |
|
|
|
|
|
|
|
|
|
|
|
|
03/31/2023 |
|
|
|
12/31/2022 |
|
| |
|
Useful life (years) |
|
|
Cost |
|
|
|
Accumulated depreciation |
|
|
|
Net |
|
|
|
Net |
|
| |
|
|
|
|
|
|
|
|
|
|
|
|
|
|
|
|
|
|
|
Facilities and improvements
|
|
9 – 10 |
|
|
7,848 |
|
|
|
(4,700 |
) |
|
|
3,148 |
|
|
|
3,292 |
|
|
Electrical appliances and materials
|
|
9 – 12 |
|
|
561 |
|
|
|
(387 |
) |
|
|
174 |
|
|
|
194 |
|
|
Furniture and fixtures
|
|
9 – 12 |
|
|
2,372 |
|
|
|
(1,608 |
) |
|
|
764 |
|
|
|
817 |
|
|
Lease right of use
|
|
2 – 10 |
|
|
7,394 |
|
|
|
(2,508 |
) |
|
|
4,886 |
|
|
|
4,786 |
|
|
Computers and peripherals
|
|
4 – 5 |
|
|
18,437 |
|
|
|
(9,485 |
) |
|
|
8,952 |
|
|
|
8,321 |
|
| |
|
|
|
|
|
|
|
|
|
|
|
|
|
|
|
|
|
|
| |
|
|
|
|
36,612 |
|
|
|
(18,688 |
) |
|
|
17,924 |
|
|
|
17,410 |
|
| |
|
|
|
|
|
|
|
|
|
Consolidated |
|
| |
|
|
|
|
|
|
|
|
|
|
|
|
03/31/2023 |
|
|
|
12/31/2022 |
|
| |
|
Useful life (years) |
|
|
Cost |
|
|
|
Accumulated depreciation |
|
|
|
Net |
|
|
|
Net |
|
| |
|
|
|
|
|
|
|
|
|
|
|
|
|
|
|
|
|
|
|
Facilities and improvements
|
|
9 – 10 |
|
|
10,524 |
|
|
|
(7,072 |
) |
|
|
3,452 |
|
|
|
3,553 |
|
|
Electrical appliances and materials
|
|
9 – 12 |
|
|
749 |
|
|
|
(502 |
) |
|
|
247 |
|
|
|
271 |
|
|
Furniture and fixtures
|
|
9 – 12 |
|
|
3,579 |
|
|
|
(2,167 |
) |
|
|
1,412 |
|
|
|
1,476 |
|
|
Lease right of use
|
|
2 – 10 |
|
|
39,732 |
|
|
|
(13,053 |
) |
|
|
26,679 |
|
|
|
26,565 |
|
|
Computers and peripherals
|
|
4 – 5 |
|
|
25,167 |
|
|
|
(12,540 |
) |
|
|
12,627 |
|
|
|
11,990 |
|
|
Vehicles
|
|
5 |
|
|
300 |
|
|
|
(111 |
) |
|
|
189 |
|
|
|
205 |
|
|
Buildings
|
|
25 |
|
|
3,900 |
|
|
|
(1,234 |
) |
|
|
2,666 |
|
|
|
2,680 |
|
| |
|
|
|
|
|
|
|
|
|
|
|
|
|
|
|
|
|
|
| |
|
|
|
|
83,951 |
|
|
|
(36,679 |
) |
|
|
47,272 |
|
|
|
46,740 |
|
SINQIA S.A. AND SUBSIDIARIES.
MANAGEMENT’S NOTES TO THE INTERIM INFORMATION FOR THE QUARTERS ENDED MARCH 31, 2023 AND 2022 AND DECEMBER 31, 2022
(In thousands of Reais – R$)
| |
|
Individual |
| |
|
Facilities and improvements |
|
|
Electrical appliances and materials |
|
|
Furniture and fixtures |
|
|
Lease right of use |
|
|
Computers and peripherals |
|
|
Total |
|
| |
|
|
|
|
|
|
|
|
|
|
|
|
|
|
|
|
|
|
| Balances as of December 31, 2022 |
|
|
3,292 |
|
|
|
194 |
|
|
|
817 |
|
|
|
4,786 |
|
|
|
8,321 |
|
|
|
17,410 |
|
| Additions |
|
|
8 |
|
|
|
- |
|
|
|
24 |
|
|
|
- |
|
|
|
1,352 |
|
|
|
1,384 |
|
| Additions - right of use (i) |
|
|
- |
|
|
|
- |
|
|
|
- |
|
|
|
303 |
|
|
|
- |
|
|
|
303 |
|
| Depreciation |
|
|
(152) |
|
|
|
(20) |
|
|
|
(77) |
|
|
|
(203) |
|
|
|
(721) |
|
|
|
(1,173) |
|
| Balances as of March 31, 2023 |
|
|
3,148 |
|
|
|
174 |
|
|
|
764 |
|
|
|
4,886 |
|
|
|
8,952 |
|
|
|
17,924 |
|
|
(i) |
The additions related to CPC 06 (R2) consist of the recognition of the right of use under new property lease agreements. |
| |
|
Consolidated |
| |
|
Facilities and improvements |
|
|
Electrical appliances and materials |
|
|
Furniture and fixtures |
|
|
Lease right of use |
|
|
Computers and peripherals |
|
|
Vehicles |
|
|
Buildings |
|
|
Total |
|
| |
|
|
|
|
|
|
|
|
|
|
|
|
|
|
|
|
|
|
|
|
|
|
|
|
| Balances as of December 31, 2022 |
|
|
3,553 |
|
|
|
271 |
|
|
|
1,476 |
|
|
|
26,565 |
|
|
|
11,990 |
|
|
|
205 |
|
|
|
2,680 |
|
|
|
46,740 |
|
| Additions |
|
|
8 |
|
|
|
- |
|
|
|
24 |
|
|
|
- |
|
|
|
1,609 |
|
|
|
- |
|
|
|
- |
|
|
|
1,641 |
|
| Additions referring to CPC 06 (R2) (i) |
|
|
- |
|
|
|
- |
|
|
|
- |
|
|
|
1,443 |
|
|
|
- |
|
|
|
- |
|
|
|
- |
|
|
|
1,443 |
|
| Additions due to business acquisitions (ii) |
|
|
62 |
|
|
|
- |
|
|
|
19 |
|
|
|
85 |
|
|
|
28 |
|
|
|
- |
|
|
|
- |
|
|
|
194 |
|
| Depreciation |
|
|
(171) |
|
|
|
(24) |
|
|
|
(107) |
|
|
|
(1,414) |
|
|
|
(1,000) |
|
|
|
(16) |
|
|
|
(14) |
|
|
|
(2,746) |
|
| Balances as of March 31, 2023 |
|
|
3,452 |
|
|
|
247 |
|
|
|
1,412 |
|
|
|
26,679 |
|
|
|
12,627 |
|
|
|
189 |
|
|
|
2,666 |
|
|
|
47,272 |
|
|
(i) |
The additions referring to CPC 06 (R2) consist of the recognition of the right of use under new property lease agreements. |
|
(ii) |
In 2022, it refers to the assets arising from the business combination of Newcon Software Ltda., Sinqia Seguridade Ltda. and Lote45
Participações S.A., and in 2023, it refers to the assets arising from the business combination of Compliasset Software e Soluções Digitais S.A. |
SINQIA S.A. AND SUBSIDIARIES.
MANAGEMENT’S NOTES TO THE INTERIM INFORMATION FOR THE QUARTERS ENDED MARCH 31, 2023 AND 2022 AND DECEMBER 31, 2022
(In thousands of Reais – R$)
| |
|
|
|
|
|
|
|
|
|
Individual |
|
| |
|
|
|
|
|
|
|
03/31/2023 |
|
12/31/2022 |
|
| |
|
Useful life (years) |
|
Cost |
|
Accumulated amortization and impairment |
|
Net |
|
Net |
|
| |
|
|
|
|
|
|
|
|
|
|
|
| Goodwill on acquisition of Subsidiaries Goodwill |
|
- |
|
160,829 |
|
(2,860) |
|
157,969 |
|
157,969 |
|
| Right to use software |
|
1-5 |
|
27,997 |
|
(21,179) |
|
6,818 |
|
5,525 |
|
| Trademarks and patents |
|
5-10 |
|
2,278 |
|
(2,278) |
|
- |
|
- |
|
| Acquired software |
|
5 |
|
21,983 |
|
(12,071) |
|
9,912 |
|
10,535 |
|
| Customer portfolio |
|
10 |
|
52,655 |
|
(15,143) |
|
37,512 |
|
38,652 |
|
| Non-compete agreement |
|
5 |
|
4,575 |
|
(4,575) |
|
- |
|
- |
|
| New product development |
|
5 |
|
11,832 |
|
(6,301) |
|
5,531 |
|
3,601 |
|
| Right to use servers |
|
1-3 |
|
61,987 |
|
(26,939) |
|
35,048 |
|
40,647 |
|
| |
|
|
|
344,136 |
|
(91,346) |
|
252,790 |
|
256,929 |
|
| |
|
|
|
|
|
|
|
|
|
Consolidated |
|
| |
|
|
|
|
|
|
|
03/31/2023 |
|
12/31/2022 |
|
| |
|
Useful life (years) |
|
Cost |
|
Accumulated amortization and impairment |
|
Net |
|
Net |
|
| |
|
|
|
|
|
|
|
|
|
|
|
| Goodwill on acquisition of subsidiaries - Goodwill |
|
- |
|
644,658 |
|
(2,860) |
|
641,798 |
|
630,596 |
|
| Right to use software |
|
1-5 |
|
34,252 |
|
(23,989) |
|
10,263 |
|
8,988 |
|
| Trademarks and patents |
|
5-10 |
|
62,871 |
|
(12,901) |
|
49,970 |
|
51,044 |
|
| Acquired software |
|
5 |
|
104,794 |
|
(38,816) |
|
65,978 |
|
65,152 |
|
| Customer portfolio |
|
10 |
|
341,657 |
|
(62,162) |
|
279,495 |
|
276,303 |
|
| Non-compete agreement |
|
5 |
|
9,068 |
|
(8,146) |
|
922 |
|
1,121 |
|
| New product development |
|
5 |
|
12,571 |
|
(6,301) |
|
6,270 |
|
4,262 |
|
| Right to use servers |
|
1-3 |
|
61,987 |
|
(26,939) |
|
35,048 |
|
40,647 |
|
| |
|
|
|
1,271,858 |
|
(182,114) |
|
1,089,744 |
|
1,078,113 |
|
SINQIA S.A. AND SUBSIDIARIES.
March 31, 2023
(In thousands of Reais, except as indicated otherwise)
| |
|
Individual |
| |
|
Goodwill on acquisition of subsidiaries - Goodwill (i) |
|
|
Right to use software |
|
|
Trademarks and patents |
|
|
Acquired software |
|
|
Customer portfolio |
|
|
New product development |
|
|
Right of use under leases |
|
|
Total |
|
| Balances as of December 31, 2022 |
|
|
157,969 |
|
|
|
5,525 |
|
|
|
- |
|
|
|
10,536 |
|
|
|
38,652 |
|
|
|
3,600 |
|
|
|
40,647 |
|
|
|
256,929 |
|
| Additions |
|
|
- |
|
|
|
4,342 |
|
|
|
- |
|
|
|
- |
|
|
|
- |
|
|
|
1931 |
|
|
|
- |
|
|
|
6,273 |
|
| Additions - right of use (ii) |
|
|
- |
|
|
|
- |
|
|
|
- |
|
|
|
- |
|
|
|
- |
|
|
|
- |
|
|
|
611 |
|
|
|
611 |
|
| Write-offs |
|
|
- |
|
|
|
- |
|
|
|
- |
|
|
|
- |
|
|
|
- |
|
|
|
- |
|
|
|
(1964) |
|
|
|
(1964) |
|
| Amortization |
|
|
- |
|
|
|
(3,049) |
|
|
|
- |
|
|
|
(624) |
|
|
|
(1,140) |
|
|
|
- |
|
|
|
(4,246) |
|
|
|
(9,059) |
|
| Balances as of March 31, 2023 |
|
|
157,969 |
|
|
|
6,818 |
|
|
|
- |
|
|
|
9,912 |
|
|
|
37,512 |
|
|
|
5,531 |
|
|
|
35,048 |
|
|
|
252,790 |
|
|
(i)
|
The additions referring to CPC 06 (R2) consist of the recognition of the right of use under the new server lease agreements. |
| |
|
Consolidated |
| |
|
Goodwill on acquisition of subsidiaries - Goodwill (i) |
|
|
Right to use software |
|
|
Trademarks and patents |
|
|
Acquired software |
|
|
Customer portfolio |
|
|
Non-compete agreement |
|
|
New product development |
|
|
Right of use under leases |
|
|
Total |
|
| Balances as of December 31, 2022 |
|
|
630,596 |
|
|
|
8,988 |
|
|
|
51,044 |
|
|
|
65,152 |
|
|
|
276,303 |
|
|
|
1,121 |
|
|
|
4,262 |
|
|
|
40,647 |
|
|
|
1,078,113 |
|
| Additions |
|
|
- |
|
|
|
4,350 |
|
|
|
- |
|
|
|
- |
|
|
|
- |
|
|
|
- |
|
|
|
2008 |
|
|
|
- |
|
|
|
6,358 |
|
| Additions right of use (ii) |
|
|
- |
|
|
|
- |
|
|
|
- |
|
|
|
- |
|
|
|
- |
|
|
|
- |
|
|
|
- |
|
|
|
611 |
|
|
|
611 |
|
| Additions due to business Acquisition (iii) |
|
|
11,202 |
|
|
|
- |
|
|
|
962 |
|
|
|
4,150 |
|
|
|
10,228 |
|
|
|
- |
|
|
|
- |
|
|
|
- |
|
|
|
26,542 |
|
| Write-offs |
|
|
- |
|
|
|
- |
|
|
|
- |
|
|
|
- |
|
|
|
- |
|
|
|
- |
|
|
|
- |
|
|
|
(1964) |
|
|
|
(1964) |
|
| Amortization |
|
|
- |
|
|
|
(3,075) |
|
|
|
(2036) |
|
|
|
(3,324) |
|
|
|
(7,036) |
|
|
|
(199) |
|
|
|
- |
|
|
|
(4,246) |
|
|
|
(19,916) |
|
| Balances as of March 31, 2023 |
|
|
641,798 |
|
|
|
10,263 |
|
|
|
49,970 |
|
|
|
65,978 |
|
|
|
279,495 |
|
|
|
922 |
|
|
|
6,270 |
|
|
|
35,048 |
|
|
|
1,089,744 |
|
|
(i)
|
The entire balance of goodwill recognized is allocated to the Company's only cash-generating unit. |
|
(ii)
|
The additions referring to CPC 06 (R2) consist of the recognition of the right of use under the new server lease agreements. |
|
(iii)
|
In 2022, it refers to the assets arising from the business combination of Newcon Software Ltda., Sinqia Seguridade Ltda. and Lote45 Participações S.A., and in
2023 it refers to the assets arising from the business combination of Compliasset Software e Soluções Digitais S.A. |
SINQIA S.A. AND SUBSIDIARIES.
MANAGEMENT’S NOTES FROM TO THE INTERIM INFORMATION FOR THE QUARTERS ENDED MARCH 31, 2023 AND 2022 AND DECEMBER 31,
2022
(In thousands of Reais – R$)
|
12 |
DEBENTURES – INDIVIDUAL AND CONSOLIDATED |
| |
|
|
Charges |
|
|
Maturity |
|
|
03/31/2023 |
|
|
12/31/2022 |
|
| |
|
|
|
|
|
|
|
|
|
|
|
|
|
| 1st Issue of Debentures (i) |
|
|
|
CDI+1.50% |
|
|
|
02/22/2024 |
|
|
|
11,505 |
|
|
|
14,634 |
|
| 2nd Issue of Debentures (ii) |
|
|
|
CDI+2.30% |
|
|
|
07/15/2026 |
|
|
|
206,658 |
|
|
|
222,022 |
|
| |
|
|
|
|
|
|
|
|
|
|
|
|
|
|
|
|
|
| Total |
|
|
|
|
|
|
|
|
|
|
|
218,163 |
|
|
|
236,656 |
|
| |
|
|
|
|
|
|
|
|
|
|
|
|
|
|
|
|
|
| Current |
|
|
|
|
|
|
|
|
|
|
|
74,552 |
|
|
|
74,500 |
|
| Non-current |
|
|
|
|
|
|
|
|
|
|
|
143,611 |
|
|
|
162,156 |
|
|
(i) |
The first issue of simple, non-convertible debentures is secured by credit rights arising from receivables. Additionally, the Company
is required to keep the amount of R$3,000 deposited, which was recorded in the securities account in non-current assets. |
|
(ii) |
The second issue of simple, non-convertible debentures is guaranteed by credit rights from the checking accounts linked to the
transaction and the funds deposited therein, arising from the Company's contracts and customers. |
Shown below are changes in debentures:
| |
|
|
03/31/2023 |
|
|
|
03/31/2022 |
|
| |
|
|
|
|
|
|
|
|
| Balance at the beginning of the period |
|
|
236,656 |
|
|
|
173,639 |
|
| Interest incurred |
|
|
8,991 |
|
|
|
5,500 |
|
| Interest paid |
|
|
(8,973) |
|
|
|
(5,098) |
|
| Amortization |
|
|
(18,511) |
|
|
|
(3,125) |
|
| |
|
|
|
|
|
|
|
|
| Balance at the end of the period |
|
|
218,163 |
|
|
|
170,916 |
|
The expected payment of debentures is shown below:
| |
|
|
03/31/2023 |
|
|
|
03/31/2022 |
|
| |
|
|
|
|
|
|
|
|
| 2022 |
|
|
- |
|
|
|
24,737 |
|
| 2023 |
|
|
55,553 |
|
|
|
49,236 |
|
| 2024 |
|
|
64,159 |
|
|
|
38,803 |
|
| 2025 |
|
|
62,177 |
|
|
|
36,716 |
|
| 2026 |
|
|
36,274 |
|
|
|
21,424 |
|
| |
|
|
|
|
|
|
|
|
| |
|
|
218,163 |
|
|
|
170,916 |
|
SINQIA S.A. AND SUBSIDIARIES.
MANAGEMENT’S NOTES FROM TO THE INTERIM INFORMATION FOR THE QUARTERS ENDED MARCH 31, 2023 AND 2022 AND DECEMBER 31, 2022
(In thousands of Reais – R$)
The debentures have financial covenants that must be
determined on the base date of December 31. For 2022, Net Debt divided by EBITDA must be equal to 3 or lower, and from 2023 to 2026, Net Debt divided by EBITDA must be equal to 2.75 or lower.
Gross Debt means the sum of short- and long-term
debentures, including (i) bonds discounted with repayment and anticipation of receivables, (ii) lease purchasing, unless the lease purchase is due to rental agreements for operating properties and the right to use servers, (iii)
non-convertible, fixed-income securities issued by public or private companies, in the local or international markets, (iv) liabilities arising from derivative financial instruments, (v) financial debts of acquired companies, provided
that the interest is greater than fifty percent (50%) of the share capital of the respective acquiree, and not yet consolidated, (vi) debts and convertible securities, and (vii) loan liabilities net of loan assets, duly represented in the
Issuer’s consolidated balance sheet, in the “Debentures” account in the consolidated quarterly financial information or in the consolidated annual financial statements.
Net Debt means the sum of Gross Debt net of cash, cash
deposits, cash invested in financial assets with the expectation of generating value over time, available in a period of less than 360 days.
As of the present date, the Company expects to comply with
all restrictive clauses.
| |
|
|
|
|
Individual |
|
|
|
|
|
Consolidated |
|
| |
|
|
03/31/2023 |
|
|
|
12/31/2022 |
|
|
|
03/31/2023 |
|
|
|
12/31/2022 |
|
| |
|
|
|
|
|
|
|
|
|
|
|
|
|
|
|
|
| INSS/FGTS payable |
|
|
7,249 |
|
|
|
5,021 |
|
|
|
14,430 |
|
|
|
10,172 |
|
| IRRF on salaries |
|
|
3,390 |
|
|
|
4,516 |
|
|
|
5,153 |
|
|
|
7,256 |
|
| Vacation pay |
|
|
16,703 |
|
|
|
15,045 |
|
|
|
29,511 |
|
|
|
26,655 |
|
| Bonuses, commissions and profit-sharing (i) |
|
|
18,087 |
|
|
|
13,943 |
|
|
|
19,805 |
|
|
|
17,320 |
|
| Others |
|
|
210 |
|
|
|
94 |
|
|
|
729 |
|
|
|
831 |
|
| |
|
|
|
|
|
|
|
|
|
|
|
|
|
|
|
|
| |
|
|
45,639 |
|
|
|
38,619 |
|
|
|
69,628 |
|
|
|
62,234 |
|
|
(i) |
The provision for bonuses and profit-sharing is recorded monthly and depends on the achievement of corporate and individual targets
of employees. The payment of these earnings always occurs in March and April of the subsequent year. |
SINQIA S.A. AND SUBSIDIARIES.
MANAGEMENT’S NOTES FROM TO THE INTERIM INFORMATION FOR THE QUARTERS ENDED MARCH 31, 2023 AND 2022 AND DECEMBER 31, 2022
(In thousands of Reais – R$)
| |
|
Individual |
|
|
Consolidated |
|
|
|
|
03/31/2023 |
|
|
|
12/31/2022 |
|
|
|
03/31/2023 |
|
|
|
12/31/2022 |
|
| IR and CS payable |
|
|
25 |
|
|
|
16 |
|
|
|
2,920 |
|
|
|
3,252 |
|
| ISS payable |
|
|
779 |
|
|
|
801 |
|
|
|
2,082 |
|
|
|
1907 |
|
| PIS/COFINS payable |
|
|
332 |
|
|
|
190 |
|
|
|
1,214 |
|
|
|
769 |
|
| Other taxes payable |
|
|
80 |
|
|
|
58 |
|
|
|
199 |
|
|
|
187 |
|
| |
|
|
|
|
|
|
|
|
|
|
|
|
|
|
|
|
| |
|
|
1,216 |
|
|
|
1,065 |
|
|
|
6,415 |
|
|
|
6,115 |
|
|
15 |
INVESTMENT PURCHASE OBLIGATIONS |
These refer to obligations consisting of installments
payable for the acquisition of investments made by the Company and its subsidiaries, negotiated for payment by installments, and for contracts that are not linked market interest rates, the present value adjustment is made (using an
average rate between 4.5% and 11%, reflecting the borrowed capital rate for the acquisition period). They are recorded in current and non-current liabilities, as follows:
| |
|
|
|
|
Individual |
|
|
|
|
|
Consolidated |
|
| |
|
|
03/31/2023 |
|
|
|
12/31/2022 |
|
|
|
03/31/2023 |
|
|
|
12/31/2022 |
|
| |
|
|
|
|
|
|
|
|
|
|
|
|
|
|
|
|
| Acquisition: |
|
|
|
|
|
|
|
|
|
|
|
|
|
|
|
|
| Atena |
|
|
- |
|
|
|
- |
|
|
|
3,240 |
|
|
|
4,082 |
|
| ADSPrev |
|
|
- |
|
|
|
- |
|
|
|
520 |
|
|
|
1,070 |
|
| SoftPar |
|
|
- |
|
|
|
- |
|
|
|
6,372 |
|
|
|
6,230 |
|
| Stock&Info |
|
|
- |
|
|
|
- |
|
|
|
1,034 |
|
|
|
965 |
|
| Tree Solution |
|
|
- |
|
|
|
- |
|
|
|
3,352 |
|
|
|
3,203 |
|
| Fromtis |
|
|
- |
|
|
|
- |
|
|
|
7,641 |
|
|
|
7,516 |
|
| ISP |
|
|
32,525 |
|
|
|
42,372 |
|
|
|
32,525 |
|
|
|
42,372 |
|
| Dendron |
|
|
3,600 |
|
|
|
3,568 |
|
|
|
3,600 |
|
|
|
3,568 |
|
| Simply |
|
|
4,400 |
|
|
|
4,362 |
|
|
|
4,400 |
|
|
|
4,361 |
|
| Lote45 |
|
|
- |
|
|
|
- |
|
|
|
- |
|
|
|
26,833 |
|
| Mercer |
|
|
- |
|
|
|
- |
|
|
|
4,453 |
|
|
|
7,316 |
|
| Newcon |
|
|
- |
|
|
|
- |
|
|
|
60,301 |
|
|
|
83,222 |
|
| Compliasset |
|
|
- |
|
|
|
- |
|
|
|
5,045 |
|
|
|
- |
|
| |
|
|
|
|
|
|
|
|
|
|
|
|
|
|
|
|
| |
|
|
40,525 |
|
|
|
50,302 |
|
|
|
132,483 |
|
|
|
190,738 |
|
| |
|
|
|
|
|
|
|
|
|
|
|
|
|
|
|
|
| Current |
|
|
14,680 |
|
|
|
14,384 |
|
|
|
51,714 |
|
|
|
79,101 |
|
| Non-current |
|
|
25,845 |
|
|
|
35,918 |
|
|
|
80,769 |
|
|
|
111,637 |
|
SINQIA S.A. AND SUBSIDIARIES.
MANAGEMENT’S NOTES FROM TO THE INTERIM INFORMATION FOR THE QUARTERS ENDED MARCH 31, 2023 AND 2022 AND DECEMBER 31,
2022
(In thousands of Reais – R$)
Changes in investment acquisition obligations are show below:
| |
|
Individual |
|
|
Consolidated |
|
| |
|
03/31/2023 |
|
|
03/31/2023 |
|
| |
|
|
|
|
|
|
|
|
| Balance at the beginning of the period |
|
|
50,302 |
|
|
|
190,738 |
|
| Interest incurred |
|
|
1,791 |
|
|
|
3,631 |
|
| Addition due to business acquisition (i) |
|
|
- |
|
|
|
5,045 |
|
| Interest paid |
|
|
(1891) |
|
|
|
(4,742) |
|
| Amortization |
|
|
(9,677) |
|
|
|
(62,189) |
|
| |
|
|
|
|
|
|
|
|
| Balance at the end of the period |
|
|
40,525 |
|
|
|
132,483 |
|
(i) It refers to amounts resulting from the acquisition of
Compliasset Software e Soluções Digitais S.A.
| |
|
Individual |
|
|
Consolidated |
|
| |
|
|
03/31/2023 |
|
|
|
03/31/2023 |
|
| |
|
|
|
|
|
|
|
|
| 2023 |
|
|
4,000 |
|
|
|
13,444 |
|
| 2024 |
|
|
14,680 |
|
|
|
52,319 |
|
| 2025 |
|
|
10,841 |
|
|
|
29,764 |
|
| 2026 |
|
|
11,004 |
|
|
|
24,065 |
|
| 2027 |
|
|
- |
|
|
|
12,891 |
|
| |
|
|
|
|
|
|
|
|
| |
|
|
40,525 |
|
|
|
132,483 |
|
|
16 |
PROVISION FOR LAWSUITS |
The Company, in the ordinary course of
its business, is subject to tax, civil and labor lawsuits. Based on the opinion of its legal advisors, Management assesses the expected outcome of the lawsuits in progress and determines whether a provision needs to be set up based on the
best estimate of the expenditure required to settle the current liability on the balance sheet date.
The table below presents the position of
provisions for lawsuits:
| |
|
|
Individual |
|
|
Consolidated |
|
|
|
|
|
03/31/2023 |
|
|
|
12/31/2022 |
|
|
|
03/31/2023 |
|
|
|
12/31/2022 |
|
| |
|
|
|
|
|
|
|
|
|
|
|
|
|
|
|
|
|
| Civil |
|
|
|
9,077 |
|
|
|
9,223 |
|
|
|
10,998 |
|
|
|
11,784 |
|
| Labor |
|
|
|
11,707 |
|
|
|
13,915 |
|
|
|
44,394 |
|
|
|
46,982 |
|
| Tax |
|
|
|
12,880 |
|
|
|
13,469 |
|
|
|
79,072 |
|
|
|
81,100 |
|
| |
|
|
|
|
|
|
|
|
|
|
|
|
|
|
|
|
|
| |
|
|
|
33,664 |
|
|
|
36,607 |
|
|
|
134,464 |
|
|
|
139,866 |
|
SINQIA S.A. AND SUBSIDIARIES.
MANAGEMENT’S NOTES FROM TO THE INTERIM INFORMATION FOR THE QUARTERS ENDED MARCH 31, 2023 AND 2022 AND DECEMBER 31,
2022
(In thousands of Reais – R$)
Changes in provisions for lawsuits are shown below:
| |
|
Individual |
|
|
Consolidated |
|
| |
|
|
03/31/2023 |
|
|
|
03/31/2023 |
|
| |
|
|
|
|
|
|
|
|
| Balance at the beginning of the period |
|
|
36,607 |
|
|
|
139,866 |
|
| Additions (i) |
|
|
176 |
|
|
|
191 |
|
| Additions due to business acquisition (ii) |
|
|
- |
|
|
|
2,404 |
|
| Reversals |
|
|
(2,962) |
|
|
|
(7,510) |
|
| Interest incurred |
|
|
231 |
|
|
|
231 |
|
| Payments |
|
|
(388) |
|
|
|
(718) |
|
| |
|
|
|
|
|
|
|
|
| Balance at the end of the period |
|
|
33,664 |
|
|
|
134,464 |
|
(i) Additions include new lawsuits and
changes in values of lawsuits already recorded.
(ii) Concerning amounts resulting from the
acquisition of Compliasset Software e Soluções Digitais S.A.
The Company and its subsidiaries are also a party to labor
and tax lawsuits whose risk of loss, according to its legal advisors and the Company's Management, is rated as possible, for which no provision was recognized. The amount concerning the restated provisions for these lawsuits corresponds
to R$33,599 in the Individual statement as of March 31, 2023 (R$33,030 as of December 31, 2022) and R$35,149 in the Consolidated statement as of March 31, 2023 (R$35,082 as of December 31, 2022). Additionally, the Company has court
deposits amounting to R$104 in the Individual statement as of March 31, 2023 (R$187 as of December 31, 2022) and R$126 in the Consolidated statement as of March 31, 2023 (R$197 as of December 31, 2022).
In general, labor claims involve overtime, additional
hazard pay and/or dangerous work pay, wage parity, vacation pay, moral damages resulting from accidental actions, occupational illness, subsidiary liability involving service providers, etc.
Tax proceedings refer to legal disputes involving
municipal and federal taxes, particularly requests for offsets and/or refunds that have not been approved, as well as tax risks identified in the acquisition processes.
The civil lawsuits mainly refer to actions filed on the
grounds of certain problems in the provision of services offered and refund of amounts.
SINQIA S.A. AND SUBSIDIARIES.
MANAGEMENT’S NOTES FROM TO THE INTERIM INFORMATION FOR THE QUARTERS ENDED MARCH 31, 2023 AND
2022 AND DECEMBER 31, 2022
(In thousands of Reais – R$)
At a meeting held on August 26, 2021, the Board of
Directors approved an increase in the Company’s capital stock, within the authorized capital limit, pursuant to article 5 of the Bylaws, in the amount of R$400,042, through the issuance of seventeen million, three hundred and ninety-three
thousand, one hundred and sixty (17,393,160) common shares.
The Company’s capital stock is R$813,303, and is currently
represented by 87,941,972 registered common shares with no par value. Holders of common shares are entitled to one vote per share at the Company’s shareholders’ meetings.
The table below shows the number of shares held by
shareholders holding 5% or more of the common shares issued by the Company, as well as treasury shares.
| |
|
|
|
03/31/2023 |
|
|
|
12/31/2022 |
| Shareholders |
|
Shares |
|
% |
|
Shares |
|
% |
| |
|
|
|
|
|
|
|
|
| HIX Investimentos Ltda. |
|
9,588,025 |
|
10.90% |
|
9,588,025 |
|
10.90% |
| Antônio Luciano de Camargo |
|
6,483,752 |
|
7.37% |
|
6,483,752 |
|
7.37% |
| Bernardo Francisco Pereira |
|
5,689,450 |
|
6.47% |
|
5,689,450 |
|
6.47% |
| SFA Investimentos Ltda. |
|
5,404,400 |
|
6.15% |
|
5,404,400 |
|
6.15% |
| SK Tarpon |
|
4,405,877 |
|
5.01% |
|
4,405,877 |
|
5.01% |
| Treasury shares |
|
3,360,684 |
|
3.82% |
|
3,362,360 |
|
3.82% |
| Other shareholders |
|
53,009,784 |
|
60.28% |
|
53,008,108 |
|
60.28% |
| |
|
87,941,972 |
|
100.0% |
|
87,941,972 |
|
100.0% |
The revenue reserve is made up of the legal reserve and
the profit retention reserve arising from allocations of capital budgets approved at the Annual Shareholders’ Meetings.
a) Legal reserve
As of December 31, 2022, the legal reserve was determined
in the amount of R$832. In 2023, there was still no formation of legal reserve that will be realized as of December 31, 2023.
b) Dividends and return on equity
As of December 31, 2022, a distribution of profits in the
amount of R$4,690 was determined. In 2023, there was still no calculation of dividends that will be made as of December 31, 2023.
The balances of capital reserves are mainly composed of
the effects of the share-based compensation plan and changes in the purchase and sale prices of treasury shares.
In 2023, an amount of R$141 (R$878 in 2022) was recognized
in connection share-based compensation plans. There was a change of R$635 ((R$1,238) in 2022) in the capital reserve concerning shares exercised and not yet transferred to the beneficiaries, less the difference
SINQIA S.A. AND SUBSIDIARIES.
MANAGEMENT’S NOTES FROM TO THE INTERIM INFORMATION FOR THE QUARTERS ENDED MARCH 31, 2023 AND
2022 AND DECEMBER 31, 2022
(In thousands of Reais – R$)
between the purchase price and the delivery price of
treasury shares that have already been transferred.
The balance as of March 31, 2023 is R$12,643.
In a meeting held on March 10, 2021, the Board of
Directors authorized the purchase of up to 5,241,054 shares, representing 8.9% of the outstanding shares, through the launch of the Sixth Share Buyback Program.
In 2021, shares were purchased for an amount of R$99,777,
and part of these shares was delivered for an amount of R$56,109 in payment for the newly acquired Simply Sistemas S.A., Dendron Tecnologia S.A., Homie do Brasil Informática Ltda. and Rosk Software S.A.
For the quarter ended March 31, 2023, shares were
purchased in the amount of R$45 (R$21,658 in 2022), and shares were transferred upon options being exercised under Stock Option Plan in the amount of R$25 (R$4,380 in 2022), resulting in a balance in the treasury shares account of
R$58,194 (R$58,174 as of December 31, 2022).
The share issuing costs account reflects changes in
Shareholders’ Equity due to the issuance of new shares. In 2021, expenses of R$24,975 related to the increase in the Company’s capital stock were recorded, within the authorized capital limit, pursuant to article 5 of the Bylaws.
|
17.6 |
Non-controlling interest |
The non-controlling interest refers to the interest of the
shareholders of Homie do Brasil Informática Ltda., Rosk Software S.A., Lote45 Participações S.A. and Compliasset Software e Soluções Digitais S.A., representing an amount of R$16,816 in 2023 (R$20,067 in 2022).
SINQIA S.A. AND SUBSIDIARIES.
MANAGEMENT’S NOTES FROM TO THE INTERIM INFORMATION FOR THE QUARTERS ENDED MARCH 31, 2023 AND
2022 AND DECEMBER 31, 2022
(In thousands of Reais – R$)
| |
|
|
|
Individual |
|
|
|
Consolidated |
| |
|
03/31/2023 |
|
03/31/2022 |
|
03/31/2023 |
|
03/31/2022 |
| |
|
|
|
|
|
|
|
|
| Software |
|
54,541 |
|
52,107 |
|
155,867 |
|
129,252 |
| Services |
|
26,326 |
|
24,069 |
|
26,864 |
|
24,435 |
| Total gross revenues |
|
80,867 |
|
76,176 |
|
182,731 |
|
153,687 |
| |
|
|
|
|
|
|
|
|
| Revenue deductions |
|
(8,813) |
|
(8,342) |
|
(18,490) |
|
(14,831) |
| |
|
|
|
|
|
|
|
|
| Net revenues |
|
72,054 |
|
67,834 |
|
164,241 |
|
138,856 |
| |
|
|
|
|
|
|
|
|
| Tax basis |
|
80,867 |
|
76,176 |
|
182,731 |
|
153,687 |
| |
|
|
|
|
|
|
|
|
| Deductions |
|
|
|
|
|
|
|
|
| ISS |
|
(2,251) |
|
(2,129) |
|
(5,115) |
|
(4,418) |
| PIS and COFINS |
|
(2,939) |
|
(2,782) |
|
(6,725) |
|
(5,555) |
| Employer’s INSS |
|
(3,623) |
|
(3,431) |
|
(6,650) |
|
(4,858) |
| |
|
(8,813) |
|
(8,342) |
|
(18,490) |
|
(14,831) |
| |
|
|
|
|
|
|
|
|
| Software |
|
48,626 |
|
46,951 |
|
140,336 |
|
117,118 |
| Services |
|
23,428 |
|
20,883 |
|
23,905 |
|
21,738 |
| |
|
|
|
|
|
|
|
|
| |
|
72,054 |
|
67,834 |
|
164,241 |
|
138,856 |
The average taxes levied on sales in the period was 10.12%
for the Consolidated statement (9.65% on March 31, 2022), covering PIS/PASEP (Social Integration Program), COFINS (Financial Contribution for Social Security), the ISSQN (Tax on Services of Any Nature) and the employer’s INSS (National
Social Security Institute).
|
19 |
COSTS OF SERVICES PROVIDED |
| |
|
|
|
Individual |
|
|
|
Consolidated |
| |
|
03/31/2023 |
|
03/31/2022 |
|
03/31/2023 |
|
03/31/2022 |
| |
|
|
|
|
|
|
|
|
| Third-party services |
|
3,567 |
|
2,247 |
|
7,296 |
|
7,248 |
| Personnel, payroll charges and benefits |
|
41,420 |
|
|
|
78,471 |
|
|
| Depreciation and |
|
2,723 |
|
2,249 |
|
2,932 |
|
2,249 |
| Other costs |
|
3,506 |
|
3,000 |
|
8,290 |
|
6,198 |
| |
|
|
|
|
|
|
|
|
| |
|
51,216 |
|
35,711 |
|
96,989 |
|
80,632 |
SINQIA S.A. AND SUBSIDIARIES.
MANAGEMENT’S NOTES FROM TO THE INTERIM INFORMATION FOR THE QUARTERS ENDED MARCH 31, 2023 AND
2022 AND DECEMBER 31, 2022
(In thousands of Reais – R$)
| 20 |
GENERAL, ADMINISTRATIVE AND SELLING EXPENSES |
| |
|
|
|
Individual |
|
|
|
Consolidated |
| |
|
03/31/2023 |
|
03/31/2022 |
|
03/31/2023 |
|
03/31/2022 |
| |
|
|
|
|
|
|
|
(Restated) |
| |
|
|
|
|
|
|
|
|
| Third-party services |
|
2,227 |
|
1,602 |
|
3,331 |
|
4,777 |
| Personnel, payroll charges, benefits and bonuses |
|
18,882 |
|
2,298 |
|
27,577 |
|
17,095 |
| Commissions |
|
991 |
|
1,140 |
|
1,294 |
|
1,247 |
| Rents, insurance, condominium and other charges |
|
319 |
|
438 |
|
828 |
|
783 |
| Reversal of provision for lawsuits |
|
(2,786) |
|
(41) |
|
(7,319) |
|
(1,057) |
| Complement (reversal) of estimated provision for doubtful debts |
|
2 |
|
(174) |
|
478 |
|
(341) |
| Advertising and marketing |
|
138 |
|
290 |
|
160 |
|
365 |
| Depreciation and amortization |
|
8,584 |
|
8,263 |
|
19,730 |
|
13,799 |
| Other expenses |
|
1,396 |
|
768 |
|
2,065 |
|
1,369 |
| |
|
|
|
|
|
|
|
|
| |
|
29,753 |
|
14,584 |
|
48,144 |
|
38,037 |
SINQIA S.A. AND SUBSIDIARIES.
MANAGEMENT’S NOTES FROM TO THE INTERIM INFORMATION FOR THE QUARTERS ENDED MARCH 31, 2023 AND
2022 AND DECEMBER 31, 2022
(In thousands of Reais – R$)
| |
|
|
|
Individual |
|
|
|
Consolidated |
| |
|
03/31/2023 |
|
03/31/2022 |
|
03/31/2023 |
|
03/31/2022 |
| |
|
|
|
(Restated) |
|
|
|
(Restated) |
| |
|
|
|
|
|
|
|
|
| Financial revenues: |
|
|
|
|
|
|
|
|
| Return on financial investment |
|
3,584 |
|
3,310 |
|
4,720 |
|
4,048 |
| Adjustment to fair value of financial instruments (i) |
|
567 |
|
1,224 |
|
664 |
|
1,174 |
| Interest assets |
|
50 |
|
11 |
|
126 |
|
70 |
| Other financial revenues |
|
69 |
|
- |
|
386 |
|
- |
| |
|
4,270 |
|
4,545 |
|
5,896 |
|
5,292 |
| |
|
|
|
|
|
|
|
|
| Financial expenses: |
|
|
|
|
|
|
|
|
| Interest on investment acquisition |
|
(1,791) |
|
(483) |
|
(3,631) |
|
(995) |
| Interest on debentures |
|
(8,991) |
|
(5,500) |
|
(8,991) |
|
(5,500) |
| Bank expenses |
|
(23) |
|
(19) |
|
(50) |
|
(110) |
| Adjustment to present value of leases |
|
(1,435) |
|
(1,448) |
|
(1,856) |
|
(2,495) |
| Adjustment to the present value of put option |
|
(2,102) |
|
(6,042) |
|
(5,592) |
|
(8,377) |
| IOF expenses |
|
(43) |
|
(32) |
|
(48) |
|
(46) |
| Interest and inflation adjustment of lawsuits |
|
(231) |
|
|
|
(231) |
|
(242) |
| Other financial expenses |
|
- |
|
(44) |
|
- |
|
(59) |
| |
|
(14,616) |
|
(13,764) |
|
(20,399) |
|
(17,824) |
| |
|
|
|
|
|
|
|
|
| Financial result, net |
|
(10,346) |
|
(9,219) |
|
(14,503) |
|
(12,532) |
SINQIA S.A. AND SUBSIDIARIES.
MANAGEMENT’S NOTES FROM TO THE INTERIM INFORMATION FOR THE QUARTERS ENDED MARCH 31, 2023 AND
2022 AND DECEMBER 31, 2022
(In thousands of Reais – R$)
|
22 |
PROVISION FOR INCOME TAX AND SOCIAL CONTRIBUTION |
Current income tax and social contribution were computed
at the prevailing rates and deferred income tax and social contribution are calculated on temporary differences and on accumulated tax losses and negative bases.
|
a) |
Reconciliation of income tax and social contribution revenues (expense) |
The following amounts of income tax and social
contribution, current and deferred, were recorded in income statements for the periods:
| |
|
|
|
Individual |
|
Consolidated |
| |
|
03/31/2023 |
|
03/31/2022 |
|
03/31/2023 |
|
03/31/2022 |
| |
|
|
|
(Restated) |
|
|
|
(Restated) |
| |
|
|
|
|
|
|
|
|
| |
|
|
|
|
|
|
|
|
| Profit before income tax and social contribution |
|
(4,468) |
|
8,268 |
|
4,605 |
|
7,655 |
| Current tax rate |
|
34% |
|
34% |
|
34% |
|
34% |
| |
|
|
|
|
|
|
|
|
| IRPJ and CSLL at the combined rate |
|
1,519 |
|
(2,811) |
|
(1,566) |
|
(2,603) |
| |
|
|
|
|
|
|
|
|
| Adjustments for calculating the effective rate: |
|
|
|
|
|
|
|
|
| |
|
|
|
|
|
|
|
|
| Equity pickup |
|
5,030 |
|
(18) |
|
- |
|
- |
| Bonus expense |
|
(1,463) |
|
(517) |
|
(1,510) |
|
(536) |
| Assumed profit in subsidiaries (ii) |
|
- |
|
|
|
(154) |
|
62 |
| Other permanent differences (i) |
|
63 |
|
(11) |
|
394 |
|
373 |
| |
|
|
|
|
|
|
|
|
| Income tax and social contribution expense |
|
5,149 |
|
(3,357) |
|
(2,836) |
|
(2,704) |
| |
|
|
|
|
|
|
|
|
| Income tax and social contribution: |
|
|
|
|
|
|
|
|
| |
|
|
|
|
|
|
|
|
| Current |
|
- |
|
(2,307) |
|
(3,428) |
|
(6,824) |
| Deferred |
|
5,149 |
|
(1,050) |
|
592 |
|
4,120 |
(i) Other permanent differences consist mainly of deferred
IR/CS from previous years, reversals of contingency capital gains and payment of shares.
(ii) Difference referring to group companies that follow the
income tax and social contribution calculation system through assumed profit.
SINQIA S.A. AND SUBSIDIARIES.
MANAGEMENT’S NOTES FROM TO THE INTERIM INFORMATION FOR THE QUARTERS ENDED MARCH 31, 2023 AND
2022 AND DECEMBER 31, 2022
(In thousands of Reais – R$)
|
b) |
Deferred income tax and social contribution - Assets |
Below is the breakdown of deferred income tax and social contribution:
| |
|
|
|
Individual |
|
Consolidated |
| |
|
03/31/2023 |
|
03/31/2022 |
|
03/31/2023 |
|
03/31/2022 |
| |
|
|
|
|
|
|
|
|
| Non-current assets |
|
|
|
|
|
|
|
|
| Tax loss and negative basis |
|
35,967 |
|
28,882 |
|
56,000 |
|
49,070 |
| |
|
|
|
|
|
|
|
|
| Estimated losses on doubtful debts |
|
- |
|
184 |
|
30 |
|
367 |
| |
|
|
|
|
|
|
|
|
| Profit-sharing provision |
|
323 |
|
328 |
|
323 |
|
443 |
| |
|
|
|
|
|
|
|
|
| Provision for lawsuits |
|
9,458 |
|
10,202 |
|
36,630 |
|
42,081 |
| |
|
|
|
|
|
|
|
|
| Amortization of tax goodwill on business combination |
|
(13,168) |
|
(11,413) |
|
(21,279) |
|
(12,575) |
| Other provisions |
|
1,256 |
|
1,254 |
|
4,906 |
|
1,424 |
| Change in fair value of financial assets |
|
(4,200) |
|
(4,915) |
|
980 |
|
(3,736) |
| Lease purchase |
|
1,118 |
|
1,084 |
|
1,627 |
|
1,551 |
| |
|
|
|
|
|
|
|
|
| |
|
30,754 |
|
25,606 |
|
79,217 |
|
78,625 |
|
23 |
EARNINGS PER SHARE – INDIVIDUAL AND CONSOLIDATED |
Basic earnings per share are calculated by dividing net
income for the period attributed to holders of common shares in the Parent Company by the weighted average number of common shares available during the period.
Diluted earnings per share is calculated by dividing net
income for the period attributable to holders of common shares of the Parent Company by the weighted average number of common shares available during the period plus the weighted average number of common shares that would be issued upon
conversion of all potential common shares diluted into common stock.
The tables below show the data on earnings and shares used
in the calculation of basic and diluted earnings per share:
|
a) |
Basic earnings per share |
| |
|
03/31/2023 |
|
03/31/2022 |
| |
|
|
|
(Restated) |
| |
|
|
|
|
| Earnings attributable to the Company’s controlling shareholders |
|
681 |
|
4,911 |
| |
|
|
|
|
| Weighted average number of common shares outstanding |
|
84,579,674 |
|
84,992,966 |
| |
|
|
|
|
| Basic earnings per share – R$ |
|
0.008 |
|
0.058 |
SINQIA S.A. AND SUBSIDIARIES.
MANAGEMENT’S NOTES FROM TO THE INTERIM INFORMATION FOR THE QUARTERS ENDED MARCH 31, 2023 AND 2022 AND DECEMBER 31, 2022
(In thousands of Reais – R$)
| |
|
03/31/2023 |
|
03/31/2022 |
| |
|
|
|
(Restated) |
| |
|
|
|
|
| |
|
|
|
|
| Earnings attributable to the Company’s controlling shareholders |
|
681 |
|
4,911 |
| Weighted average number of common shares outstanding |
|
84,579,674 |
|
84,992,966 |
| Potential increase in common shares due to the stock option and restricted stock plans |
|
680,190 |
|
434,913 |
| |
|
|
|
|
| Diluted earnings per share – R$ |
|
0.008 |
|
0.057 |
The lease purchase liability was recognized as directed by
CPC Accounting Pronouncement 6 (R2) (IFRS 16), which requires the recording of the liability for future payments and the right to use the leased assets for all contracts within the scope of the standard. For current leases, an average
discount rate of 7.38% was used.
| |
|
|
|
|
|
Individual |
|
|
|
Consolidated |
| |
|
Expiration |
|
03/31/2023 |
|
12/31/2022 |
|
03/31/2023 |
|
12/31/2022 |
| |
|
|
|
|
|
|
|
|
|
|
| |
|
|
|
|
|
|
|
|
|
|
| Belo Horizonte office |
|
12/31/2028 |
|
5,867 |
|
5,761 |
|
5,867 |
|
5,761 |
| São Paulo office |
|
07/01/2028 |
|
- |
|
- |
|
22,817 |
|
22,535 |
| Curitiba office |
|
08/31/2023 |
|
- |
|
- |
|
390 |
|
617 |
| Taubate office |
|
04/01/2025 |
|
- |
|
- |
|
100 |
|
- |
| Oracle do Brasil |
|
|
|
|
|
|
|
|
|
|
| (Servers) |
|
12/31/2023 |
|
466 |
|
- |
|
466 |
|
- |
| Solo Network (Servers) |
|
07/31/2025 |
|
36,889 |
|
40,759 |
|
36,889 |
|
40,759 |
| Claranet (Servers) |
|
09/30/2026 |
|
- |
|
2,101 |
|
- |
|
2,101 |
| |
|
|
|
|
|
|
|
|
|
|
| Total |
|
|
|
43,222 |
|
48,621 |
|
66,529 |
|
71,773 |
| |
|
|
|
|
|
|
|
|
|
|
| Current |
|
|
|
18,452 |
|
18,937 |
|
23,970 |
|
24,334 |
| Non-current |
|
|
|
24,770 |
|
29,684 |
|
42,559 |
|
47,439 |
In accordance with CVM/SNC/SEP CIRCULAR LETTER No.
02/2019, the Company adopted as an accounting policy the requirements of CPC 06 (R2) in the measurement and remeasurement of its right of use, using the discounted cash flow technique without considering inflation (real cash flow
discounted at the nominal rate). Management assessed the use of nominal flows and concluded that they do not present material misstatements in the information presented.
In order to safeguard the faithful representation of the
information in view of the requirements of CPC 06 (R2) and to meet the guidelines of the CVM technical teams, the liabilities balances without inflation, effectively accounted for (real flow v. nominal rate), and the estimate of the
inflated balances in the periods of comparison (nominal flow v. nominal rate).
SINQIA S.A. AND SUBSIDIARIES.
MANAGEMENT’S NOTES FROM TO THE INTERIM INFORMATION FOR THE QUARTERS ENDED MARCH 31, 2023 AND
2022 AND DECEMBER 31, 2022
(In thousands of Reais – R$)
Other assumptions, such as the maturity schedule of
liabilities and interest rates used in the calculation are disclosed in other items of this same note, as well as the inflation indices that are observable in the market, so that nominal flows can be prepared by users of the financial
statements.
| |
|
Individual |
|
|
Consolidated |
| 03/31/2023 |
12/31/2022 |
|
03/31/2023 |
12/31/2022 |
|
Actual flow discounted at the nominal rate
|
|
|
|
|
|
| Lease liability |
48,642 |
55,240 |
|
76,569 |
83,193 |
| Present value adjustment |
(5,420) |
(6,619) |
|
(10,040) |
(11,420) |
| |
43,222 |
48,621 |
|
66,529 |
71,773 |
| Nominal flow discounted at the nominal rate |
|
|
|
|
|
| Lease liability |
50,330 |
57,286 |
|
78,671 |
86,326 |
| Present value adjustment |
(7,104) |
(6,773) |
|
(12,239) |
(11,761) |
| |
43,226 |
50,513 |
|
66,432 |
74,565 |
Shown below are changes in lease purchasing:
| |
|
Individual |
|
Consolidated |
| |
|
03/31/2023 |
|
03/31/2023 |
| |
|
|
|
|
| Balance at the beginning of the period |
|
48,621 |
|
71,773 |
| |
|
|
|
|
| Additions |
|
914 |
|
2,154 |
| Interest incurred |
|
1,435 |
|
1856 |
| Interest paid |
|
(1,044) |
|
(1,466) |
| Amortization |
|
(4,740) |
|
(5,824) |
| Write-offs |
|
(1964) |
|
(1964) |
| |
|
|
|
|
| Balance at the end of the period |
|
43,222 |
|
66,529 |
|
25 |
NON-CONTROLLING INTEREST PUT OPTION |
As part of the business combinations where partial
acquisitions of the acquired company’s capital were made, the Company issued a put option for the remaining portion to non-controlling shareholders. The put option was recorded based on the expected future exercise price, discounted at
present value. The exercise price of the options will be measured based on a multiple of revenues, which will be determined by the EBITDA margin on a future date.
SINQIA S.A. AND SUBSIDIARIES.
MANAGEMENT’S NOTES FROM TO THE INTERIM INFORMATION FOR THE QUARTERS ENDED MARCH 31, 2023 AND
2022 AND DECEMBER 31, 2022
(In thousands of Reais – R$)
As of the present date, the following options have been
issued:
| |
|
|
|
|
|
|
|
|
|
|
| |
|
|
|
|
|
Individual |
|
Consolidated |
| |
|
Exercise date |
|
03/31/2023 |
|
12/31/2022 |
|
03/31/2023 |
|
12/31/2022 |
| |
|
|
|
|
|
|
|
|
|
|
| Homie do Brasil |
|
|
|
|
|
|
|
|
|
|
| Informática Ltda. |
|
07/31/2025 |
|
18,768 |
|
17,982 |
|
18,768 |
|
17,982 |
| Rosk Software S.A. |
|
04/30/2025 and |
|
|
|
|
|
|
|
|
| |
|
04/30/2026 |
|
34,115 |
|
32,799 |
|
34,115 |
|
32,799 |
| Lote45 Participações S.A. |
|
04/30/2027 |
|
- |
|
- |
|
94,857 |
|
91,489 |
| Compliasset Software e |
|
|
|
|
|
|
|
|
|
|
| Soluções Digitais S.A. |
|
09/30/2026 |
|
- |
|
- |
|
11,205 |
|
- |
| |
|
|
|
|
|
|
|
|
|
|
| Total |
|
|
|
52,883 |
|
50,781 |
|
158,945 |
|
142,270 |
|
26 |
TRANSACTIONS THAT DID NOT AFFECT CASH |
Investing and financing transactions that do not involve
the use of cash or cash equivalents are not included in the statement of cash flows. The Company carried out the following non-cash investing and financing activities:
| |
|
|
|
Individual |
|
Consolidated |
| |
|
03/31/2023 |
|
03/31/2022 |
|
03/31/2023 |
|
03/31/2022 |
| |
|
|
|
|
|
|
|
|
| Recognition (reversal) of lease assets |
|
(1,146) |
|
2,214 |
|
90 |
|
2,214 |
| (Recognition) reversal of lease liabilities |
|
1,146 |
|
(2,214) |
|
(90) |
|
(2,214) |
| Investment recognition from transaction with non-controlling shareholders |
|
(9.753) |
|
- |
|
- |
|
- |
| Portion withheld to pay for the acquisition of investments |
|
- |
|
- |
|
300 |
|
109,657 |
| Assets acquired in business combination |
|
- |
|
- |
|
1,665 |
|
309,877 |
| Liabilities acquired in business combinations |
|
- |
|
- |
|
(1,665) |
|
(309,877) |
On March 7, 2023, the Company completed the acquisition of
a 60% equity interest in Compliasset Software e Soluções Digitais S.A., through its subsidiary Sinqia Tecnologia Ltda. The transaction involved (i) an initial amount of R$17,700 in cash, (ii) a retained portion of R$300 to be paid 120
days after the acquisition date, and (iii) a variable portion conditional on net revenue for the period from August 1, 2023 to July 31, 2024. Additionally, the transaction provides for the call and put options for the remaining portion to
be exercised in 2026 and the exercise price linked to Compliasset ’s 2025 net revenues and adjusted EBITDA margin.
Compliasset was created in 2016 based on the legal
expertise of one of its founders in capital market compliance. It has more than 230 clients in the capital markets and a technological solution that supports compliance and privacy programs in a holistic way. Over time, it
expanded its operations to other markets, such as Closed Complementary Pension Entities, having a strong partnership with the Brazilian Association of Closed Complementary Pension Entities (Abrapp).
SINQIA S.A. AND SUBSIDIARIES.
MANAGEMENT’S NOTES FROM TO THE INTERIM INFORMATION FOR THE QUARTERS ENDED MARCH 31, 2023 AND
2022 AND DECEMBER 31, 2022
(In thousands of Reais – R$)
Goodwill of R$11,201, generated by the difference between
the amount paid and the acquiree’s equity, was evaluated by an independent valuation company and corresponds to the value of future economic benefits (goodwill) arising from the synergies expected to occur with the acquisition carried
out. The acquisition further expands Sinqia’s offering of solutions and reinforces the company’s strategy of building a complete ecosystem to serve the Financial System. With the addition of Compliasset to its portfolio, Sinqia
accelerates its position as a one-stop-shop for customers, bringing yet another Software as a Service (SaaS), Plug & Play and Cloud solution focused on Regulatory Compliance Management.
In the consolidated interim information for the quarter
ended March 31, 2023, Compliasset contributed net revenues of R$582 and net income of R$87, considering the period after the aforementioned acquisition date.
The Company hired a third-party valuator in order to carry
out studies to measure the fair value of the assets acquired and liabilities assumed, since Sinqia has less than 100% equity interest in the acquiree, the fair value of the non-controlling interest was calculated through the application
effective percentage of the non-controlling shareholders’ equity in the shareholders’ equity at fair value of the subsidiaries.
a) Fair value as of the acquisition date of the consideration
transferred:
| |
|
60% |
| Payment in cash |
|
17,700 |
| Price adjustment |
|
300 |
| Variable price add-on (Earn Out) |
|
4,745 |
| Call and Put Options |
|
(3,080) |
| Total consideration |
|
19,665 |
SINQIA S.A. AND SUBSIDIARIES.
MANAGEMENT’S NOTES FROM TO THE INTERIM INFORMATION FOR THE QUARTERS ENDED MARCH 31, 2023 AND
2022 AND DECEMBER 31, 2022
(In thousands of Reais – R$)
|
b) |
Assets and liabilities recognized at fair value on the acquisition date: |
BALANCE SHEET OF THE ACQUIRED COMPANY
| |
|
03/07/2023 |
|
|
|
03/07/2023 |
| Current assets |
|
|
|
Current liabilities |
|
|
| |
|
|
|
|
|
|
| Cash and cash equivalents |
|
2 |
|
Trade accounts payable |
|
33 |
| Financial investments |
|
640 |
|
Tax liabilities |
|
164 |
| Accounts receivable |
|
628
|
|
Labor liabilities |
|
135 |
| Taxes recoverable |
|
- |
|
|
|
|
| Advances to suppliers |
|
102 |
|
|
|
|
| Prepaid expenses |
|
24 |
|
|
|
|
| |
|
|
|
|
|
|
| Total current assets |
|
1,396 |
|
Total current liabilities |
|
332 |
| |
|
|
|
|
|
|
| Non-current assets |
|
|
|
Non-current liabilities |
|
|
| |
|
|
|
|
|
|
| Accounts receivable |
|
12 |
|
Lease purchase |
|
100 |
| Property and equipment |
|
194 |
|
Contingencies |
|
2,404 |
| Intangible assets |
|
15,340 |
|
|
|
|
| |
|
|
|
|
|
|
| Total non-current assets |
|
15,546 |
|
Total non-current liabilities |
|
2,504 |
| |
|
|
|
|
|
|
| |
|
|
|
Total shareholders’ equity |
|
14,106 |
| |
|
|
|
|
|
|
| Total assets |
|
16,942 |
|
Total liabilities |
|
16,942 |
|
c) |
Goodwill generated on the acquisition of equity interest |
|
Estimated price
|
|
19,665 |
| |
|
|
| (-) Fair value of assets acquired: |
|
|
| Software |
|
4,150 |
| Trademark |
|
962 |
| Customer portfolio |
|
10,228 |
| |
|
|
|
(+) Fair value of liabilities assumed: Contingencies
|
|
2,404
|
| |
|
|
| (-) Book shareholders’ equity on the acquisition date |
|
1,170 |
| |
|
|
| (+) Non-controlling interest |
|
5,643 |
| |
|
|
| Goodwill for expected future profitability generated in the acquisition |
|
11,202 |
| |
|
|
| Goodwill expected to be deductible for tax purposes |
|
9,759 |
A contingent liability of R$2,404 was recognized due to
labor and social security risks of R$1,462 and tax risks of R$942, referring to the risk period. As of March 31, 2023, there has been no change in the amounts recognized since the acquisition date for the liability or in the ranges of
expected values or even in the assumptions used to develop the estimate.
SINQIA S.A. AND SUBSIDIARIES.
MANAGEMENT’S NOTES FROM TO THE INTERIM INFORMATION FOR THE QUARTERS ENDED MARCH 31, 2023 AND
2022 AND DECEMBER 31, 2022
(In thousands of Reais – R$)
The following table shows the acquired intangible assets
that were not initially recorded in the acquiree’s accounting books, as well as the estimated useful life and the amortization method:
| |
|
|
|
Amortization |
| |
|
Useful life |
|
method |
| Intangible Assets |
|
|
|
|
| |
|
|
|
|
| Software |
|
5 years |
|
Straight line |
| Trademark |
|
10 years |
|
Straight line |
| Customer portfolio |
|
14.6 years |
|
Straight line |
Additionally, the Company reports that the assets and
liabilities recognized at fair value of business combinations disclosed in 2022 have not changed.
Annex VII to Exhibit 99.2 – Pro Forma Financials pursuant to RCVM 81 and CVM Resolution Number 78 of March, 2022