Bitcoin Capital Inflows See Notable Slowdown, But Is This A Worry?
23 Enero 2025 - 12:00AM
NEWSBTC
On-chain data shows the capital inflows into Bitcoin have slowed
down since last year’s high. Here’s what this could mean for BTC’s
price. Bitcoin Realized Cap Continues To Grow, Albeit At A Slower
Rate According to data from the on-chain analytics firm Glassnode,
capital inflows into BTC have been on the decline recently. The
indicator of relevance here is the “Realized Cap,” which is a
capitalization model for Bitcoin that calculates its total
valuation by assuming that the ‘real’ value of any token in
circulation is equal to the price at which it was last transacted
on the blockchain. The last transaction for any token can be
considered to be the last point at which it changed hands, so the
price at its time would denote its current cost basis. As such, the
Realized Cap takes the total sum of the cost basis of the entire
BTC supply in circulation. Related Reading: Arbitrum (ARB) Primed
For 46% Rally If This Happens, Analyst Reveals This value is
nothing, but the total amount of capital that the investors as a
whole have used to purchase the cryptocurrency. Changes in the
indicator, therefore, reflect the capital flowing into or out of
the asset. Below is the chart for the Realized Cap shared by the
analytics firm, which shows the trend in its daily value, as well
as its 30-day percentage change, over the last couple of years. As
displayed in the graph, the Bitcoin Realized Cap observed some
sharp growth during the last couple of months of 2024, implying
capital was flowing at a rapid rate into the cryptocurrency. This
is more easily visible through the monthly percentage change, which
shot up to a very high positive level. These inflows appear to have
provided the fuel for BTC’s rally above $100,000. From the chart,
it’s apparent that after hitting a peak, the 30-day change in the
Realized Cap reversed its direction and started going down in a
sharp manner instead. This decline in the metric has continued into
2025. Despite the drawdown, though, its value is still quite
positive, suggesting the Realized Cap continues to grow at a
notable rate. A similar trend was also witnessed back in the first
few months of 2024, where a high in capital inflows was followed by
a cooldown, which led into a lengthy consolidation period for
Bitcoin. So far, capital is still flowing into BTC at a rate of
$38.6 billion per month, which is significantly higher than the
lows observed during last year’s sideways phase. It now remains to
be seen whether the inflows will continue to decline in the coming
days, or if a reversal would happen, potentially acting as a
bullish signal for the asset. Related Reading: Trader Greed Strikes
Again: Bitcoin Corrects To $102,000 After FOMO Spike Following the
latest streak of inflows, the Bitcoin Realized Cap has reached the
$832 billion mark, which is a new all-time high. BTC Price Bitcoin
has been struggling to pick a direction during the last few days as
its price is still trading around the $104,000 level. Featured
image from Dall-E, Glassnode.com, chart from TradingView.com
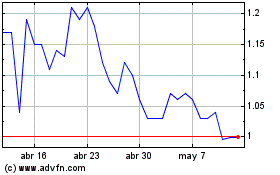
Arbitrum (COIN:ARBUSD)
Gráfica de Acción Histórica
De Dic 2024 a Ene 2025

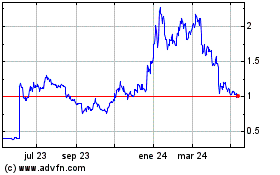
Arbitrum (COIN:ARBUSD)
Gráfica de Acción Histórica
De Ene 2024 a Ene 2025
