Dogecoin Price Breaks Out Of Symmetrical Triangle Pattern, Analyst Puts Target Above $0.37
25 Diciembre 2024 - 10:00AM
NEWSBTC
A crypto analyst, known as ‘CryptoSanders9563’, disclosed in a
report on TradingView that the Dogecoin price has broken out of a
symmetrical triangle pattern. This technical pattern, signaling a
bullish continuation for Dogecoin, is expected to trigger a price
surge to a new target above $0.375. Symmetrical Triangle To
Drive Dogecoin Price Above $0.37 CryptoSanders has shared a
Dogecoin price chart, showing a symmetrical triangle pattern formed
by converging trendlines. According to the TradingView analyst,
Dogecoin’s price broke above the symmetrical triangle’s upper
trendline at approximately $0.316, confirming a bullish breakout
and signaling a potential surge to a new price target above
$0.375. Related Reading: Bitcoin Price Can Recover To
$107,000 Again If This Important Level Is Broken A symmetrical
triangle is a chart pattern that signals a period of consolidation
before a price breakout. When the price of a cryptocurrency
experiences a breakout from this pattern, it often indicates the
start of a new trend or a continuation of a former trend. As a
result, breaking out of the lower trendline marks the beginning of
a bearish phase and vice versa. CryptoSanders has revealed that
Dogecoin’s price breakout is accompanied by continued price action
above critical moving averages, further strengthening its bullish
setup. At the time of the analyst’s report, the Dogecoin price was
trading above the 50 Exponential Moving Average (EMA) and the
200-EMA. These two moving averages are critical indicators
that suggest a continued upward momentum in the Dogecoin price. The
TradingView analyst has surmised that converging both moving
averages could be a dynamic support for Dogecoin, potentially
fortifying its upside momentum. Following the recent breakout
from the symmetrical triangle pattern, the analyst has pinpointed
$0.375 as Dogecoin’s next significant resistance level. This price
point is also a psychological level for Dogecoin, triggering
profit-taking for investors. If the Dogecoin price can break
above the $0.375 resistance level, it could trigger a more
substantial price rally to new highs. However, a failure to breach
this level could catalyze another downtrend, potentially pushing
Dogecoin’s price to the $0.306 support level. Dogecoin Trade
Setup and Strategy While sharing his optimistic projection
for Dogecoin’s price trajectory, CryptoSanders also outlined a
well-defined trade strategy for investors looking to capitalize on
this symmetrical triangle breakout. Related Reading: XRP
Price Prediction: Wave 2 And 5 Targets Put XRP At $7 And $13 The
analyst pinpointed an entry zone at the $0.316 price level after
the confirmation of the breakout. A stop loss of $0.306 has been
set to mitigate downside risk and avoid financial loss in the event
of a failed breakout. Furthermore, the previously projected
target of $0.375 has been reaffirmed as the primary profit-taking
zone, coinciding with the highlighted resistance area on the chart.
CryptoSanders has revealed that this trade setup offers a favorable
risk-to-reward ratio. Investors can potentially earn a significant
profit as long as the price of Dogecoin holds above the breakout
level and the stop loss is respected. Featured image created
with Dall.E, chart from Tradingview.com
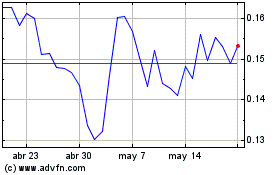
Dogecoin (COIN:DOGEUSD)
Gráfica de Acción Histórica
De Dic 2024 a Ene 2025

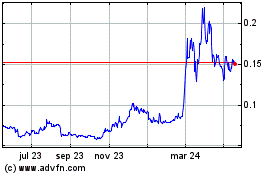
Dogecoin (COIN:DOGEUSD)
Gráfica de Acción Histórica
De Ene 2024 a Ene 2025
