XRP Breakout: Could It Skyrocket To $100? Analysts Share Their Predictions
11 Agosto 2024 - 6:58PM
NEWSBTC
Crypto market participants are paying attention to XRP. There has
been a continuous bounce between trend lines, forming what analysts
call a symmetrical triangle pattern. As a result of a pattern
traced as far back as 2018, this digital asset could be set for a
big move — but how? Related Reading: Solana Epic Bull Run Is Just
Starting – 10 Catalysts That Could Drive SOL To $1,000 From
eagle-eyed market sentinels who predict that XRP may soon break out
to those who are walking on eggshells, the crypto community is
overrun with predictions. The pattern shows a fight between the
buyers and sellers, which may suggest it is poised to explode up—or
crash down—in value once that fight concludes. XRP Technical
Indicators: A Mixed Bag The price of XRP has been steadily at the
$0.57 mark, considered to be a key support level. Historically,
this level has held pretty well and kept the coin from dipping too
low. Recently, trading volume picked up, which is more often than
not a sign that something big is brewing. If XRP breaks above the
triangle’s upper trend line, then control might be taken over by
the bulls, pushing up the price to new highs. #XRP Breakout Incomin
XRP price has been consolidating within a symmetrical triangle
since 2018 signaling a potential breakout With strong support
around $0.38 and increasing volume 2024 could be the year for a
significant upward move Keep an eye on XRP big things could be
ahead pic.twitter.com/5MsehzASG6 — xaif.03 🇮🇳 (@xaif_03) August 10,
2024 While some, like analyst Xaif.03, expect a rise to $100, that
is a bit far-fetching at this point without more concrete evidence.
But then, these people can see better than ordinary souls. Yet all
isn’t rosy. The Relative Strength Index comes in at 54, right smack
in the middle of the scale. This reading does indicate that neither
an oversold nor overbought market condition exists, therefore
keeping the door open to either a rally or more consolidation. The
Bullish Case For XRP Notwithstanding some level of uncertainty
involved, some analysts still stand on the bullish side. Noted
crypto space figure Alan Santana believes that XRP is currently
undergoing an accumulation phase. The token, according to him,
follows a bear market with such a phase before drastically spiking
in price exponentially. ✴️ XRP Pre-2025 Bull-Market Accumulation
Zone & Strategy My dear friends… Accumulation for XRP, when
considering the bigger picture, has been on-going since June 2022.
The 2023 bullish wave was just a minor wave compared to bull-market
proportions. “Wave 1” of a much bigger… pic.twitter.com/15LWLOxPcp
— Alan Santana (@lamatrades1111) August 10, 2024 Based on his
prognosis, if the XRP 2022 bear market is followed by its recovery
year in 2023, it paves the way for accumulation in 2024. This
happened once; thus, we might then expect a strong bull run for XRP
in 2024, or the year after that. Of course, crypto markets are
unpredictable, and past performance does not always warranty
results in the future. Skeptics And The Path Forward Not everyone,
however, is convinced that XRP is in the midst of a breakout. Some
analysts have cautioned that while the symmetrical triangle pattern
is powerful, it doesn’t always work. The market could easily move
sideways for months, which could frustrate traders. XRP Technical
Analysis on a 3-Day Timeframe In our previous analysis of XRP, we
observed that the 50EMA and the 0.618 FIB levels were acting as
resistance. The price eventually broke above these levels and
reclaimed the resistance trendline at $0.63. Currently, XRP is
trending… https://t.co/7qvnJhiZuE pic.twitter.com/AH5AddwVTu —
Cryptorphic (@Cryptorphic1) August 9, 2024 Related Reading: Bitcoin
To Rally To $250,000 If This Condition Is Met, Analyst Says Another
analyst, Cryptorphic has also reiterated some of the resistance
levels that the altcoin need to break out so as not fall further
down in value. He noted the support around $0.41-$0.42 has had a
pretty solid hold, however without significant news stacking in
favor of XRP working higher will be difficult to come by at this
time. Featured image from Fortune, chart from TradingView
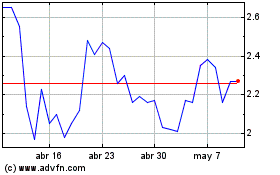
Fetch (COIN:FETUSD)
Gráfica de Acción Histórica
De Jul 2024 a Ago 2024

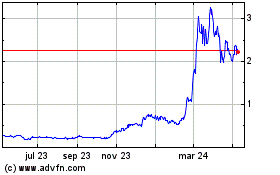
Fetch (COIN:FETUSD)
Gráfica de Acción Histórica
De Ago 2023 a Ago 2024
