AVAX On Thin Ice: $21.73 Support Under Siege – What’s Next?
03 Agosto 2024 - 1:00PM
NEWSBTC
Recent market activities for Avalanche (AVAX) indicate that the
bears have gained control over the market, pushing the
cryptocurrency toward a critical price target of $21.73. With the
bears dominating and market sentiment leaning heavily toward
further declines, the $21.73 level has become a key point of
interest for market participants. This analysis delves into AVAX’s
current bearish trend by examining key technical indicators such as
Moving Averages and the Moving Average Convergence Divergence
(MACD). Additionally, it highlights the significance of the $21.73
support level and its potential impact on AVAX’s price movement As
of the time of writing, AVAX’s price has decreased by 4.67%,
trading at approximately $23.75 over the past 24 hours. The
cryptocurrency has a market capitalization of $9 billion and a
trading volume of $331 million. AVAX’s market cap has
declined by 6.37% in the past day, while its trading volume has
increased by 15.60%. Analyzing Recent Price Trends And Performance
Of AVAX Avalanche has shown significant bearish strength, with
multiple bearish candlesticks forming below the 4-hour 100-day
Simple Moving Average (SMA). This indicates bearish dominance and
suggests continued downward pressure, potentially leading to
further declines toward $21.75. Also, on the 4-hour chart, both the
signal line and the MACD line of the Moving Average Convergence
Divergence (MACD) are trending below the zero line and are
currently attempting to move into the oversold zone. This supports
the potential for continued downward movement in AVAX’s price.
Technical analysis on the 1-day chart reveals that AVAX has been on
a bearish trajectory toward a critical support level at $21.75,
marked by the formation of multiple bearish candlesticks.
Furthermore, the crypto asset’s price is trading below the 100-day
SMA, suggesting a bearish market sentiment. Looking at the 1-day
chart, it can be observed that the Signal line has crossed below
the MACD line and both have recently dropped below the zero line,
which implies a continued bearish trend and indicates the chance
for further price declines. Significance Of The $21.73 Support
Level Assessing the significance of the $21.73 support level
suggests that: If AVAX reaches this level, it might break through
or consolidate and retrace. A successful break below could lead to
further price decline, potentially driving the asset toward the
$18.83 support level and beyond. However, if the price consolidates
and retraces upward upon reaching the $21.73 support level, it will
begin to climb toward the $30.34 resistance point. Should the price
break through this range, it could lead to further gains, testing a
higher resistance level at $37.29 and potentially increasing
bullish sentiment. Featured image from Adobe Stock, chart from
Tradingview.com
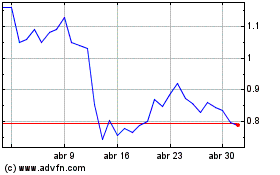
Mina (COIN:MINAUSD)
Gráfica de Acción Histórica
De Jul 2024 a Ago 2024

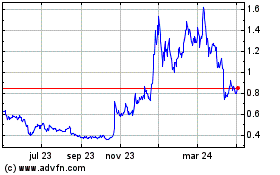
Mina (COIN:MINAUSD)
Gráfica de Acción Histórica
De Ago 2023 a Ago 2024
