Candles Can Paint a Story of Wild Activity, 26 Hours Later
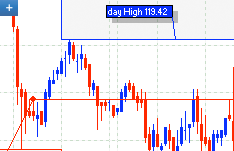
USD/JPY - October 25th, 2006 - 3:00 PM
In the next several hours, the Dollar recovers. Another opportunity to break even or even close the position with a gain presents itself. However, price action becomes quite volatile as can be seen from the large candlesticks and shadows. This point is the last time we will have a chance to break even for a long time, even though we can't know this at the present moment.
The current candle, along with the previous one, tells a story of how the market behaved during that time. At first the pair was heading upwards, moving past 119.25. At that point the pair's bears sold en masse and brought the pair down below 118.95. At this low point the pair's bulls bring the pair back up ending the candle at 119.10. The final half hour follows a similar pattern. The back and forth action here means that a trader will have to be skilled in order to exit correctly.
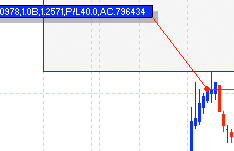
EUR/USD - October 25, 2006 - 3:00 PM
Let's see the position that was speculating on Dollar weakness and Euro strength.
The last two candles are similar to our USD/JPY position in that both have volatile price action. The second to last candle shows a similar story as explained before. Bulls push up the price, but then bears bring it back down. The pair's bulls are not beaten and in the next candle they bring the price back up to 1.2610. At this moment our position has gained +40 pips.
Last Modified: 2009/10/27 04:43:08