0001060219
false
true
0001060219
2023-07-26
2023-07-26
iso4217:USD
xbrli:shares
iso4217:USD
xbrli:shares
UNITED STATES
SECURITIES AND EXCHANGE COMMISSION
Washington, D.C. 20549
________________________
FORM 8-K
________________________
CURRENT REPORT
Pursuant to Section 13 or 15(d) of the
Securities Exchange Act of 1934
Date of Report (Date of earliest event reported)
July 26, 2023
________________________
SALISBURY BANCORP, INC.
(Exact name of registrant as specified
in its charter)
________________________
|
Connecticut
(State of other jurisdiction
of incorporation) |
|
001-14854
(Commission
File Number) |
|
06-1514263
(IRS Employer
Identification No.) |
|
5 Bissell Street, Lakeville, Connecticut
(Address of principal executive offices) |
|
|
06039
(Zip Code)
|
| |
Registrant’s telephone number, including area code: (860) 435-9801 |
|
| |
(Former name or former address, if changed since last report)
________________________ |
|
| |
|
|
|
|
|
Check the appropriate box below if the Form
8-K filing is intended to simultaneously satisfy the filing obligation of the registrant under any of the following provisions:
| ☑ | Written communications pursuant to Rule 425 under the Securities
Act (17 CFR 230.425) |
| ☐ | Soliciting material pursuant to Rule 14a-12 under the Exchange
Act (17 CFR 240.14a-12) |
| ☐ | Pre-commencement communications pursuant to Rule 14d-2(b)
under the Exchange Act (17 CFR 240.14d-2(b)) |
| ☐ | Pre-commencement communications pursuant to Rule 13e-4(c)
under the Exchange Act (17 CFR 240.13e-4(c)) |
Securities registered pursuant to
Section 12(b) of the Act:
| Title of Each Class |
Trading Symbol(s) |
Name of Each Exchange on Which Registered |
| Common Stock, $0.10 par value per share |
SAL |
NASDAQ |
Indicate by check mark whether the registrant is an emerging
growth company as defined in Rule 405 of the Securities Act of 1933 (§230.405 of this chapter) or Rule 12b-2 of the Securities Exchange
Act of 1934 (§240.12b-2 of this chapter).
Emerging Growth Company ☐
If an emerging growth
company, indicate by check mark if the registrant has elected not to use the extended transition period for complying with any new or
revised financial accounting standards provided pursuant to Section 13(a) of the Exchange Act. ☐
| Section 2. | Financial Information |
| Item 2.02. | Results of Operations and Financial Condition |
On July 26, 2023 Salisbury Bancorp, Inc. (“Salisbury”)
(NASDAQ: “SAL”), the holding company for Salisbury Bank and Trust Company (the “Bank”), issued a press release
announcing results for its second quarter ended June 30, 2023. The press release is attached as Exhibit 99.1 and is incorporated herein
by reference.
| Item 7.01. | Regulation FD Disclosure |
On July 26, 2023, Salisbury announced
that investor presentation slides, which include a review of financial results and trends through the period ended June 30, 2023, are
available in the Shareholder Relations section of Salisbury’s website at salisburybank.com under About Us/Shareholder Relations/News
& Market Information/Presentations. The information in this Item 7.01 shall not be deemed to be “filed” for purposes of
Section 18 of the Securities and Exchange Act of 1934, as amended (the “Exchange Act”) or otherwise subject to the liabilities
of that Section, and is not incorporated by reference into any other filing under the Securities Act of 1933, as amended, or the Exchange
Act.
| Section 9. | Financial Statement and Exhibits |
| Item 9.01. | Financial Statement and Exhibits |
(a) Not
Applicable.
(b) Not
Applicable.
(c) Not
Applicable.
(d) Exhibits.
SIGNATURE
Pursuant to the requirements
of the Securities Exchange Act of 1934, the Registrant has duly caused this Report to be signed on its behalf by the undersigned hereunto
duly authorized.
| |
|
Salisbury
Bancorp, Inc. |
| |
|
|
Date:
July 26, 2023
|
By: |
/s/
Peter Albero
Peter Albero
Executive
Vice President and Chief Financial Officer |
Exhibit 99.1
Wednesday, July 26, 2023
Company Press Release
Source: Salisbury Bancorp, Inc.
Salisbury Contact: Richard J. Cantele, Jr., President
and Chief Executive Officer
860-435-9801 or rcantele@salisburybank.com
FOR IMMEDIATE RELEASE
SALISBURY BANCORP, INC. REPORTS RESULTS FOR SECOND QUARTER 2023
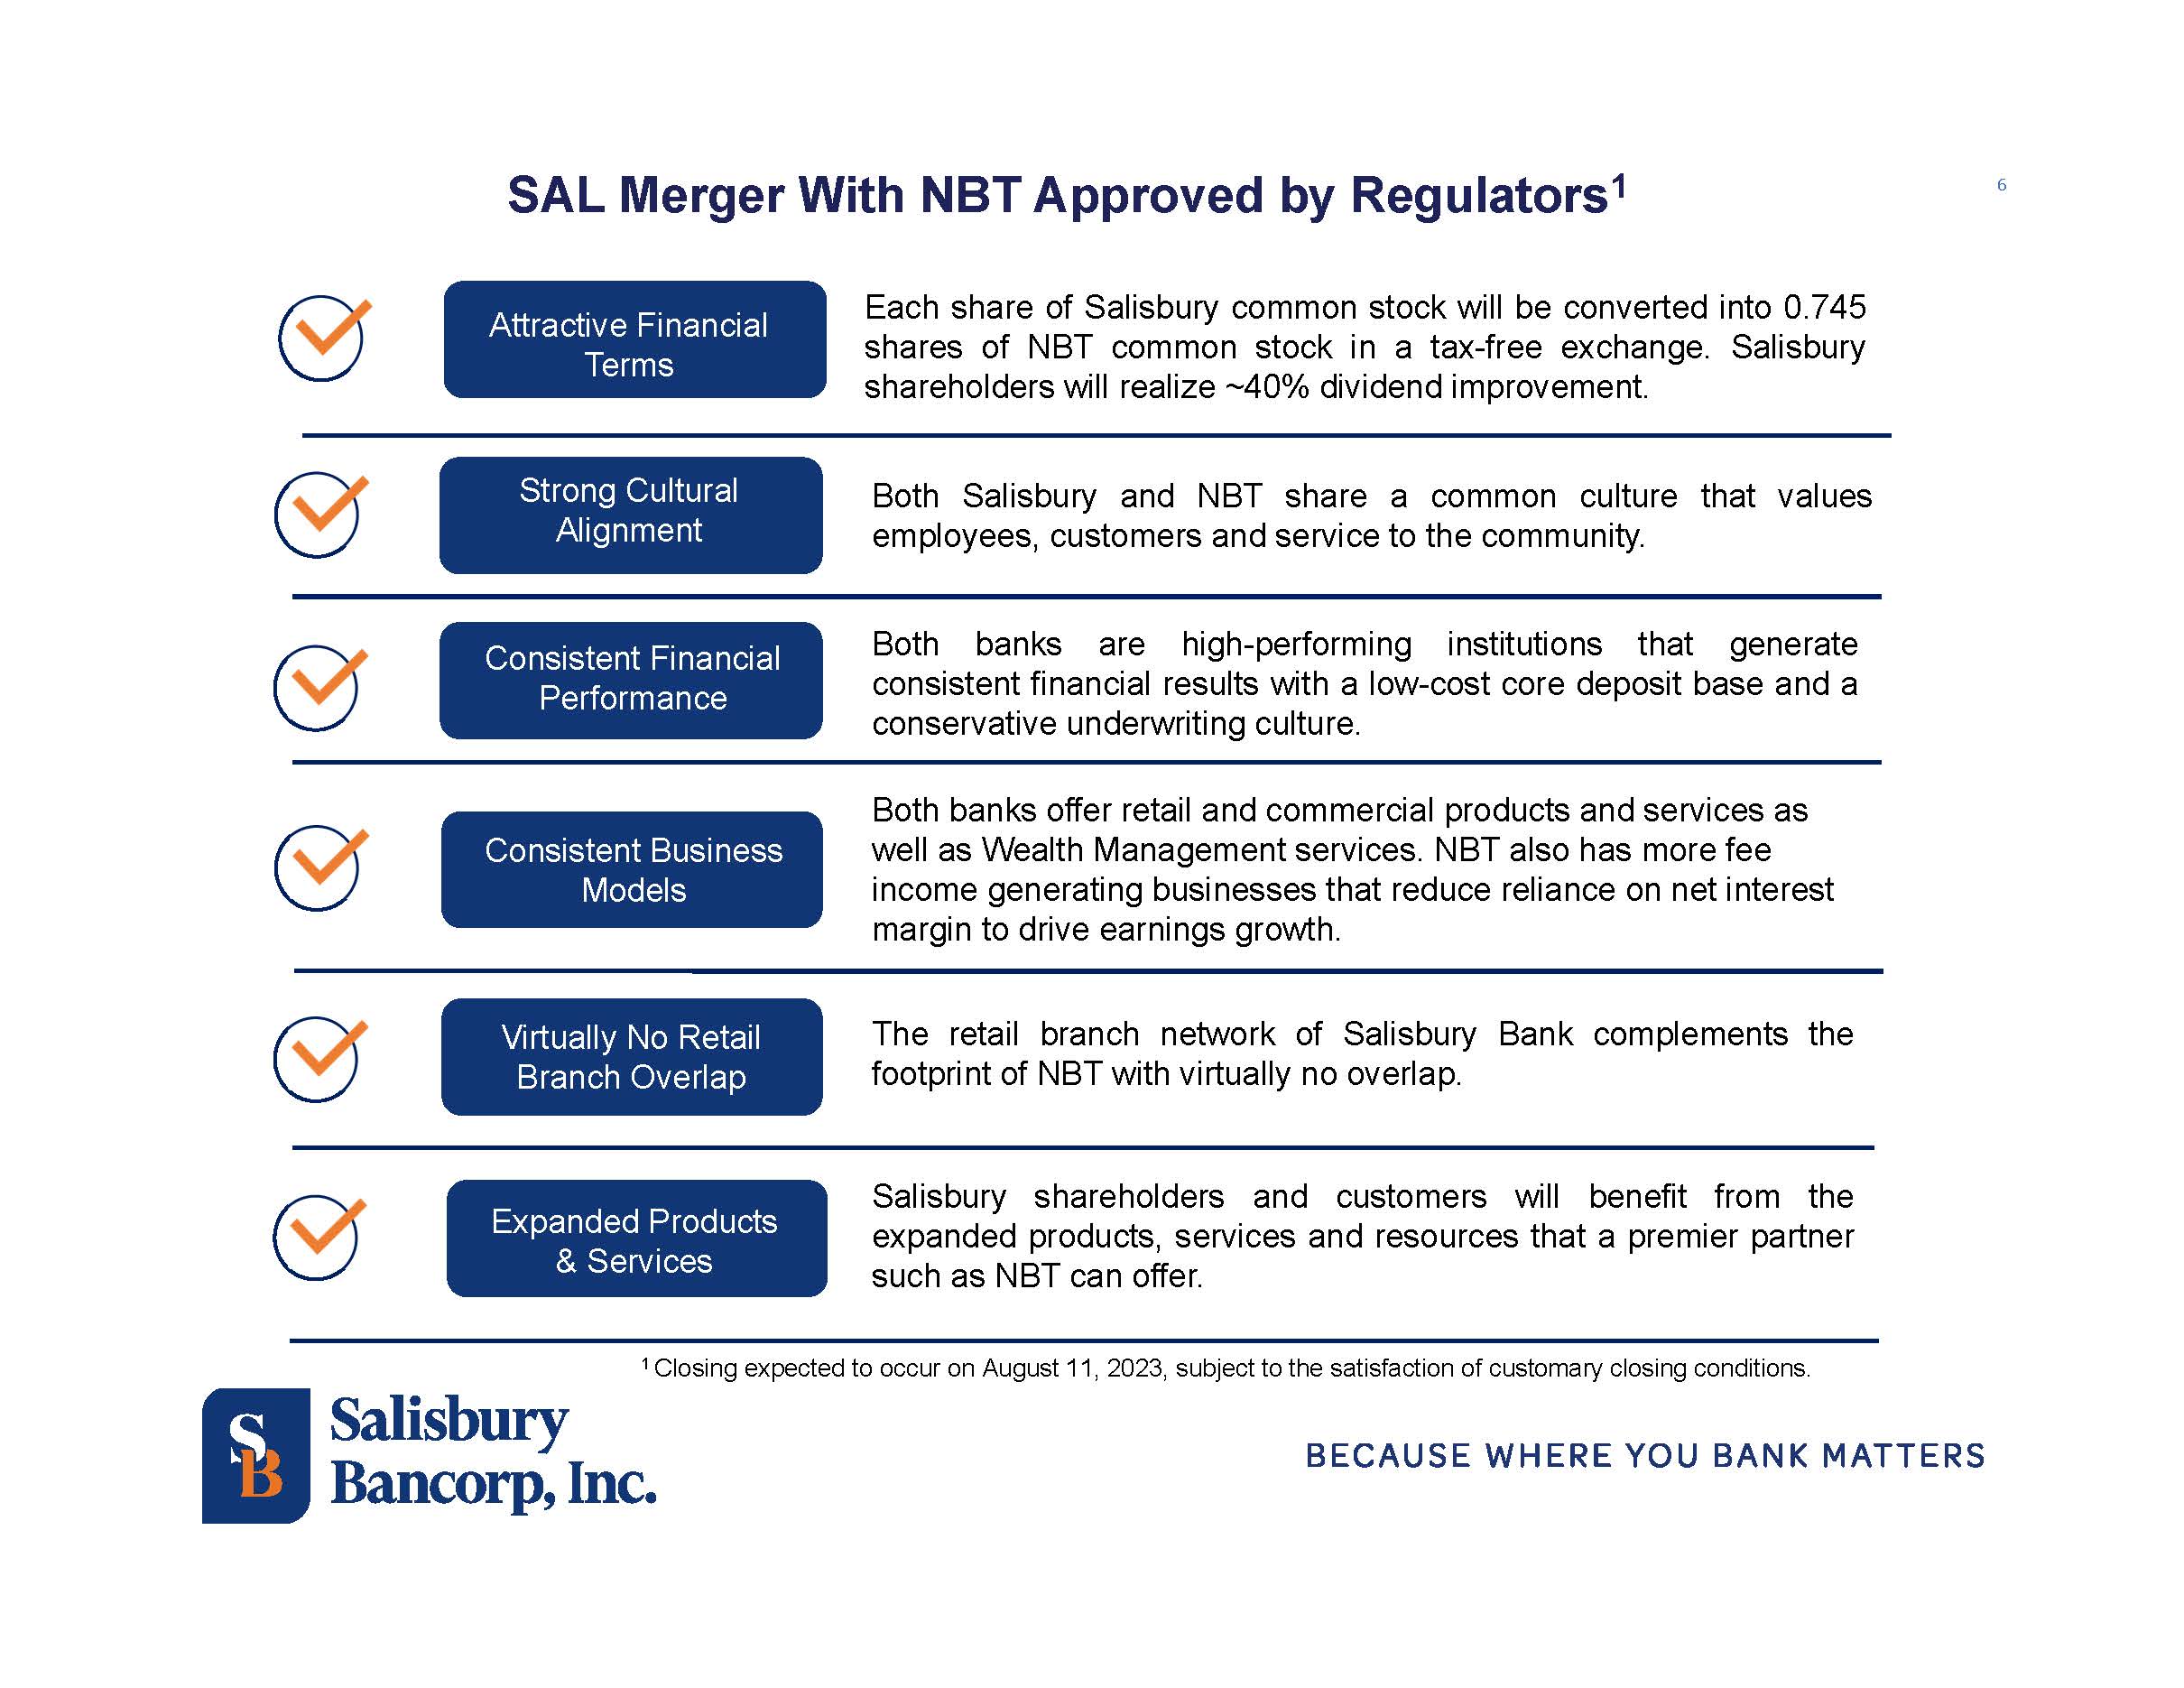
| · | Strategic Merger with NBT Bancorp
Approved by Regulators; Merger Expected to Close in August 2023 |
| · | Second Quarter Net Income of
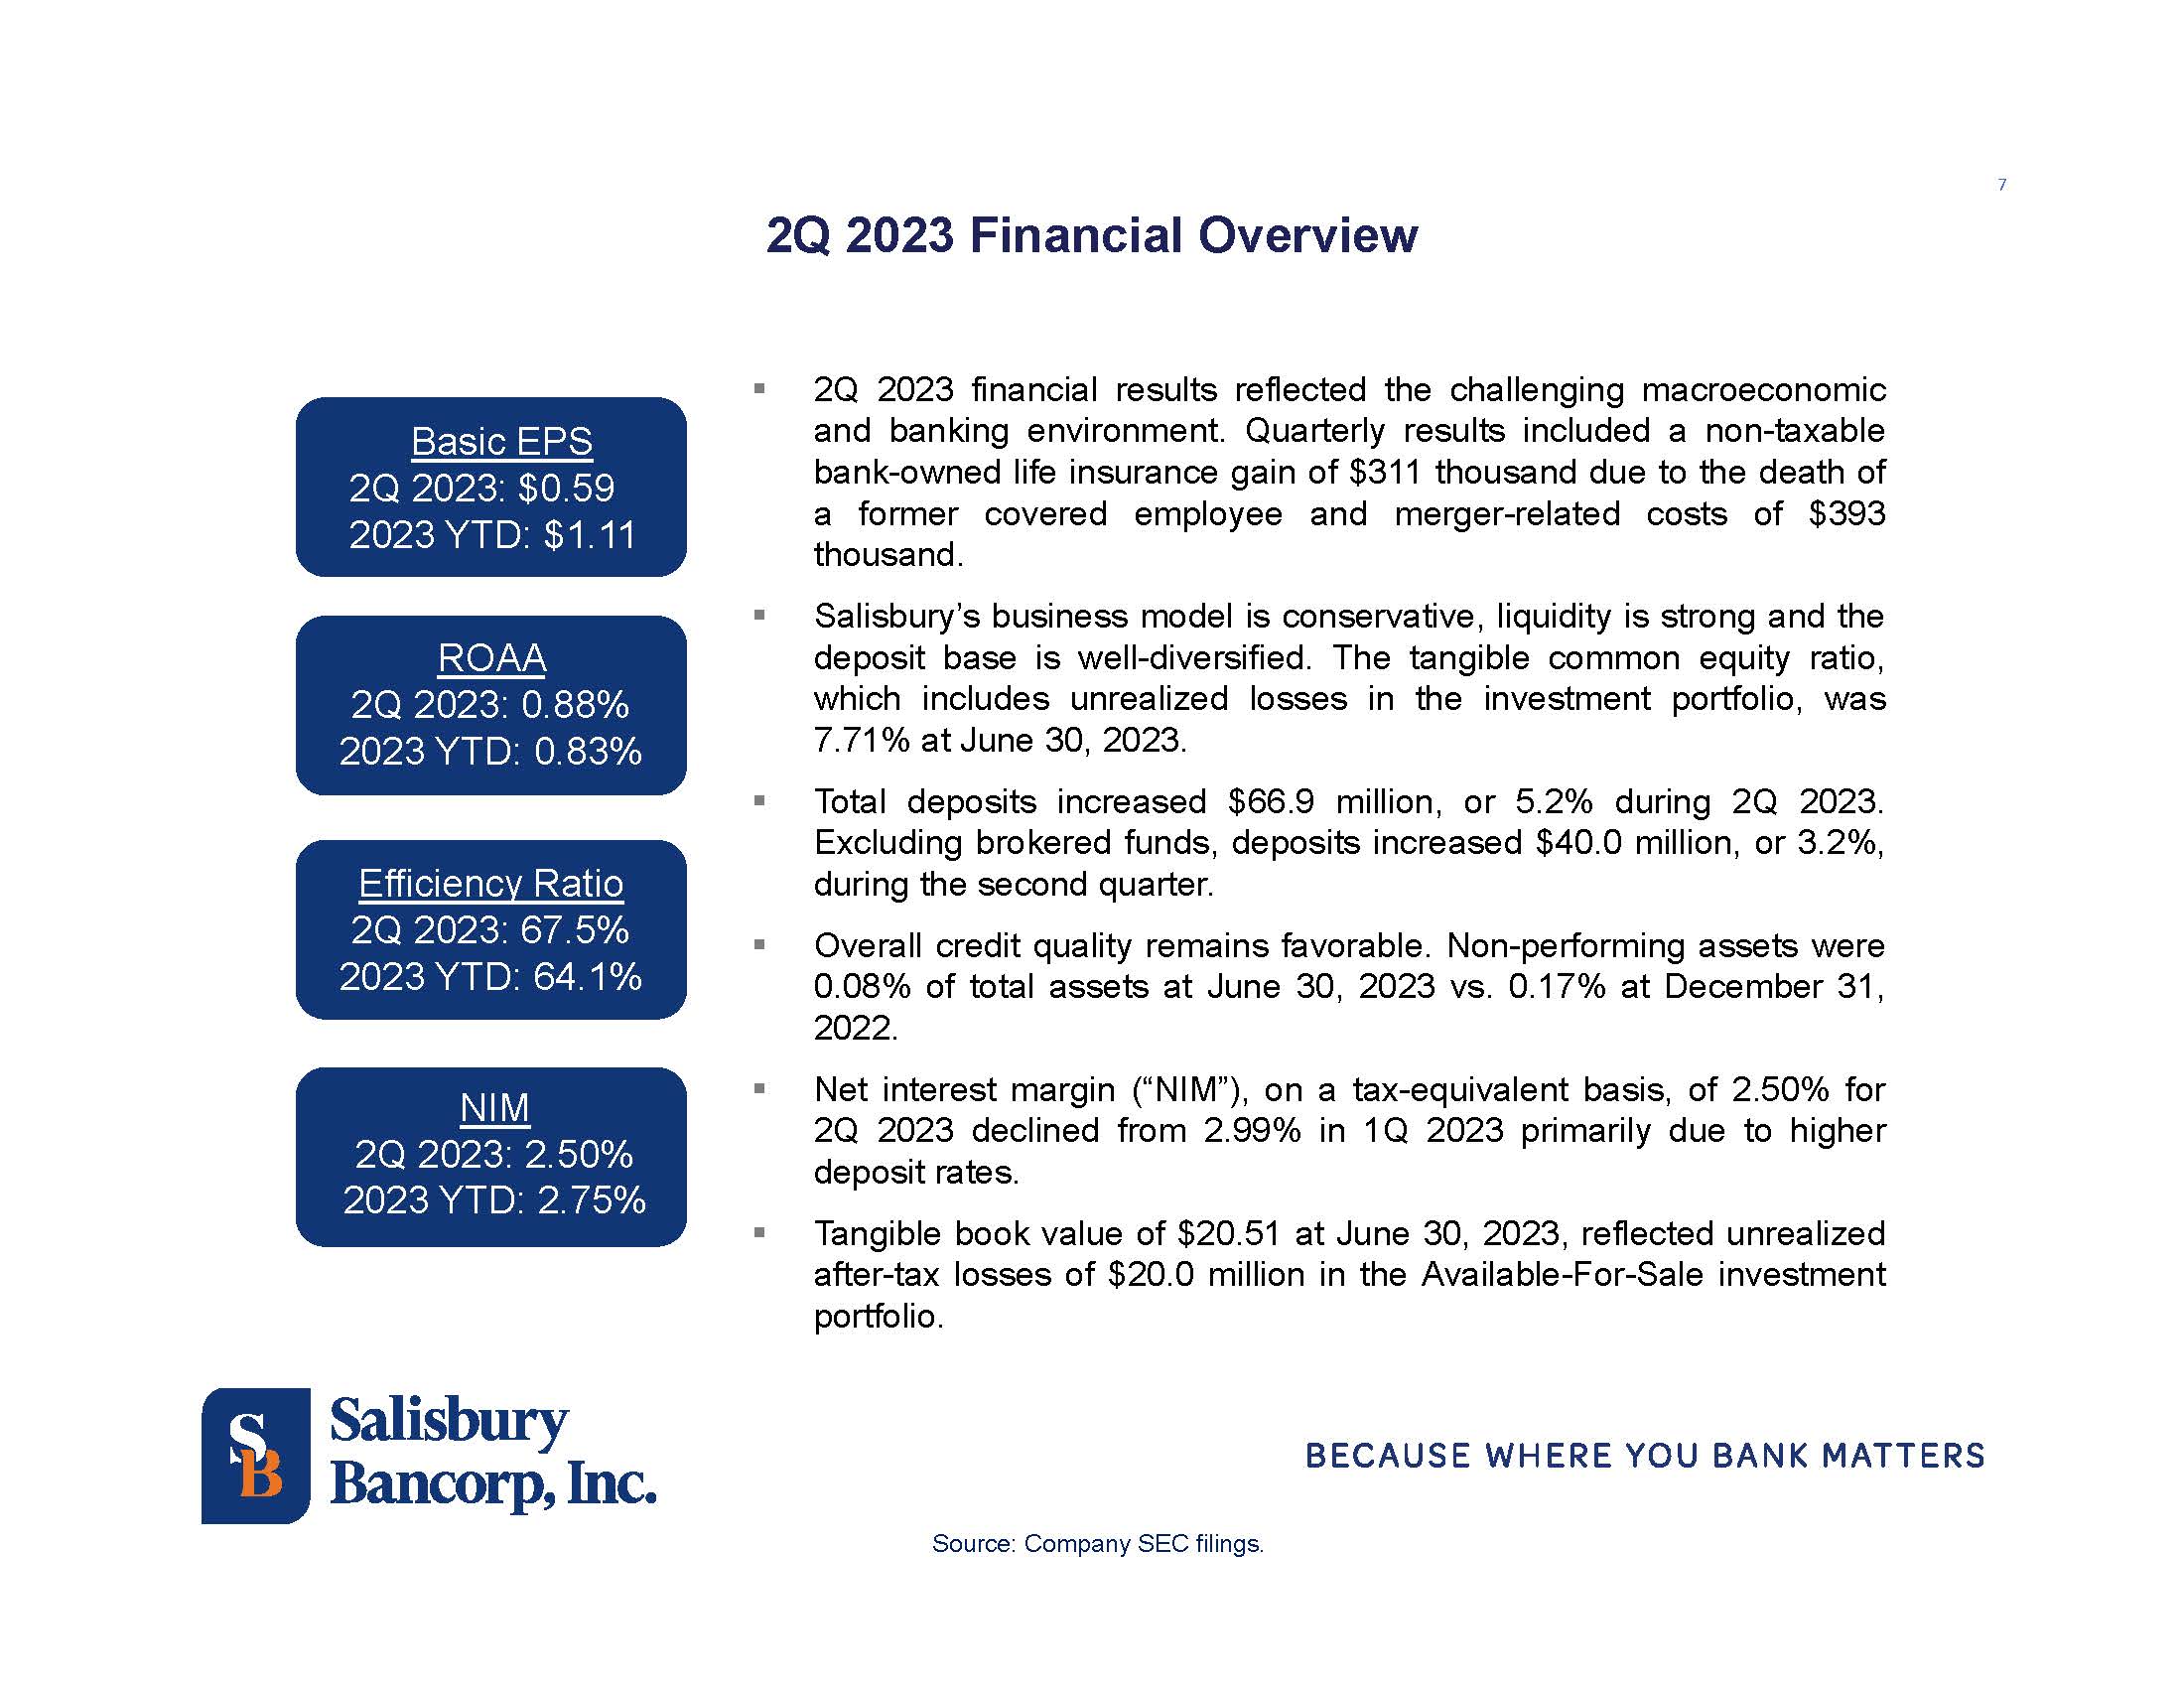
$0.59 per Basic Common Share and Return on Average Assets of 0.88% |
| · | Deposit Balances, Excluding
Brokered Funds, Increased $40.0 million or 3.2% in Second Quarter 2023 |
| · | Non-performing Assets were
0.08% of Total Assets at June 30, 2023 |
| · | Common Equity Tier 1 and Tangible
Common Equity Ratio of 12.41% and 7.71%, Respectively, at June 30, 2023 [1] |
Lakeville, Connecticut, July 26, 2023 /GlobeNewswire…..Salisbury
Bancorp, Inc. (“Salisbury”), (NASDAQ Capital Market: “SAL”), the holding company for Salisbury Bank and Trust
Company (the “Bank”), announced results for its second quarter ended June 30, 2023.
Net income
available to common shareholders was $3.4 million, or $0.59 per basic common share, for the second quarter ended June 30, 2023 (second
quarter 2023), compared with $3.0 million, or $0.52 per basic common share, for the first quarter ended March 30, 2023 (first quarter
2023), and $3.8 million, or $0.67 per basic common share, for the second quarter ended June 30, 2022 (second quarter 2022). Net income
for second quarter 2023 included pre-tax costs of $393 thousand related to Salisbury’s pending merger with NBT Bancorp (“NBT
Merger”) and a non-taxable gain of $311 thousand related to proceeds receivable from a bank-owned life insurance policy (“BOLI”)
due to the death of a former covered employee.
Salisbury’s
President and Chief Executive Officer, Richard J. Cantele, Jr., stated, “Our results for the second quarter reflected the challenging
macroeconomic and banking environment. While deposit balances increased during the quarter, and the credit quality of our loan portfolio
remained strong, higher interest rates compressed net interest margin and earnings. Although the operating environment is likely to remain
challenging in the near term, we are excited to have received regulatory approval for our strategic merger into NBT Bancorp. We believe
Salisbury shareholders will benefit from the additional scale and expanded suite of products and services offered by NBT. I am extremely
proud of the employees of Salisbury Bank who have worked diligently over the years to provide outstanding service to our customers and
to give back to our communities. I am also grateful to our many customers for allowing us to partner and grow with them. I am confident
that our customers will experience the same level of service from NBT.”
Net Interest and Dividend Income
Tax equivalent
net interest income of $9.5 million for the second quarter 2023 decreased $1.8 million, or 16.0%, versus first quarter 2023, and decreased
$1.6 million, or 14.0%, versus second quarter 2022. Tax equivalent interest income of $15.6 million for second quarter 2023 increased
$436 thousand, or 2.9%, versus first quarter 2023 and increased $3.6 million, or 30.5%, from second quarter 2022. The cost of interest-bearing
liabilities of $6.0 million for second quarter 2023 increased $2.2 million, or 59.1%, from first quarter 2023 and increased $5.2 million,
or 604.7%, from second quarter 2022.
Average earning
assets of $1.50 billion for second quarter 2023 increased $5.1 million, or 0.3%, from first quarter 2023, and increased $106.9 million,
or 7.7%, versus second quarter 2022. Average earning assets for second quarter 2023 included average PPP loan balances of $0.2 million,
net of deferred fees, compared $8.8 million in second quarter 2022. Average total interest bearing liabilities of $1.05 billion for second
quarter 2023 increased $26.3 million, or 2.6%, from first quarter 2023 and increased $111.2 million, or 11.8%, versus second quarter 2022.
The increase in average total interest-bearing liabilities from the comparative periods primarily reflected higher customer deposits and
brokered deposits, which Salisbury utilized to fund loan growth and to provide liquidity.
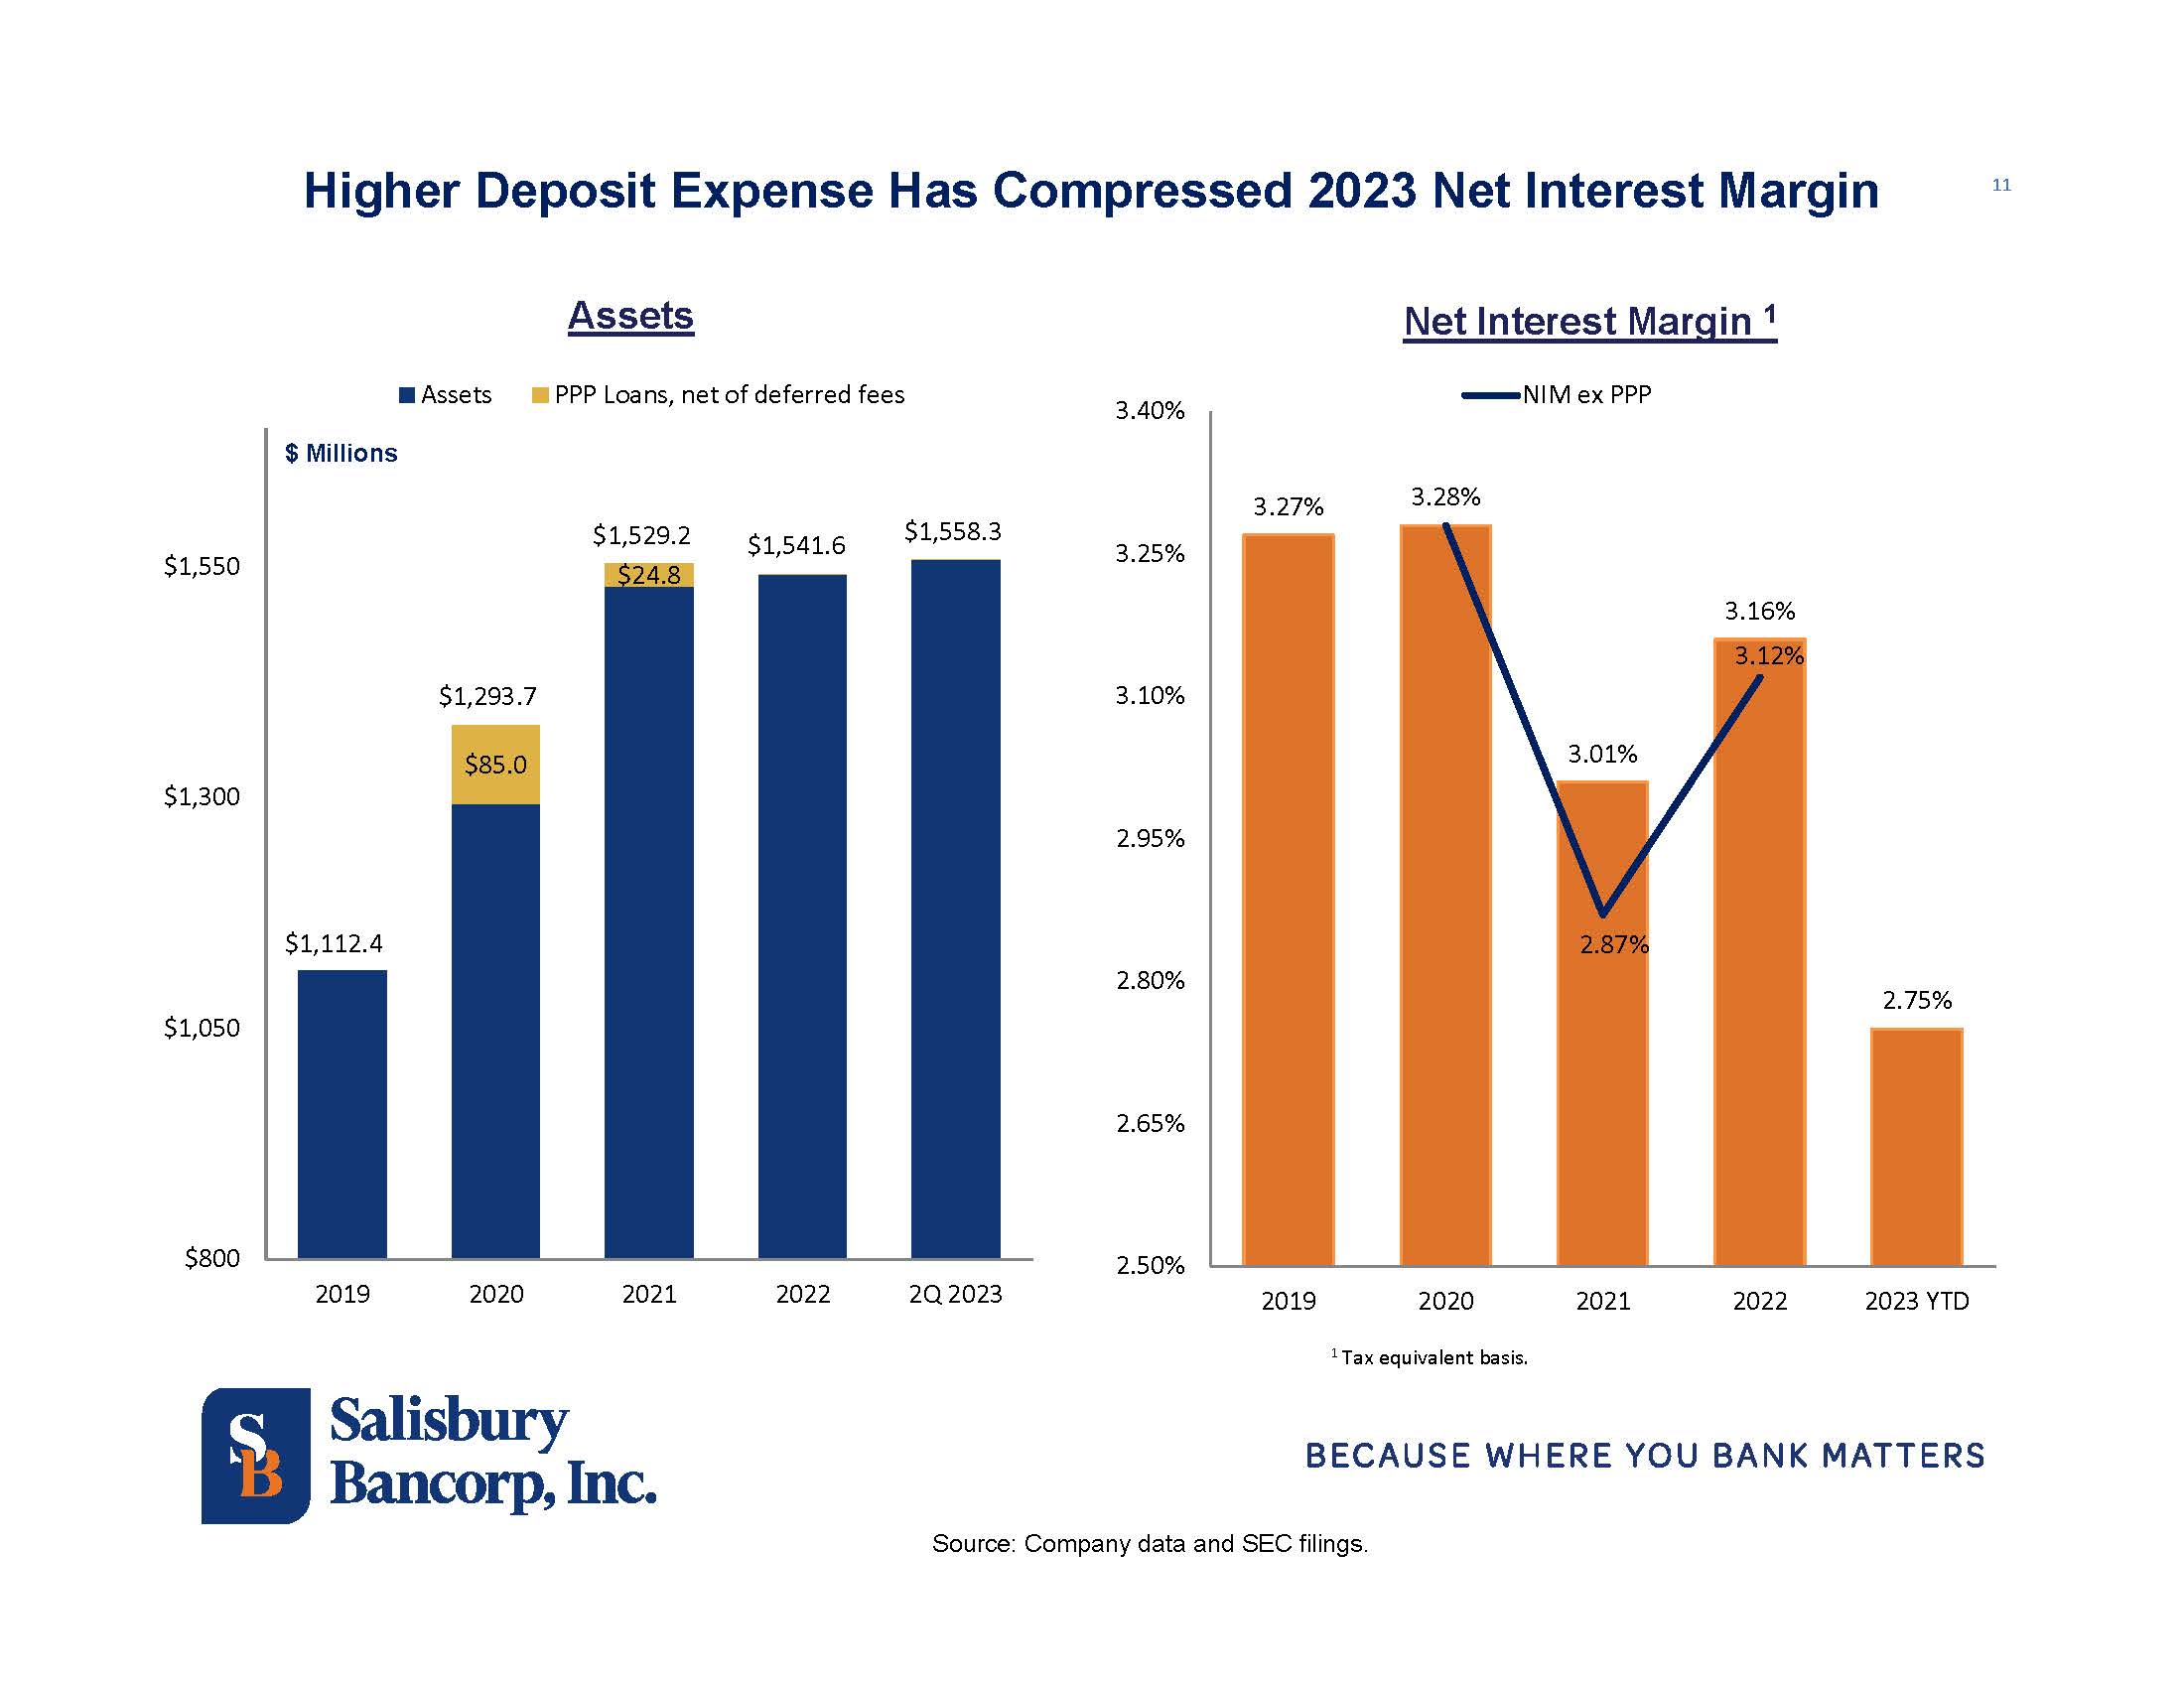
The tax equivalent net interest margin for second
quarter 2023 was 2.50% compared with 2.99% for first quarter 2023 and 3.15% for second quarter 2022. Excluding PPP loans, the tax equivalent
net interest margin for second quarter 2023 was 2.50% compared with 2.99% for first quarter 2023 and 3.10% for second quarter 2022. See
SUPPLEMENTAL INFORMATION – Net Interest and Dividend Income on page 9 of this release for additional
details.
Non-Interest Income
Non-interest
income of $2.9 million for second quarter 2023 increased $241 thousand versus first quarter 2023 and decreased $363 thousand versus second
quarter 2022. Non-interest income for second quarter 2023 included a pre-tax loss of $209 thousand on the sale of $8.2 million of purchased
shared national credit commercial loans and a non-taxable gain of $311 thousand related to proceeds receivable from a BOLI due to the
death of a former covered employee. Second quarter 2022 similarly included a non-recurring non-taxable BOLI gain of $89 thousand due to
the death of former covered employee.
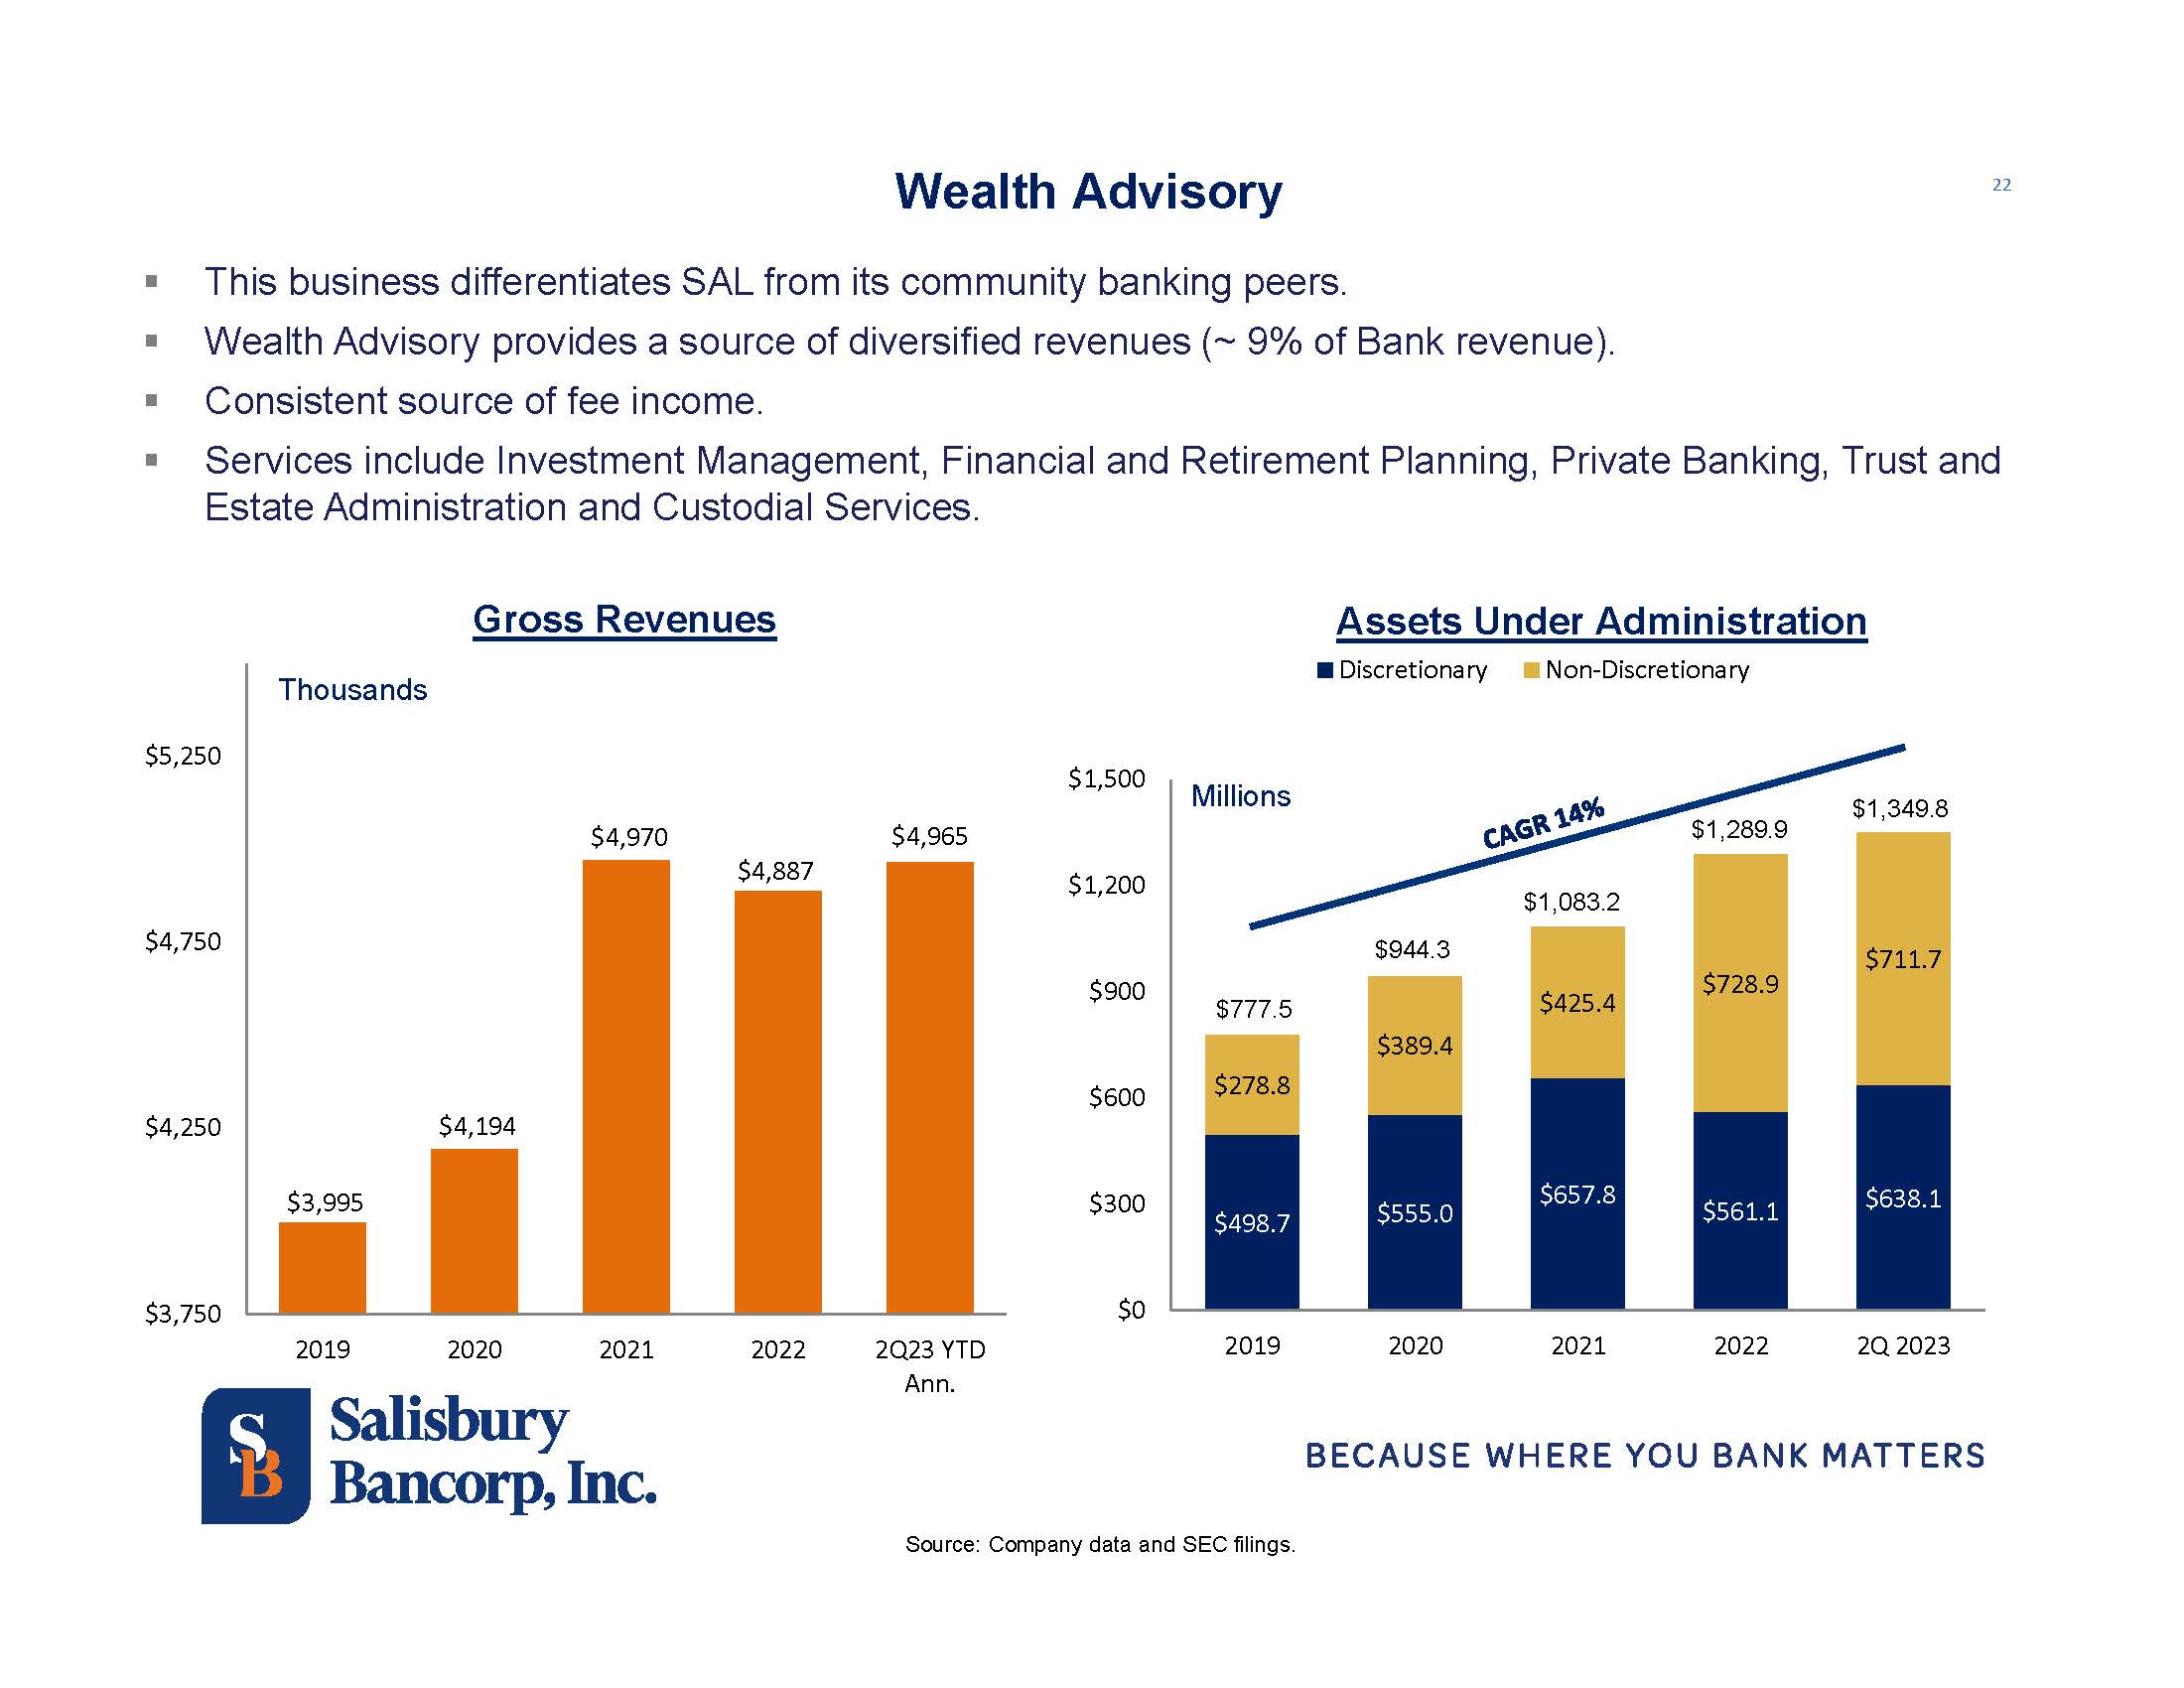
Trust and Wealth Advisory fees of $1.3 million
for second quarter 2023 increased $177 thousand from first quarter 2023 and increased $37 thousand from second quarter 2022. The change
in fee income versus the comparative quarters was primarily driven by estate fees and seasonal tax preparation fees. Assets under administration
were $1.35 billion at June 30, 2023 compared with $1.29 billion at December 31, 2022 and $1.26 billion at June 30, 2022. Discretionary
assets under administration of $638.1 million at June 30, 2023 compared with $561.1 million at December 31, 2022 and $546.5 million at
June 30, 2022. The variance from the comparative quarters primarily reflected changes in market valuations. Non-discretionary assets under
administration of $711.7 million at June 30, 2023 decreased from $728.9 million at December 31, 2022 and decreased from $714.7 million
at June 30, 2022. The variance from the comparative periods primarily reflected changes in the valuation of certain partnership assets
for an existing client relationship. The trust and wealth business records only a nominal annual fee on this relationship.
Service charges
and fees of $1.25 million for second quarter 2023 increased $16 thousand from first quarter 2023 and decreased $472 thousand from second
quarter 2022, which included non-recurring loan pre-payment fees of $425 thousand. The increase
from first quarter 2023 primarily reflected higher interchange fees, which were partially offset by lower deposit and lending-related
fees. The decrease from second quarter 2022 primarily reflected lower lending fees, which were partially offset by higher deposit and
other fees.
________________________
[1]
The tangible common equity ratio is a non-GAAP measure. Management considers this ratio to be an important measure of risk. Refer to
page 8 of this document for the reconciliation of the components of this calculation to U.S. GAAP.
Non-Interest Expense
Non-interest
expense of $8.8 million for second quarter 2023 decreased $350 thousand from first quarter 2023 and increased $244 thousand versus second
quarter 2022. Non-interest expense for second quarter 2023 included costs of $393 thousand associated with the pending NBT merger compared
with $385 thousand in first quarter 2023. Non-interest expense for first quarter 2023 also included a non-recurring charge of $158 thousand
to write off fixed assets in the Red Oaks Mill, New York branch, which closed on April 30, 2023. Compensation expense of $4.9 million
for second quarter 2023 decreased $332 thousand from first quarter 2023 and decreased $88 thousand versus second quarter 2022. The decrease
from first quarter 2022 primarily reflected lower benefits expense and payroll taxes. The decrease from second quarter 2022 primarily
reflected lower production and incentive accruals as well as lower benefits expense, which were partially offset by higher deferred compensation
costs.
Excluding
compensation expense, other non-interest expenses for second quarter 2023 decreased $18 thousand from first quarter 2023 and increased
$332 thousand from second quarter 2022. The decrease from first quarter 2023 reflected the write-off of fixed assets associated with the
Red Oaks Mill, New York branch closure in the prior quarter and lower professional fees, partially offset by higher technology and higher
FDIC insurance costs. Similarly, the increase from second quarter 2022 primarily reflected higher technology and facilities related expenses
and higher FDIC insurance costs, which were partially offset by lower marketing expenses and lower director fees.
The effective
income tax rates for second quarter 2023, first quarter 2023 and second quarter 2022 were 12.7%, 20.0% and 15.3%, respectively.
The lower tax rate in second quarter 2023 was primarily attributed to the non-taxable BOLI proceeds noted above and a release of $163
thousand of reserves to reflect Salisbury’s estimated tax liability at June 30, 2023.
Loans
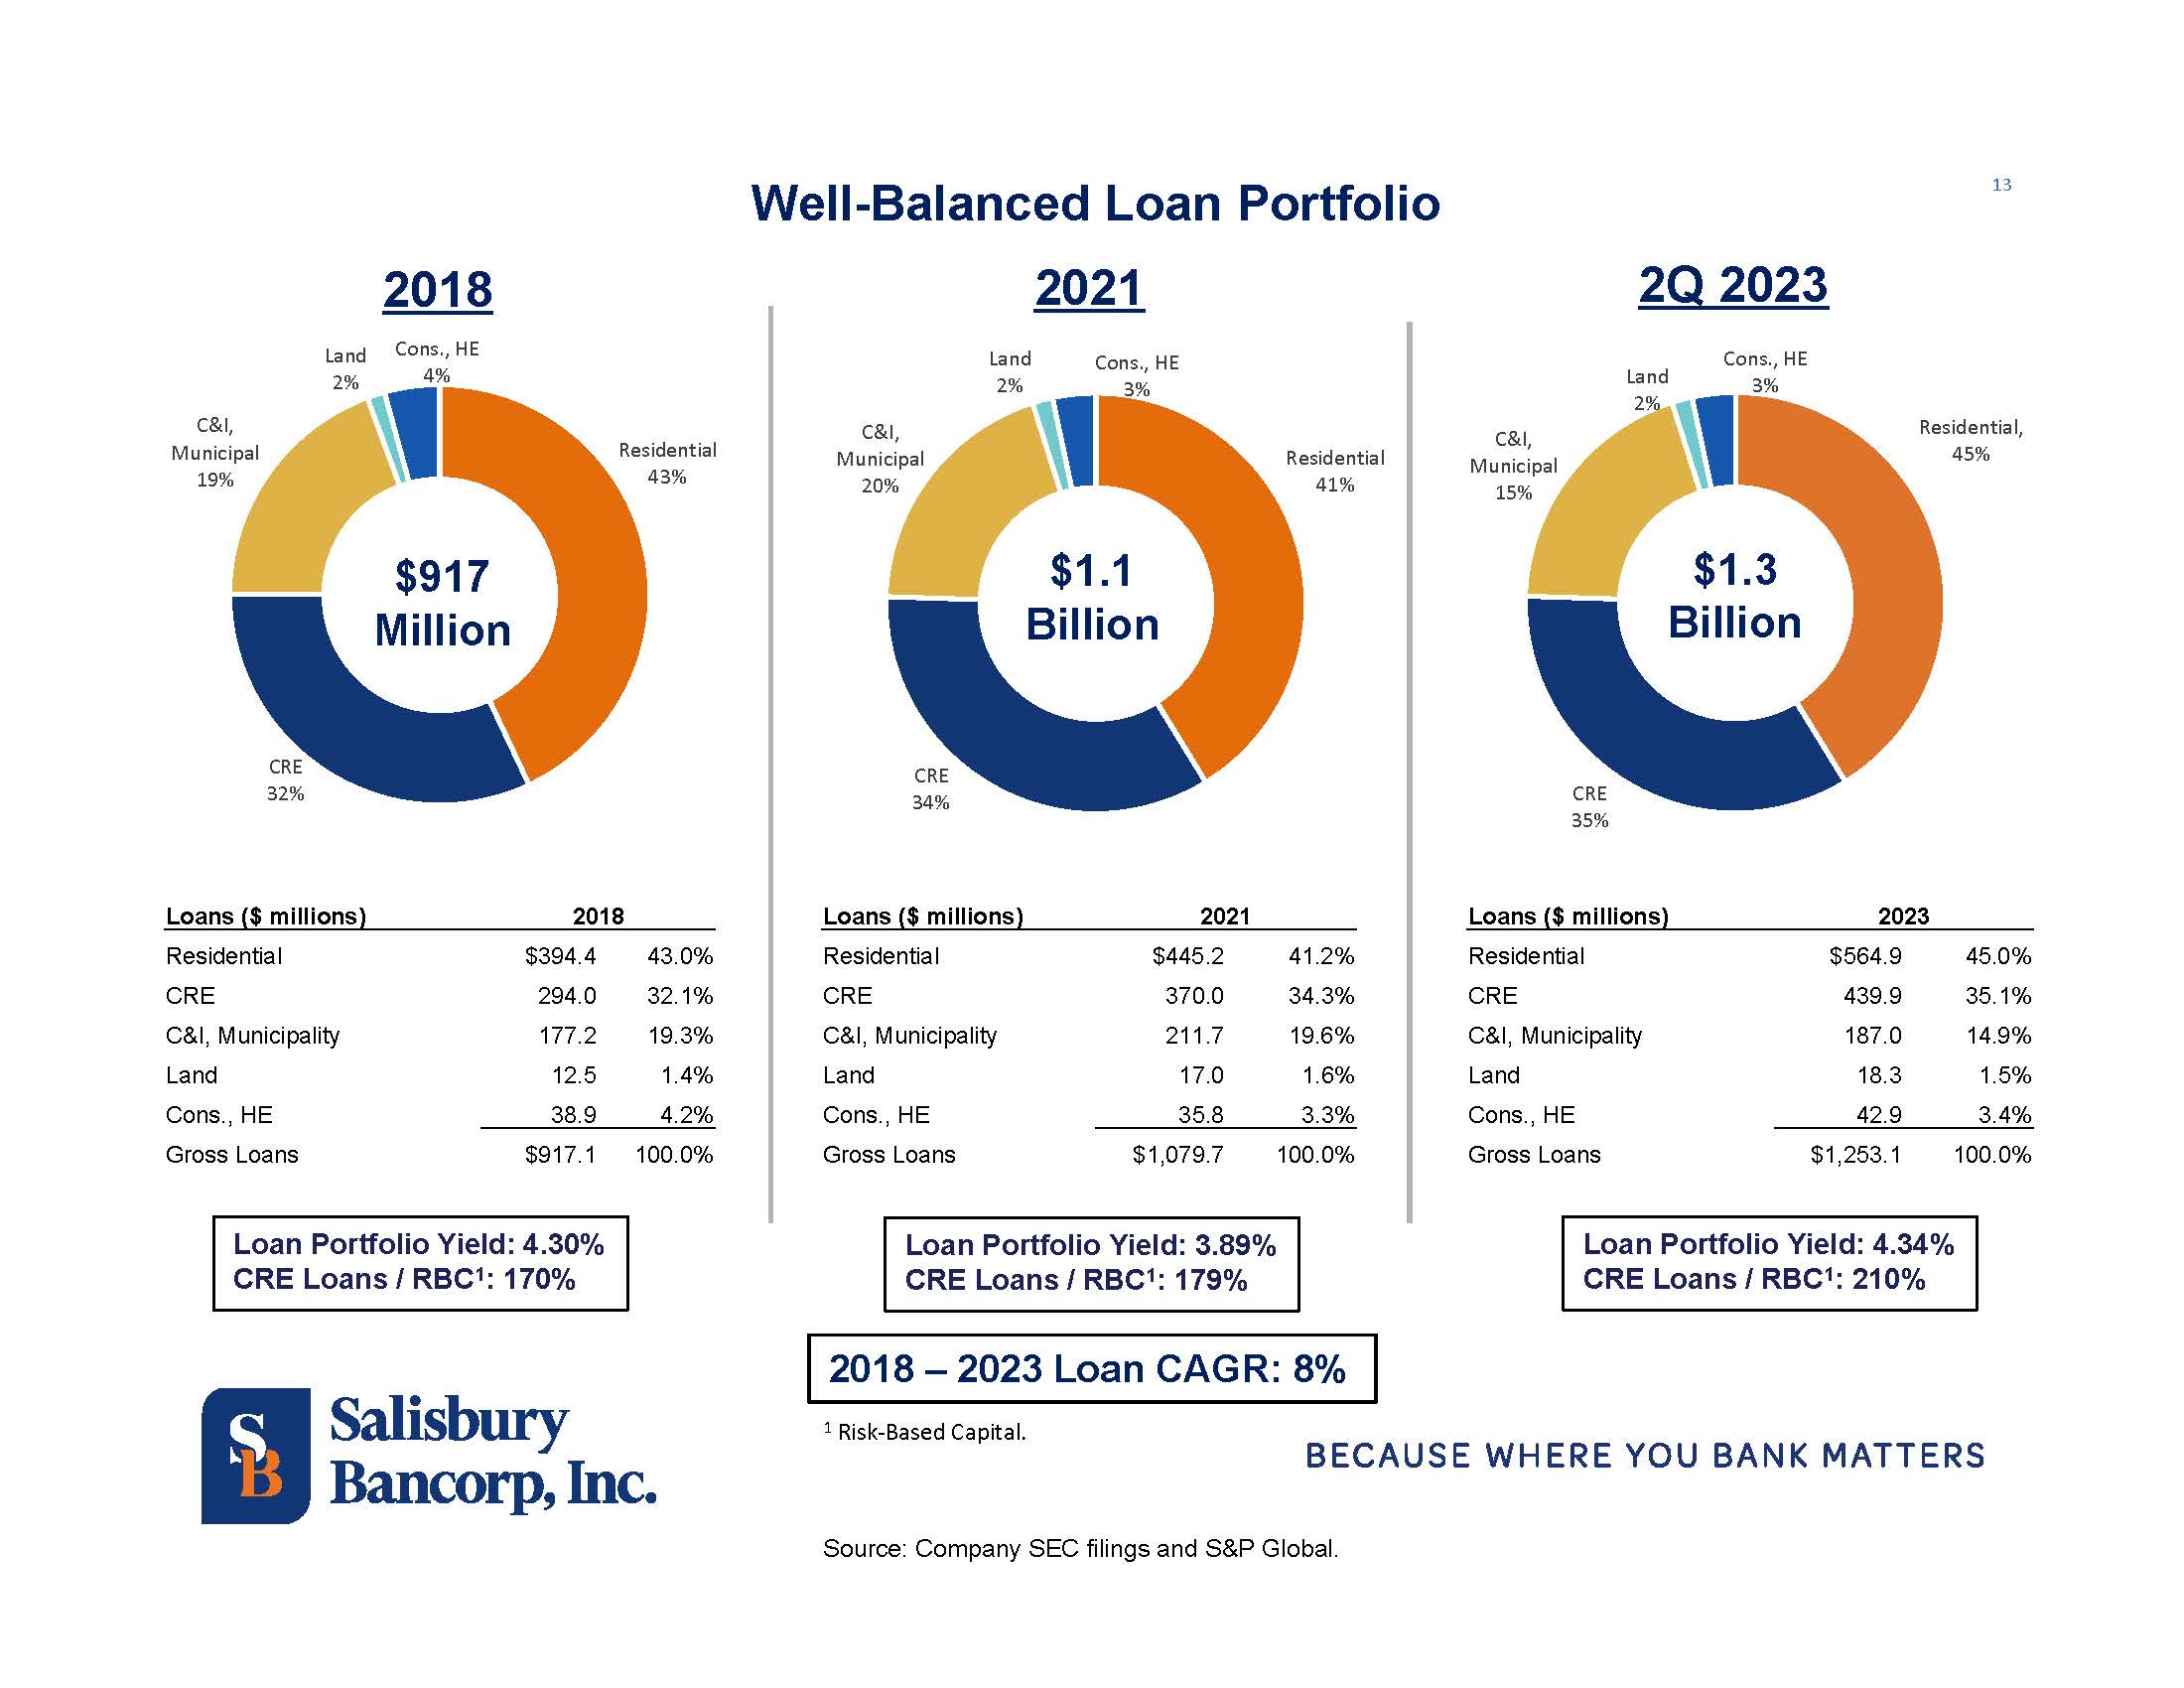
Gross loans
receivable of $1.25 billion for second quarter 2023 increased $2.4 million, or 0.2%, from first quarter 2023, and increased $103.7 million,
or 9.0%, from second quarter 2022. New loan originations in second quarter 2023 were mostly offset by the sale of $8.2 million of shared
national credit loans and the paydown of commercial credit lines. Residential 5+ multifamily gross loans receivable at June 30, 2023 and
December 31, 2022 included a loan for approximately $16.0 million. At June 30, 2022 this loan, which had a gross balance of approximately
$12.0 million, was reported in the commercial real estate category while the project was under construction. The ratio of gross loans
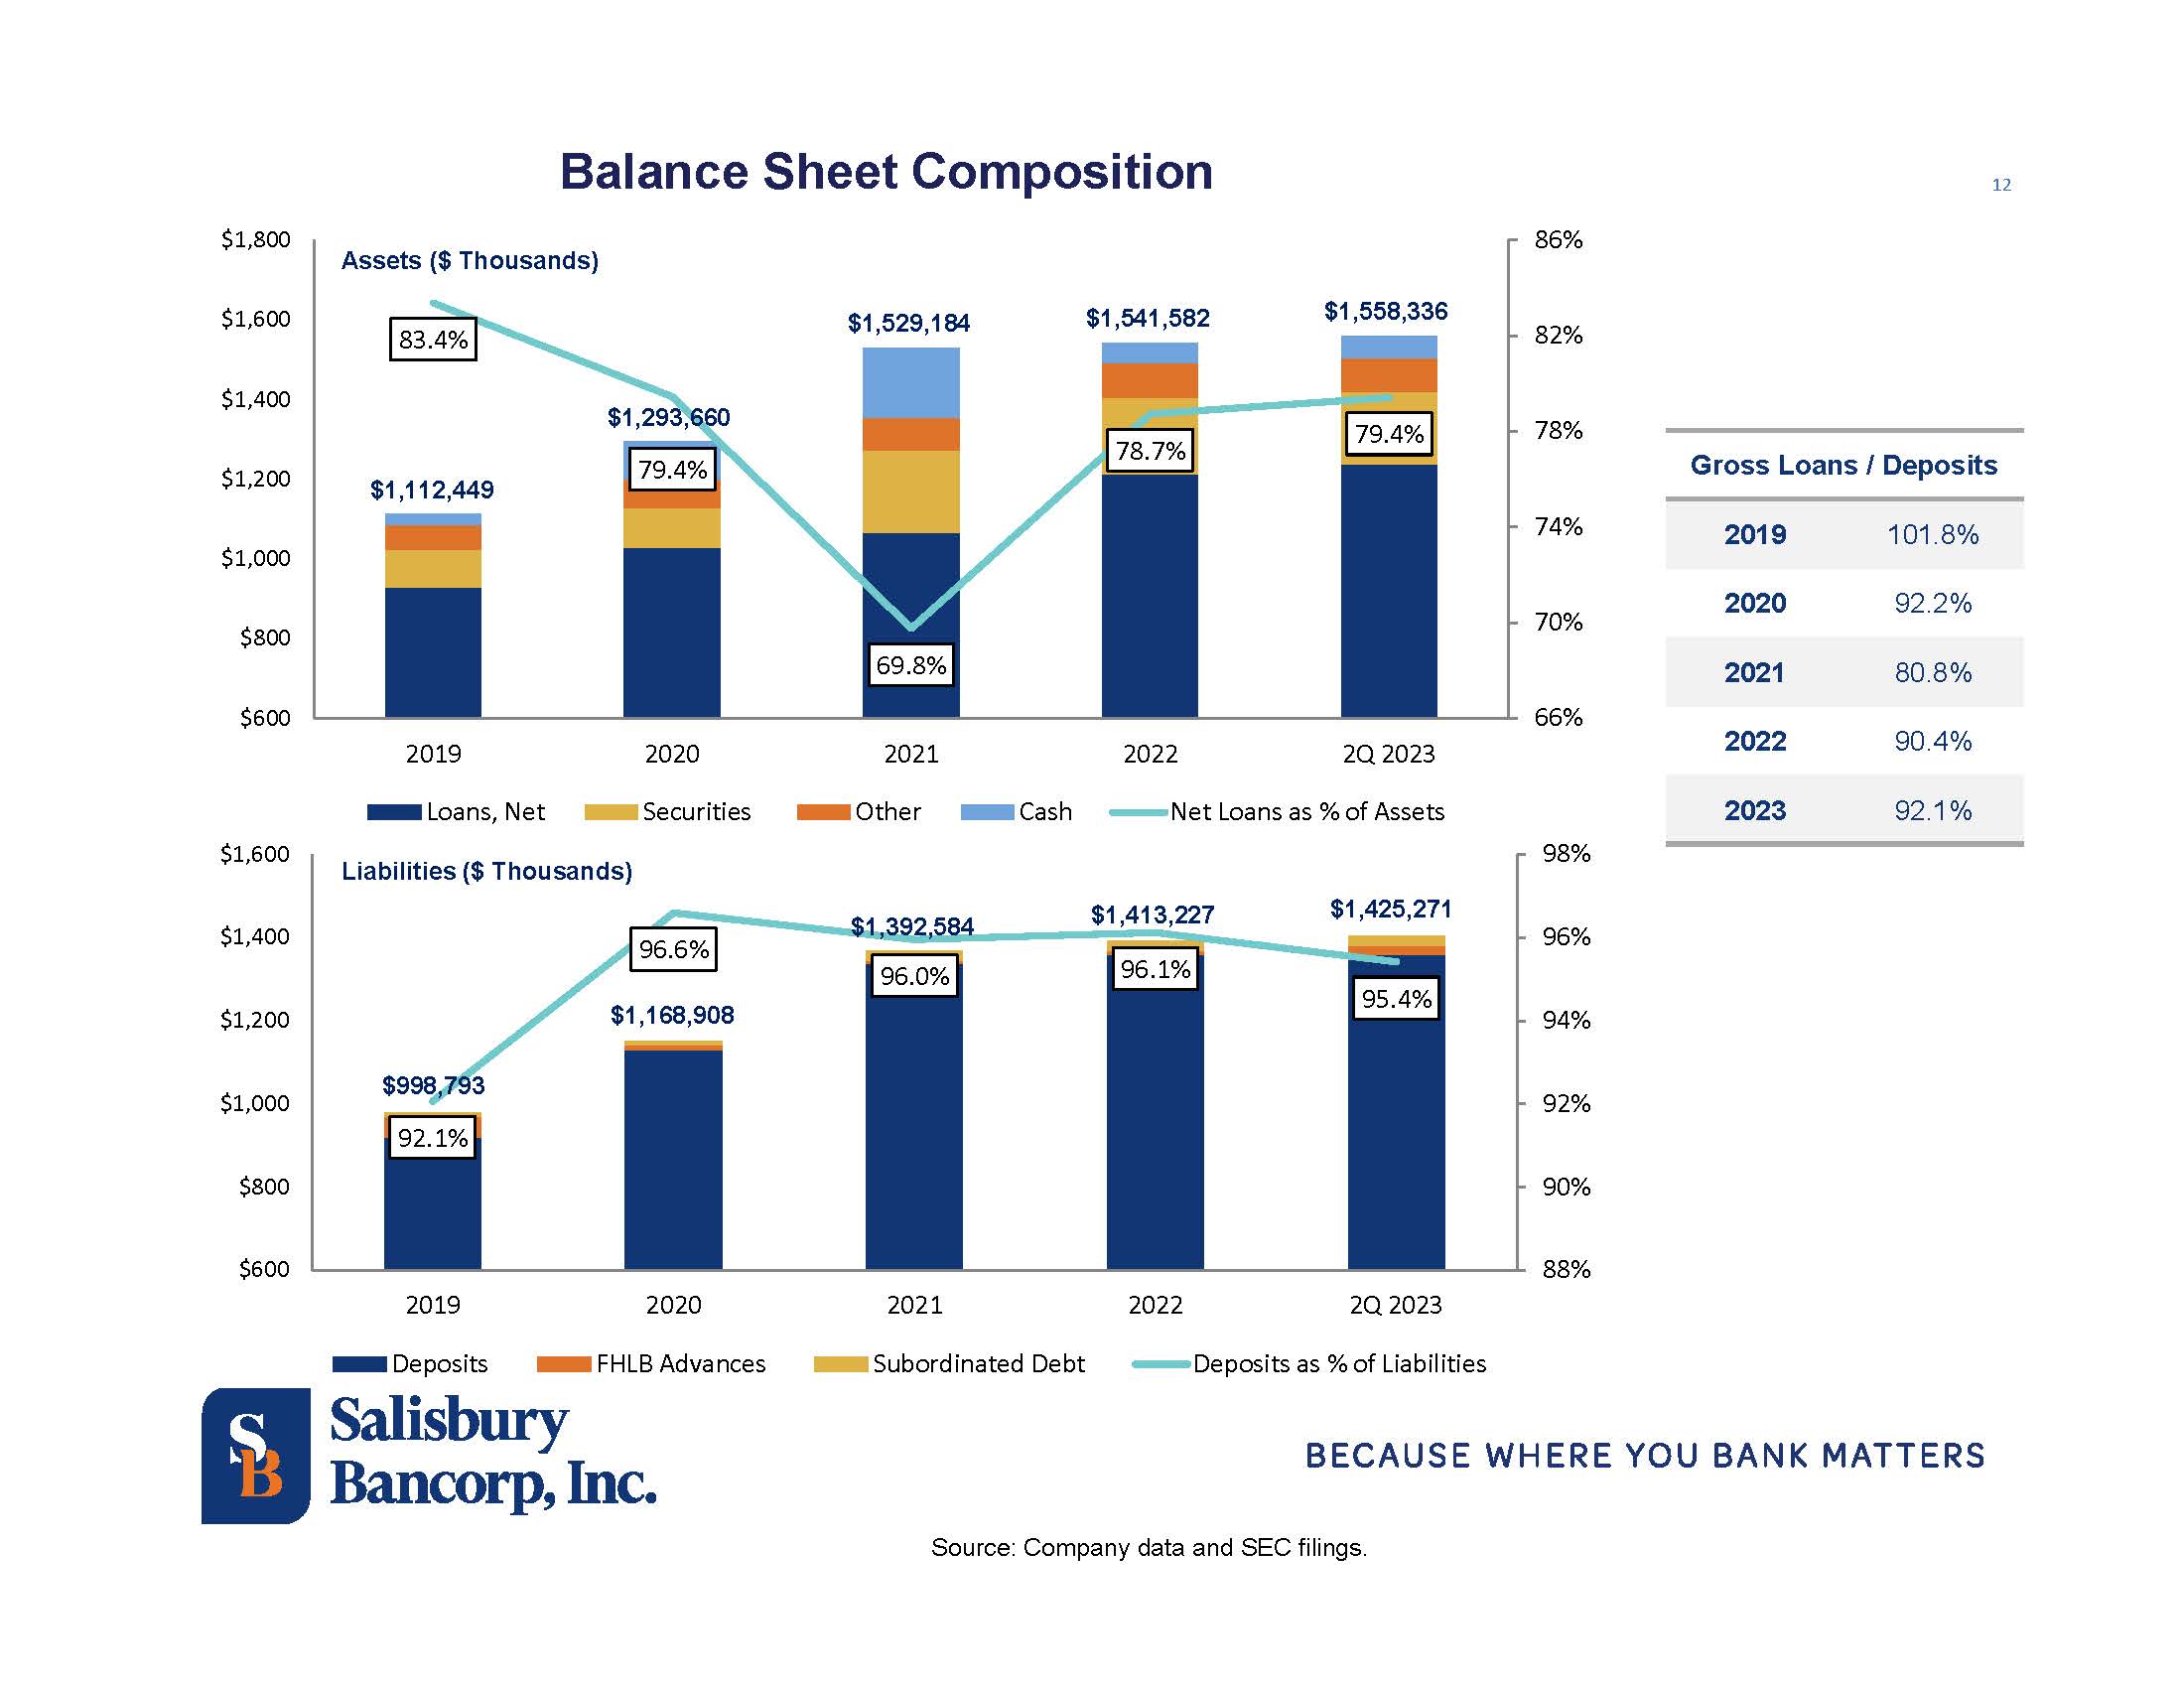
to deposits for second quarter 2023 was 92.1% compared with 96.7% for first quarter 2023 and 87.3% for second quarter 2022. Balances by
loan type for the comparative periods were as follows:
| Loan Type ($ in thousands) | |
|
Q2 2023 |
| |
|
Q1 2023 |
| |
|
Q2 2022 |
|
| Residential Real Estate (1-4 Family) | |
$ | 494,362 | | |
$ | 483,893 | | |
$ | 444,698 | |
| Residential 5+ Multifamily | |
| 95,297 | | |
| 91,772 | | |
| 69,272 | |
| Commercial Real Estate | |
| 438,949 | | |
| 433,379 | | |
| 387,787 | |
| Commercial & Industrial ex PPP Loans | |
| 173,457 | | |
| 185,376 | | |
| 189,086 | |
| PPP Loans | |
| 201 | | |
| 226 | | |
| 2,894 | |
| Commercial & Industrial – Total | |
| 173,658 | | |
| 185,602 | | |
| 191,980 | |
| Farm Land | |
| 3,320 | | |
| 3,451 | | |
| 3,668 | |
| Vacant Land | |
| 15,019 | | |
| 14,601 | | |
| 15,397 | |
| Municipal | |
| 13,306 | | |
| 17,577 | | |
| 17,486 | |
| Consumer | |
| 18,178 | | |
| 19,491 | | |
| 18,155 | |
| Deferred
Costs | |
| 980 | | |
| 875 | | |
| 1,018 | |
| Gross
Loans Receivable | |
$ | 1,253,069 | | |
$ | 1,250,641 | | |
$ | 1,149,461 | |
| Gross
Loans Receivable ex PPP | |
$ | 1,252,868 | | |
$ | 1,250,415 | | |
$ | 1,146,567 | |
Asset Quality
Non-performing assets of $1.3 million, or 0.08%
of total assets at June 30, 2023, decreased $1.3 million from $2.7 million, or 0.17% of total assets at December 31, 2022, and decreased
$2.9 million from $4.2 million, or 0.28% of total assets, at June 30, 2022.
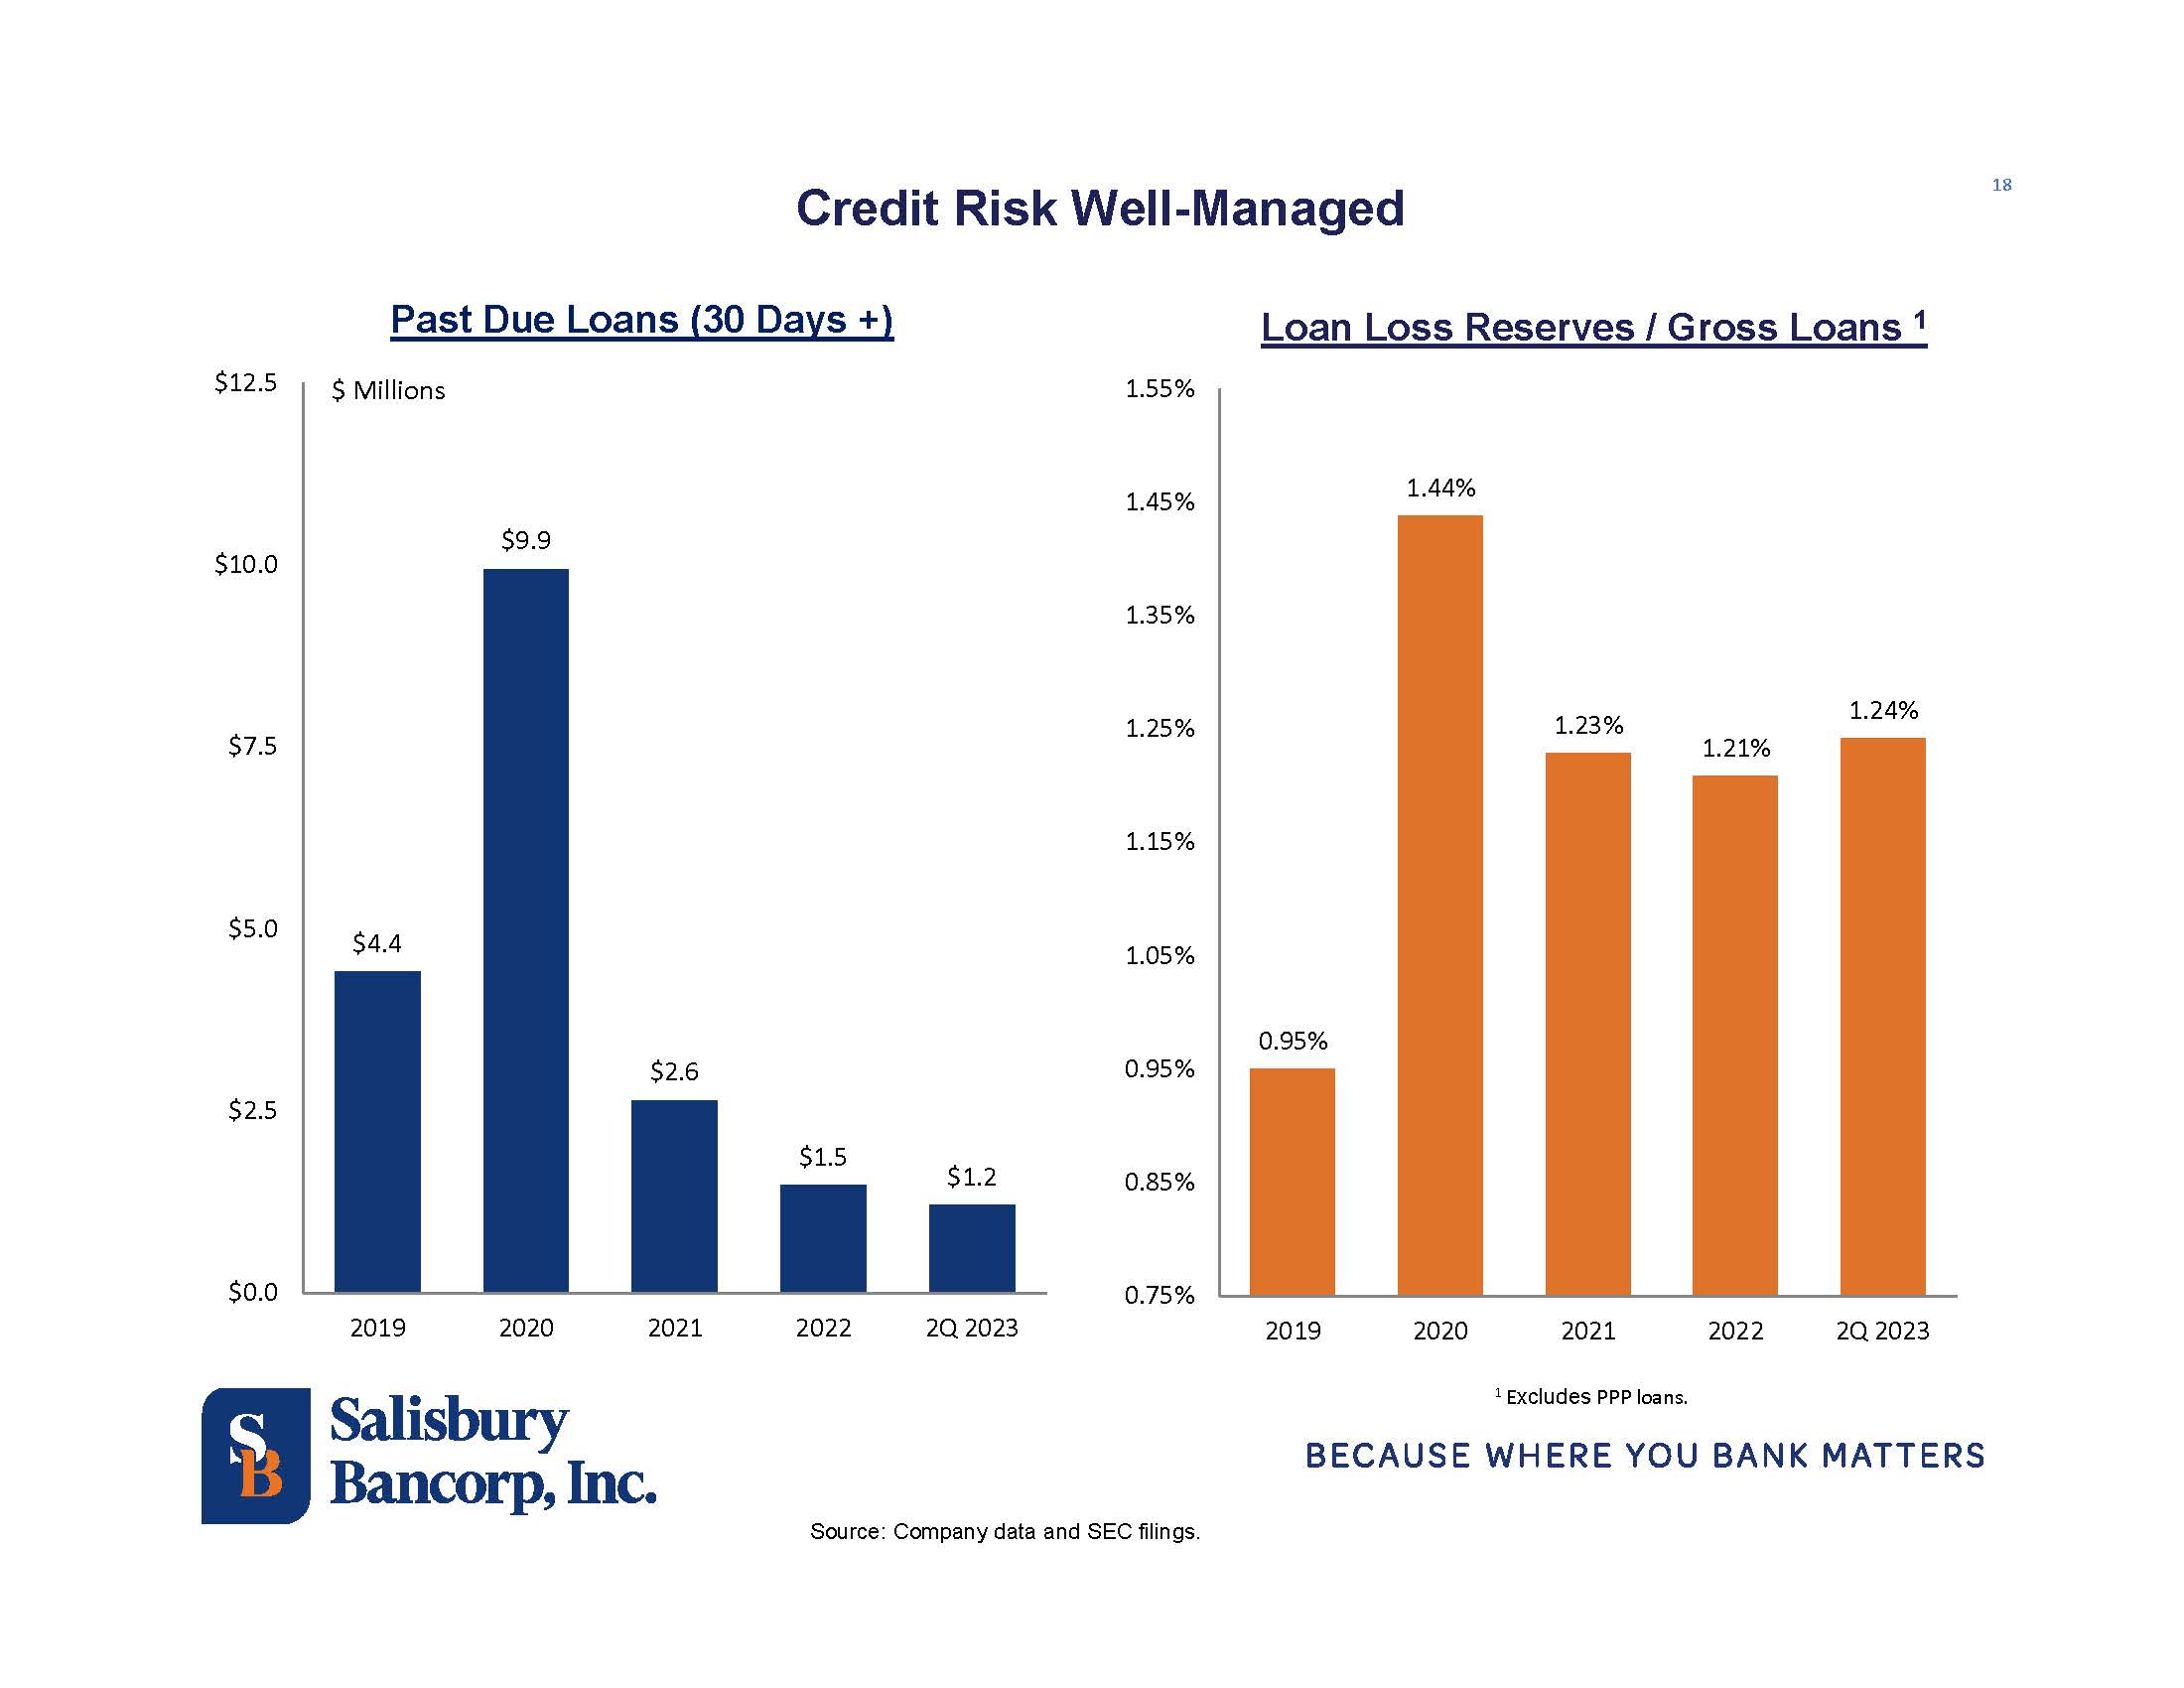
Accruing
loans receivable 30-to-89 days past due of $0.7 million, or 0.06% of gross loans receivable, decreased $0.6 million from $1.3 million,
or 0.11% of gross loans receivable at December 31, 2022, and decreased $0.3 million from $1.0 million, or 0.09% of gross loans receivable
at June 30, 2022.
The allowance
for credit losses for second quarter 2023 was $15.6 million compared with $16.0 million for first quarter 2023 and $13.7 million for second
quarter 2022. The provision release for second quarter 2023 was $0.4 million compared with provision expenses of $0.9 million for
first quarter 2023 and $1.1 million for second quarter 2022. The benefit for second quarter 2023 primarily reflected the release of reserves
associated with the shared national credit commercial loans, which Salisbury sold during the quarter, and an improvement in the forecast
of certain macro-economic factors, which underpin the Bank’s allowance for credit losses model. Net loan charge-offs were $47 thousand
for the second quarter 2023 compared with $32 thousand for first quarter 2023 and $312 thousand for the second quarter 2022.
Reserve coverage,
as measured by the ratio of the allowance for credit losses to gross loans, excluding PPP loans, was 1.24% for the second quarter 2023
versus 1.28% for first quarter 2023 and 1.20% for second quarter 2022. Similarly, reserve coverage, as measured by the ratio of the allowance
for credit losses to non-performing loans was 1,178% for the second quarter 2023 versus 714% for first quarter 2023 and 324% for second
quarter 2022.
Salisbury
endeavors to work constructively to resolve its non-performing loan issues with customers. Substantially all non-performing loans are
collateralized with real estate and the repayment of such loans is largely dependent on the return of such loans to performing status
or the liquidation of the underlying real estate collateral.
Deposits, Borrowings and Liquidity
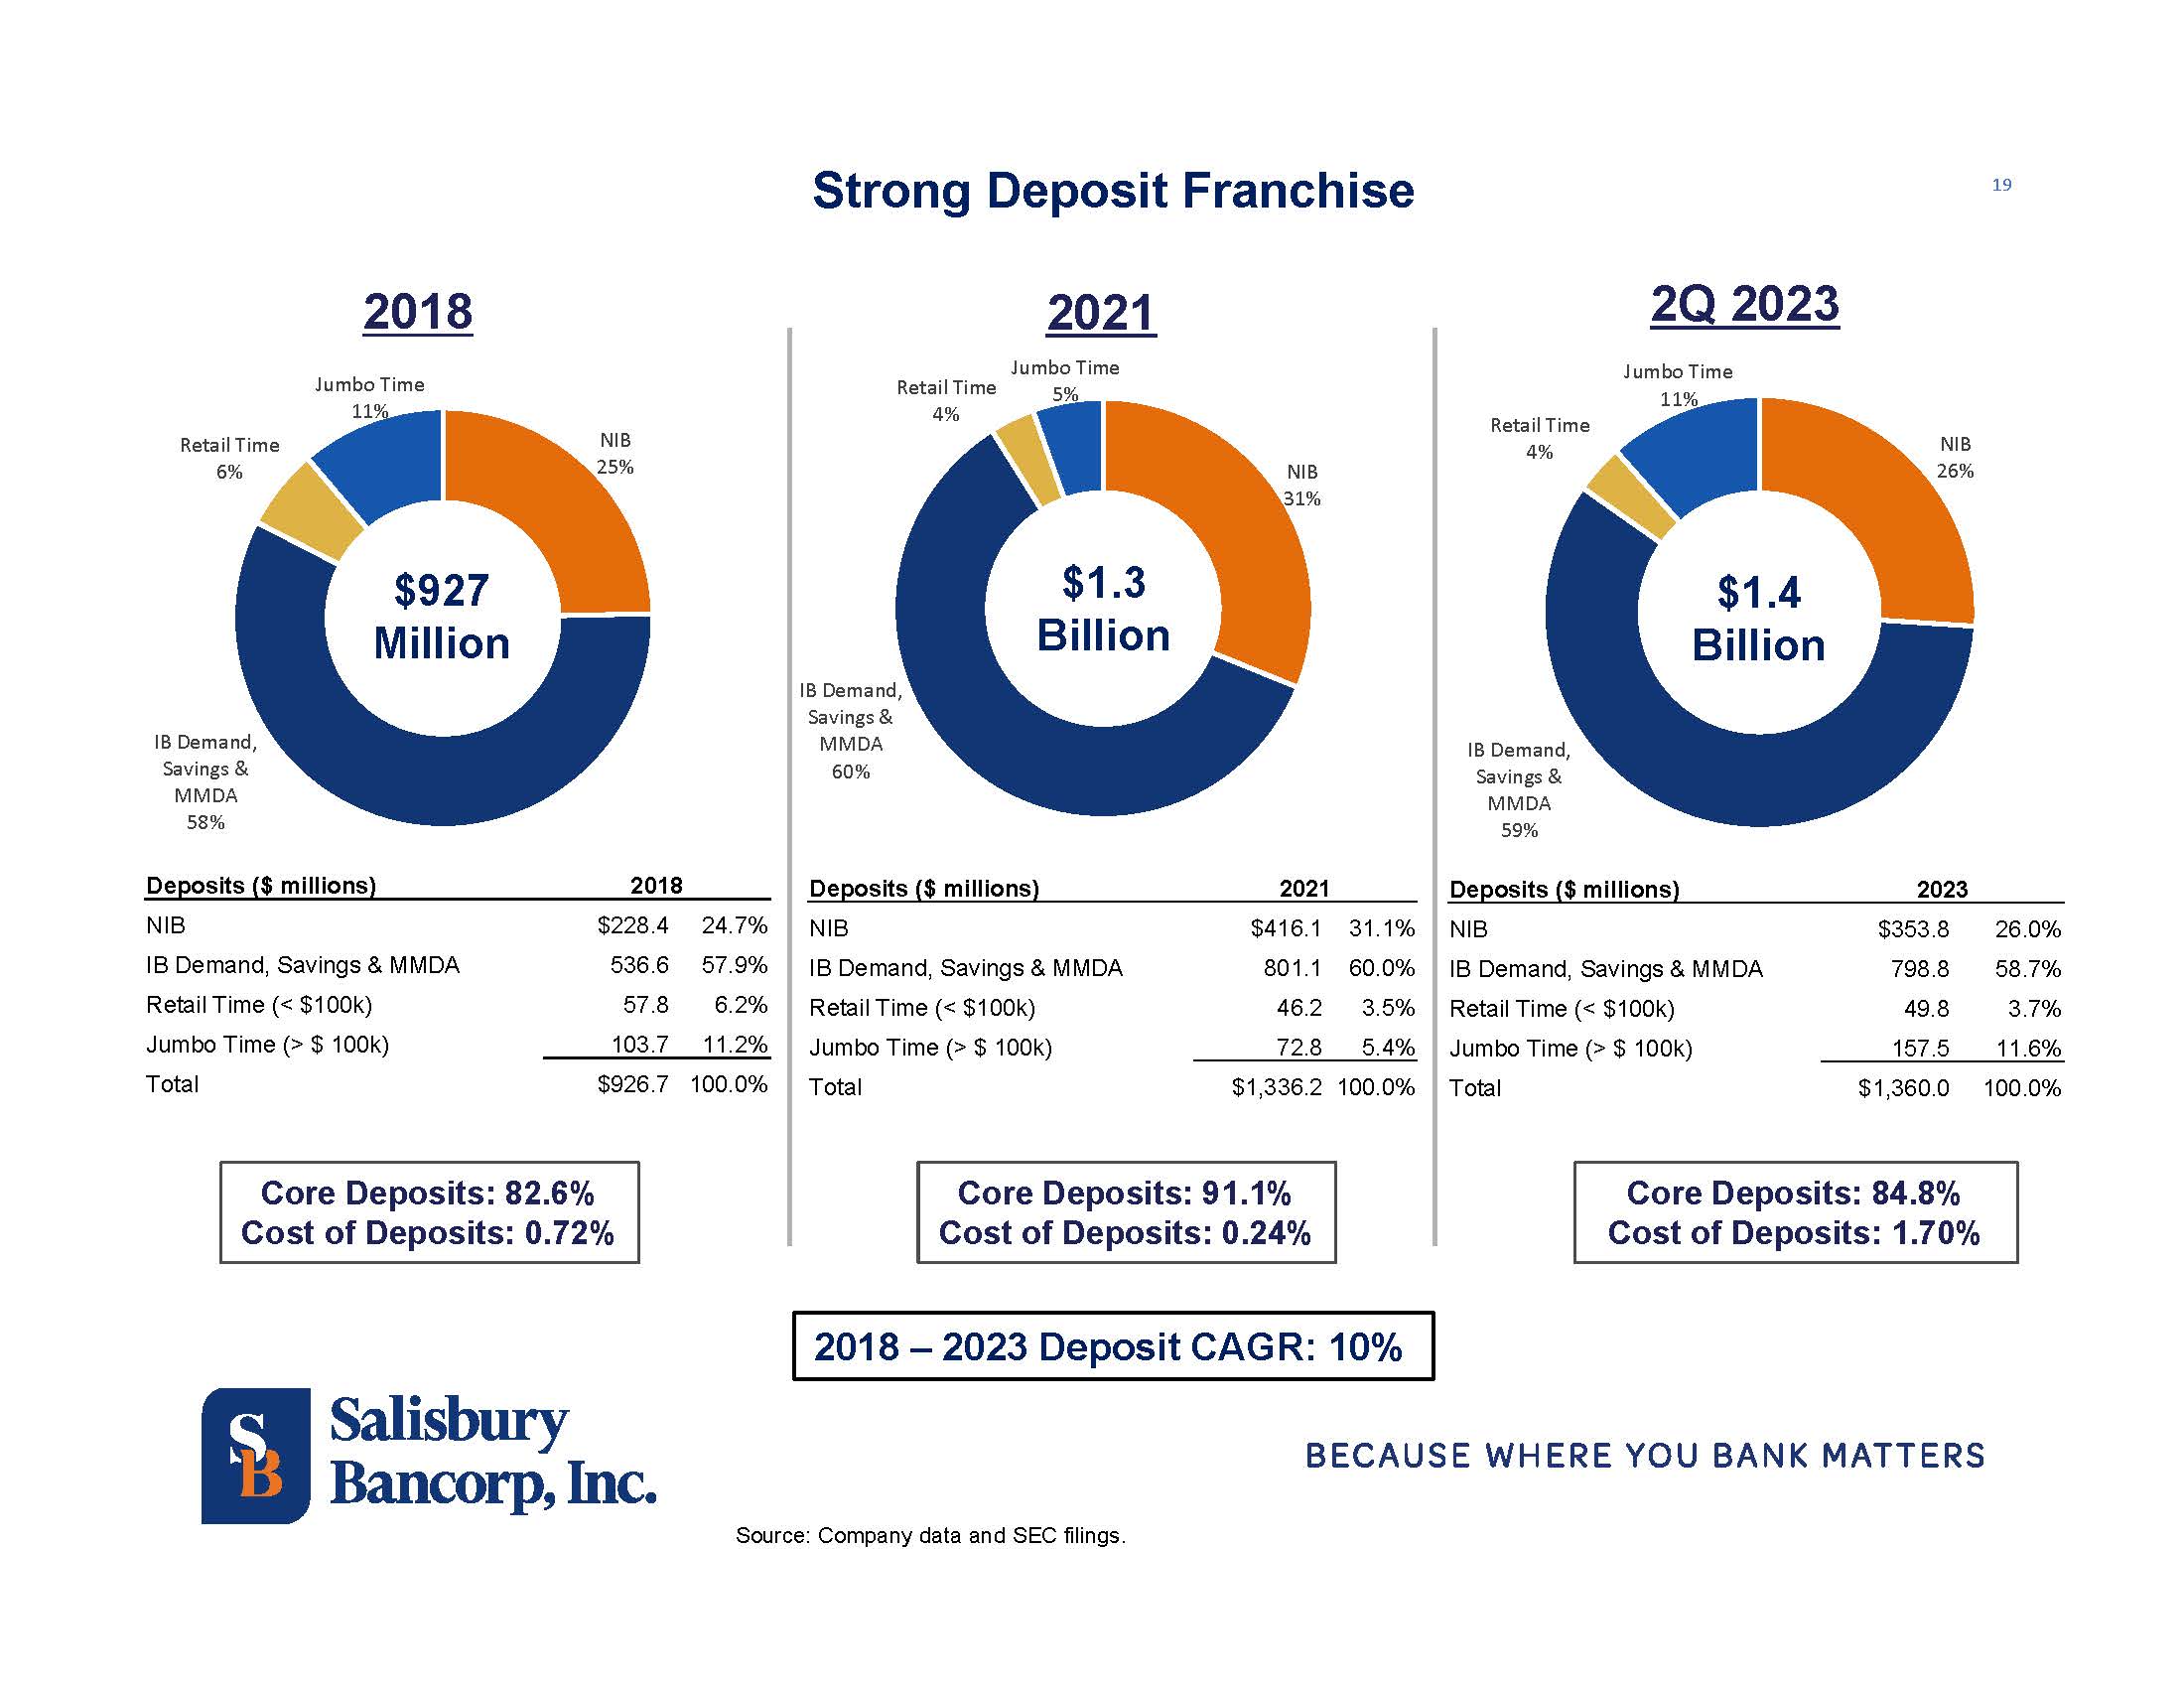
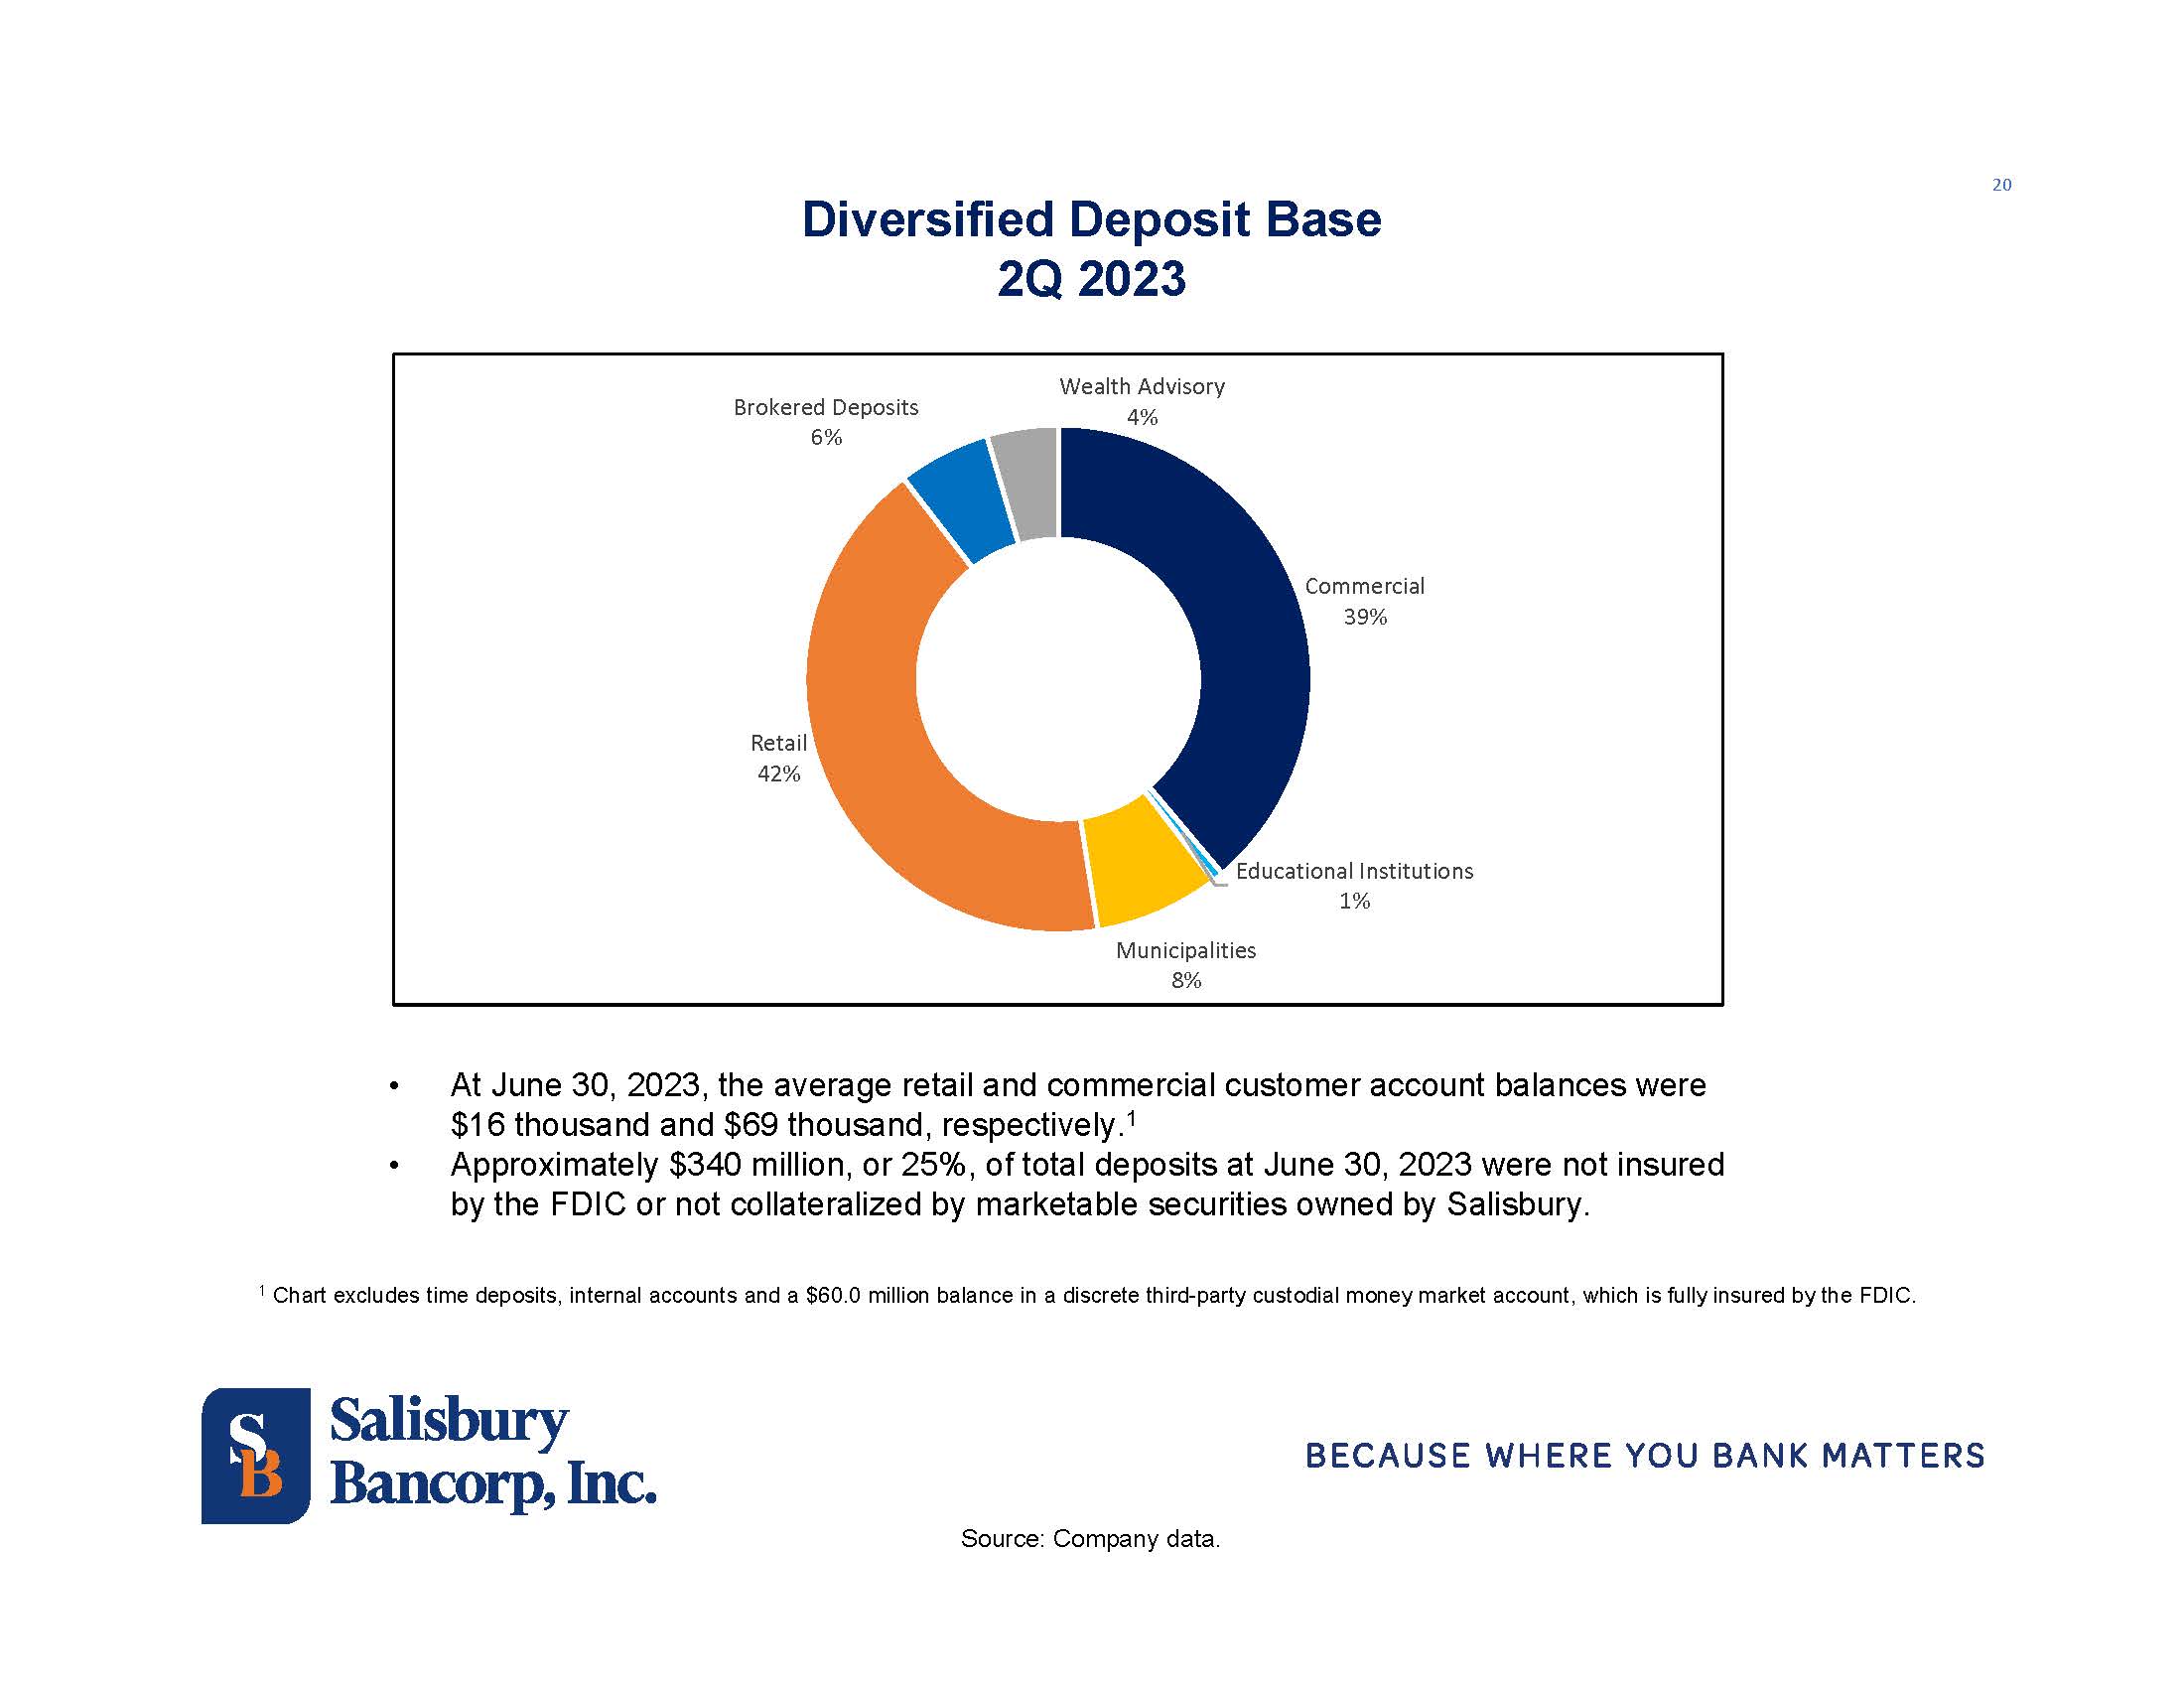
Total deposits
of $1.36 billion at June 30, 2023 increased $1.6 million, or 0.1%, from December 31, 2022 and increased $43.4 million, or 3.3%, from June
30, 2022. Salisbury accumulates deposits from a diverse customer base. At June 30, 2023, the composition of Salisbury’s deposit
balances was as follows: retail: 42%; commercial: 39%; municipalities: 8%; brokered funds: 6%; Wealth Advisory: 5%; and educational institutions:
1%. At June 30, 2023, the balance of Salisbury’s deposits that were not insured by the FDIC or not collateralized by marketable
securities owned by Salisbury was approximately $340 million, or 25%, of total deposits.
At June 30,
2023, Salisbury had outstanding brokered deposits balances of $80.1 million compared with balances of $45.0 million at December 31, 2022
and $35.0 million at June 30, 2022. Brokered deposits are included in the certificates of deposit balances on Salisbury’s consolidated
balance sheet. Management utilizes brokered deposits to fund loan growth and as a source of liquidity. Excluding brokered funds, Salisbury’s
deposits increased $40.0 million, or 3.2%, from first quarter 2023. Average total deposits were $1.4 billion for second quarter 2023 and
first quarter 2023 compared with $1.3 billion for second quarter 2022. Average total deposits for second quarter 2023 included average
brokered deposits of $75.0 million compared with $47.9 million for first quarter 2023 and $18.0 million for second quarter 2022.
Salisbury
has access to various sources of liquidity, including the FHLBB and the Federal Reserve Bank. Salisbury had $20.0 million of outstanding
advances from FHLBB at June 30, 2023 compared with $10.0 million at December 31, 2022. Salisbury did not have any outstanding advances
from FHLBB at June 30, 2022. Salisbury’s excess borrowing capacity at FHLBB was approximately $218 million at June 30, 2023. Additionally,
at June 30, 2023, Salisbury had approximately $76 million of eligible collateral that could be posted to the Federal Reserve to secure
funds under the Bank Term Funding Program. Salisbury has not borrowed funds under this program.
Capital
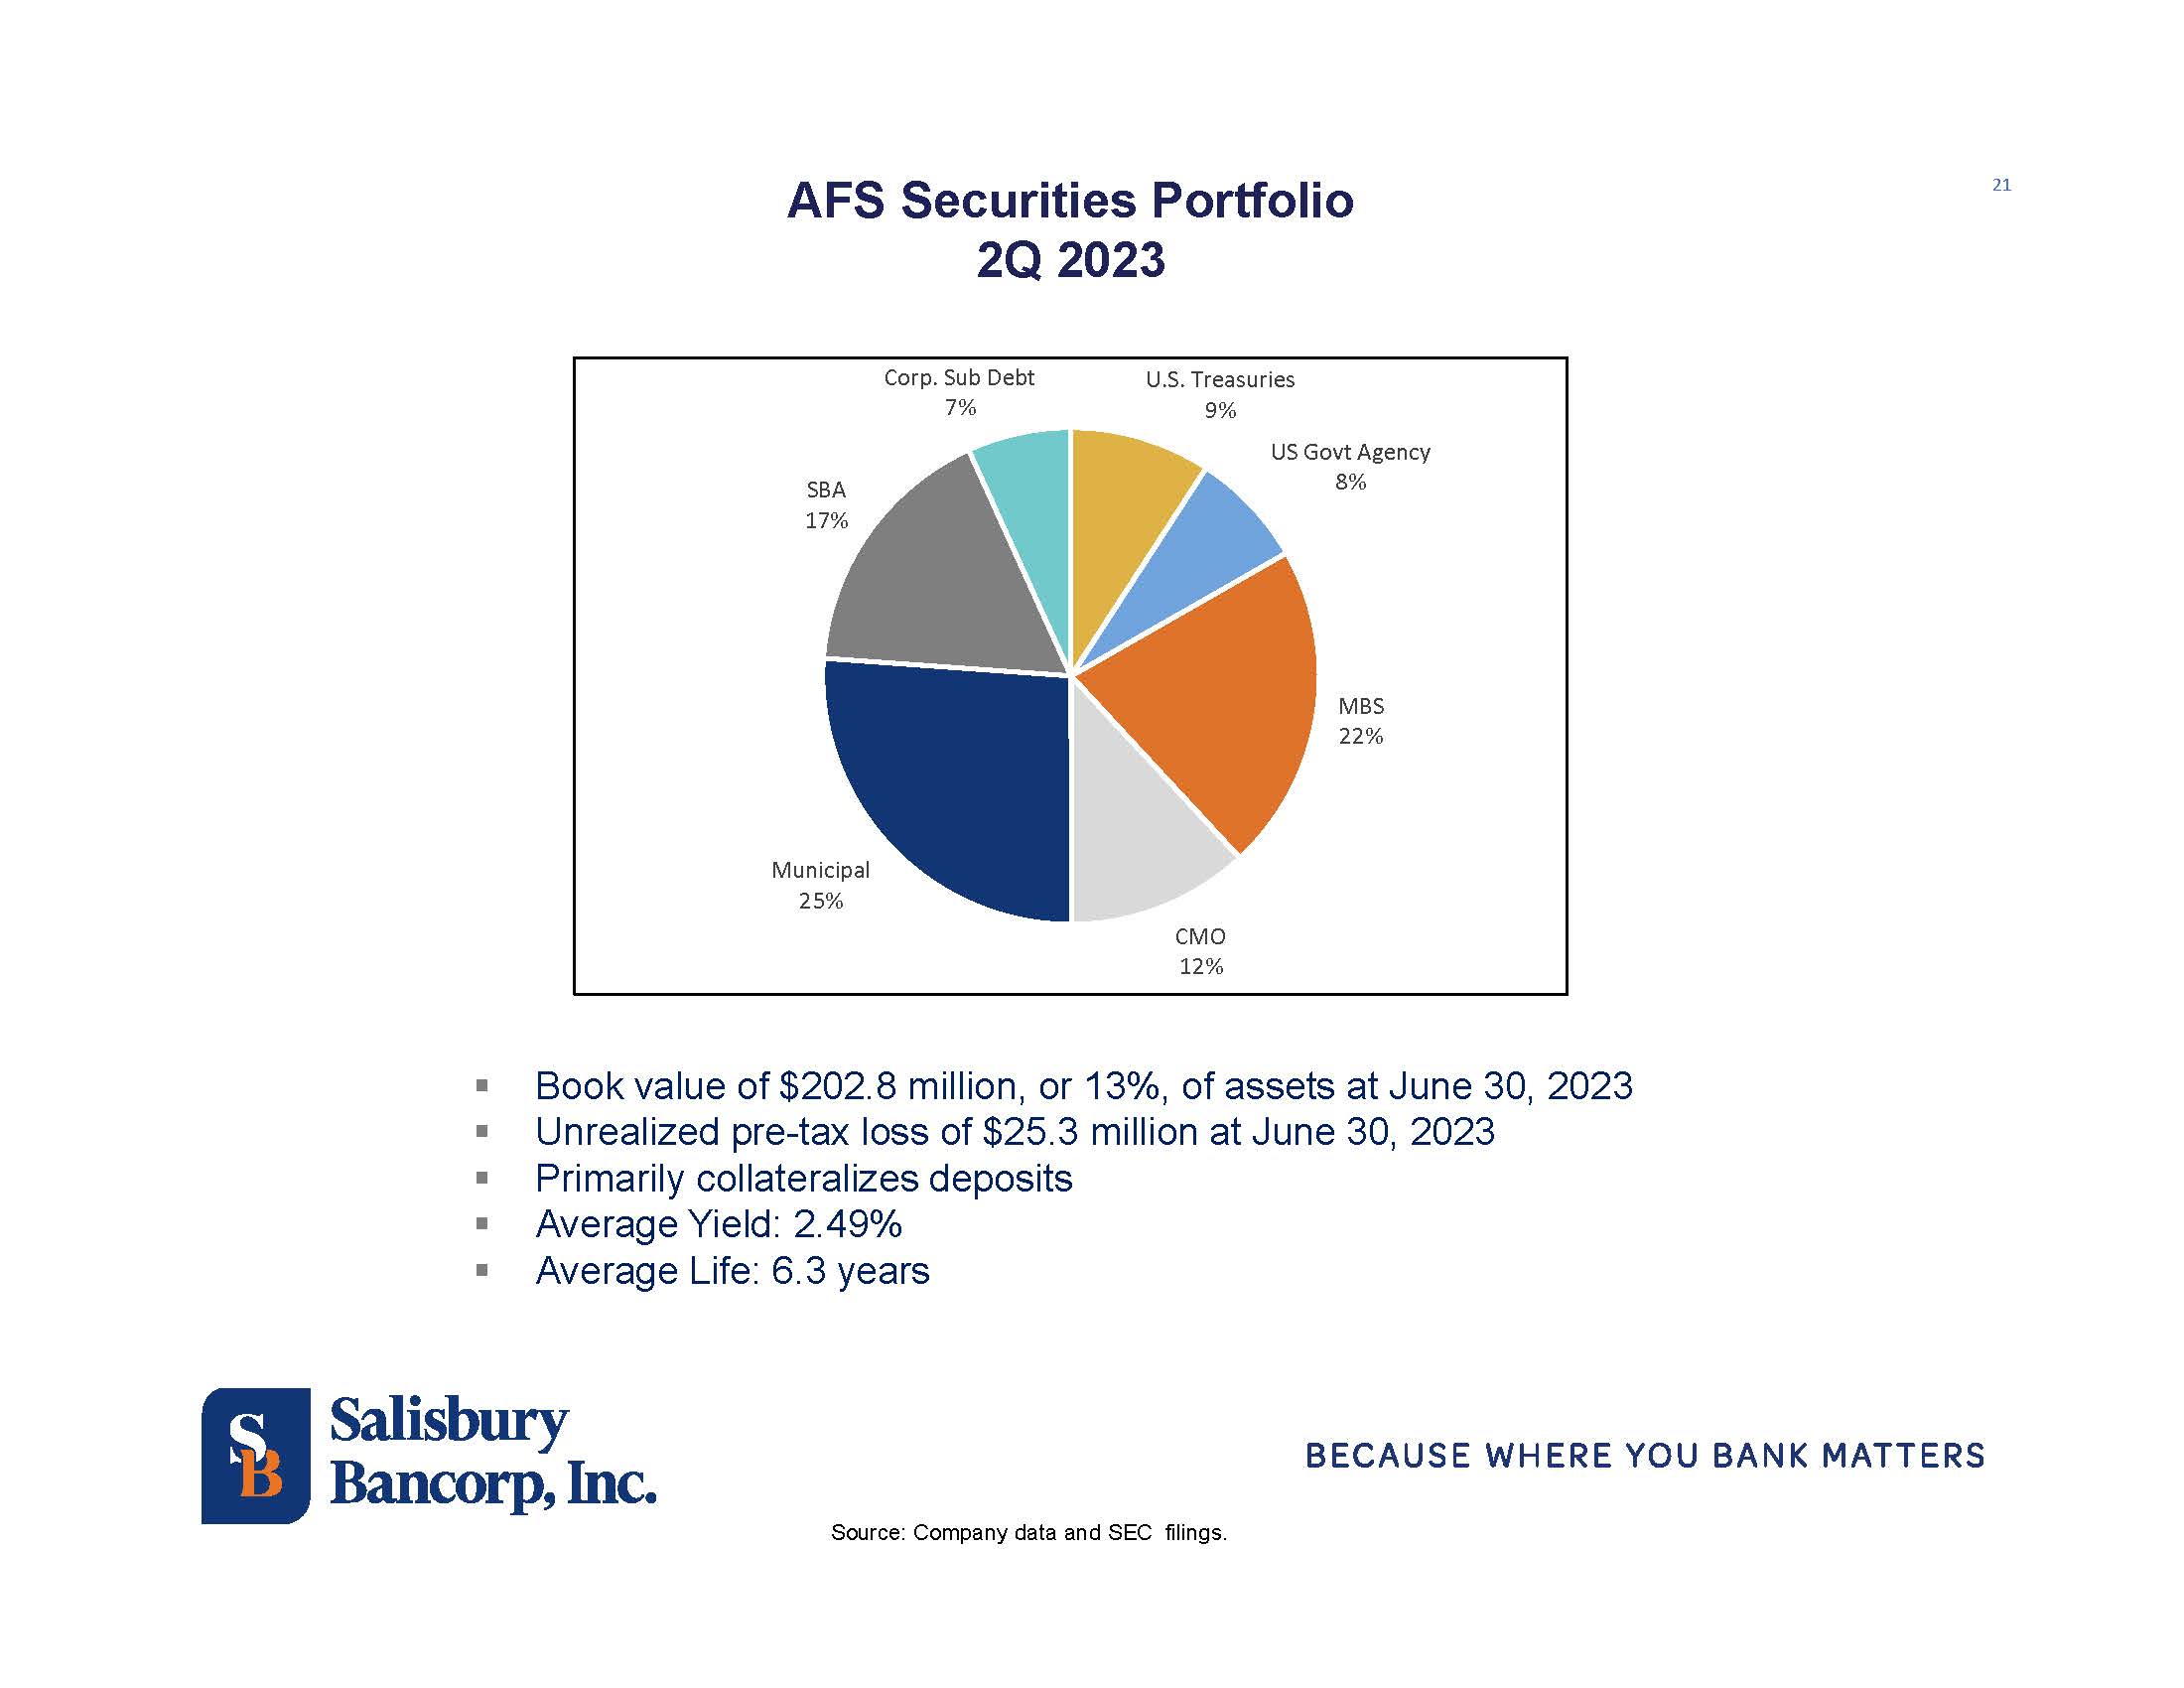
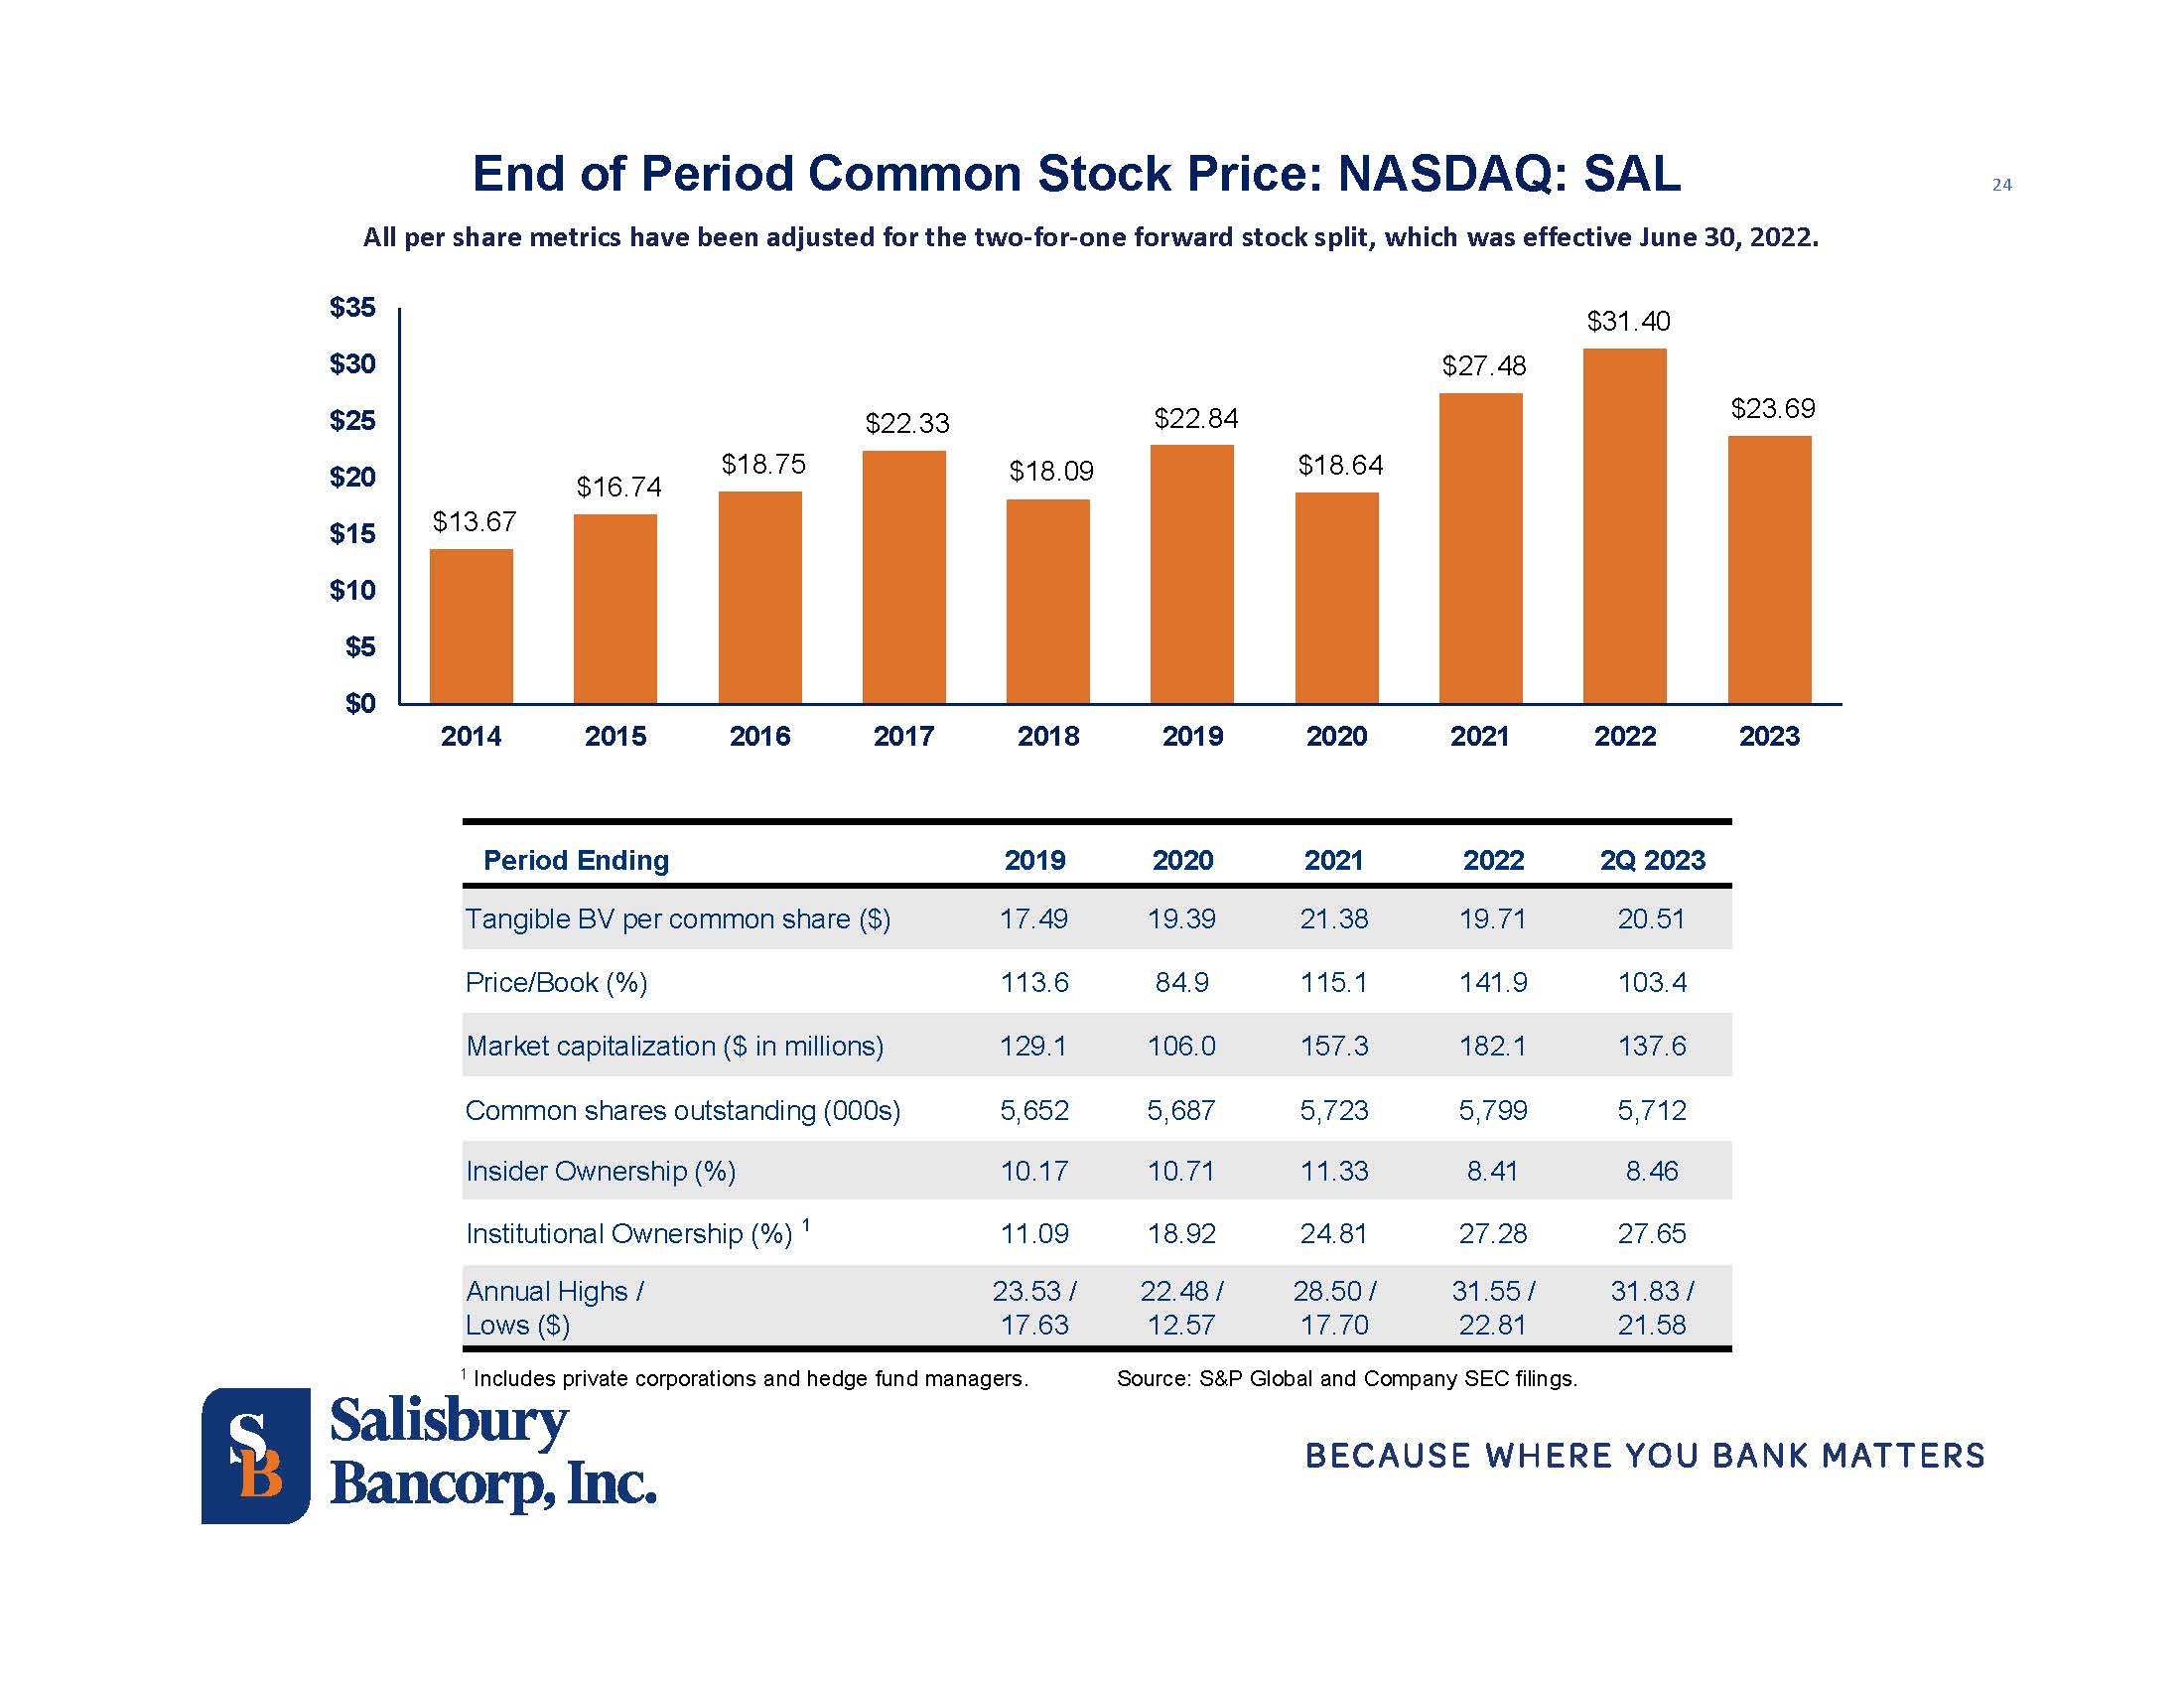
Shareholders’
equity increased $0.7 million in second quarter to $133.1 million at June 30, 2023 as net income of $3.4 million and other activity of
$0.2 million, were partially offset by unrealized losses, net of taxes, in the available-for-sale securities (“AFS”) portfolio
of $2.0 million, and common stock dividends paid of $0.9 million. The unrealized losses, net of taxes, in the AFS portfolio were $20.0
million at June 30, 2023. Book value per common share of $22.91 at June 30, 2023 increased $0.12 from first quarter 2023 and increased
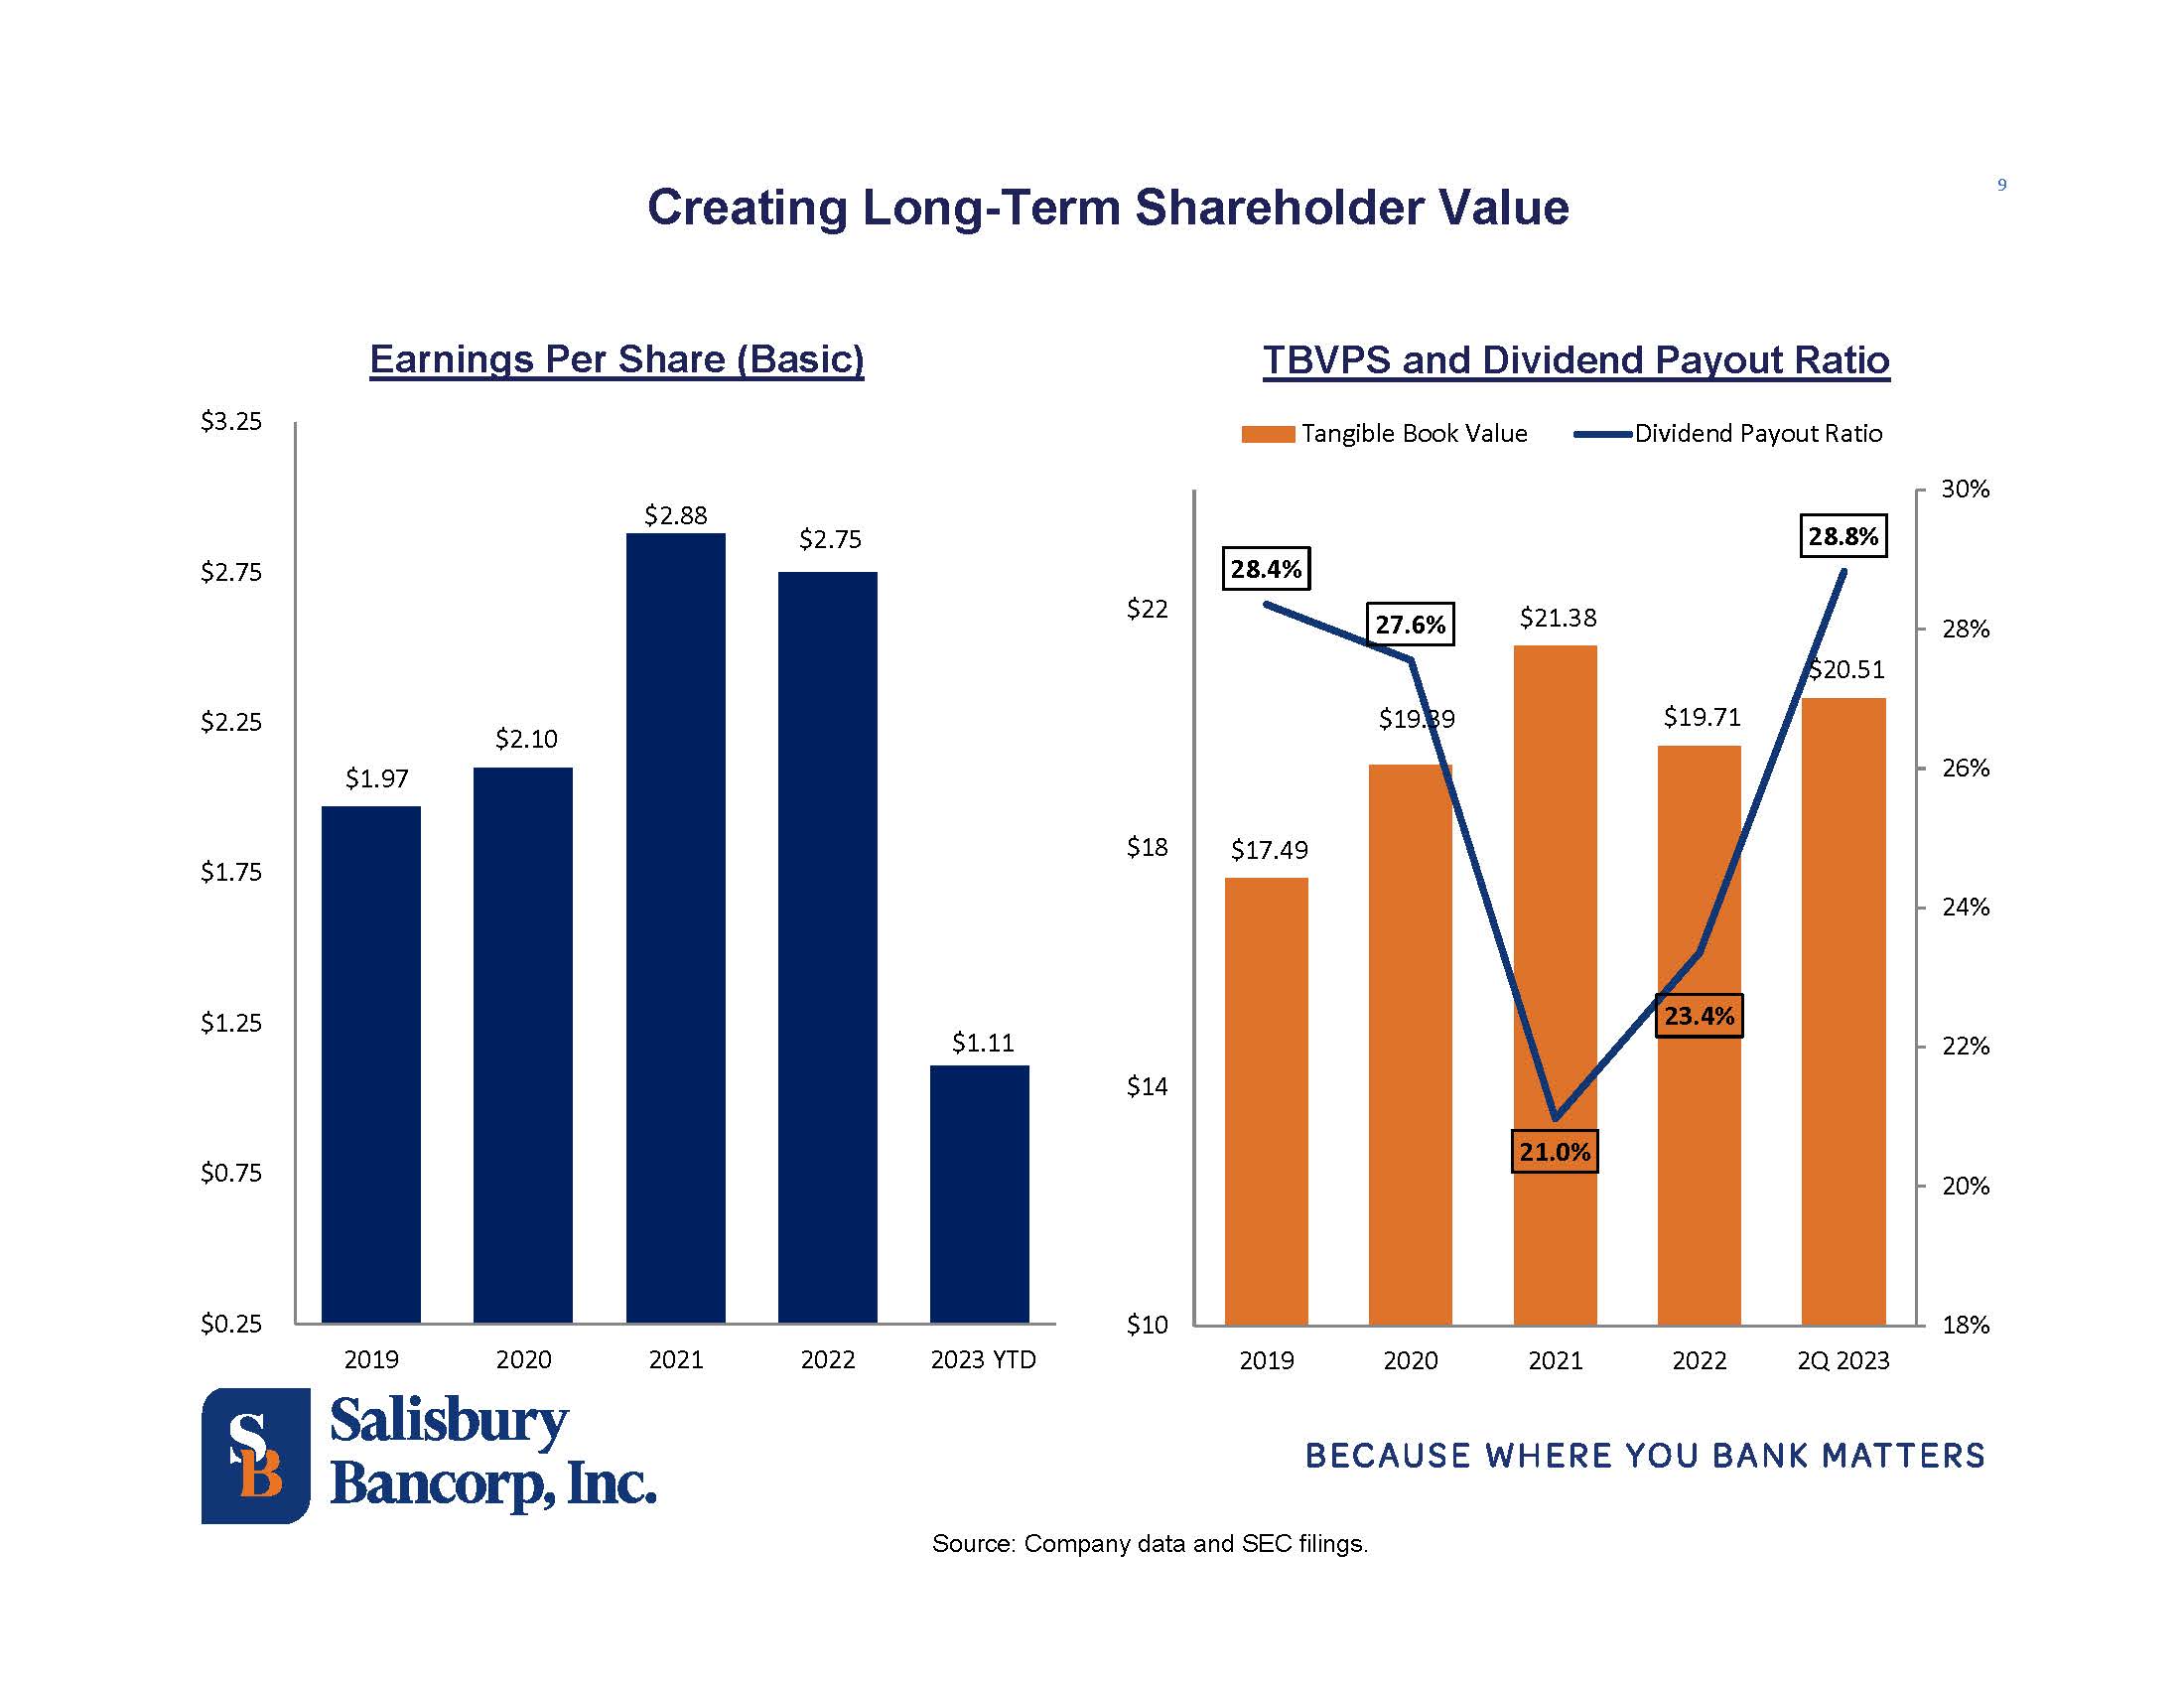
$0.90 from second quarter 2022. Tangible book value per common share of $20.51 at June 30, 2023 increased $0.13 from first quarter 2023
and increased $0.94 from second quarter 2022. At June 30, 2023, the Bank’s tangible common equity ratio, which included the unrealized
losses in the AFS portfolio noted above, was 7.71%.
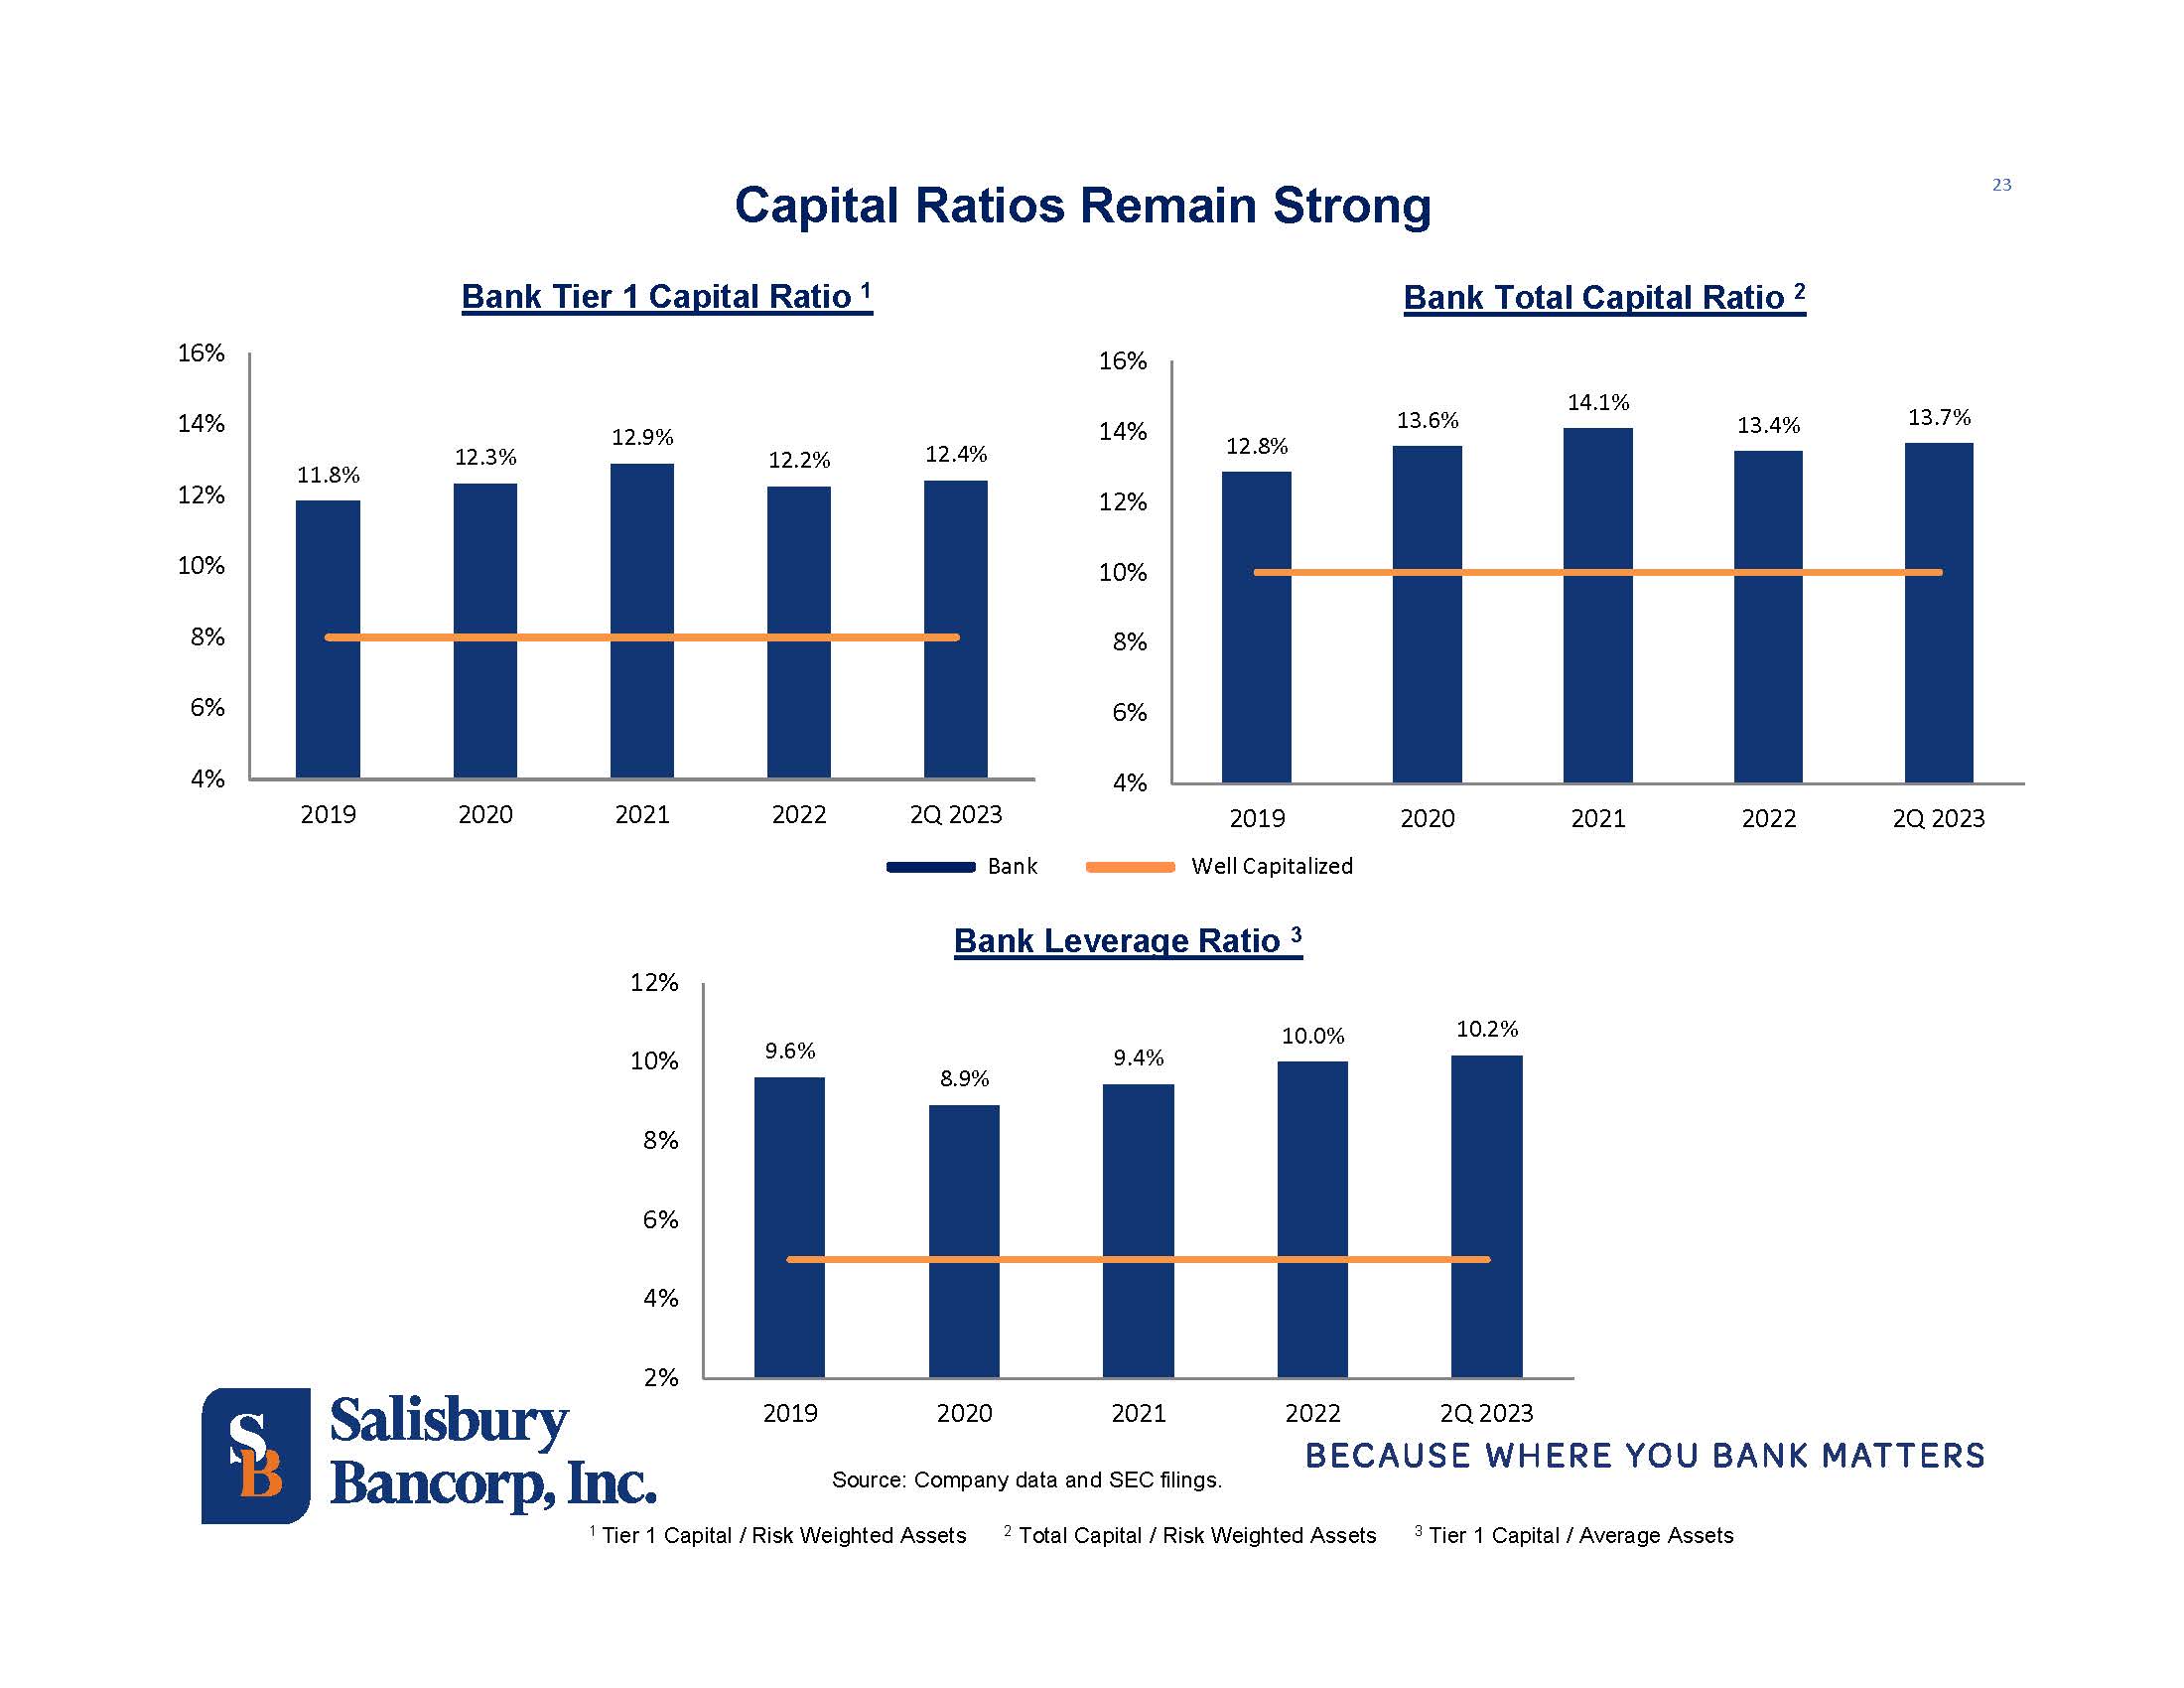
The
Bank's regulatory capital ratios remain in compliance with regulatory “well capitalized” requirements. At June 30,
2023, the Bank’s Tier 1 leverage, total risk-based capital, and common equity tier 1 capital ratios were 10.15%, 13.66%, and
12.41%, respectively, compared with regulatory “well capitalized” minimums of 5.00%, 10.00%, and 6.5%, respectively. The
unrealized losses in the AFS portfolio noted above do not affect the Bank’s regulatory capital ratios.
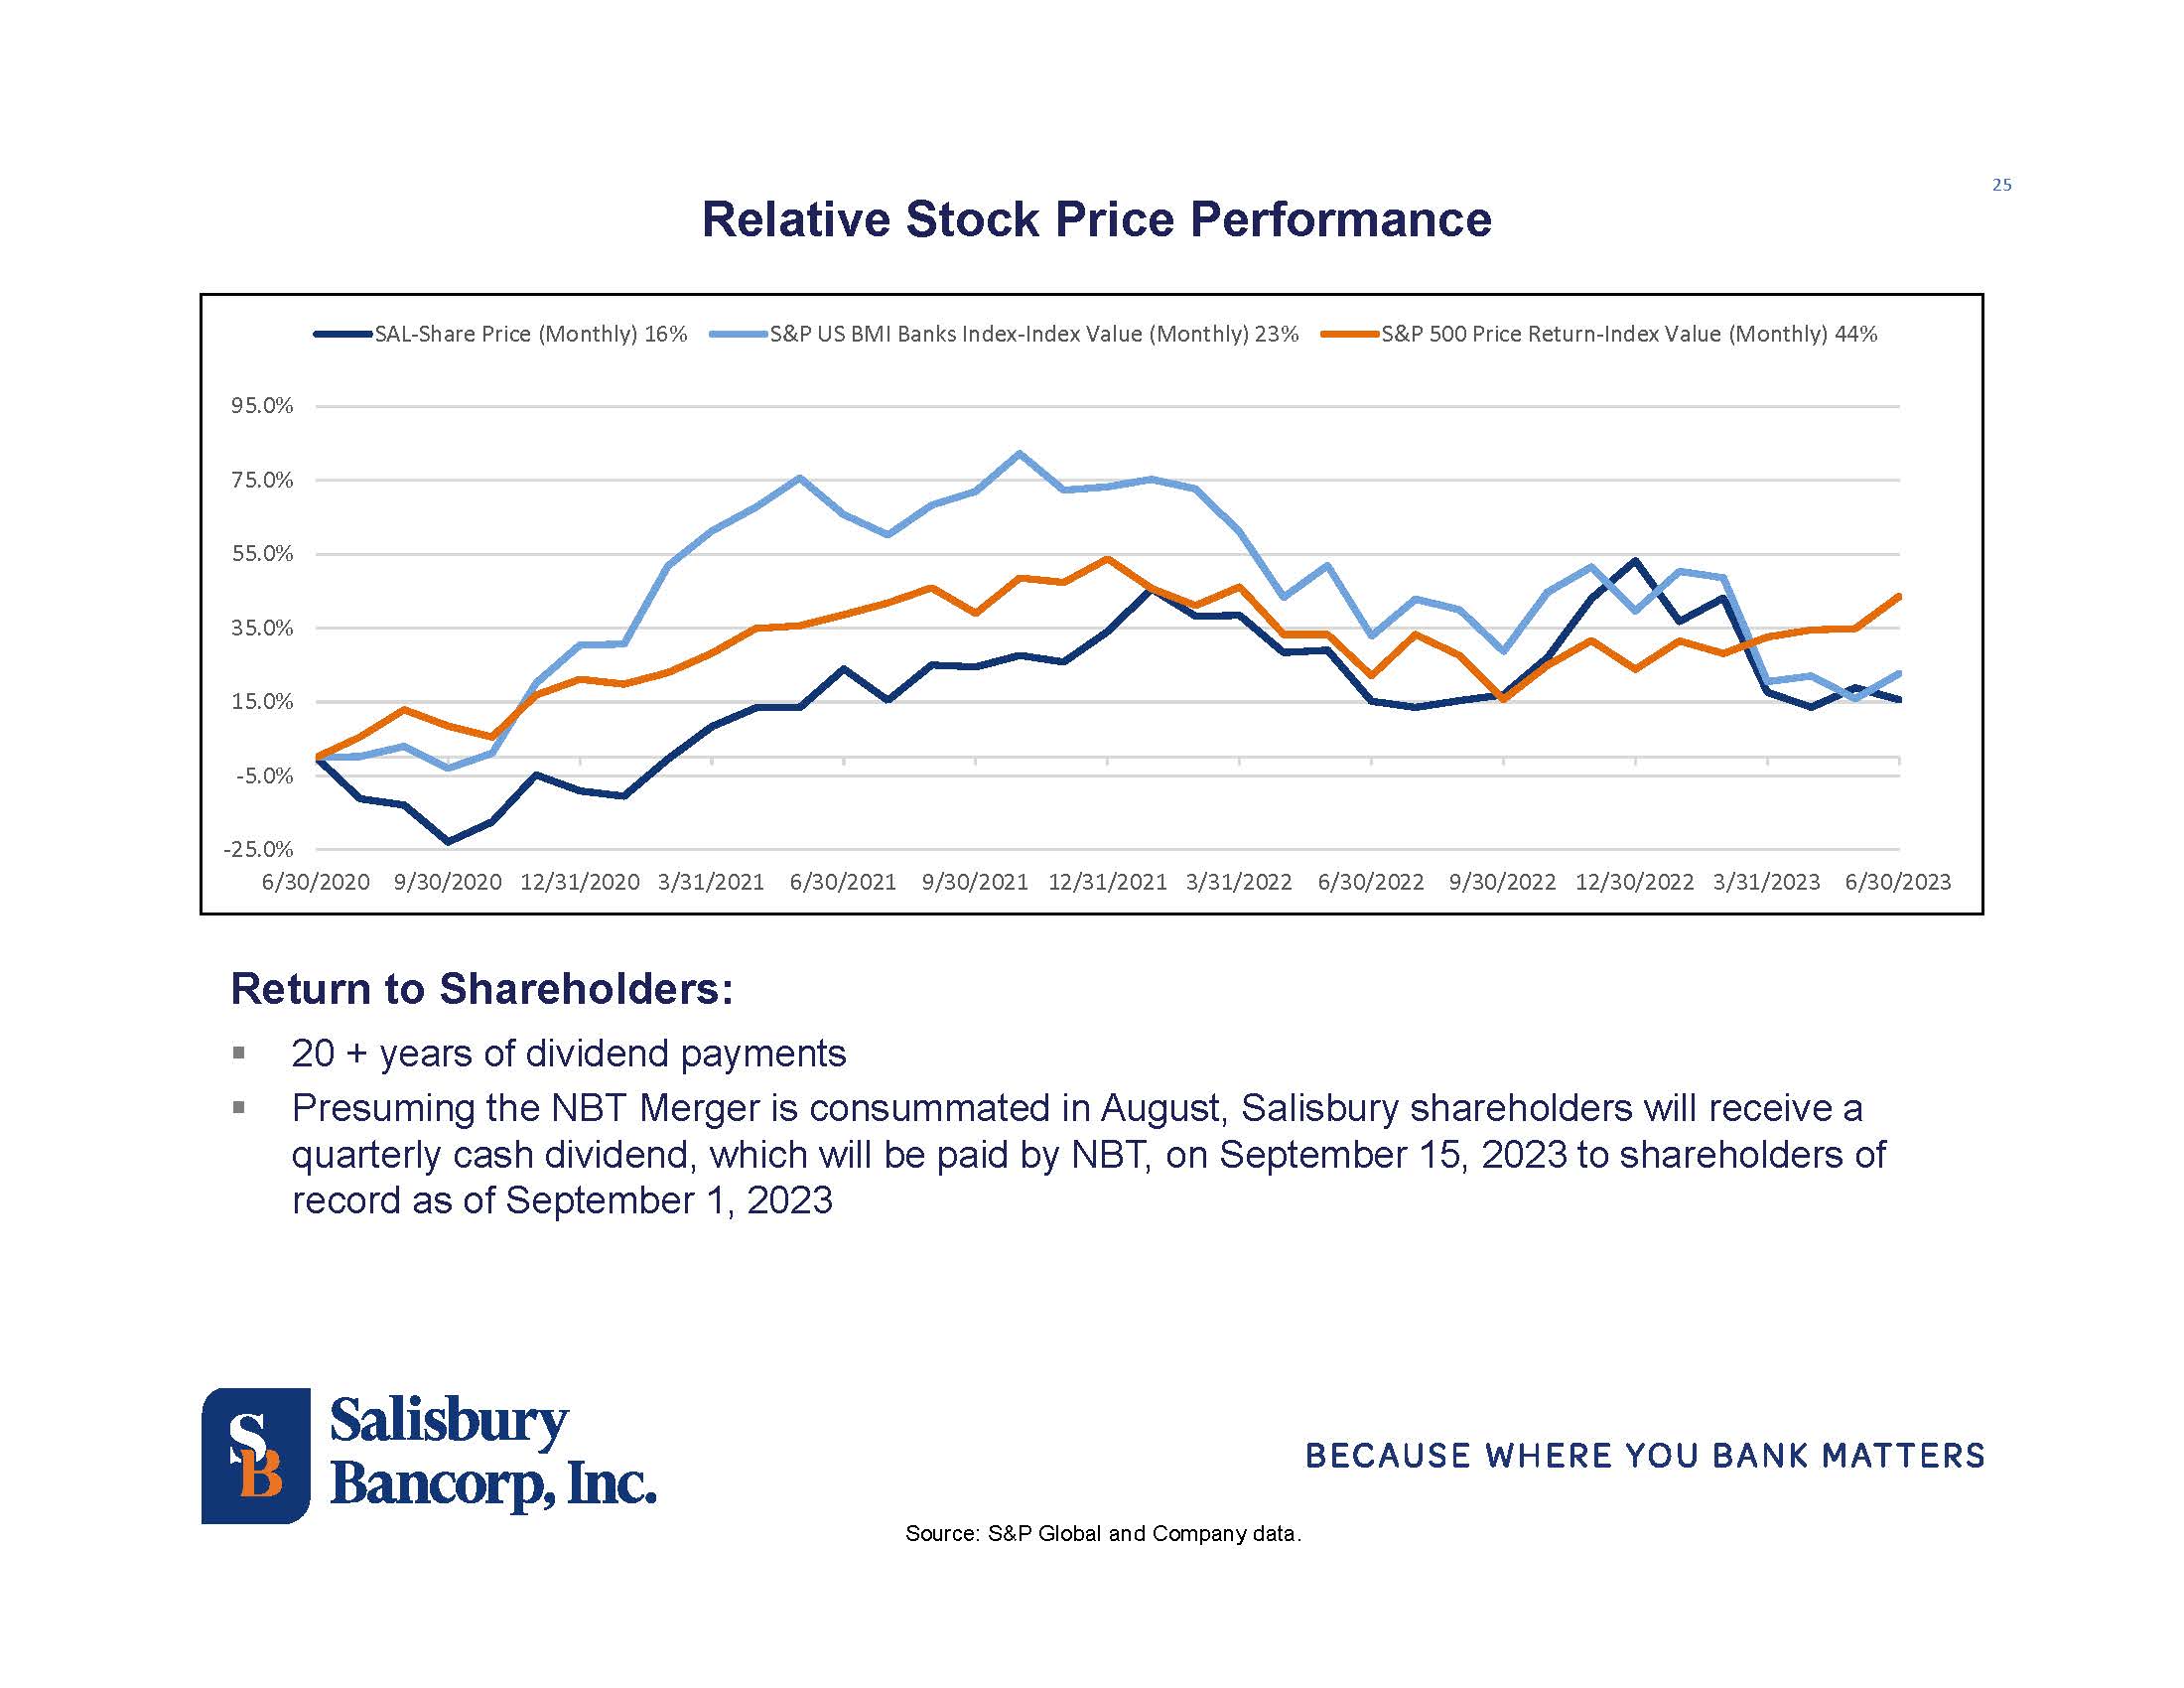
Dividend on Common Shares
Presuming the NBT Merger is consummated by such
time, Salisbury shareholders will receive a quarterly cash dividend, which will be paid by NBT, on September 15, 2023 to shareholders
of record as of September 1, 2023.
Other Matters
In July
2022, Salisbury management discovered that the Bank’s trust department terminated a trust account in May 2020 and distributed approximately
$1.0 million that should have been retained in continuance of the trust account. In March 2023, Salisbury filed an amended complaint
against the beneficiaries to recover the distributed proceeds and to reinstate the trust account. Management believes that Salisbury’s
exposure could possibly range from approximately $0.0 million to $0.4 million depending upon the amount the beneficiaries contribute
toward the reinstatement of the trust and potential insurance coverage.
Background
Salisbury
Bancorp, Inc. is the parent company of Salisbury Bank and Trust Company, a Connecticut chartered commercial bank serving the communities
of northwestern Connecticut and proximate communities in New York and Massachusetts, since 1848, through full service branches in Canaan,
Lakeville, Salisbury and Sharon, Connecticut; Great Barrington, South Egremont and Sheffield, Massachusetts; and Dover Plains, Fishkill,
Millerton, Newburgh, New Paltz, and Poughkeepsie, New York. The Bank offers a broad spectrum of consumer and business banking products
and services, as well as trust and wealth advisory services. For more information, please visit www.salisburybank.com.
Forward-Looking Statements
This news release may contain statements relating
to Salisbury’s and the Bank’s future results that are considered “forward-looking” statements within the meaning
of the Private Securities Litigation Reform Act of 1995. These statements are based on the beliefs and expectations of management as
well as the assumptions and estimates made by management using information currently available to management. Since these statements
reflect the views of management concerning future events, these statements involve risks, uncertainties and assumptions, including among
others: changes in market interest rates and general and regional economic conditions; changes in laws and regulations; changes in accounting
principles; and the quality or composition of the loan and investment portfolios, technological changes and cybersecurity matters, and
other factors that may be described in Salisbury’s quarterly reports on Form 10-Q and its annual report on Form 10-K, which are
available at the Securities and Exchange Commission’s website (www.sec.gov) and to which reference
is hereby made. Forward-looking statements made by Salisbury in this news release speak only as of the date they are made. Events or
other facts that could cause Salisbury’s actual results to differ may arise from time to time and Salisbury cannot predict all
such events and factors. Salisbury undertakes no obligation to publicly update any forward-looking statement unless as may be required
by law.
Investor presentation slides, which include a review of financial results and trends through the period ended June 30, 2023, are
available in the Shareholder Relations section of Salisbury’s website at salisburybank.com under About Us/Shareholder Relations/News
& Market Information/Presentations.
Salisbury Bancorp, Inc. and Subsidiary
CONSOLIDATED
BALANCE SHEETS (unaudited)
| (in
thousands, except share data) | |
|
June
30, 2023 |
| |
|
December
31, 2022 |
|
| ASSETS | |
| | | |
| | |
| Cash and due from banks | |
$ | 7,855 | | |
$ | 5,864 | |
| Interest
bearing demand deposits with other banks | |
| 46,202 | | |
| 44,675 | |
| Total cash and cash equivalents | |
| 54,057 | | |
| 50,539 | |
| Securities | |
| | | |
| | |
| Available-for-sale at fair value | |
| 177,477 | | |
| 187,410 | |
| Mutual funds at fair value | |
| 2,020 | | |
| 1,933 | |
| Federal Home Loan Bank of Boston
stock at cost | |
| 1,488 | | |
| 1,285 | |
| Loans receivable, net (allowance for credit losses:
$15,558 and $14,846) | |
| 1,237,511 | | |
| 1,213,671 | |
| Bank premises and equipment, net | |
| 21,268 | | |
| 22,148 | |
| Goodwill | |
| 13,815 | | |
| 13,815 | |
| Intangible assets (net of accumulated amortization:
$5,727 and $5,654) | |
| 154 | | |
| 227 | |
| Accrued interest receivable | |
| 6,546 | | |
| 6,797 | |
| Cash surrender value of life insurance policies | |
| 30,248 | | |
| 30,379 | |
| Deferred taxes | |
| 8,631 | | |
| 8,492 | |
| Other
assets | |
| 5,121 | | |
| 4,886 | |
| Total
Assets | |
$ | 1,558,336 | | |
$ | 1,541,582 | |
| LIABILITIES and SHAREHOLDERS'
EQUITY | |
| | | |
| | |
| Deposits | |
| | | |
| | |
| Demand (non-interest bearing) | |
$ | 353,794 | | |
$ | 395,994 | |
| Demand (interest bearing) | |
| 219,483 | | |
| 231,486 | |
| Money market | |
| 361,004 | | |
| 343,965 | |
| Savings and other | |
| 218,339 | | |
| 233,578 | |
| Certificates
of deposit | |
| 207,330 | | |
| 153,370 | |
| Total deposits | |
| 1,359,950 | | |
| 1,358,393 | |
| Repurchase agreements | |
| 7,492 | | |
| 7,228 | |
| Federal Home Loan Bank of Boston advances | |
| 20,000 | | |
| 10,000 | |
| Subordinated debt | |
| 24,559 | | |
| 24,531 | |
| Note payable | |
| 106 | | |
| 128 | |
| Finance lease obligations | |
| 4,189 | | |
| 4,262 | |
| Accrued
interest and other liabilities | |
| 8,975 | | |
| 8,685 | |
| Total
Liabilities | |
| 1,425,271 | | |
| 1,413,227 | |
| Shareholders' Equity | |
| | | |
| | |
| Common stock - $0.10 per share par value | |
| | | |
| | |
| Authorized: 10,000,000; | |
| | | |
| | |
| Issued: 5,807,119 and 5,798,816 | |
| | | |
| | |
| Outstanding: 5,807,119 and 5,798,816 | |
| 581 | | |
| 580 | |
| Unearned compensation – restricted stock awards | |
| (779 | ) | |
| (1,144 | ) |
| Paid-in capital | |
| 47,443 | | |
| 47,466 | |
| Retained earnings | |
| 105,846 | | |
| 102,178 | |
| Accumulated
other comprehensive loss, net | |
| (20,026 | ) | |
| (20,725 | ) |
| Total
Shareholders' Equity | |
| 133,065 | | |
| 128,355 | |
| Total
Liabilities and Shareholders' Equity | |
$ | 1,558,336 | | |
$ | 1,541,582 | |
Salisbury Bancorp, Inc. and Subsidiary
CONSOLIDATED STATEMENTS
OF INCOME (unaudited)
| | |
|
Three months ended |
| |
|
Six months ended |
|
| Periods ended June
30, (in thousands, except per share amounts) | |
|
2023 |
| |
|
2022 |
| |
|
2023 |
| |
|
2022 |
|
| Interest and dividend income | |
| | | |
| | | |
| | | |
| | |
| Interest and fees on loans | |
$ | 13,604 | | |
$ | 10,576 | | |
$ | 26,853 | | |
$ | 20,740 | |
| Interest on debt securities | |
| | | |
| | | |
| | | |
| | |
| Taxable | |
| 1,033 | | |
| 859 | | |
| 2,102 | | |
| 1,583 | |
| Tax exempt | |
| 183 | | |
| 187 | | |
| 396 | | |
| 362 | |
| Other
interest and dividends | |
| 561 | | |
| 107 | | |
| 954 | | |
| 164 | |
| Total
interest and dividend income | |
| 15,381 | | |
| 11,729 | | |
| 30,305 | | |
| 22,849 | |
| Interest expense | |
| | | |
| | | |
| | | |
| | |
| Deposits | |
| 5,296 | | |
| 577 | | |
| 8,114 | | |
| 1,055 | |
| Repurchase agreements | |
| 25 | | |
| 4 | | |
| 41 | | |
| 6 | |
| Finance lease | |
| 40 | | |
| 41 | | |
| 79 | | |
| 82 | |
| Note payable | |
| 2 | | |
| 2 | | |
| 4 | | |
| 5 | |
| Subordinated debt | |
| 233 | | |
| 233 | | |
| 466 | | |
| 466 | |
| Federal
Home Loan Bank of Boston advances | |
| 444 | | |
| — | | |
| 1,131 | | |
| 55 | |
| Total
interest expense | |
| 6,040 | | |
| 857 | | |
| 9,835 | | |
| 1,669 | |
| Net interest and dividend income | |
| 9,341 | | |
| 10,872 | | |
| 20,470 | | |
| 21,180 | |
| (Release)
provision for credit losses | |
| (403 | ) | |
| 1,100 | | |
| 521 | | |
| 1,463 | |
| Net
interest and dividend income after provision (release) for credit losses | |
| 9,744 | | |
| 9,772 | | |
| 19,949 | | |
| 19,717 | |
| Non-interest income | |
| | | |
| | | |
| | | |
| | |
| Trust and wealth advisory | |
| 1,330 | | |
| 1,293 | | |
| 2,483 | | |
| 2,533 | |
| Service charges and fees | |
| 1,251 | | |
| 1,723 | | |
| 2,485 | | |
| 2,861 | |
| Mortgage banking activities, net | |
| (151 | ) | |
| 77 | | |
| (92 | ) | |
| 432 | |
| (Losses) gains on mutual fund | |
| (14 | ) | |
| (30 | ) | |
| 5 | | |
| (72 | ) |
| (Losses) gains on securities, net | |
| (15 | ) | |
| (45 | ) | |
| (15 | ) | |
| 165 | |
| Bank-owned life insurance (“BOLI”) income | |
| 196 | | |
| 163 | | |
| 388 | | |
| 325 | |
| Gain on bank-owned life insurance | |
| 311 | | |
| 89 | | |
| 311 | | |
| 89 | |
| Other | |
| 26 | | |
| 27 | | |
| 60 | | |
| 57 | |
| Total
non-interest income | |
| 2,934 | | |
| 3,297 | | |
| 5,625 | | |
| 6,390 | |
| Non-interest expense | |
| | | |
| | | |
| | | |
| | |
| Salaries | |
| 3,625 | | |
| 3,657 | | |
| 7,346 | | |
| 7,135 | |
| Employee benefits | |
| 1,232 | | |
| 1,288 | | |
| 2,700 | | |
| 2,565 | |
| Premises and equipment | |
| 1,078 | | |
| 973 | | |
| 2,183 | | |
| 2,086 | |
| Loss on write-down and sale of assets | |
| — | | |
| — | | |
| 158 | | |
| — | |
| Information processing and services | |
| 949 | | |
| 702 | | |
| 1,781 | | |
| 1,387 | |
| Professional fees | |
| 850 | | |
| 821 | | |
| 1,795 | | |
| 1,609 | |
| Collections, OREO, and loan related | |
| 29 | | |
| 116 | | |
| 100 | | |
| 232 | |
| FDIC insurance | |
| 248 | | |
| 122 | | |
| 346 | | |
| 293 | |
| Marketing and community support | |
| 187 | | |
| 262 | | |
| 314 | | |
| 447 | |
| Amortization of intangibles | |
| 34 | | |
| 50 | | |
| 73 | | |
| 104 | |
| Other | |
| 544 | | |
| 541 | | |
| 1,106 | | |
| 1,328 | |
| Total
non-interest expense | |
| 8,776 | | |
| 8,532 | | |
| 17,902 | | |
| 17,186 | |
| Income before income taxes | |
| 3,902 | | |
| 4,537 | | |
| 7,672 | | |
| 8,921 | |
| Income
tax provision | |
| 497 | | |
| 692 | | |
| 1,249 | | |
| 1,507 | |
| Net
income | |
$ | 3,405 | | |
$ | 3,845 | | |
$ | 6,423 | | |
$ | 7,414 | |
| Net
income available to common shareholders | |
$ | 3,354 | | |
$ | 3,772 | | |
$ | 6.322 | | |
$ | 7,280 | |
| | |
| | | |
| | | |
| | | |
| | |
| Basic earnings per common share | |
$ | 0.59 | | |
$ | 0.67 | | |
$ | 1.11 | | |
$ | 1.29 | |
| Diluted earnings per common share | |
$ | 0.59 | | |
$ | 0.66 | | |
$ | 1.10 | | |
$ | 1.28 | |
| Common dividends per share | |
$ | 0.16 | | |
$ | 0.16 | | |
$ | 0.32 | | |
$ | 0.32 | |
Salisbury Bancorp, Inc. and Subsidiary
SELECTED
CONSOLIDATED FINANCIAL DATA (unaudited)
At
or for the quarters ended
(in
thousands, except per share amounts and ratios) | |
|
Q2
2023 |
|
|
|
Q1
2023 |
| |
|
Q4
2022 |
| |
|
Q3
2022 |
| |
|
Q2
2022 |
|
| Total assets | |
$ | 1,558,336 | | |
$ | 1,565,334 | | |
$ | 1,541,582 | | |
$ | 1,512,138 | | |
$ | 1,496,521 | |
| Loans receivable, net | |
| 1,237,511 | | |
| 1,234,632 | | |
| 1,213,671 | | |
| 1,176,493 | | |
| 1,135,758 | |
| Total securities | |
| 180,985 | | |
| 194,696 | | |
| 190,628 | | |
| 192,530 | | |
| 205,727 | |
| Deposits | |
| 1,359,950 | | |
| 1,293,042 | | |
| 1,358,393 | | |
| 1,325,204 | | |
| 1,316,539 | |
| FHLBB advances | |
| 20,000 | | |
| 100,000 | | |
| 10,000 | | |
| 20,000 | | |
| — | |
| Shareholders’ equity | |
| 133,065 | | |
| 132,355 | | |
| 128,355 | | |
| 123,160 | | |
| 127,303 | |
| Wealth assets under administration | |
| 1,349,827 | | |
| 1,301,162 | | |
| 1,289,918 | | |
| 1,232,272 | | |
| 1,261,244 | |
| Discretionary wealth assets under administration | |
| 638,103 | | |
| 588,414 | | |
| 561,050 | | |
| 522,109 | | |
| 546,506 | |
| Non-discretionary wealth assets under administration | |
| 711,724 | | |
| 712,748 | | |
| 728,868 | | |
| 710,163 | | |
| 714,738 | |
| Non-performing loans | |
| 1,321 | | |
| 2,241 | | |
| 2,663 | | |
| 1,860 | | |
| 4,229 | |
| Non-performing assets | |
| 1,321 | | |
| 2,241 | | |
| 2,663 | | |
| 1,860 | | |
| 4,229 | |
| Accruing loans past due 30-89 days | |
| 690 | | |
| 2,234 | | |
| 1,309 | | |
| 390 | | |
| 1,001 | |
| Net interest and dividend income | |
| 9,341 | | |
| 11,127 | | |
| 12,015 | | |
| 11,844 | | |
| 10,872 | |
| Net interest
and dividend income, tax equivalent (1) | |
| 9,510 | | |
| 11,318 | | |
| 12,221 | | |
| 12,054 | | |
| 11,061 | |
| (Release) provision for credit losses | |
| (403 | ) | |
| 924 | | |
| 525 | | |
| 695 | | |
| 1,100 | |
| Non-interest income | |
| 2,934 | | |
| 2,693 | | |
| 2,618 | | |
| 2,693 | | |
| 3,297 | |
| Non-interest expense | |
| 8,776 | | |
| 9,126 | | |
| 8,947 | | |
| 8,512 | | |
| 8,532 | |
| Income before income taxes | |
| 3,902 | | |
| 3,770 | | |
| 5,161 | | |
| 5,330 | | |
| 4,537 | |
| Income tax provision | |
| 497 | | |
| 752 | | |
| 1,037 | | |
| 994 | | |
| 692 | |
| Net income | |
| 3,405 | | |
| 3,018 | | |
| 4,124 | | |
| 4,336 | | |
| 3,845 | |
| Net income allocated to common shareholders | |
| 3,354 | | |
| 2,968 | | |
| 4,055 | | |
| 4,264 | | |
| 3,772 | |
| | |
| | | |
| | | |
| | | |
| | | |
| | |
| Per share data | |
| | | |
| | | |
| | | |
| | | |
| | |
| Basic earnings per common share | |
$ | 0.59 | | |
$ | 0.52 | | |
$ | 0.71 | | |
$ | 0.75 | | |
$ | 0.67 | |
| Diluted earnings per common share | |
| 0.59 | | |
| 0.52 | | |
| 0.71 | | |
| 0.75 | | |
| 0.66 | |
| Dividends per common share | |
| 0.16 | | |
| 0.16 | | |
| 0.16 | | |
| 0.16 | | |
| 0.16 | |
| Book value per common share | |
| 22.91 | | |
| 22.79 | | |
| 22.13 | | |
| 21.29 | | |
| 22.01 | |
| Tangible
book value per common share - Non-GAAP (2) | |
| 20.51 | | |
| 20.38 | | |
| 19.71 | | |
| 18.86 | | |
| 19.57 | |
| Common shares outstanding at end
of period (in thousands) | |
| 5,807 | | |
| 5,808 | | |
| 5,799 | | |
| 5,784 | | |
| 5,784 | |
| Weighted average common shares
outstanding, to calculate basic earnings per share (in thousands) | |
| 5,721 | | |
| 5,702 | | |
| 5,688 | | |
| 5,687 | | |
| 5,666 | |
| Weighted average common shares
outstanding, to calculate diluted earnings per share (in thousands) | |
| 5,733 | | |
| 5,714 | | |
| 5,710 | | |
| 5,713 | | |
| 5,699 | |
| | |
| | | |
| | | |
| | | |
| | | |
| | |
| Profitability ratios | |
| | | |
| | | |
| | | |
| | | |
| | |
| Net interest
margin (tax equivalent) (1) | |
| 2.50 | % | |
| 2.99 | % | |
| 3.28 | % | |
| 3.27 | % | |
| 3.15 | % |
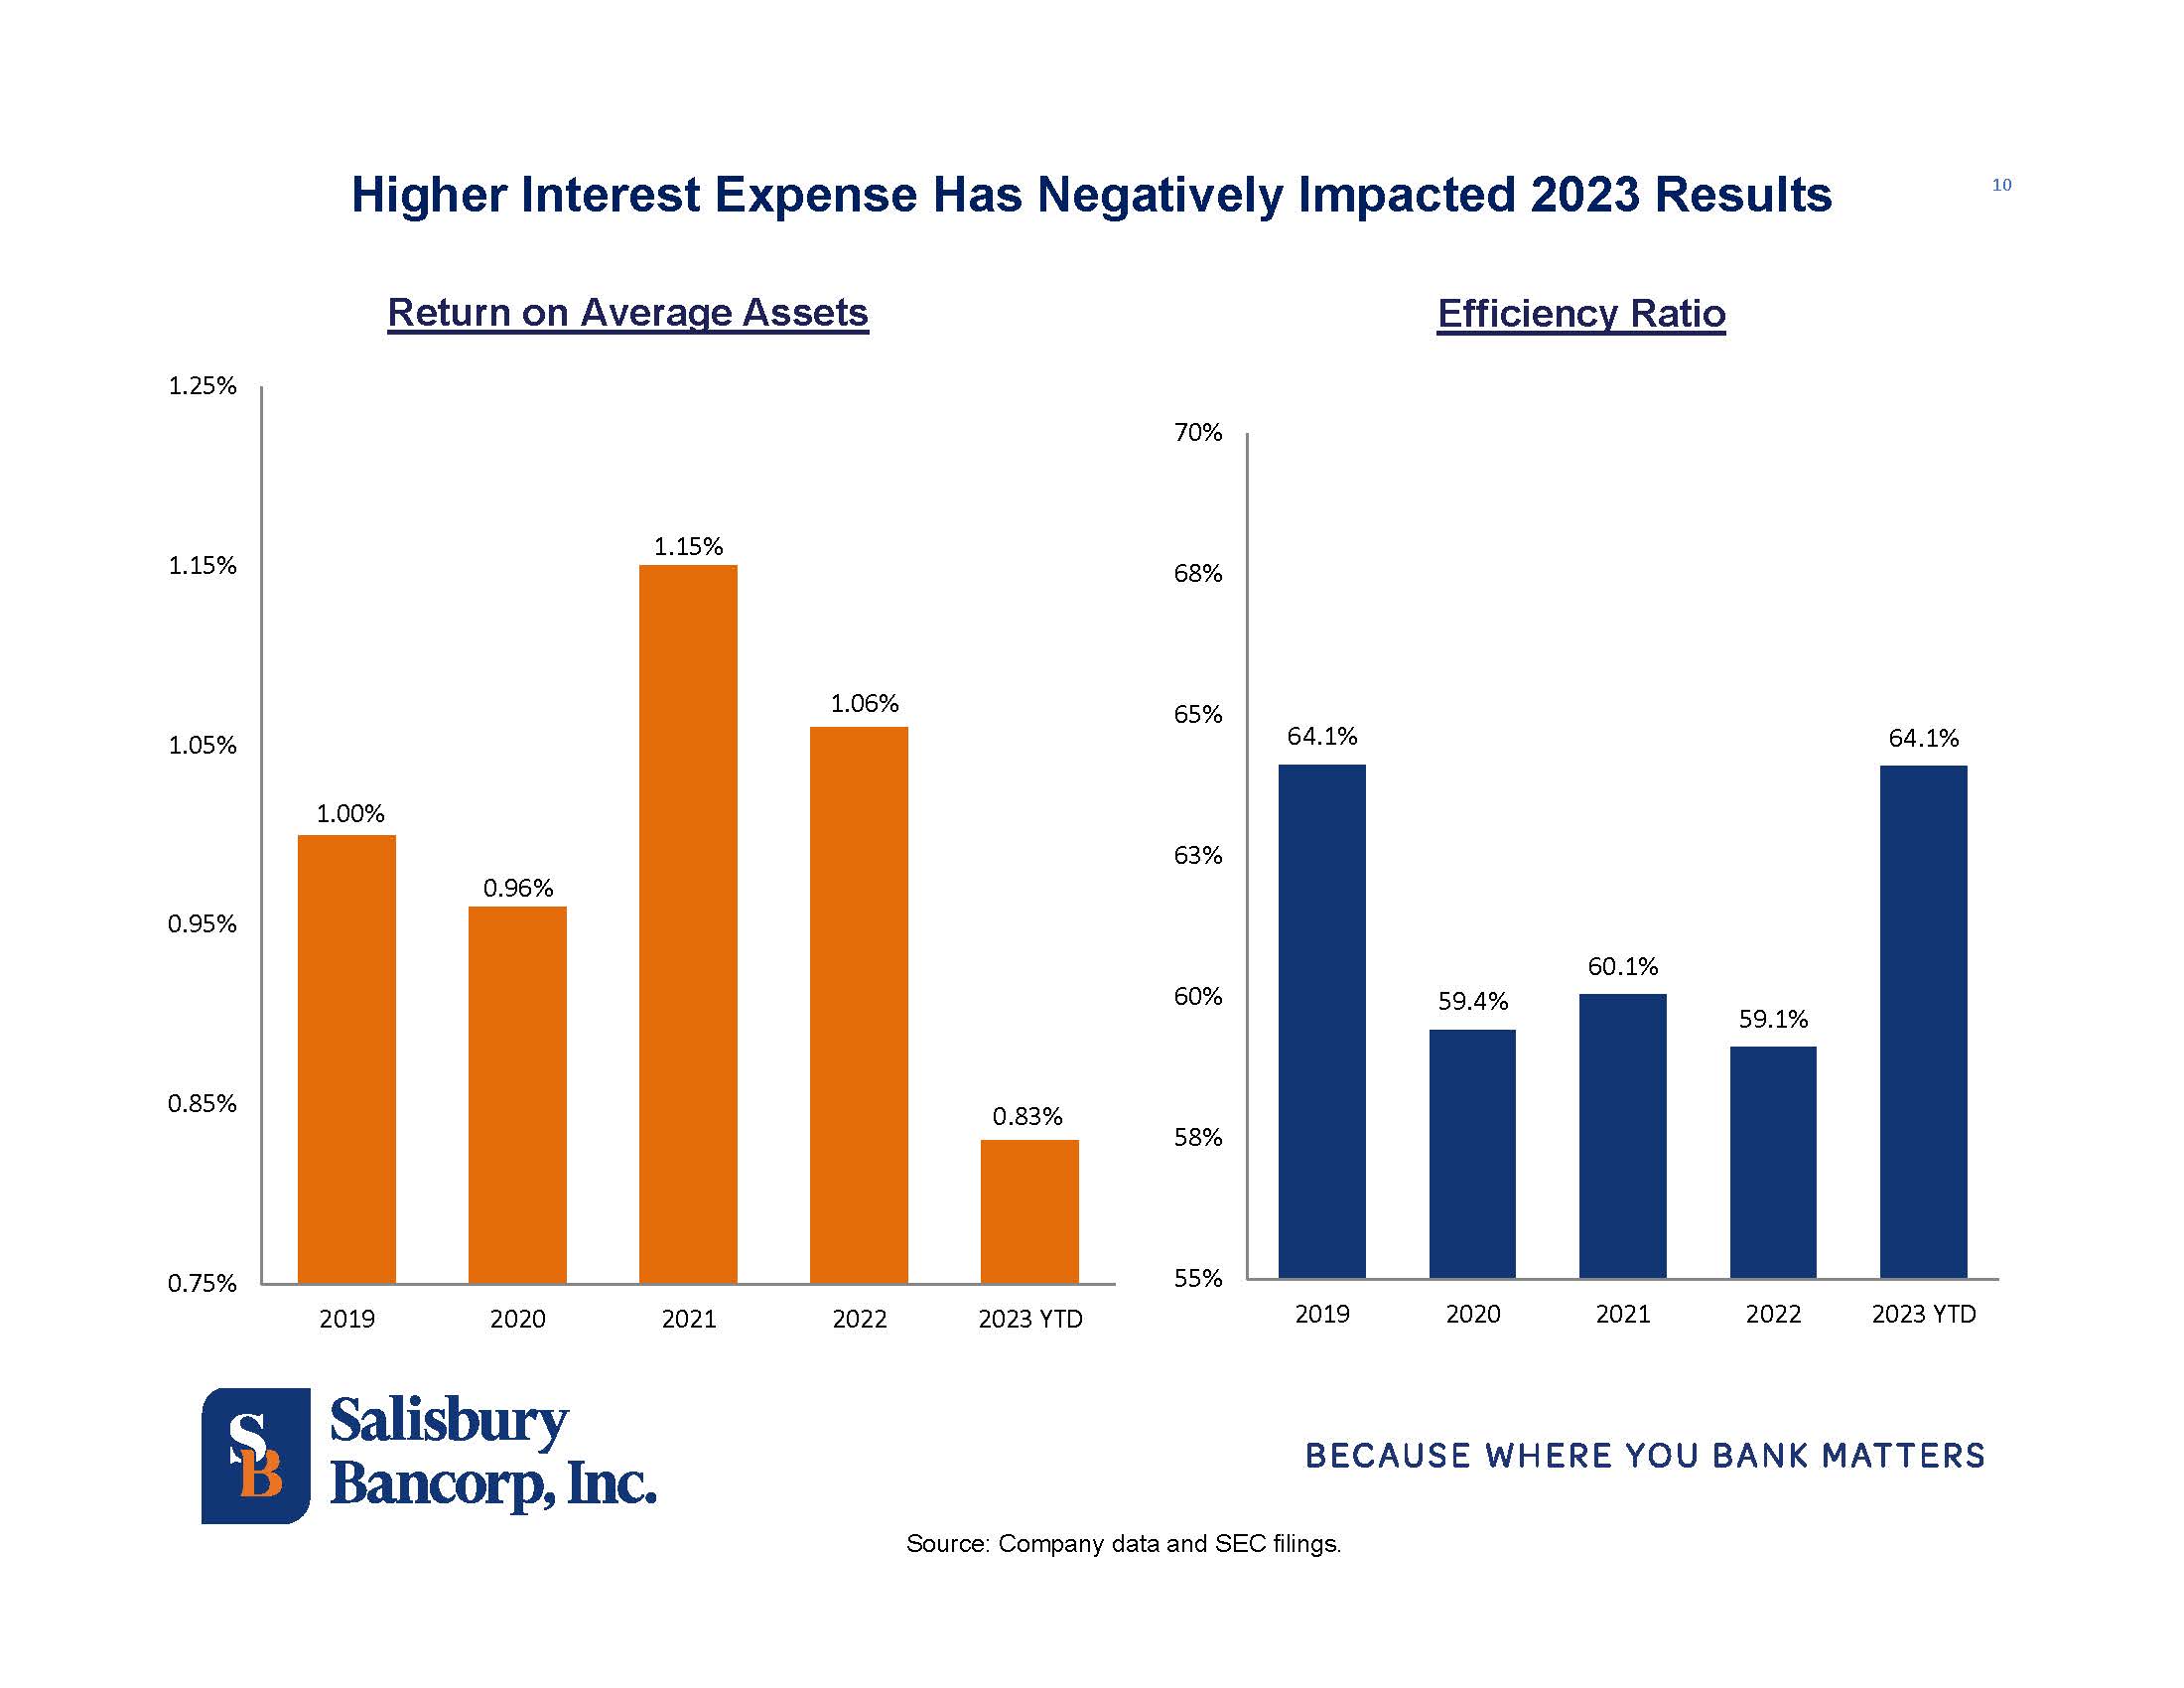
| Efficiency
ratio (2) | |
| 67.48 | | |
| 61.07 | | |
| 56.66 | | |
| 57.38 | | |
| 59.49 | |
| Effective income tax rate | |
| 12.73 | | |
| 19.95 | | |
| 20.10 | | |
| 18.65 | | |
| 15.25 | |
| Return on average assets | |
| 0.88 | | |
| 0.79 | | |
| 1.07 | | |
| 1.13 | | |
| 1.06 | |
| Return on average common shareholders’ equity | |
| 10.24 | | |
| 9.36 | | |
| 13.05 | | |
| 13.23 | | |
| 11.98 | |
| | |
| | | |
| | | |
| | | |
| | | |
| | |
| Credit quality ratios | |
| | | |
| | | |
| | | |
| | | |
| | |
| Non-performing loans to loans receivable, gross | |
| 0.11 | % | |
| 0.18 | % | |
| 0.22 | % | |
| 0.16 | % | |
| 0.37 | % |
| Accruing loans past due 30-89 days to loans receivable,
gross | |
| 0.06 | | |
| 0.18 | | |
| 0.11 | | |
| 0.03 | | |
| 0.09 | |
| Allowance for credit losses to loans receivable, gross | |
| 1.24 | | |
| 1.28 | | |
| 1.21 | | |
| 1.20 | | |
| 1.19 | |
| Allowance for credit losses to non-performing loans | |
| 1,177.8 | | |
| 714.4 | | |
| 557.5 | | |
| 770.6 | | |
| 324.0 | |
| Non-performing assets to total assets | |
| 0.08 | | |
| 0.14 | | |
| 0.17 | | |
| 0.12 | | |
| 0.28 | |
| | |
| | | |
| | | |
| | | |
| | | |
| | |
| Capital ratios | |
| | | |
| | | |
| | | |
| | | |
| | |
| Common shareholders' equity to assets | |
| 8.54 | % | |
| 8.35 | % | |
| 8.33 | % | |
| 8.14 | % | |
| 8.51 | % |
| Tangible
common shareholders' equity to tangible assets - Non-GAAP (2) | |
| 7.71 | | |
| 7.63 | | |
| 7.48 | | |
| 7.28 | | |
| 7.63 | |
| Tier 1
leverage capital (3) | |
| 10.15 | | |
| 9.98 | | |
| 9.99 | | |
| 9.83 | | |
| 10.04 | |
| Total risk-based
capital (3) | |
| 13.66 | | |
| 13.41 | | |
| 13.43 | | |
| 13.24 | | |
| 13.28 | |
| Common
equity tier 1 capital (3) | |
| 12.41 | | |
| 12.16 | | |
| 12.24 | | |
| 12.07 | | |
| 12.13 | |
| | |
| | | |
| | | |
| | | |
| | | |
| | |
(1) Adjusted to reflect
the U.S. federal statutory benefit on income derived from tax-exempt securities and loans.
(2) Refer to schedule labeled
“Supplemental Information – Non-GAAP Financial Measures”.
(3) Represents the capital ratios of the Bank.
Salisbury Bancorp,
Inc. and Subsidiary
SUPPLEMENTAL
INFORMATION – Non-GAAP Financial Measures (unaudited)
At
or for the quarters ended
(in
thousands, except per share amounts and ratios) | |
|
Q2
2023 |
|
|
|
Q1
2023 |
| |
|
Q4
2022 |
| |
|
Q3
2022 |
| |
|
Q2
2022 |
|
| Common Shareholders'
Equity | |
$ | 133,065 | | |
$ | 132,355 | | |
$ | 128,355 | | |
$ | 123,160 | | |
$ | 127,303 | |
| Less: Goodwill | |
| (13,815 | ) | |
| (13,815 | ) | |
| (13,815 | ) | |
| (13,815 | ) | |
| (13,815 | ) |
| Less: Intangible assets | |
| (154 | ) | |
| (188 | ) | |
| (227 | ) | |
| (269 | ) | |
| (314 | ) |
| Tangible
Common Shareholders' Equity | |
$ | 119,096 | | |
$ | 118,352 | | |
$ | 114,313 | | |
$ | 109,076 | | |
$ | 113,174 | |
| Total Assets | |
$ | 1,558,336 | | |
$ | 1,565,334 | | |
$ | 1,541,582 | | |
$ | 1,512,138 | | |
$ | 1,496,521 | |
| Less: Goodwill | |
| (13,815 | ) | |
| (13,815 | ) | |
| (13,815 | ) | |
| (13,815 | ) | |
| (13,815 | ) |
| Less: Intangible assets | |
| (154 | ) | |
| (188 | ) | |
| (227 | ) | |
| (269 | ) | |
| (314 | ) |
| Tangible
Total Assets | |
$ | 1,544,367 | | |
$ | 1,551,330 | | |
$ | 1,527,540 | | |
$ | 1,498,054 | | |
$ | 1,482,392 | |
| Common Shares outstanding (in thousands) | |
| 5,807 | | |
| 5,808 | | |
| 5,799 | | |
| 5,784 | | |
| 5,784 | |
| | |
| | | |
| | | |
| | | |
| | | |
| | |
| Book value per Common Share – GAAP | |
$ | 22.91 | | |
$ | 22.79 | | |
$ | 22.13 | | |
$ | 21.29 | | |
$ | 22.01 | |
| Tangible book value per Common Share - Non-GAAP | |
| 20.51 | | |
| 20.38 | | |
| 19.71 | | |
| 18.86 | | |
| 19.57 | |
| Tangible common shareholders’ equity to tangible
total assets - Non-GAAP | |
| 7.71 | % | |
| 7.63 | % | |
| 7.48 | % | |
| 7.28 | % | |
| 7.63 | % |
| Consolidated: | |
| | | |
| | | |
| | | |
| | | |
| | |
| Non-interest expense | |
$ | 8,776 | | |
$ | 9,126 | | |
$ | 8,947 | | |
$ | 8,512 | | |
$ | 8,532 | |
| Amortization of core deposit intangibles | |
| (34 | ) | |
| (39 | ) | |
| (42 | ) | |
| (46 | ) | |
| (50 | ) |
| OREO recovery | |
| — | | |
| — | | |
| — | | |
| 15 | | |
| — | |
| Merger-related costs | |
| (393 | ) | |
| (385 | ) | |
| (497 | ) | |
| — | | |
| — | |
| Fixed asset write-off | |
| — | | |
| (158 | ) | |
| — | | |
| — | | |
| — | |
| Fraud-related recovery | |
| — | | |
| — | | |
| — | | |
| — | | |
| 50 | |
| Adjusted non-interest expense | |
$ | 8,349 | | |
$ | 8,544 | | |
$ | 8,408 | | |
$ | 8,481 | | |
$ | 8,532 | |
| Net interest and dividend income, tax equivalent | |
$ | 9,511 | | |
$ | 11,318 | | |
$ | 12,221 | | |
$ | 12,054 | | |
$ | 11,061 | |
| Non-interest income | |
| 2,934 | | |
| 2,693 | | |
| 2,618 | | |
| 2,693 | | |
| 3,297 | |
| Losses (gains) on securities | |
| 29 | | |
| (20 | ) | |
| 1 | | |
| 47 | | |
| 75 | |
| BOLI proceeds receivable | |
| (311 | ) | |
| — | | |
| — | | |
| — | | |
| (89 | ) |
| Loss (gains) on sale of loans | |
| 209 | | |
| — | | |
| — | | |
| (15 | ) | |
| — | |
| Adjusted revenue | |
$ | 12,372 | | |
$ | 13,991 | | |
$ | 14,840 | | |
$ | 14,779 | | |
$ | 14,344 | |
| Efficiency
Ratio – Non-GAAP (1) | |
| 67.48 | % | |
| 61.07 | % | |
| 56.66 | % | |
| 57.38 | % | |
| 59.49 | % |
| | |
| | | |
| | | |
| | | |
| | | |
| | |
(1) Excluding revenue and expenses associated with trust
& wealth advisory, the efficiency ratios would be: Q2: 2023: 66.19%; Q1 2023: 59.08%; Q4 2022: 54.64%; Q3 2022: 55.28%; Q2 2022: 57.21%.
Salisbury Bancorp,
Inc. and Subsidiary
SUPPLEMENTAL
INFORMATION – Net Interest and Dividend Income (unaudited)
| At or for the quarters ended | |
Average
Balance | |
Income
/ Expense | |
Average
Yield / Rate |
| (dollars in thousands) | Q2 2023 |
| Q1 2023 |
| Q2 2022 |
| Q2 2023 |
| Q1 2023 |
| Q2 2022 |
| Q2 2023 |
| Q1 2023 |
| Q2 2022 |
|
| Loans (a)(d) | |
$ | 1,241,813 | | |
$ | 1,236,778 | | |
$ | 1,112,120 | | |
$ | 13,709 | | |
$ | 13,367 | | |
$ | 10,693 | | |
| 4.38 | % | |
| 4.29 | % | |
| 3.81 | % |
| Securities (c)(d) | |
| 207,885 | | |
| 214,246 | | |
| 225,458 | | |
| 1,279 | | |
| 1,353 | | |
| 1,117 | | |
| 2.46 | | |
| 2.53 | | |
| 1.98 | |
| FHLBB stock | |
| 2,771 | | |
| 3,436 | | |
| 1,221 | | |
| 64 | | |
| 19 | | |
| 10 | | |
| 9.21 | | |
| 2.29 | | |
| 3.20 | |
| Short
term funds (b) | |
| 47,733 | | |
| 40,689 | | |
| 54,553 | | |
| 498 | | |
| 375 | | |
| 98 | | |
| 4.18 | | |
| 3.72 | | |
| 0.73 | |
| Total interest-earning assets | |
| 1,500,202 | | |
| 1,495,149 | | |
| 1,393,352 | | |
| 15,550 | | |
| 15,114 | | |
| 11,918 | | |
| 4.12 | | |
| 4.02 | | |
| 3.40 | |
| Other
assets | |
| 53,758 | | |
| 55,022 | | |
| 61,790 | | |
| | | |
| | | |
| | | |
| | | |
| | | |
| | |
| Total
assets | |
$ | 1,553,960 | | |
$ | 1,550,171 | | |
$ | 1,455,142 | | |
| | | |
| | | |
| | | |
| | | |
| | | |
| | |
| Interest-bearing demand deposits | |
$ | 215,746 | | |
$ | 223,742 | | |
$ | 229,625 | | |
| 158 | | |
| 119 | | |
| 108 | | |
| 0.29 | | |
| 0.22 | | |
| 0.19 | |
| Money market accounts | |
| 342,555 | | |
| 320,015 | | |
| 299,870 | | |
| 2,786 | | |
| 1,270 | | |
| 156 | | |
| 3.26 | | |
| 1.61 | | |
| 0.21 | |
| Savings and other | |
| 228,031 | | |
| 232,162 | | |
| 236,728 | | |
| 727 | | |
| 402 | | |
| 97 | | |
| 1.28 | | |
| 0.70 | | |
| 0.16 | |
| Certificates of
deposit | |
| 196,416 | | |
| 161,300 | | |
| 137,034 | | |
| 1,625 | | |
| 1,027 | | |
| 216 | | |
| 3.32 | | |
| 2.58 | | |
| 0.63 | |
| Total interest-bearing deposits | |
| 982,748 | | |
| 937,219 | | |
| 903,257 | | |
| 5,296 | | |
| 2,818 | | |
| 577 | | |
| 2.16 | | |
| 1.22 | | |
| 0.26 | |
| Repurchase agreements | |
| 5,101 | | |
| 3,961 | | |
| 10,216 | | |
| 25 | | |
| 16 | | |
| 4 | | |
| 1.98 | | |
| 1.65 | | |
| 0.15 | |
| Finance lease | |
| 5,354 | | |
| 5,397 | | |
| 5,283 | | |
| 40 | | |
| 40 | | |
| 41 | | |
| 2.96 | | |
| 2.96 | | |
| 3.09 | |
| Note payable | |
| 110 | | |
| 121 | | |
| 153 | | |
| 2 | | |
| 2 | | |
| 2 | | |
| 6.19 | | |
| 6.17 | | |
| 6.13 | |
| Subordinated debt (f) | |
| 24,551 | | |
| 24,536 | | |
| 24,494 | | |
| 233 | | |
| 233 | | |
| 233 | | |
| 3.80 | | |
| 3.80 | | |
| 3.80 | |
| FHLBB
advances | |
| 36,758 | | |
| 57,056 | | |
| — | | |
| 444 | | |
| 687 | | |
| — | | |
| 4.78 | | |
| 4.82 | | |
| — | |
| Total interest-bearing liabilities | |
| 1,054,622 | | |
| 1,028,290 | | |
| 943,403 | | |
| 6,040 | | |
| 3,796 | | |
| 857 | | |
| 2.29 | | |
| 1.49 | | |
| 0.36 | |
| Demand deposits | |
| 357,690 | | |
| 382,601 | | |
| 376,694 | | |
| | | |
| | | |
| | | |
| | | |
| | | |
| | |
| Other liabilities | |
| 8,268 | | |
| 8,427 | | |
| 6,258 | | |
| | | |
| | | |
| | | |
| | | |
| | | |
| | |
| Shareholders’
equity | |
| 133,380 | | |
| 130,853 | | |
| 128,787 | | |
| | | |
| | | |
| | | |
| | | |
| | | |
| | |
| Total
liabilities & shareholders’ equity | |
$ | 1,553,960 | | |
$ | 1,550,171 | | |
$ | 1,455,142 | | |
| | | |
| | | |
| | | |
| | | |
| | | |
| | |
| Net interest income | |
| | | |
| | | |
| | | |
$ | 9,510 | | |
$ | 11,318 | | |
$ | 11,061 | | |
| | | |
| | | |
| | |
| Spread on interest-bearing funds | |
| | | |
| | | |
| | | |
| | | |
| | | |
| | | |
| 1.85 | | |
| 2.54 | | |
| 3.03 | |
| Net
interest margin (e) | |
| | | |
| | | |
| | | |
| | | |
| | | |
| | | |
| 2.50 | | |
| 2.99 | | |
| 3.15 | |
| (a) | Includes non-accrual loans. |
| (b) | Includes interest-bearing deposits in other
banks and federal funds sold. |
| (c) | Average balances of securities are based on
amortized cost. |
| (d) | Includes tax exempt income benefit of $0.2
million, $0.2 million and $0.2 million, respectively, for Q2 2023, Q1 2023 and Q2 2022 on tax-exempt securities and loans whose income
and yields are calculated on a tax-equivalent basis. The income benefit reflected the U.S. federal statutory tax rate of 21.0% for 2023
and 2022. |
| (e) | Net interest income divided by average interest-earning assets. |
| (f) | Net of issuance costs. |
Salisbury Bancorp,
Inc. and Subsidiary
SUPPLEMENTAL INFORMATION
– Net Interest and Dividend Income (unaudited)
| Six months ended June
30, | |
Average
Balance | |
Income
/ Expense | |
Average
Yield / Rate |
| (dollars in thousands) | |
2023 | |
2022 | |
2023 | |
2022 | |
2023 | |
2022 |
| Loans (a)(d) | |
$ | 1,239,309 | | |
$ | 1,095,955 | | |
$ | 27,075 | | |
$ | 20,971 | | |
| 4.34 | % | |
| 3.80 | % |
| Securities (c)(d) | |
| 211,048 | | |
| 216,847 | | |
| 2,632 | | |
| 2,079 | | |
| 2.49 | | |
| 1.92 | |
| FHLBB stock | |
| 3,101 | | |
| 1,327 | | |
| 83 | | |
| 17 | | |
| 5.40 | | |
| 2.58 | |
| Short
term funds (b) | |
| 44,231 | | |
| 88,813 | | |
| 872 | | |
| 146 | | |
| 3.97 | | |
| 0.33 | |
| Total earning assets | |
| 1,497,689 | | |
| 1,402,942 | | |
| 30,662 | | |
| 23,213 | | |
| 4.07 | | |
| 3.29 | |
| Other
assets | |
| 54,386 | | |
| 68,256 | | |
| | | |
| | | |
| | | |
| | |
| Total
assets | |
$ | 1,552,075 | | |
$ | 1,471,198 | | |
| | | |
| | | |
| | | |
| | |
| Interest-bearing demand deposits | |
$ | 219,722 | | |
$ | 231,037 | | |
| 277 | | |
| 207 | | |
| 0.25 | | |
| 0.18 | |
| Money market accounts | |
| 331,348 | | |
| 310,475 | | |
| 4,056 | | |
| 283 | | |
| 2.47 | | |
| 0.18 | |
| Savings and other | |
| 230,085 | | |
| 234,920 | | |
| 1,129 | | |
| 160 | | |
| 0.99 | | |
| 0.14 | |
| Certificates
of deposit | |
| 178,954 | | |
| 134,063 | | |
| 2,652 | | |
| 405 | | |
| 2.99 | | |
| 0.61 | |
| Total interest-bearing deposits | |
| 960,109 | | |
| 910,495 | | |
| 8,114 | | |
| 1,055 | | |
| 1.70 | | |
| 0.23 | |
| Repurchase agreements | |
| 4,533 | | |
| 8,689 | | |
| 41 | | |
| 6 | | |
| 1.84 | | |
| 0.15 | |
| Finance lease | |
| 5,376 | | |
| 5,190 | | |
| 79 | | |
| 82 | | |
| 2.96 | | |
| 3.16 | |
| Note payable | |
| 115 | | |
| 158 | | |
| 4 | | |
| 5 | | |
| 6.19 | | |
| 6.13 | |
| Subordinated Debt (f) | |
| 24,545 | | |
| 24,488 | | |
| 466 | | |
| 466 | | |
| 3.80 | | |
| 3.81 | |
| FHLBB
advances | |
| 46,851 | | |
| 1,479 | | |
| 1,131 | | |
| 55 | | |
| 4.80 | | |
| 7.46 | |
| Total interest-bearing liabilities | |
| 1,041,529 | | |
| 950,499 | | |
| 9,835 | | |
| 1,669 | | |
| 1.90 | | |
| 0.35 | |
| Demand deposits | |
| 370,057 | | |
| 381,731 | | |
| | | |
| | | |
| | | |
| | |
| Other liabilities | |
| 8,366 | | |
| 6,675 | | |
| | | |
| | | |
| | | |
| | |
| Shareholders’
equity | |
| 132,123 | | |
| 132,293 | | |
| | | |
| | | |
| | | |
| | |
| Total
liabilities & shareholders’ equity | |
$ | 1,552,075 | | |
$ | 1,471,198 | | |
| | | |
| | | |
| | | |
| | |
| Net interest income | |
| | | |
| | | |
$ | 20,827 | | |
$ | 21,544 | | |
| | | |
| | |
| Spread on interest-bearing funds | |
| | | |
| | | |
| | | |
| | | |
| 2.20 | | |
| 2.94 | |
| Net
interest margin (e) | |
| | | |
| | | |
| | | |
| | | |
| 2.75 | | |
| 3.05 | |
| (a) | Includes non-accrual loans. |
| (b) | Includes interest-bearing deposits in other
banks and federal funds sold. |
| (c) | Average balances of securities are based on
historical cost. |
| (d) | Includes tax exempt income benefit
of $0.4 million and $0.4 million, respectively for 2023 and 2022 on tax-exempt securities and loans
whose income and yields are calculated on a tax-equivalent basis. The income benefit reflected the U.S. federal statutory tax rate of
21.0% for 2023 and 2022. |
| (e) | Net interest income divided by average interest-earning assets. |
| (f) | Net of issuance costs. |
Exhibit 99.2


v3.23.2
| X |
- DefinitionBoolean flag that is true when the XBRL content amends previously-filed or accepted submission.
| Name: |
dei_AmendmentFlag |
| Namespace Prefix: |
dei_ |
| Data Type: |
xbrli:booleanItemType |
| Balance Type: |
na |
| Period Type: |
duration |
|
| X |
- DefinitionFor the EDGAR submission types of Form 8-K: the date of the report, the date of the earliest event reported; for the EDGAR submission types of Form N-1A: the filing date; for all other submission types: the end of the reporting or transition period. The format of the date is YYYY-MM-DD.
| Name: |
dei_DocumentPeriodEndDate |
| Namespace Prefix: |
dei_ |
| Data Type: |
xbrli:dateItemType |
| Balance Type: |
na |
| Period Type: |
duration |
|
| X |
- DefinitionThe type of document being provided (such as 10-K, 10-Q, 485BPOS, etc). The document type is limited to the same value as the supporting SEC submission type, or the word 'Other'.
| Name: |
dei_DocumentType |
| Namespace Prefix: |
dei_ |
| Data Type: |
dei:submissionTypeItemType |
| Balance Type: |
na |
| Period Type: |
duration |
|
| X |
- DefinitionAddress Line 1 such as Attn, Building Name, Street Name
| Name: |
dei_EntityAddressAddressLine1 |
| Namespace Prefix: |
dei_ |
| Data Type: |
xbrli:normalizedStringItemType |
| Balance Type: |
na |
| Period Type: |
duration |
|
| X |
- Definition
+ References
+ Details
| Name: |
dei_EntityAddressCityOrTown |
| Namespace Prefix: |
dei_ |
| Data Type: |
xbrli:normalizedStringItemType |
| Balance Type: |
na |
| Period Type: |
duration |
|
| X |
- DefinitionCode for the postal or zip code
| Name: |
dei_EntityAddressPostalZipCode |
| Namespace Prefix: |
dei_ |
| Data Type: |
xbrli:normalizedStringItemType |
| Balance Type: |
na |
| Period Type: |
duration |
|
| X |
- DefinitionName of the state or province.
| Name: |
dei_EntityAddressStateOrProvince |
| Namespace Prefix: |
dei_ |
| Data Type: |
dei:stateOrProvinceItemType |
| Balance Type: |
na |
| Period Type: |
duration |
|
| X |
- DefinitionA unique 10-digit SEC-issued value to identify entities that have filed disclosures with the SEC. It is commonly abbreviated as CIK. Reference 1: http://www.xbrl.org/2003/role/presentationRef
-Publisher SEC
-Name Exchange Act
-Number 240
-Section 12
-Subsection b-2
| Name: |
dei_EntityCentralIndexKey |
| Namespace Prefix: |
dei_ |
| Data Type: |
dei:centralIndexKeyItemType |
| Balance Type: |
na |
| Period Type: |
duration |
|
| X |
- DefinitionIndicate if registrant meets the emerging growth company criteria. Reference 1: http://www.xbrl.org/2003/role/presentationRef
-Publisher SEC
-Name Exchange Act
-Number 240
-Section 12
-Subsection b-2
| Name: |
dei_EntityEmergingGrowthCompany |
| Namespace Prefix: |
dei_ |
| Data Type: |
xbrli:booleanItemType |
| Balance Type: |
na |
| Period Type: |
duration |
|
| X |
- DefinitionCommission file number. The field allows up to 17 characters. The prefix may contain 1-3 digits, the sequence number may contain 1-8 digits, the optional suffix may contain 1-4 characters, and the fields are separated with a hyphen.
| Name: |
dei_EntityFileNumber |
| Namespace Prefix: |
dei_ |
| Data Type: |
dei:fileNumberItemType |
| Balance Type: |
na |
| Period Type: |
duration |
|
| X |
- DefinitionTwo-character EDGAR code representing the state or country of incorporation.
| Name: |
dei_EntityIncorporationStateCountryCode |
| Namespace Prefix: |
dei_ |
| Data Type: |
dei:edgarStateCountryItemType |
| Balance Type: |
na |
| Period Type: |
duration |
|
| X |
- DefinitionThe exact name of the entity filing the report as specified in its charter, which is required by forms filed with the SEC. Reference 1: http://www.xbrl.org/2003/role/presentationRef
-Publisher SEC
-Name Exchange Act
-Number 240
-Section 12
-Subsection b-2
| Name: |
dei_EntityRegistrantName |
| Namespace Prefix: |
dei_ |
| Data Type: |
xbrli:normalizedStringItemType |
| Balance Type: |
na |
| Period Type: |
duration |
|
| X |
- DefinitionThe Tax Identification Number (TIN), also known as an Employer Identification Number (EIN), is a unique 9-digit value assigned by the IRS. Reference 1: http://www.xbrl.org/2003/role/presentationRef
-Publisher SEC
-Name Exchange Act
-Number 240
-Section 12
-Subsection b-2
| Name: |
dei_EntityTaxIdentificationNumber |
| Namespace Prefix: |
dei_ |
| Data Type: |
dei:employerIdItemType |
| Balance Type: |
na |
| Period Type: |
duration |
|
| X |
- DefinitionLocal phone number for entity.
| Name: |
dei_LocalPhoneNumber |
| Namespace Prefix: |
dei_ |
| Data Type: |
xbrli:normalizedStringItemType |
| Balance Type: |
na |
| Period Type: |
duration |
|
| X |
- DefinitionBoolean flag that is true when the Form 8-K filing is intended to satisfy the filing obligation of the registrant as pre-commencement communications pursuant to Rule 13e-4(c) under the Exchange Act. Reference 1: http://www.xbrl.org/2003/role/presentationRef
-Publisher SEC
-Name Exchange Act
-Number 240
-Section 13e
-Subsection 4c
| Name: |
dei_PreCommencementIssuerTenderOffer |
| Namespace Prefix: |
dei_ |
| Data Type: |
xbrli:booleanItemType |
| Balance Type: |
na |
| Period Type: |
duration |
|
| X |
- DefinitionBoolean flag that is true when the Form 8-K filing is intended to satisfy the filing obligation of the registrant as pre-commencement communications pursuant to Rule 14d-2(b) under the Exchange Act. Reference 1: http://www.xbrl.org/2003/role/presentationRef
-Publisher SEC
-Name Exchange Act
-Number 240
-Section 14d
-Subsection 2b
| Name: |
dei_PreCommencementTenderOffer |
| Namespace Prefix: |
dei_ |
| Data Type: |
xbrli:booleanItemType |
| Balance Type: |
na |
| Period Type: |
duration |
|
| X |
- DefinitionTitle of a 12(b) registered security. Reference 1: http://www.xbrl.org/2003/role/presentationRef
-Publisher SEC
-Name Exchange Act
-Number 240
-Section 12
-Subsection b
| Name: |
dei_Security12bTitle |
| Namespace Prefix: |
dei_ |
| Data Type: |
dei:securityTitleItemType |
| Balance Type: |
na |
| Period Type: |
duration |
|
| X |
- DefinitionName of the Exchange on which a security is registered. Reference 1: http://www.xbrl.org/2003/role/presentationRef
-Publisher SEC
-Name Exchange Act
-Number 240
-Section 12
-Subsection d1-1
| Name: |
dei_SecurityExchangeName |
| Namespace Prefix: |
dei_ |
| Data Type: |
dei:edgarExchangeCodeItemType |
| Balance Type: |
na |
| Period Type: |
duration |
|
| X |
- DefinitionBoolean flag that is true when the Form 8-K filing is intended to satisfy the filing obligation of the registrant as soliciting material pursuant to Rule 14a-12 under the Exchange Act. Reference 1: http://www.xbrl.org/2003/role/presentationRef
-Publisher SEC
-Name Exchange Act
-Section 14a
-Number 240
-Subsection 12
| Name: |
dei_SolicitingMaterial |
| Namespace Prefix: |
dei_ |
| Data Type: |
xbrli:booleanItemType |
| Balance Type: |
na |
| Period Type: |
duration |
|
| X |
- DefinitionTrading symbol of an instrument as listed on an exchange.
| Name: |
dei_TradingSymbol |
| Namespace Prefix: |
dei_ |
| Data Type: |
dei:tradingSymbolItemType |
| Balance Type: |
na |
| Period Type: |
duration |
|
| X |
- DefinitionBoolean flag that is true when the Form 8-K filing is intended to satisfy the filing obligation of the registrant as written communications pursuant to Rule 425 under the Securities Act. Reference 1: http://www.xbrl.org/2003/role/presentationRef
-Publisher SEC
-Name Securities Act
-Number 230
-Section 425
| Name: |
dei_WrittenCommunications |
| Namespace Prefix: |
dei_ |
| Data Type: |
xbrli:booleanItemType |
| Balance Type: |
na |
| Period Type: |
duration |
|
Salisbury Bancorp (NASDAQ:SAL)
Gráfica de Acción Histórica
De Abr 2024 a May 2024

Salisbury Bancorp (NASDAQ:SAL)
Gráfica de Acción Histórica
De May 2023 a May 2024
