UNITED STATES
SECURITIES AND EXCHANGE COMMISSION
Washington, D.C. 20549
FORM N-CSR
CERTIFIED SHAREHOLDER REPORT OF REGISTERED MANAGEMENT
INVESTMENT COMPANIES
Investment Company Act file number: 811-06540
| Name of Fund: |
|
BlackRock MuniYield Quality Fund III, Inc. (MYI) |
| Fund Address: |
|
100 Bellevue Parkway, Wilmington, DE 19809 |
Name and address of agent for
service: John M. Perlowski, Chief Executive Officer, BlackRock MuniYield Quality Fund III, Inc., 50 Hudson Yards, New York, NY 10001
Registrant’s telephone number, including area code: (800) 882-0052, Option 4
Date of fiscal year end: 07/31/2023
Date of reporting period: 07/31/2023
Item 1 – Report to Stockholders
(a) The Report to Shareholders is attached herewith.
|
|
|
|

|
|
JULY 31, 2023 |
BlackRock MuniHoldings New Jersey Quality Fund, Inc. (MUJ)
BlackRock MuniYield Michigan Quality Fund, Inc. (MIY)
BlackRock MuniYield
New York Quality Fund, Inc. (MYN)
BlackRock MuniYield Pennsylvania Quality Fund (MPA)
BlackRock MuniYield Quality Fund III, Inc. (MYI)
BlackRock New York
Municipal Income Trust (BNY)
|
|
Not FDIC Insured • May Lose Value • No Bank Guarantee
|
The Markets in Review
Dear Shareholder,
Despite an uncertain economic
landscape during the 12-month reporting period ended July 31, 2023, the resilience of the U.S. economy in the face of ever tighter financial conditions provided an encouraging backdrop for investors. While inflation was near multi-decade highs
at the beginning of the period, it declined precipitously as commodity prices dropped. Labor shortages also moderated, although wages continued to grow and unemployment rates reached the lowest levels in decades. This robust labor market powered
further growth in consumer spending, backstopping the economy.
Equity returns were solid, as the durability of consumer sentiment eased
investors’ concerns about the economy’s trajectory. The U.S. economy resumed growth in the third quarter of 2022 and continued to expand thereafter. Most major classes of equities advanced, including large- and small-capitalization U.S.
stocks and equities from developed and emerging markets.
The 10-year U.S. Treasury yield rose during the reporting period, driving its price down, as
investors reacted to elevated inflation and attempted to anticipate future interest rate changes. The corporate bond market also faced inflationary headwinds, although high-yield corporate bond prices fared significantly better than investment-grade
bonds as demand from yield-seeking investors remained strong.
The U.S. Federal Reserve (the “Fed”), acknowledging that inflation has been
more persistent than expected, raised interest rates seven times during the 12-month period ended July 31, 2023. Furthermore, the Fed wound down its bond-buying programs and incrementally reduced its balance sheet by not replacing securities
that reach maturity. However, the Fed declined to raise interest rates at its June 2023 meeting, the first time it paused its tightening in the current cycle, before again raising rates in July 2023.
Supply constraints appear to have become an embedded feature of the new macroeconomic environment, making it difficult for developed economies to increase
production without sparking higher inflation. Geopolitical fragmentation and an aging population risk further exacerbating these constraints, keeping the labor market tight and wage growth high. Although the Fed has decelerated the pace of interest
rate hikes and recently opted for a pause, we believe that the new economic regime means that the Fed will need to maintain high rates for an extended period to keep inflation under control. Furthermore, ongoing structural changes may mean that the
Fed will be hesitant to cut interest rates in the event of faltering economic activity lest inflation accelerate again. We believe investors should expect a period of higher volatility as markets adjust to the new economic reality and policymakers
attempt to adapt.
While we favor an overweight position to developed market equities in the long term, we prefer an underweight stance in the
near-term. Expectations for corporate earnings remain elevated, which seems inconsistent with macroeconomic constraints. Nevertheless, we are overweight on emerging market stocks in the near-term as growth trends for emerging markets appear
brighter. We also believe that stocks with an A.I. tilt should benefit from an investment cycle that is set to support revenues and margins. We are neutral on credit overall amid tightening credit and financial conditions; however, there are
selective opportunities in the near term. For fixed income investing with a six- to twelve-month horizon, we see the most attractive investments in short-term U.S. Treasuries, U.S. inflation-linked bonds, U.S. mortgage-backed securities, and
hard-currency emerging market bonds.
Overall, our view is that investors need to think globally, position themselves to be prepared for a
decarbonizing economy, and be nimble as market conditions change. We encourage you to talk with your financial advisor and visit blackrock.com for further insight about investing in today’s markets.
Sincerely,

Rob Kapito
President, BlackRock Advisors, LLC

Rob Kapito
President, BlackRock Advisors, LLC
|
|
|
|
|
| Total Returns as of July 31, 2023 |
| |
|
6-Month |
|
12-Month |
| U.S. large cap
equities
(S&P 500® Index) |
|
13.52% |
|
13.02% |
| U.S. small cap
equities
(Russell 2000® Index) |
|
4.51 |
|
7.91 |
| International
equities
(MSCI Europe, Australasia, Far East Index) |
|
6.65 |
|
16.79 |
| Emerging market
equities
(MSCI Emerging Markets Index) |
|
3.26 |
|
8.35 |
| 3-month Treasury
bills
(ICE BofA 3-Month U.S. Treasury Bill Index) |
|
2.34 |
|
3.96 |
| U.S. Treasury
securities
(ICE BofA 10-Year U.S. Treasury Index) |
|
(2.08) |
|
(7.56) |
| U.S. investment
grade bonds
(Bloomberg U.S. Aggregate Bond Index) |
|
(1.02) |
|
(3.37) |
| Tax-exempt
municipal bonds
(Bloomberg Municipal Bond Index) |
|
0.20 |
|
0.93 |
| U.S. high yield
bonds
(Bloomberg U.S. Corporate High Yield 2% Issuer Capped Index) |
|
2.92 |
|
4.42 |
|
| Past performance is not an indication of future results. Index performance is shown for
illustrative purposes only. You cannot invest directly in an index. |
|
|
|
| 2 |
|
T H I S P A G E
I S N O T P A R T O F Y O U
R F U N D R E P O R T |
Table of Contents
|
|
|
| Municipal Market Overview For the Reporting Period Ended July 31, 2023
|
|
|
Municipal Market Conditions
Municipal bonds posted positive total returns amid heightened volatility. Interest rates rose rapidly early in the period as the Fed continued its
historic hiking cycle but became increasingly rangebound later in the reporting period as economic activity slowed, inflation expectations moderated, and the Fed tempered the magnitude and pace of its policy tightening. Strong credit fundamentals,
bolstered by robust post-pandemic revenue growth and elevated fund balances, drove strong positive excess returns versus comparable U.S. Treasuries. Lower-rated investment grade credits and the 15-year part of the yield curve performed best.
|
|
|
|
|
| During the 12-month period ended July 31, 2023, municipal bond funds experienced net outflows totaling $52 billion (based on data
from the Investment Company Institute), transitioning from the largest outflow cycle on record in 2022 to mixed in 2023. At the same time, the market contended with just $324 billion in issuance, well below the $422 billion issued during the prior
12-months. However, elevated bid-wanted activity filled some of the gap as investors raised cash to meet redemptions, portfolio leverage was repositioned, and the Federal Deposit Insurance Corporation (“FDIC”) liquidated collapsed bank
assets. |
|
|
|
Bloomberg Municipal Bond Index(a)
Total Returns as of July 31, 2023
6 months: 0.20% 12 months:
0.93% |
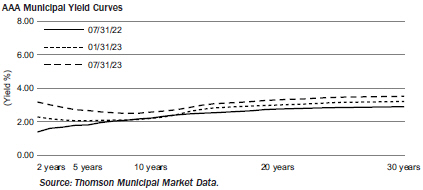
A Closer Look at Yields
|
|
|
|
|
|
From July 31, 2022, to July 31, 2023, yields on AAA-rated 30-year municipal bonds increased by 62 basis points
(“bps”) from 2.89% to 3.51%, ten-year yields increased by 36 bps from 2.21% to 2.57%, five-year yields increased by 86 bps from 1.80% to 2.66%, and two-year yields increased by 140 bps from 1.60% to 3.00% (as measured by Refinitiv
Municipal Market Data). As a result, the municipal yield curve flattened over the 12-month period with the spread between two- and 30-year maturities flattening by 78 bps to a slope of 51 bps. Still, the curve remained relatively steep compared to
the deeply inverted U.S. Treasury curve. Outperformance throughout
the period prompted historically rich valuations across the curve. Municipal-to-Treasury ratios tightened well through their 5-year averages led by short and intermediate maturities. |
Financial Conditions of Municipal Issuers
Buoyed by successive federal aid injections, vaccine distribution, and the re-opening of the economy, states and many local governments experienced
revenue growth above forecasts in 2021 and 2022. However, revenue collections through April 2023, particularly personal income tax receipts, have softened or declined in many states, such as California and New York. A slowing economy could cause
more widespread declines in overall revenue collections. While the inflation rate has slowed, higher wages and interest rates in the post-Covid recovery will pressure state and local government costs. Nevertheless, overall credit fundamentals remain
solid, particularly near-record reserve levels. Other sectors also exhibit strong credit fundamentals. Municipal utilities typically benefit from autonomous rate-setting that allows them to adjust for rising fuel costs. Rising commodity prices over
a prolonged period could test affordability and the political will to raise rates to balance operations. State housing authority bonds, flagship universities, and strong national and regional health systems may also be pressured but are better
poised to absorb the impact of the economic shock. Critical providers (safety net hospitals, mass transit systems, airports) with limited resources may still experience fiscal strain from the economic fallout from high inflation, but aid and demand
in the service sector of the economy will continue to support operating results through 2023. Work-from-home policies remain headwinds for mass transit farebox revenue and commercial real estate values.
The opinions expressed are those of BlackRock as of July 31, 2023 and are subject to change at any time due to changes in market or economic
conditions. The comments should not be construed as a recommendation of any individual holdings or market sectors. Investing involves risk including loss of principal. Bond values fluctuate in price so the value of your investment can go down
depending on market conditions. Fixed income risks include interest-rate and credit risk. Typically, when interest rates rise, there is a corresponding decline in bond values. Credit risk refers to the possibility that the bond issuer will not be
able to make principal and interest payments. There may be less information on the financial condition of municipal issuers than for public corporations. The market for municipal bonds may be less liquid than for taxable bonds. Some investors may be
subject to Alternative Minimum Tax (“AMT”). Capital gains distributions, if any, are taxable.
| (a) |
|
The Bloomberg Municipal Bond Index, a broad, market value-weighted index, seeks to measure the performance of the U.S. municipal bond market. All bonds in the index are exempt from U.S. federal income taxes or subject
to the AMT. Past performance is not an indication of future results. Index performance is shown for illustrative purposes only. It is not possible to invest directly in an index. |
|
|
|
| 4 |
|
2 0 2 3 B L A C
K R O C K A N N U A L R E P O R
T T O S H A R E H O L D E R
S |
The Benefits and Risks of Leveraging
The Funds may utilize leverage to seek to enhance the distribution rate on, and net asset value (“NAV”) of, their common shares
(“Common Shares”). However, there is no guarantee that these objectives can be achieved in all interest rate environments.
In general, the
concept of leveraging is based on the premise that the financing cost of leverage, which is based on short-term interest rates, is normally lower than the income earned by a Fund on its longer-term portfolio investments purchased with the proceeds
from leverage. To the extent that the total assets of each Fund (including the assets obtained from leverage) are invested in higher-yielding portfolio investments, each Fund’s shareholders benefit from the incremental net income. The interest
earned on securities purchased with the proceeds from leverage (after paying the leverage costs) is paid to shareholders in the form of dividends, and the value of these portfolio holdings (less the leverage liability) is reflected in the per share
NAV.
To illustrate these concepts, assume a Fund’s Common Shares capitalization is $100 million and it utilizes leverage for an additional $30
million, creating a total value of $130 million available for investment in longer-term income securities. If prevailing short-term interest rates are 3% and longer-term interest rates are 6%, the yield curve has a strongly positive slope. In this
case, a Fund’s financing costs on the $30 million of proceeds obtained from leverage are based on the lower short-term interest rates. At the same time, the securities purchased by a Fund with the proceeds from leverage earn income based on
longer-term interest rates. In this case, a Fund’s financing cost of leverage is significantly lower than the income earned on a Fund’s longer-term investments acquired from such leverage proceeds, and therefore the holders of Common
Shares (“Common Shareholders”) are the beneficiaries of the incremental net income.
However, in order to benefit Common Shareholders, the
return on assets purchased with leverage proceeds must exceed the ongoing costs associated with the leverage. If interest and other costs of leverage exceed a Fund’s return on assets purchased with leverage proceeds, income to shareholders is
lower than if a Fund had not used leverage. In such circumstance, the investment adviser may nevertheless determine to maintain a Fund’s leverage if it deems such action to be appropriate. Furthermore, the value of the Funds’ portfolio
investments generally varies inversely with the direction of long-term interest rates, although other factors can influence the value of portfolio investments. In contrast, the amount of each Fund’s obligations under its respective leverage
arrangement generally does not fluctuate in relation to interest rates. As a result, changes in interest rates can influence the Funds’ NAVs positively or negatively. Changes in the future direction of interest rates are very difficult to
predict accurately, and there is no assurance that a Fund’s intended leveraging strategy will be successful.
The use of leverage also generally
causes greater changes in each Fund’s NAV, market price and dividend rates than comparable portfolios without leverage. In a declining market, leverage is likely to cause a greater decline in the NAV and market price of a Fund’s Common
Shares than if the Fund were not leveraged. In addition, each Fund may be required to sell portfolio securities at inopportune times or at distressed values in order to comply with regulatory requirements applicable to the use of leverage or as
required by the terms of leverage instruments, which may cause the Fund to incur losses. The use of leverage may limit a Fund’s ability to invest in certain types of securities or use certain types of hedging strategies. Each Fund incurs
expenses in connection with the use of leverage, all of which are borne by Common Shareholders and may reduce income to the Common Shares. Moreover, to the extent the calculation of each Fund’s investment advisory fees includes assets purchased
with the proceeds of leverage, the investment advisory fees payable to the Funds’ investment adviser will be higher than if the Funds did not use leverage.
To obtain leverage, each Fund has issued Variable Rate Demand Preferred Shares (“VRDP Shares” or “Preferred Shares”) and/or leveraged
its assets through the use of tender option bond trusts (“TOB Trusts”) as described in the Notes to Financial Statements.
Under the
Investment Company Act of 1940, as amended (the “1940 Act”), each Fund is permitted to borrow money (including through the use of TOB Trusts) or issue debt securities up to 33 1/3% of its total managed assets or equity securities (e.g.,
Preferred Shares) up to 50% of its total managed assets. A Fund may voluntarily elect to limit its leverage to less than the maximum amount permitted under the 1940 Act. In addition, a Fund may also be subject to certain asset coverage, leverage or
portfolio composition requirements imposed by the Preferred Shares’ governing instruments or by agencies rating the Preferred Shares, which may be more stringent than those imposed by the 1940 Act.
Derivative Financial Instruments
The Funds
may invest in various derivative financial instruments. These instruments are used to obtain exposure to a security, commodity, index, market, and/or other assets without owning or taking physical custody of securities, commodities and/or other
referenced assets or to manage market, equity, credit, interest rate, foreign currency exchange rate, commodity and/or other risks. Derivative financial instruments may give rise to a form of economic leverage and involve risks, including the
imperfect correlation between the value of a derivative financial instrument and the underlying asset, possible default of the counterparty to the transaction or illiquidity of the instrument. Pursuant to Rule 18f-4 under the 1940 Act, among other
things, the Funds must either use derivative financial instruments with embedded leverage in a limited manner or comply with an outer limit on fund leverage risk based on value-at-risk. The Funds’ successful use of a derivative financial
instrument depends on the investment adviser’s ability to predict pertinent market movements accurately, which cannot be assured. The use of these instruments may result in losses greater than if they had not been used, may limit the amount of
appreciation a Fund can realize on an investment and/or may result in lower distributions paid to shareholders. The Funds’ investments in these instruments, if any, are discussed in detail in the Notes to Financial Statements.
|
|
|
| T H E B E N E F I
T S A N D R I S K S O F L E
V E R A G I N G / D E R I V A
T I V E F I N A N C I A L I N
S T R U M E N T S |
|
5 |
|
|
|
| Fund Summary as of July 31, 2023
|
|
BlackRock MuniHoldings New Jersey Quality Fund, Inc. (MUJ) |
Investment Objective
BlackRock MuniHoldings New Jersey
Quality Fund, Inc.’s (MUJ) (the “Fund”) investment objective is to provide shareholders with current income exempt from U.S. federal income tax and New Jersey personal income taxes. The Fund seeks to achieve its investment
objective by investing primarily in long-term, investment grade municipal obligations exempt from U.S federal income taxes (except that the interest may be subject to the U.S. federal alternative minimum tax) and New Jersey personal income taxes.
The municipal obligations in which the Fund primarily invests are either rated investment grade quality, or are considered by the Fund’s investment adviser to be of comparable quality, at the time of investment. Under normal market conditions,
the Fund invests at least 80% of its assets in municipal obligations with remaining maturities of one year or more at the time of investment. The Fund may invest up to 20% of its managed assets in securities that are rated below investment grade, or
are considered by the Fund’s investment adviser to be of comparable quality, at the time of purchase. The Fund may invest directly in securities or synthetically through the use of derivatives.
No assurance can be given that the Fund’s investment objective will be achieved.
Fund Information
|
|
|
| Symbol on New York Stock Exchange |
|
MUJ |
| Initial Offering Date |
|
March 11, 1998 |
| Yield on Closing Market Price as of July 31, 2023
($11.20)(a) |
|
4.02% |
| Tax Equivalent Yield(b) |
|
8.30% |
| Current Monthly Distribution per Common
Share(c) |
|
$0.037500 |
| Current Annualized Distribution per Common
Share(c) |
|
$0.450000 |
| Leverage as of July 31, 2023(d) |
|
39% |
| |
(a) |
Yield on closing market price is calculated by dividing the current annualized distribution per share by the closing
market price. Past performance is not an indication of future results. |
|
| |
(b) |
Tax equivalent yield assumes the maximum marginal U.S. federal and state tax rate of 51.55%, which includes the 3.8%
Medicare tax. Actual tax rates will vary based on income, exemptions and deductions. Lower taxes will result in lower tax equivalent yields. |
|
| |
(c) |
The distribution rate is not constant and is subject to change. A portion of the distribution may be deemed a return of
capital or net realized gain. |
|
| |
(d) |
Represents VRDP Shares and TOB Trusts as a percentage of total managed assets, which is the total assets of the Fund,
including any assets attributable to VRDP Shares and TOB Trusts, minus the sum of its accrued liabilities. Does not reflect derivatives or other instruments that may give rise to economic leverage. For a discussion of leveraging techniques utilized
by the Fund, please see The Benefits and Risks of Leveraging and Derivative Financial Instruments. |
|
Market Price and Net Asset Value Per Share Summary
|
|
|
|
|
|
|
|
|
|
|
|
|
|
|
|
|
|
|
|
|
| |
|
07/31/23 |
|
|
07/31/22 |
|
|
Change |
|
|
High |
|
|
Low |
|
| Closing Market Price |
|
$ |
11.20 |
|
|
$ |
13.36 |
|
|
|
(16.17 |
)% |
|
$ |
13.51 |
|
|
$ |
10.67 |
|
| Net Asset Value |
|
|
13.03 |
|
|
|
13.58 |
|
|
|
(4.05 |
) |
|
|
13.69 |
|
|
|
11.82 |
|
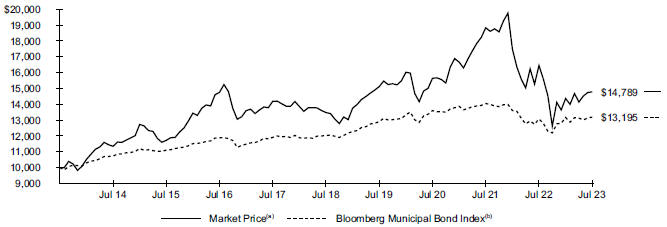
GROWTH OF $10,000 INVESTMENT
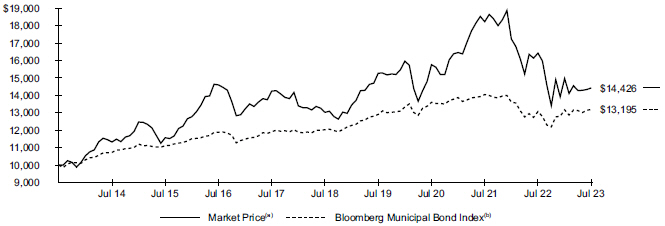
| (a) |
Represents the Fund’s closing market price on the NYSE and reflects the reinvestment of dividends and/or
distributions at actual reinvestment prices. |
| (b) |
An unmanaged index that tracks the U.S. long term tax-exempt bond market, including state and local general obligation
bonds, revenue bonds, pre-refunded bonds, and insured bonds. |
|
|
|
| 6 |
|
2 0 2 3 B L A C
K R O C K A N N U A L R E P O R
T T O S H A R E H O L D E R
S |
|
|
|
| Fund Summary as of July 31, 2023 (continued)
|
|
BlackRock MuniHoldings New Jersey Quality Fund, Inc. (MUJ) |
Performance
Returns for the period ended July 31, 2023
were as follows:
|
|
|
|
|
|
|
|
|
|
|
|
|
| |
|
Average Annual Total Returns |
|
|
|
|
|
| |
|
1 Year |
|
|
5 Years |
|
|
10 Years |
|
|
|
|
|
| Fund at NAV(a)(b) |
|
|
0.52 |
% |
|
|
1.70 |
% |
|
|
4.40 |
% |
| Fund at Market
Price(a)(b) |
|
|
(12.17 |
) |
|
|
2.06 |
|
|
|
3.73 |
|
|
|
|
|
| New Jersey Customized Reference
Benchmark(c) |
|
|
1.98 |
|
|
|
2.75 |
|
|
|
N/A |
|
| Bloomberg Municipal Bond Index |
|
|
0.93 |
|
|
|
1.87 |
|
|
|
2.81 |
|
| |
(a) |
All returns reflect reinvestment of dividends and/or distributions at actual reinvestment prices. Performance results
reflect the Fund’s use of leverage, if any. |
|
| |
(b) |
The Fund’s discount to NAV widened during the period, which accounts for the difference between performance based
on market price and performance based on NAV. |
|
| |
(c) |
The New Jersey Customized Reference Benchmark is comprised of the Bloomberg Municipal Bond: New Jersey Exempt Total
Return Index Unhedged (90%) and the New Jersey Bloomberg Municipal Bond: High Yield (non-Investment Grade) Total Return Index (10%). The New Jersey Customized Reference Benchmark commenced on September 30, 2016. |
|
Performance results may include adjustments made for financial reporting purposes in accordance with U.S.
generally accepted accounting principles.
Past performance is not an indication of future results.
The Fund is presenting the performance of one or more indices for informational purposes only. The Fund is actively managed and does not seek to track or
replicate the performance of any index. The index performance shown is not intended to be indicative of the Fund’s investment strategies, portfolio components or past or future performance.
More information about the Fund’s historical performance can be found in the “Closed End Funds” section of blackrock.com.
The following discussion relates to the Fund’s absolute performance based on NAV:
Municipal bonds posted slightly positive returns in the annual period. Bond market performance, in general, was dampened by the combination of high
inflation and continued interest rate increases by the Fed. However, the contribution from income outweighed the impact of falling prices. New Jersey municipal bonds outpaced the national market.
The Fund’s use of U.S. Treasury futures to manage interest rate risk was a key contributor to performance early in the reporting period when the Fed
was aggressively raising rates to combat inflation. Tax-backed state issues were the largest contributors at the sector level, with smaller contributions from education and tobacco. A rated securities made the largest contribution to performance,
reflecting their sizable weighting in the portfolio. With the exception of holdings in long-duration, 4% coupon issues, the Fund’s positions in bonds with maturities of 20 years and above performed well. (Duration is a measure of interest rate
sensitivity.)
On the other hand, positions in the healthcare, housing and utility sectors modestly detracted from performance. At the ratings level,
triple B and below rated securities were a modest drag on results.
The Fund’s cash and cash equivalent weighting was above typical levels at the
close of the period, which represented a defensive positioning.
The views expressed reflect the opinions of BlackRock as of the date of this report
and are subject to change based on changes in market, economic or other conditions. These views are not intended to be a forecast of future events and are no guarantee of future results.
|
|
|
| Fund Summary as of July 31, 2023 (continued)
|
|
BlackRock MuniHoldings New Jersey Quality Fund, Inc. (MUJ) |
Overview of the Fund’s Total Investments
SECTOR ALLOCATION
|
|
|
|
|
| |
|
| Sector(a)(b) |
|
Percentage of
Total Investments |
|
| Transportation |
|
|
31.0 |
% |
| State |
|
|
20.3 |
|
| Education |
|
|
14.5 |
|
| County/City/Special District/School District |
|
|
12.8 |
|
| Health |
|
|
5.9 |
|
| Tobacco |
|
|
5.1 |
|
| Corporate |
|
|
5.0 |
|
| Utilities |
|
|
3.5 |
|
| Housing |
|
|
1.9 |
|
CALL/MATURITY
SCHEDULE
|
|
|
|
|
| |
|
| Calendar Year Ended December 31,(a)(c) |
|
Percentage |
|
| 2023 |
|
|
8.7 |
% |
| 2024 |
|
|
19.7 |
|
| 2025 |
|
|
7.4 |
|
| 2026 |
|
|
5.9 |
|
| 2027 |
|
|
8.0 |
|
CREDIT QUALITY ALLOCATION
|
|
|
|
|
| |
|
| Credit Rating(a)(d) |
|
Percentage of
Total Investments |
|
| AAA/Aaa |
|
|
1.8 |
% |
| AA/Aa |
|
|
36.0 |
|
| A |
|
|
38.1 |
|
| BBB/Baa |
|
|
16.9 |
|
| BB/Ba |
|
|
1.1 |
|
| B |
|
|
0.3 |
|
| N/R(e) |
|
|
5.8 |
|
| (a) |
Excludes short-term securities. |
| (b) |
For Fund compliance purposes, the Fund’s sector classifications refer to one or more of the sector
sub-classifications used by one or more widely recognized market indexes or rating group indexes, and/or as defined by the investment adviser. These definitions may not apply for purposes of this report, which may combine such sector
sub-classifications for reporting ease. |
| (c) |
Scheduled maturity dates and/or bonds that are subject to potential calls by issuers over the next five years.
|
| (d) |
For financial reporting purposes, credit quality ratings shown above reflect the highest rating assigned by either
S&P Global Ratings or Moody’s Investors Service, Inc. if ratings differ. These rating agencies are independent, nationally recognized statistical rating organizations and are widely used. Investment grade ratings are credit ratings of
BBB/Baa or higher. Below investment grade ratings are credit ratings of BB/Ba or lower. Investments designated N/R are not rated by either rating agency. Unrated investments do not necessarily indicate low credit quality. Credit quality ratings are
subject to change. |
| (e) |
The investment adviser evaluates the credit quality of unrated investments based upon certain factors including, but
not limited to, credit ratings for similar investments and financial analysis of sectors and individual investments. Using this approach, the investment adviser has deemed certain of these unrated securities as investment grade quality. As of
July 31, 2023, the market value of unrated securities deemed by the investment adviser to be investment grade represents 1.6% of the Fund’s total investments. |
|
|
|
| 8 |
|
2 0 2 3 B L A C
K R O C K A N N U A L R E P O R
T T O S H A R E H O L D E R
S |
|
|
|
| Fund Summary as of July 31, 2023
|
|
BlackRock MuniYield Michigan Quality Fund, Inc. (MIY) |
Investment Objective
BlackRock MuniYield Michigan Quality
Fund, Inc.’s (MIY) (the “Fund”) investment objective is to provide shareholders with as high a level of current income exempt from U.S. federal and Michigan income taxes as is consistent with its investment policies and prudent
investment management. The Fund seeks to achieve its investment objective by investing at least 80% of its assets in municipal obligations exempt from U.S. federal income taxes (except that the interest may be subject to the U.S. federal alternative
minimum tax) and Michigan income taxes. Under normal market conditions, the Fund invests primarily in long-term municipal obligations that are investment grade quality, or are considered by the Fund’s investment adviser to be of comparable
quality, at the time of investment. The Fund may invest up to 20% of its managed assets in securities that are rated below investment grade, or are considered by the Fund’s investment adviser to be of comparable quality, at the time of
purchase. The Fund may invest directly in securities or synthetically through the use of derivatives.
No assurance can be given that the Fund’s
investment objective will be achieved.
Fund Information
|
|
|
| Symbol on New York Stock Exchange |
|
MIY |
| Initial Offering Date |
|
October 30, 1992 |
| Yield on Closing Market Price as of July 31, 2023 ($
11.12)(a) |
|
3.72% |
| Tax Equivalent Yield(b) |
|
6.77% |
| Current Monthly Distribution per Common
Share(c) |
|
$0.034500 |
| Current Annualized Distribution per Common
Share(c) |
|
$0.414000 |
| Leverage as of July 31, 2023(d) |
|
39% |
| |
(a) |
Yield on closing market price is calculated by dividing the current annualized distribution per share by the closing
market price. Past performance is not an indication of future results. |
|
| |
(b) |
Tax equivalent yield assumes the maximum marginal U.S. federal and state tax rate of 45.05%, which includes the 3.8%
Medicare tax. Actual tax rates will vary based on income, exemptions and deductions. Lower taxes will result in lower tax equivalent yields. |
|
| |
(c) |
The distribution rate is not constant and is subject to change. A portion of the distribution may be deemed a return of
capital or net realized gain. |
|
| |
(d) |
Represents VRDP Shares and TOB Trusts as a percentage of total managed assets, which is the total assets of the Fund,
including any assets attributable to VRDP Shares and TOB Trusts, minus the sum of its accrued liabilities. Does not reflect derivatives or other instruments that may give rise to economic leverage. For a discussion of leveraging techniques utilized
by the Fund, please see The Benefits and Risks of Leveraging and Derivative Financial Instruments. |
|
Market Price and Net Asset Value Per Share Summary
|
|
|
|
|
|
|
|
|
|
|
|
|
|
|
|
|
|
|
|
|
| |
|
07/31/23 |
|
|
07/31/22 |
|
|
Change |
|
|
High |
|
|
Low |
|
| Closing Market Price |
|
$ |
11.12 |
|
|
$ |
13.67 |
|
|
|
(18.65 |
)% |
|
$ |
13.86 |
|
|
$ |
10.63 |
|
| Net Asset Value |
|
|
12.94 |
|
|
|
13.56 |
|
|
|
(4.57 |
) |
|
|
13.63 |
|
|
|
11.77 |
|
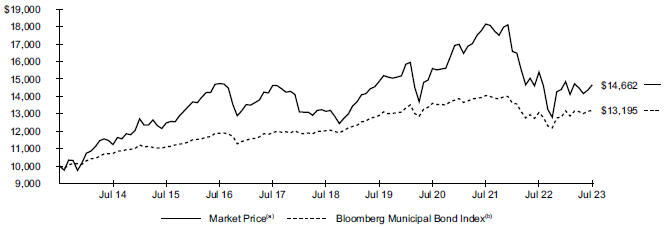
GROWTH OF $10,000 INVESTMENT
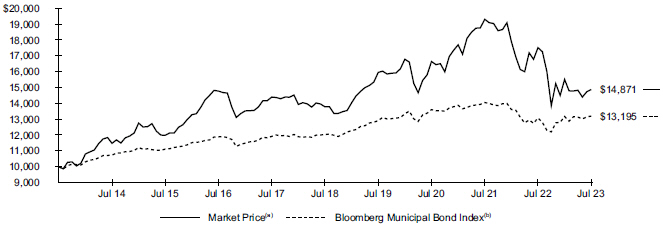
| |
(a) |
Represents the Fund’s closing market price on the NYSE and reflects the reinvestment of dividends and/or
distributions at actual reinvestment prices. |
|
| |
(b) |
An unmanaged index that tracks the U.S. long term tax-exempt bond market, including state and local general obligation
bonds, revenue bonds, pre-refunded bonds, and insured bonds. |
|
|
|
|
| Fund Summary as of July 31, 2023 (continued)
|
|
BlackRock MuniYield Michigan Quality Fund, Inc. (MIY) |
Performance
Returns for the period ended July 31, 2023
were as follows:
|
|
|
|
|
|
|
|
|
|
|
|
|
| |
|
Average Annual Total Returns |
|
|
|
|
|
| |
|
1 Year |
|
|
5 Years |
|
|
10 Years |
|
|
|
|
|
| Fund at NAV(a)(b) |
|
|
(0.40 |
)% |
|
|
1.49 |
% |
|
|
4.39 |
% |
| Fund at Market
Price(a)(b) |
|
|
(15.09 |
) |
|
|
1.54 |
|
|
|
4.05 |
|
|
|
|
|
| Michigan Customized Reference
Benchmark(c) |
|
|
0.44 |
|
|
|
2.01 |
|
|
|
N/A |
|
| Bloomberg Municipal Bond Index |
|
|
0.93 |
|
|
|
1.87 |
|
|
|
2.81 |
|
| |
(a) |
All returns reflect reinvestment of dividends and/or distributions at actual reinvestment prices. Performance results
reflect the Fund’s use of leverage, if any. |
|
| |
(b) |
The Fund moved from a premium to NAV to a discount during the period, which accounts for the difference between
performance based on market price and performance based on NAV. |
|
| |
(c) |
The Michigan Customized Reference Benchmark is comprised of the Bloomberg Municipal Bond: Michigan Exempt Total Return
Index Unhedged (90%) and the Michigan Bloomberg Municipal Bond: High Yield (non-Investment Grade) Total Return Index (10%). The Michigan Customized Reference Benchmark commenced on September 30, 2016. |
|
Performance results may include adjustments made for financial reporting purposes in accordance with U.S.
generally accepted accounting principles.
Past performance is not an indication of future results.
The Fund is presenting the performance of one or more indices for informational purposes only. The Fund is actively managed and does not seek to track or
replicate the performance of any index. The index performance shown is not intended to be indicative of the Fund’s investment strategies, portfolio components or past or future performance.
More information about the Fund’s historical performance can be found in the “Closed End Funds” section of blackrock.com.
The following discussion relates to the Fund’s absolute performance based on NAV:
Municipal bonds posted slightly positive returns in the annual period. Bond market performance, in general, was dampened by the combination of high
inflation and continued interest rate increases by the Fed. However, the contribution from income outweighed the impact of falling prices. Michigan municipals underperformed the national market.
Security selection in the tax-backed state, school district and healthcare sectors made small contributions to performance. Holdings in the 15- to 20-year
maturity range, which outpaced the broader market, also contributed. With respect to credit tiers, positions in A and BBB rated bonds helped results.
The Fund’s use of leverage, which amplified the effect of falling prices, detracted from returns. In addition, rising rates have increased the cost
of using leverage. Positions in the five- to seven-year maturity range and bonds rated below investment grade also hurt performance.
The views
expressed reflect the opinions of BlackRock as of the date of this report and are subject to change based on changes in market, economic or other conditions. These views are not intended to be a forecast of future events and are no guarantee of
future results.
|
|
|
| 10 |
|
2 0 2 3 B L A C
K R O C K A N N U A L R E P O R
T T O S H A R E H O L D E R
S |
|
|
|
| Fund Summary as of July 31, 2023 (continued)
|
|
BlackRock MuniYield Michigan Quality Fund, Inc. (MIY) |
Overview of the Fund’s Total Investments
|
|
|
|
|
| SECTOR ALLOCATION |
|
| |
|
| Sector(a)(b) |
|
Percentage of
Total Investments |
|
| County/City/Special District/School District |
|
|
22.7 |
% |
| Education |
|
|
20.9 |
|
| Health |
|
|
18.9 |
|
| State |
|
|
16.2 |
|
| Utilities |
|
|
7.8 |
|
| Housing |
|
|
6.7 |
|
| Transportation |
|
|
5.4 |
|
| Tobacco |
|
|
1.4 |
|
|
| CALL/MATURITY SCHEDULE |
|
| |
|
| Calendar Year Ended December 31,(a)(c) |
|
Percentage |
|
| 2023 |
|
|
15.1 |
% |
| 2024 |
|
|
8.8 |
|
| 2025 |
|
|
9.8 |
|
| 2026 |
|
|
8.9 |
|
| 2027 |
|
|
4.0 |
|
|
|
|
|
|
| CREDIT QUALITY ALLOCATION |
|
| |
|
| Credit Rating(a)(d) |
|
Percentage of
Total Investments |
|
| AAA/Aaa |
|
|
1.0 |
% |
| AA/Aa |
|
|
74.9 |
|
| A |
|
|
14.1 |
|
| BBB/Baa |
|
|
4.8 |
|
| BB/Ba |
|
|
0.4 |
|
| N/R(e) |
|
|
4.8 |
|
| (a) |
Excludes short-term securities. |
|
| (b) |
For Fund compliance purposes, the Fund’s sector classifications refer to one or more of the sector
sub-classifications used by one or more widely recognized market indexes or rating group indexes, and/or as defined by the investment adviser. These definitions may not apply for purposes of this report, which may combine such sector
sub-classifications for reporting ease. |
|
| (c) |
Scheduled maturity dates and/or bonds that are subject to potential calls by issuers over the next five years.
|
|
| (d) |
For financial reporting purposes, credit quality ratings shown above reflect the highest rating assigned by either
S&P Global Ratings or Moody’s Investors Service, Inc. if ratings differ. These rating agencies are independent, nationally recognized statistical rating organizations and are widely used. Investment grade ratings are credit ratings of
BBB/Baa or higher. Below investment grade ratings are credit ratings of BB/Ba or lower. Investments designated N/R are not rated by either rating agency. Unrated investments do not necessarily indicate low credit quality. Credit quality ratings are
subject to change. |
|
| (e) |
The investment adviser evaluates the credit quality of unrated investments based upon certain factors including, but
not limited to, credit ratings for similar investments and financial analysis of sectors and individual investments. Using this approach, the investment adviser has deemed certain of these unrated securities as investment grade quality. As of
July 31, 2023, the market value of unrated securities deemed by the investment adviser to be investment grade represents less than 1.0% of the Fund’s total investments. |
|
|
|
|
| Fund Summary as of July 31, 2023
|
|
BlackRock MuniYield New York Quality Fund, Inc. (MYN) |
Investment Objective
BlackRock MuniYield NewYork Quality
Fund, Inc.’s (MYN) (the “Fund”) investment objective is to provide shareholders with as high a level of current income exempt from U.S. federal income taxes and New York State and New York City personal income taxes as is
consistent with its investment policies and prudent investment management. The Fund seeks to achieve its investment objective by investing at least 80% of its assets in municipal obligations exempt from U.S. federal income taxes (except that the
interest may be subject to the U.S. federal alternative minimum tax) and New York State and New York City personal income taxes. Under normal market conditions, the Fund invests primarily in long-term municipal obligations that are investment grade
quality, or are considered by the Fund’s investment adviser to be of comparable quality, at the time of investment. The Fund may invest up to 20% of its managed assets in securities that are rated below investment grade, or are considered by
the Fund’s investment adviser to be of comparable quality, at the time of purchase. The Fund may invest directly in securities or synthetically through the use of derivatives.
No assurance can be given that the Fund’s investment objective will be achieved.
Fund Information
|
|
|
| |
|
| Symbol on New York Stock Exchange |
|
MYN |
| Initial Offering Date |
|
February 28, 1992 |
| Yield on Closing Market Price as of July 31, 2023 ($
10.08)(a) |
|
3.75% |
| Tax Equivalent Yield(b) |
|
7.76% |
| Current Monthly Distribution per Common
Share(c) |
|
$0.031500 |
| Current Annualized Distribution per Common
Share(c) |
|
$0.378000 |
| Leverage as of July 31, 2023(d) |
|
37% |
| |
(a) |
Yield on closing market price is calculated by dividing the current annualized distribution per share by the closing
market price. Past performance is not an indication of future results. |
|
| |
(b) |
Tax equivalent yield assumes the maximum marginal U.S. federal and state tax rate of 51.7%, which includes the 3.8%
Medicare tax. Actual tax rates will vary based on income, exemptions and deductions. Lower taxes will result in lower tax equivalent yields. |
|
| |
(c) |
The distribution rate is not constant and is subject to change. A portion of the distribution may be deemed a return of
capital or net realized gain. |
|
| |
(d) |
Represents VRDP Shares and TOB Trusts as a percentage of total managed assets, which is the total assets of the Fund,
including any assets attributable to VRDP Shares and TOB Trusts, minus the sum of its accrued liabilities. Does not reflect derivatives or other instruments that may give rise to economic leverage. For a discussion of leveraging techniques utilized
by the Fund, please see The Benefits and Risks of Leveraging and Derivative Financial Instruments. |
|
Market Price and Net Asset Value Per Share Summary
|
|
|
|
|
|
|
|
|
|
|
|
|
|
|
|
|
|
|
|
|
|
|
|
|
|
|
| |
|
07/31/23 |
|
|
07/31/22 |
|
|
Change |
|
|
High |
|
|
Low |
|
| Closing Market Price |
|
$ |
10.08 |
|
|
$ |
10.94 |
|
|
|
(7.86 |
)% |
|
$ |
11.19 |
|
|
$ |
8.95 |
|
| Net Asset Value |
|
|
11.70 |
|
|
|
12.12 |
|
|
|
(3.47 |
) |
|
|
12.25 |
|
|
|
10.35 |
|
GROWTH OF $10,000 INVESTMENT
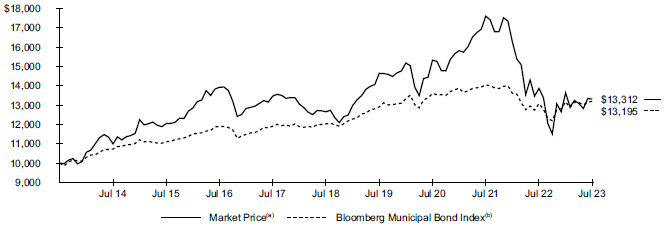
| |
(a) |
Represents the Fund’s closing market price on the NYSE and reflects the reinvestment of dividends and/or
distributions at actual reinvestment prices. |
|
| |
(b) |
An unmanaged index that tracks the U.S. long term tax-exempt bond market, including state and local general obligation
bonds, revenue bonds, pre-refunded bonds, and insured bonds. |
|
|
|
|
| 12 |
|
2 0 2 3 B L A C
K R O C K A N N U A L R E P O R
T T O S H A R E H O L D E R
S |
|
|
|
| Fund Summary as of July 31, 2023 (continued)
|
|
BlackRock MuniYield New York Quality Fund, Inc. (MYN) |
Performance
Returns for the period ended July 31, 2023
were as follows:
|
|
|
|
|
|
|
|
|
|
|
|
|
| |
|
Average Annual Total Returns |
|
|
|
|
|
| |
|
1 Year |
|
|
5 Years |
|
|
10 Years |
|
|
|
|
|
| Fund at NAV(a)(b) |
|
|
0.64 |
% |
|
|
1.11 |
% |
|
|
3.77 |
% |
| Fund at Market
Price(a)(b) |
|
|
(3.94 |
) |
|
|
1.02 |
|
|
|
2.90 |
|
|
|
|
|
| New York Customized Reference
Benchmark(c) |
|
|
1.40 |
|
|
|
1.85 |
|
|
|
N/A |
|
| Bloomberg Municipal Bond Index |
|
|
0.93 |
|
|
|
1.87 |
|
|
|
2.81 |
|
| |
(a) |
All returns reflect reinvestment of dividends and/or distributions at actual reinvestment prices. Performance results
reflect the Fund’s use of leverage, if any. |
|
| |
(b) |
The Fund’s discount to NAV widened during the period, which accounts for the difference between performance based
on market price and performance based on NAV. |
|
| |
(c) |
The New York Customized Reference Benchmark is comprised of the Bloomberg Municipal Bond: New York Exempt Total Return
Index Unhedged (90%) and the New York Bloomberg Municipal Bond: High Yield (non-Investment Grade) Total Return Index (10%). The New York Customized Reference Benchmark commenced on September 30, 2016. |
|
Performance results may include adjustments made for financial reporting purposes in accordance with U.S.
generally accepted accounting principles.
Past performance is not an indication of future results.
The Fund is presenting the performance of one or more indices for informational purposes only. The Fund is actively managed and does not seek to track or
replicate the performance of any index. The index performance shown is not intended to be indicative of the Fund’s investment strategies, portfolio components or past or future performance.
More information about the Fund’s historical performance can be found in the “Closed End Funds” section of blackrock.com.
The following discussion relates to the Fund’s absolute performance based on NAV:
Municipal bonds posted slightly positive returns in the annual period. Bond market performance, in general, was dampened by the combination of high
inflation and continued interest rate increases by the Fed. However, the contribution from income outweighed the impact of falling prices. New York municipals outperformed the national market.
Portfolio income was a large contributor to the Fund’s total return at a time of negative price performance. The Fund’s use of U.S. Treasury
futures to manage interest rate risk added value in the rising-rate environment, with most of the contribution occurring in the first half of the period. (Prices and yields move in opposite directions.) Positions in bonds with 15- to 25-year
maturities contributed, as well.
With respect to credit tiers, AA rated bonds were the largest contributor due to their sizable weighting in both the
New York market and the Fund. BBB rated securities, which consisted mainly of holdings within the transportation and higher education sectors, also performed well. The tax-backed sector was another positive contributor.
On the negative side, positions in low-coupon bonds—particularly in the housing sector—detracted. Holdings in bonds with maturities of 25 years
and longer also detracted, as did the Fund’s allocation to high yield bonds.
The views expressed reflect the opinions of BlackRock as of the
date of this report and are subject to change based on changes in market, economic or other conditions. These views are not intended to be a forecast of future events and are no guarantee of future results.
|
|
|
| Fund Summary as of July 31, 2023 (continued)
|
|
BlackRock MuniYield New York Quality Fund, Inc. (MYN) |
Overview of the Fund’s Total Investments
|
|
|
|
|
| SECTOR ALLOCATION |
|
| |
|
| Sector(a)(b) |
|
Percentage of
Total Investments |
|
| Transportation |
|
|
27.7 |
% |
| County/City/Special District/School District |
|
|
19.7 |
|
| Utilities |
|
|
15.6 |
|
| State |
|
|
13.1 |
|
| Education |
|
|
9.0 |
|
| Housing |
|
|
5.6 |
|
| Health |
|
|
4.7 |
|
| Corporate |
|
|
2.7 |
|
| Tobacco |
|
|
1.9 |
|
|
| CALL/MATURITY SCHEDULE |
|
| |
|
| Calendar Year Ended December 31,(a)(c) |
|
Percentage |
|
| 2023 |
|
|
6.4 |
% |
| 2024 |
|
|
6.4 |
|
| 2025 |
|
|
14.8 |
|
| 2026 |
|
|
3.5 |
|
| 2027 |
|
|
11.2 |
|
|
|
|
|
|
| CREDIT QUALITY ALLOCATION |
|
| |
|
| Credit Rating(a)(d) |
|
Percentage of
Total Investments |
|
| AAA/Aaa |
|
|
10.6 |
% |
| AA/Aa |
|
|
56.8 |
|
| A |
|
|
19.7 |
|
| BBB/Baa |
|
|
5.6 |
|
| BB/Ba |
|
|
0.9 |
|
| B |
|
|
0.1 |
|
| N/R(e) |
|
|
6.3 |
|
| (a) |
Excludes short-term securities. |
|
| (b) |
For Fund compliance purposes, the Fund’s sector classifications refer to one or more of the sector
sub-classifications used by one or more widely recognized market indexes or rating group indexes, and/or as defined by the investment adviser. These definitions may not apply for purposes of this report, which may combine such sector
sub-classifications for reporting ease. |
|
| (c) |
Scheduled maturity dates and/or bonds that are subject to potential calls by issuers over the next five years.
|
|
| (d) |
For financial reporting purposes, credit quality ratings shown above reflect the highest rating assigned by either
S&P Global Ratings or Moody’s Investors Service, Inc. if ratings differ. These rating agencies are independent, nationally recognized statistical rating organizations and are widely used. Investment grade ratings are credit ratings of
BBB/Baa or higher. Below investment grade ratings are credit ratings of BB/Ba or lower. Investments designated N/R are not rated by either rating agency. Unrated investments do not necessarily indicate low credit quality. Credit quality ratings are
subject to change. |
|
| (e) |
The investment adviser evaluates the credit quality of unrated investments based upon certain factors including, but
not limited to, credit ratings for similar investments and financial analysis of sectors and individual investments. Using this approach, the investment adviser has deemed certain of these unrated securities as investment grade quality. As of
July 31, 2023, the market value of unrated securities deemed by the investment adviser to be investment grade represents 1.3% of the Fund’s total investments. |
|
|
|
|
| 14 |
|
2 0 2 3 B L A C
K R O C K A N N U A L R E P O R
T T O S H A R E H O L D E R
S |
|
|
|
| Fund Summary as of July 31, 2023
|
|
BlackRock MuniYield Pennsylvania Quality Fund (MPA) |
Investment Objective
BlackRock MuniYield Pennsylvania
Quality Fund’s (MPA) (the “Fund”) investment objective is to provide shareholders with as high a level of current income exempt from U.S. federal and Pennsylvania income taxes as is consistent with its investment policies and
prudent investment management. The Fund seeks to achieve its investment objective by investing at least 80% of its assets in municipal obligations exempt from U.S. federal income taxes (except that the interest may be subject to the U.S. federal
alternative minimum tax) and Pennsylvania income taxes. Under normal market conditions, the Fund invests primarily in long-term municipal obligations that are investment grade quality, or are considered by the Fund’s investment adviser to be of
comparable quality, at the time of investment. The Fund may invest up to 20% of its managed assets in securities that are rated below investment grade, or are considered by the Fund’s investment adviser to be of comparable quality, at the time
of purchase. The Fund may invest directly in securities or synthetically through the use of derivatives.
No assurance can be given that the
Fund’s investment objective will be achieved.
Fund Information
|
|
|
| |
|
| Symbol on New York Stock Exchange |
|
MPA |
| Initial Offering Date |
|
October 30, 1992 |
| Yield on Closing Market Price as of July 31, 2023 ($
11.69)(a) |
|
3.49% |
| Tax Equivalent Yield(b) |
|
6.22% |
| Current Monthly Distribution per Common
Share(c) |
|
$0.034000 |
| Current Annualized Distribution per Common
Share(c) |
|
$0.408000 |
| Leverage as of July 31, 2023(d) |
|
36% |
| |
(a) |
Yield on closing market price is calculated by dividing the current annualized distribution per share by the closing
market price. Past performance is not an indication of future results. |
|
| |
(b) |
Tax equivalent yield assumes the maximum marginal U.S. federal and state tax rate of 43.87%, which includes the 3.8%
Medicare tax. Actual tax rates will vary based on income, exemptions and deductions. Lower taxes will result in lower tax equivalent yields. |
|
| |
(c) |
The distribution rate is not constant and is subject to change. A portion of the distribution may be deemed a return of
capital or net realized gain. |
|
| |
(d) |
Represents VRDP Shares and TOB Trusts as a percentage of total managed assets, which is the total assets of the Fund,
including any assets attributable to VRDP Shares and TOB Trusts, minus the sum of its accrued liabilities. Does not reflect derivatives or other instruments that may give rise to economic leverage. For a discussion of leveraging techniques utilized
by the Fund, please see The Benefits and Risks of Leveraging and Derivative Financial Instruments. |
|
Market Price and Net Asset Value Per Share Summary
|
|
|
|
|
|
|
|
|
|
|
|
|
|
|
|
|
|
|
|
|
|
|
|
|
|
|
| |
|
07/31/23 |
|
|
07/31/22 |
|
|
Change |
|
|
High |
|
|
Low |
|
| Closing Market Price |
|
$ |
11.69 |
|
|
$ |
13.54 |
|
|
|
(13.66 |
)% |
|
$ |
14.13 |
|
|
$ |
10.23 |
|
| Net Asset Value |
|
|
13.09 |
|
|
|
13.92 |
|
|
|
(5.96 |
) |
|
|
14.03 |
|
|
|
11.93 |
|
GROWTH OF $10,000 INVESTMENT
| |
(a) |
Represents the Fund’s closing market price on the NYSE and reflects the reinvestment of dividends and/or
distributions at actual reinvestment prices. |
|
| |
(b) |
An unmanaged index that tracks the U.S. long term tax-exempt bond market, including state and local general obligation
bonds, revenue bonds, pre-refunded bonds, and insured bonds. |
|
|
|
|
| Fund Summary as of July 31, 2023 (continued)
|
|
BlackRock MuniYield Pennsylvania Quality Fund (MPA) |
Performance
Returns for the period ended July 31, 2023 were as follows:
|
|
|
|
|
|
|
|
|
|
|
|
|
| |
|
Average Annual Total Returns |
|
|
|
|
|
| |
|
1 Year |
|
|
5 Years |
|
|
10 Years |
|
|
|
|
|
| Fund at NAV(a)(b) |
|
|
(2.05 |
)% |
|
|
1.30 |
% |
|
|
4.02 |
% |
| Fund at Market
Price(a)(b) |
|
|
(10.08 |
) |
|
|
1.87 |
|
|
|
3.99 |
|
|
|
|
|
| Pennsylvania Customized Reference
Benchmark(c) |
|
|
0.70 |
|
|
|
2.07 |
|
|
|
N/A |
|
| Bloomberg Municipal Bond Index |
|
|
0.93 |
|
|
|
1.87 |
|
|
|
2.81 |
|
| |
(a) |
All returns reflect reinvestment of dividends and/or distributions at actual reinvestment prices. Performance results
reflect the Fund’s use of leverage, if any. |
|
| |
(b) |
The Fund’s discount to NAV widened during the period, which accounts for the difference between performance based
on market price and performance based on NAV. |
|
| |
(c) |
The Pennsylvania Customized Reference Benchmark is comprised of the Bloomberg Pennsylvania Total Return Index Unhedged
(90%) and the Pennsylvania Bloomberg Municipal Bond: High Yield (non-Investment Grade) Total Return Index (10%). The Pennsylvania Customized Reference Benchmark commenced on September 30, 2016. |
|
Performance results may include adjustments made for financial reporting purposes in accordance with U.S.
generally accepted accounting principles.
Past performance is not an indication of future results.
The Fund is presenting the performance of one or more indices for informational purposes only. The Fund is actively managed and does not seek to track or
replicate the performance of any index. The index performance shown is not intended to be indicative of the Fund’s investment strategies, portfolio components or past or future performance.
More information about the Fund’s historical performance can be found in the “Closed End Funds” section of blackrock.com.
The following discussion relates to the Fund’s absolute performance based on NAV:
Municipal bonds posted slightly positive returns in the annual period. Bond market performance, in general, was dampened by the combination of high
inflation and continued interest rate increases by the Fed. However, the contribution from income outweighed the impact of falling prices. Pennsylvania municipals slightly underperformed the national market.
The Fund’s use of U.S. Treasury futures to manage interest rate risk was a key contributor to performance early in the reporting period when the Fed
was aggressively raising rates to combat inflation. The investment adviser closed out this position before the end of the period given that yields had already risen significantly.
On a sector basis, holdings in tax-backed local and transportation issues made the largest contribution to absolute performance. Positions in A and BBB
rated bonds also contributed positively, as did holdings in securities with higher coupons.
Positions in the housing and school district sectors were
the largest detractors from performance, followed by healthcare, education and tax-backed state. Holdings in AA rated debt and high-yield issues detracted. Bonds with maturities of 20 years and above also hurt results. In addition, the Fund was
adversely affected by the investment adviser’s effort to reduce duration at an inopportune time early in the period, which reduced the benefit of the market’s rebound in early 2023.
The Fund’s cash weighting was above typical levels at the close of the period, which represented a defensive positioning.
The views expressed reflect the opinions of BlackRock as of the date of this report and are subject to change based on changes in market, economic or
other conditions. These views are not intended to be a forecast of future events and are no guarantee of future results.
|
|
|
| 16 |
|
2 0 2 3 B L A C
K R O C K A N N U A L R E P O R
T T O S H A R E H O L D E R
S |
|
|
|
| Fund Summary as of July 31, 2023 (continued)
|
|
BlackRock MuniYield Pennsylvania Quality Fund (MPA) |
Overview of the Fund’s Total Investments
|
|
|
|
|
| SECTOR ALLOCATION |
|
| |
|
| Sector(a)(b) |
|
Percentage of
Total Investments |
|
| Health |
|
|
23.3 |
% |
| Transportation |
|
|
20.1 |
|
| Education |
|
|
19.2 |
|
| County/City/Special District/School District |
|
|
16.1 |
|
| Utilities |
|
|
6.0 |
|
| State |
|
|
6.0 |
|
| Tobacco |
|
|
4.1 |
|
| Housing |
|
|
3.3 |
|
| Corporate |
|
|
1.9 |
|
|
| CALL/MATURITY SCHEDULE |
|
| |
|
| Calendar Year Ended December 31,(a)(c) |
|
Percentage |
|
| 2023 |
|
|
5.5 |
% |
| 2024 |
|
|
7.0 |
|
| 2025 |
|
|
11.5 |
|
| 2026 |
|
|
7.7 |
|
| 2027 |
|
|
9.6 |
|
|
|
|
|
|
| CREDIT QUALITY ALLOCATION |
|
| |
|
| Credit Rating(a)(d) |
|
Percentage of
Total Investments |
|
| AAA/Aaa |
|
|
1.2 |
% |
| AA/Aa |
|
|
47.6 |
|
| A |
|
|
30.1 |
|
| BBB/Baa |
|
|
8.2 |
|
| BB/Ba |
|
|
1.3 |
|
| B |
|
|
0.7 |
|
| N/R(e) |
|
|
10.9 |
|
| (a) |
Excludes short-term securities. |
|
| (b) |
For Fund compliance purposes, the Fund’s sector classifications refer to one or more of the sector
sub-classifications used by one or more widely recognized market indexes or rating group indexes, and/or as defined by the investment adviser. These definitions may not apply for purposes of this report, which may combine such sector
sub-classifications for reporting ease. |
|
| (c) |
Scheduled maturity dates and/or bonds that are subject to potential calls by issuers over the next five years.
|
|
| (d) |
For financial reporting purposes, credit quality ratings shown above reflect the highest rating assigned by either
S&P Global Ratings or Moody’s Investors Service, Inc. if ratings differ. These rating agencies are independent, nationally recognized statistical rating organizations and are widely used. Investment grade ratings are credit ratings of
BBB/Baa or higher. Below investment grade ratings are credit ratings of BB/Ba or lower. Investments designated N/R are not rated by either rating agency. Unrated investments do not necessarily indicate low credit quality. Credit quality ratings are
subject to change. |
|
| (e) |
The investment adviser evaluates the credit quality of unrated investments based upon certain factors including, but
not limited to, credit ratings for similar investments and financial analysis of sectors and individual investments. Using this approach, the investment adviser has deemed certain of these unrated securities as investment grade quality. As of
July 31, 2023, the market value of unrated securities deemed by the investment adviser to be investment grade represents less than 1.0% of the Fund’s total investments. |
|
|
|
|
| Fund Summary as of July 31, 2023
|
|
BlackRock MuniYield Quality Fund III, Inc. (MYI) |
Investment Objective
BlackRock MuniYield Quality Fund III,
Inc.’s (MYI) (the “Fund”) investment objective is to provide shareholders with as high a level of current income exempt from U.S. federal income taxes as is consistent with its investment policies and prudent investment
management. The Fund seeks to achieve its investment objective by investing at least 80% of its assets in municipal obligations exempt from U.S. federal income taxes (except that the interest may be subject to the U.S. federal alternative minimum
tax). Under normal market conditions, the Fund invests primarily in long-term municipal obligations that are investment grade quality, or are considered by the Fund’s investment adviser to be of comparable quality, at the time of investment.
The Fund may invest up to 20% of its managed assets in securities that are rated below investment grade, or are considered by the Fund’s investment adviser to be of comparable quality, at the time of purchase. The Fund may invest directly in
securities or synthetically through the use of derivatives.
No assurance can be given that the Fund’s investment objective will be achieved.
Fund Information
|
|
|
| |
|
| Symbol on New York Stock Exchange |
|
MYI |
| Initial Offering Date |
|
March 27, 1992 |
| Yield on Closing Market Price as of July 31, 2023 ($
11.13)(a) |
|
4.37% |
| Tax Equivalent Yield(b) |
|
7.38% |
| Current Monthly Distribution per Common
Share(c) |
|
$0.040500 |
| Current Annualized Distribution per Common
Share(c) |
|
$0.486000 |
| Leverage as of July 31, 2023(d) |
|
38% |
| |
(a) |
Yield on closing market price is calculated by dividing the current annualized distribution per share by the closing
market price. Past performance is not an indication of future results. |
|
| |
(b) |
Tax equivalent yield assumes the maximum marginal U.S. federal tax rate of 40.8%, which includes the 3.8% Medicare tax.
Actual tax rates will vary based on income, exemptions and deductions. Lower taxes will result in lower tax equivalent yields. |
|
| |
(c) |
The distribution rate is not constant and is subject to change. A portion of the distribution may be deemed a return of
capital or net realized gain. |
|
| |
(d) |
Represents VRDP Shares and TOB Trusts as a percentage of total managed assets, which is the total assets of the Fund,
including any assets attributable to VRDP Shares and TOB Trusts, minus the sum of its accrued liabilities. Does not reflect derivatives or other instruments that may give rise to economic leverage. For a discussion of leveraging techniques utilized
by the Fund, please see The Benefits and Risks of Leveraging and Derivative Financial Instruments. |
|
Market Price and Net Asset Value Per Share Summary
|
|
|
|
|
|
|
|
|
|
|
|
|
|
|
|
|
|
|
|
|
| |
|
07/31/23 |
|
|
07/31/22 |
|
|
Change |
|
|
High |
|
|
Low |
|
| Closing Market Price |
|
$ |
11.13 |
|
|
$ |
12.24 |
|
|
|
(9.07 |
)% |
|
$ |
12.38 |
|
|
$ |
9.99 |
|
| Net Asset Value |
|
|
12.51 |
|
|
|
13.04 |
|
|
|
(4.06 |
) |
|
|
13.14 |
|
|
|
11.26 |
|
GROWTH OF $10,000 INVESTMENT
| |
(a) |
Represents the Fund’s closing market price on the NYSE and reflects the reinvestment of dividends and/or
distributions at actual reinvestment prices. |
|
| |
(b) |
An unmanaged index that tracks the U.S. long term tax-exempt bond market, including state and local general obligation
bonds, revenue bonds, pre-refunded bonds, and insured bonds. |
|
|
|
|
| 18 |
|
2 0 2 3 B L A C
K R O C K A N N U A L R E P O R
T T O S H A R E H O L D E R
S |
|
|
|
| Fund Summary as of July 31, 2023 (continued)
|
|
BlackRock MuniYield Quality Fund III, Inc. (MYI) |
Performance
Returns for the period ended July 31, 2023
were as follows:
|
|
|
|
|
|
|
|
|
|
|
|
|
| |
|
Average Annual Total Returns |
|
|
|
|
|
| |
|
1 Year |
|
|
5 Years |
|
|
10 Years |
|
|
|
|
|
| Fund at NAV(a)(b) |
|
|
0.48 |
% |
|
|
2.25 |
% |
|
|
4.46 |
% |
| Fund at Market
Price(a)(b) |
|
|
(4.76 |
) |
|
|
2.22 |
|
|
|
3.90 |
|
|
|
|
|
| National Customized Reference
Benchmark(c) |
|
|
0.82 |
|
|
|
1.98 |
|
|
|
N/A |
|
| Bloomberg Municipal Bond Index |
|
|
0.93 |
|
|
|
1.87 |
|
|
|
2.81 |
|
| |
(a) |
All returns reflect reinvestment of dividends and/or distributions at actual reinvestment prices. Performance results
reflect the Fund’s use of leverage, if any. |
|
| |
(b) |
The Fund’s discount to NAV widened during the period, which accounts for the difference between performance based
on market price and performance based on NAV. |
|
| |
(c) |
The National Customized Reference Benchmark is comprised of the Bloomberg Municipal Bond Index Total Return Index Value
Unhedged (90%) and the Bloomberg Municipal Bond: High Yield (non-Investment Grade) Total Return Index (10%). The National Customized Reference Benchmark commenced on September 30, 2016. |
|
Performance results may include adjustments made for financial reporting purposes in accordance with U.S.
generally accepted accounting principles.
Past performance is not an indication of future results.
The Fund is presenting the performance of one or more indices for informational purposes only. The Fund is actively managed and does not seek to track or
replicate the performance of any index. The index performance shown is not intended to be indicative of the Fund’s investment strategies, portfolio components or past or future performance.
More information about the Fund’s historical performance can be found in the “Closed End Funds” section of blackrock.com.
The following discussion relates to the Fund’s absolute performance based on NAV:
Municipal bonds posted slightly positive returns in the annual period. Bond market performance, in general, was dampened by the combination of high
inflation and continued interest rate increases by the Fed. However, the contribution from income outweighed the impact of falling prices.
Security
selection in the tax-backed state and transportation sectors made small contributions to performance. Holdings in the 15- to 20-year maturity range, which outperformed the broader market, also contributed. With respect to credit tiers, positions in
A and BBB rated bonds helped results. The Fund’s use of U.S. Treasury futures to mitigate interest rate risk was a further contributor.
The
Fund’s use of leverage, which amplified the effect of falling prices, detracted from returns. In addition, rising rates have increased the cost of using leverage. Positions in the five- to seven-year maturity range and bonds rated below
investment grade also hurt performance.
The views expressed reflect the opinions of BlackRock as of the date of this report and are subject to change
based on changes in market, economic or other conditions. These views are not intended to be a forecast of future events and are no guarantee of future results.
|
|
|
| Fund Summary as of July 31, 2023 (continued)
|
|
BlackRock MuniYield Quality Fund III, Inc. (MYI) |
Overview of the Fund’s Total Investments
|
|
|
|
|
| SECTOR ALLOCATION |
|
| |
|
| Sector(a)(b) |
|
Percentage of
Total Investments |
|
| Transportation |
|
|
28.4 |
% |
| County/City/Special District/School District |
|
|
20.3 |
|
| State |
|
|
16.9 |
|
| Health |
|
|
10.0 |
|
| Utilities |
|
|
9.2 |
|
| Education |
|
|
9.1 |
|
| Tobacco |
|
|
2.3 |
|
| Corporate |
|
|
1.9 |
|
| Housing |
|
|
1.9 |
|
|
| CALL/MATURITY SCHEDULE |
|
| |
|
| Calendar Year Ended December 31,(a)(c) |
|
Percentage |
|
| 2023 |
|
|
5.9 |
% |
| 2024 |
|
|
5.4 |
|
| 2025 |
|
|
6.6 |
|
| 2026 |
|
|
5.4 |
|
| 2027 |
|
|
10.1 |
|
|
|
|
|
|
| CREDIT QUALITY ALLOCATION |
|
| |
|
| Credit Rating(a)(d) |
|
Percentage of
Total Investments |
|
| AAA/Aaa |
|
|
7.1 |
% |
| AA/Aa |
|
|
50.4 |
|
| A |
|
|
24.6 |
|
| BBB/Baa |
|
|
7.9 |
|
| BB/Ba |
|
|
1.6 |
|
| B |
|
|
0.3 |
|
| N/R(e) |
|
|
8.1 |
|
| (a) |
Excludes short-term securities. |
|
| (b) |
For Fund compliance purposes, the Fund’s sector classifications refer to one or more of the sector
sub-classifications used by one or more widely recognized market indexes or rating group indexes, and/or as defined by the investment adviser. These definitions may not apply for purposes of this report, which may combine such sector
sub-classifications for reporting ease. |
|
| (c) |
Scheduled maturity dates and/or bonds that are subject to potential calls by issuers over the next five years.
|
|
| (d) |
For financial reporting purposes, credit quality ratings shown above reflect the highest rating assigned by either
S&P Global Ratings or Moody’s Investors Service, Inc. if ratings differ. These rating agencies are independent, nationally recognized statistical rating organizations and are widely used. Investment grade ratings are credit ratings of
BBB/Baa or higher. Below investment grade ratings are credit ratings of BB/Ba or lower. Investments designated N/R are not rated by either rating agency. Unrated investments do not necessarily indicate low credit quality. Credit quality ratings are
subject to change. |
|
| (e) |
The investment adviser evaluates the credit quality of unrated investments based upon certain factors including, but
not limited to, credit ratings for similar investments and financial analysis of sectors and individual investments. Using this approach, the investment adviser has deemed certain of these unrated securities as investment grade quality. As of
July 31, 2023, the market value of unrated securities deemed by the investment adviser to be investment grade represents less than 1.0% of the Fund’s total investments. |
|
|
|
|
| 20 |
|
2 0 2 3 B L A C
K R O C K A N N U A L R E P O R
T T O S H A R E H O L D E R
S |
|
|
|
| Fund Summary as of July 31, 2023
|
|
BlackRock New York Municipal Income Trust (BNY) |
Investment Objective
BlackRock NewYork Municipal
IncomeTrust’s (BNY) (the “Fund”) investment objective is to provide current income exempt from regular U.S. federal income tax and New York State and New York City personal income taxes. The Fund seeks to achieve its investment
objective by investing primarily in municipal bonds exempt from U.S. federal income taxes (except that the interest may be subject to the federal alternative minimum tax) and New York State and New York City personal income taxes. The Fund invests
at least 80% of its assets in municipal bonds that are investment grade quality, or are considered by the Fund’s investment adviser to be of comparable quality, at the time of investment. The Fund may invest directly in securities or
synthetically through the use of derivatives.
No assurance can be given that the Fund’s investment objective will be achieved.
Fund Information
|
|
|
| |
|
| Symbol on New York Stock Exchange |
|
BNY |
| Initial Offering Date |
|
July 27, 2001 |
| Yield on Closing Market Price as of July 31, 2023
($10.35)(a) |
|
3.54% |
| Tax Equivalent Yield(b) |
|
7.33% |
| Current Monthly Distribution per Common
Share(c) |
|
$0.030500 |
| Current Annualized Distribution per Common
Share(c) |
|
$0.366000 |
| Leverage as of July 31, 2023(d) |
|
39% |
| |
(a) |
Yield on closing market price is calculated by dividing the current annualized distribution per share by the closing
market price. Past performance is not an indication of future results. |
|
| |
(b) |
Tax equivalent yield assumes the maximum marginal U.S. federal and state tax rate of 51.7%, which includes the 3.8%
Medicare tax. Actual tax rates will vary based on income, exemptions and deductions. Lower taxes will result in lower tax equivalent yields. |
|
| |
(c) |
The distribution rate is not constant and is subject to change. A portion of the distribution may be deemed a return of
capital or net realized gain. |
|
| |
(d) |
Represents VRDP Shares and TOB Trusts as a percentage of total managed assets, which is the total assets of the Fund,
including any assets attributable to VRDP Shares and TOB Trusts, minus the sum of its accrued liabilities. Does not reflect derivatives or other instruments that may give rise to economic leverage. For a discussion of leveraging techniques utilized
by the Fund, please see The Benefits and Risks of Leveraging and Derivative Financial Instruments. |
|
Market Price and Net Asset Value Per Share Summary
|
|
|
|
|
|
|
|
|
|
|
|
|
|
|
|
|
|
|
|
|
| |
|
07/31/23 |
|
|
07/31/22 |
|
|
Change |
|
|
High |
|
|
Low |
|
| Closing Market Price |
|
$ |
10.35 |
|
|
$ |
11.46 |
|
|
|
(9.69 |
)% |
|
$ |
11.81 |
|
|
$ |
9.12 |
|
| Net Asset Value |
|
|
12.05 |
|
|
|
12.51 |
|
|
|
(3.68 |
) |
|
|
12.65 |
|
|
|
10.48 |
|
GROWTH OF $10,000 INVESTMENT
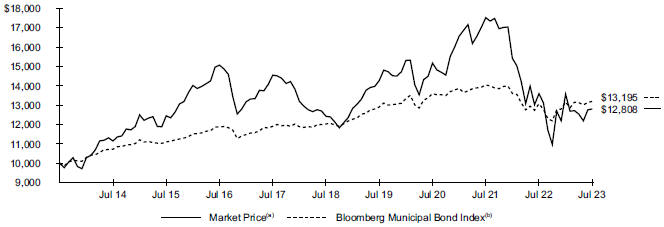
| |
(a) |
Represents the Fund’s closing market price on the NYSE and reflects the reinvestment of dividends and/or
distributions at actual reinvestment prices. |
|
| |
(b) |
An unmanaged index that tracks the U.S. long term tax-exempt bond market, including state and local general obligation
bonds, revenue bonds, pre-refunded bonds, and insured bonds. |
|
|
|
|
| Fund Summary as of July 31, 2023 (continued)
|
|
BlackRock New York Municipal Income Trust (BNY) |
Performance
Returns for the period ended July 31, 2023
were as follows:
|
|
|
|
|
|
|
|
|
|
|
|
|
| |
|
Average Annual Total Returns |
|
|
|
|
|
| |
|
1 Year |
|
|
5 Years |
|
|
10 Years |
|
|
|
|
|
| Fund at NAV(a)(b) |
|
|
0.46 |
% |
|
|
0.70 |
% |
|
|
3.83 |
% |
| Fund at Market
Price(a)(b) |
|
|
(5.81 |
) |
|
|
0.60 |
|
|
|
2.50 |
|
|
|
|
|
| New York Customized Reference
Benchmark(c) |
|
|
1.40 |
|
|
|
1.85 |
|
|
|
N/A |
|
| Bloomberg Municipal Bond Index |
|
|
0.93 |
|
|
|
1.87 |
|
|
|
2.81 |
|
| |
(a) |
All returns reflect reinvestment of dividends and/or distributions at actual reinvestment prices. Performance results
reflect the Fund’s use of leverage, if any. |
|
| |
(b) |
The Fund’s discount to NAV widened during the period, which accounts for the difference between performance based
on market price and performance based on NAV. |
|
| |
(c) |
The New York Customized Reference Benchmark is comprised of the Bloomberg Municipal Bond: New York Exempt Total Return
Index Unhedged (90%) and the New York Bloomberg Municipal Bond: High Yield (non-Investment Grade) Total Return Index (10%). The New York Customized Reference Benchmark commenced on September 30, 2016. |
|
Performance results may include adjustments made for financial reporting purposes in accordance with U.S.
generally accepted accounting principles.
Past performance is not an indication of future results.
The Fund is presenting the performance of one or more indices for informational purposes only. The Fund is actively managed and does not seek to track or
replicate the performance of any index. The index performance shown is not intended to be indicative of the Fund’s investment strategies, portfolio components or past or future performance.
More information about the Fund’s historical performance can be found in the “Closed End Funds” section of blackrock.com.
The following discussion relates to the Fund’s absolute performance based on NAV:
Municipal bonds posted slightly positive returns in the annual period. Bond market performance, in general, was dampened by the combination of high
inflation and continued interest rate increases by the Fed. However, the contribution from income outweighed the impact of falling prices. New York municipals outperformed the national market.
Portfolio income was a large contributor to the Fund’s total return at a time of negative price performance. The Fund’s use of U.S. Treasury
futures to manage interest rate risk added value in the rising-rate environment, with most of the contribution occurring in the first half of the period. (Prices and yields move in opposite directions.) Positions in bonds with 15- to 25-year
maturities contributed, as well.
With respect to credit tiers, AA rated bonds were the largest contributor due to their sizable weighting in both the
New York market and the Fund. BBB rated securities, which consisted mainly of holdings within the transportation and higher education sectors, also performed well. The tax-backed sector was another positive contributor.
On the negative side, positions in low-coupon bonds—particularly in the housing sector—detracted. Holdings in bonds with maturities of 25 years
and longer also detracted, as did the Fund’s allocation to high yield bonds.
The views expressed reflect the opinions of BlackRock as of the
date of this report and are subject to change based on changes in market, economic or other conditions. These views are not intended to be a forecast of future events and are no guarantee of future results.
|
|
|
| 22 |
|
2 0 2 3 B L A C
K R O C K A N N U A L R E P O R
T T O S H A R E H O L D E R
S |
|
|
|
| Fund Summary as of July 31, 2023 (continued)
|
|
BlackRock New York Municipal Income Trust (BNY) |
Overview of the Fund’s Total Investments
|
|
|
|
|
| SECTOR ALLOCATION |
|
| |
|
| Sector(a)(b) |
|
Percentage of
Total Investments |
|
| Transportation |
|
|
23.9 |
% |
| County/City/Special District/School District |
|
|
21.4 |
|
| Utilities |
|
|
15.8 |
|
| Education |
|
|
12.4 |
|
| State |
|
|
11.6 |
|
| Health |
|
|
5.2 |
|
| Housing |
|
|
4.0 |
|
| Corporate |
|
|
3.4 |
|
| Tobacco |
|
|
2.3 |
|
|
| CALL/MATURITY SCHEDULE |
|
| |
|
| Calendar Year Ended December 31,(a)(c) |
|
Percentage |
|
| 2023 |
|
|
7.6 |
% |
| 2024 |
|
|
8.0 |
|
| 2025 |
|
|
9.2 |
|
| 2026 |
|
|
4.7 |
|
| 2027 |
|
|
6.9 |
|
|
|
|
|
|
| CREDIT QUALITY ALLOCATION |
|
| |
|
| Credit Rating(a)(d) |
|
Percentage of
Total Investments |
|
| AAA/Aaa |
|
|
8.0 |
% |
| AA/Aa |
|
|
51.8 |
|
| A |
|
|
23.1 |
|
| BBB/Baa |
|
|
7.1 |
|
| BB/Ba |
|
|
0.7 |
|
| B |
|
|
1.2 |
|
| N/R(e) |
|
|
8.1 |
|
| (a) |
Excludes short-term securities. |
|
| (b) |
For Fund compliance purposes, the Fund’s sector classifications refer to one or more of the sector
sub-classifications used by one or more widely recognized market indexes or rating group indexes, and/or as defined by the investment adviser. These definitions may not apply for purposes of this report, which may combine such sector
sub-classifications for reporting ease. |
|
| (c)
|
Scheduled maturity dates and/or bonds that are subject to potential calls by issuers over the next five years.
|
|
| (d) |
For financial reporting purposes, credit quality ratings shown above reflect the highest rating assigned by either
S&P Global Ratings or Moody’s Investors Service, Inc. if ratings differ. These rating agencies are independent, nationally recognized statistical rating organizations and are widely used. Investment grade ratings are credit ratings of
BBB/Baa or higher. Below investment grade ratings are credit ratings of BB/Ba or lower. Investments designated N/R are not rated by either rating agency. Unrated investments do not necessarily indicate low credit quality. Credit quality ratings are
subject to change. |
|
| (e) |
The investment adviser evaluates the credit quality of unrated investments based upon certain factors including, but
not limited to, credit ratings for similar investments and financial analysis of sectors and individual investments. Using this approach, the investment adviser has deemed certain of these unrated securities as investment grade quality. As of
July 31, 2023, the market value of unrated securities deemed by the investment adviser to be investment grade represents 1.6% of the Fund’s total investments. |
|
|
|
|
| Schedule of Investments
July 31, 2023 |
|
BlackRock MuniHoldings New Jersey Quality Fund, Inc. (MUJ)
(Percentages shown are based on Net Assets) |
|
|
|
|
|
|
|
|
|
| Security |
|
Par
(000) |
|
|
Value |
|
|
|
|
| Municipal Bonds |
|
|
|
|
|
|
|
|
|
|
|
| New Jersey — 127.4% |
|
|
|
|
|
|
|
|
|
| Corporate — 7.3% |
|
|
|
|
|
|
|
|
| New Jersey Economic Development Authority, ARB |
|
|
|
|
|
|
|
|
| Series A, AMT, 5.63%, 11/15/30 |
|
$ |
1,730 |
|
|
$ |
1,752,854 |
|
| Series B, AMT, 5.63%, 11/15/30 |
|
|
6,900 |
|
|
|
6,968,400 |
|
| New Jersey Economic Development Authority, RB |
|
|
|
|
|
|
|
|
| Series A, (NPFGC), 5.25%, 07/01/25(a) |
|
|
950 |
|
|
|
984,576 |
|
| Series A, (NPFGC), 5.25%, 07/01/26(a) |
|
|
1,415 |
|
|
|
1,499,065 |
|
| AMT, 4.00%, 08/01/59 |
|
|
1,000 |
|
|
|
857,613 |
|
| New Jersey Economic Development Authority, Refunding RB |
|
|
|
|
|
|
|
|
| 3.38%, 04/01/38 |
|
|
4,040 |
|
|
|
3,626,607 |
|
| 3.50%, 04/01/42 |
|
|
3,030 |
|
|
|
2,636,836 |
|
| AMT, 3.00%, 08/01/41 |
|
|
21,580 |
|
|
|
16,520,353 |
|
| AMT, 3.00%, 08/01/43 |
|
|
21,400 |
|
|
|
16,521,399 |
|
|
|
|
|
|
|
|
|
|
|
|
|
|
|
|
|
|
|
|
51,367,703 |
|
|
| County/City/Special District/School District — 17.1% |
|
| City of Bayonne New Jersey, Refunding GO, (BAM SAW), 5.00%, 07/01/26(b) |
|
|
2,425 |
|
|
|
2,563,092 |
|
| Clifton Board of Education, GO, (AGM SCH BD RES FD), 2.25%, 08/15/46 |
|
|
6,150 |
|
|
|
4,046,909 |
|
| Clifton Board Of Education, GO, (AGM SCH BD RES FD), 2.00%, 08/15/41 |
|
|
6,150 |
|
|
|
4,350,399 |
|
| County of Essex New Jersey, GO, Series B, 3.00%, 09/01/46 |
|
|
1,700 |
|
|
|
1,418,446 |
|
| County of Middlesex New Jersey, Refunding COP, 5.00%, 10/15/31 |
|
|
2,840 |
|
|
|
3,135,357 |
|
| Essex County Improvement Authority, Refunding RB |
|
|
|
|
|
|
|
|
| (NPFGC GTD), 5.50%, 10/01/27 |
|
|
250 |
|
|
|
276,225 |
|
| (NPFGC GTD), 5.50%, 10/01/28 |
|
|
9,380 |
|
|
|
10,603,884 |
|
| (NPFGC GTD), 5.50%, 10/01/29 |
|
|
8,505 |
|
|
|
9,813,273 |
|
| Ewing Township Board of Education, GO |
|
|
|
|
|
|
|
|
| 4.00%, 07/15/38 |
|
|
2,660 |
|
|
|
2,726,061 |
|
| 4.00%, 07/15/39 |
|
|
2,320 |
|
|
|
2,371,525 |
|
| Hudson County Improvement Authority, RB |
|
|
|
|
|
|
|
|
| 5.00%, 05/01/46 |
|
|
5,655 |
|
|
|
5,834,150 |
|
| Series A-1, (NPFGC GTD), 0.00%, 12/15/32(c) |
|
|
1,000 |
|
|
|
741,531 |
|
| Mercer County Improvement Authority, RB, 5.00%, 09/01/40 |
|
|
2,480 |
|
|
|
2,569,989 |
|
| Middlesex County Improvement Authority, RB, Series B, 6.25%, 01/01/37(d)(e) |
|
|
2,350 |
|
|
|
24,135 |
|
| Monroe Township Board of Education/Middlesex County, Refunding GO, 5.00%, 03/01/25(b) |
|
|
2,750 |
|
|
|
2,825,306 |
|
| New Jersey Economic Development Authority, RB |
|
|
|
|
|
|
|
|
| 5.00%, 12/15/28(b) |
|
|
6,305 |
|
|
|
7,034,526 |
|
| 5.00%, 06/15/43 |
|
|
10,690 |
|
|
|
11,237,146 |
|
| Series B, AMT, 6.50%, 04/01/31 |
|
|
3,690 |
|
|
|
3,812,084 |
|
| New Jersey Economic Development Authority, Refunding SAB, 6.50%, 04/01/28 |
|
|
3,972 |
|
|
|
4,085,220 |
|
| Newark Board of Education, Refunding GO, Sustainability Bonds, (BAM SCH BD RES FD), 3.00%, 07/15/42 |
|
|
1,500 |
|
|
|
1,231,728 |
|
| Township of Irvington New Jersey, Refunding GO, Series A, (AGM), 5.00%, 07/15/24(b) |
|
|
1,175 |
|
|
|
1,193,526 |
|
| Union County Utilities Authority, Refunding RB, Series A, AMT, (GTD), 5.25%, 12/01/31 |
|
|
37,810 |
|
|
|
37,850,079 |
|
|
|
|
|
|
|
|
|
|
|
|
|
|
|
|
|
|
|
|
119,744,591 |
|
|
|
|
|
|
|
|
|
|
| Security |
|
Par
(000) |
|
|
Value |
|
|
|
|
| Education — 21.3% |
|
|
|
|
|
|
| Atlantic County Improvement Authority, RB, Series A, (AGM), 4.00%, 07/01/46 |
|
$ |
2,250 |
|
|
$ |
2,224,490 |
|
| Camden County Improvement Authority, RB, 6.00%, 06/15/52 |
|
|
780 |
|
|
|
811,885 |
|
| Gloucester County Improvement Authority, RB, 5.00%, 07/01/44 |
|
|
1,985 |
|
|
|
2,023,043 |
|
| Middlesex County Improvement Authority, RB, 5.00%, 08/15/53 |
|
|
3,125 |
|
|
|
3,417,031 |
|
| New Jersey Economic Development Authority, RB |
|
|
|
|
|
|
|
|
| 6.00%, 10/01/33 |
|
|
4,520 |
|
|
|
4,530,247 |
|
| Series A, 5.00%, 07/01/27(f) |
|
|
275 |
|
|
|
267,704 |
|
| Series A, 5.13%, 11/01/29(f) |
|
|
150 |
|
|
|
143,903 |
|
| Series A, 5.00%, 01/01/35 |
|
|
2,000 |
|
|
|
1,918,798 |
|
| Series A, 5.25%, 07/01/37(f) |
|
|
1,030 |
|
|
|
941,591 |
|
| Series A, 5.00%, 07/01/38 |
|
|
350 |
|
|
|
354,964 |
|
| Series A, 6.25%, 11/01/38(f) |
|
|
440 |
|
|
|
440,282 |
|
| Series A, 5.00%, 07/01/47 |
|
|
1,235 |
|
|
|
1,122,939 |
|
| Series A, 5.38%, 07/01/47(f) |
|
|
1,685 |
|
|
|
1,463,952 |
|
| Series A, 5.00%, 12/01/48 |
|
|
4,475 |
|
|
|
4,478,401 |
|
| Series A, 5.00%, 06/15/49(f) |
|
|
970 |
|
|
|
873,437 |
|
| Series A, 5.00%, 07/01/50 |
|
|
905 |
|
|
|
905,467 |
|
| Series A, 6.50%, 11/01/52(f) |
|
|
2,490 |
|
|
|
2,479,081 |
|
| Series A, 5.00%, 06/15/54(f) |
|
|
730 |
|
|
|
643,750 |
|
| Series A, 5.25%, 11/01/54(f) |
|
|
4,040 |
|
|
|
3,435,685 |
|
| Series WW, 5.00%, 06/15/25(b) |
|
|
8,615 |
|
|
|
8,899,942 |
|
| Series WW, 5.25%, 06/15/25(b) |
|
|
8,755 |
|
|
|
9,084,896 |
|
| New Jersey Economic Development Authority, Refunding RB |
|
|
|
|
|
|
|
|
| (AGM), 5.00%, 06/01/37 |
|
|
6,270 |
|
|
|
6,506,467 |
|
| (AGM), 5.00%, 06/01/42 |
|
|
810 |
|
|
|
832,150 |
|
| Series A, 4.25%, 09/01/27(f) |
|
|
160 |
|
|
|
156,013 |
|
| Series A, 5.63%, 08/01/34(f) |
|
|
630 |
|
|
|
632,360 |
|
| Series A, 5.00%, 09/01/37(f) |
|
|
805 |
|
|
|
770,838 |
|
| Series A, 5.88%, 08/01/44(f) |
|
|
1,070 |
|
|
|
1,070,613 |
|
| Series A, 6.00%, 08/01/49(f) |
|
|
555 |
|
|
|
555,356 |
|
| Series A, 5.13%, 09/01/52(f) |
|
|
1,700 |
|
|
|
1,526,168 |
|
| New Jersey Educational Facilities Authority, RB |
|
|
|
|
|
|
|
|
| Series C, (AGM), 3.25%, 07/01/49 |
|
|
1,060 |
|
|
|
828,930 |
|
| Series C, (AGM), 4.00%, 07/01/50 |
|
|
895 |
|
|
|
844,220 |
|
| New Jersey Educational Facilities Authority, Refunding RB |
|
|
|
|
|
|
|
|
| Series A, 5.00%, 07/01/39 |
|
|
15,555 |
|
|
|
15,801,547 |
|
| Series A, 5.00%, 07/01/44 |
|
|
14,500 |
|
|
|
14,635,009 |
|
| Series A, 4.00%, 07/01/47 |
|
|
2,100 |
|
|
|
1,859,149 |
|
| Series D, 5.00%, 07/01/38 |
|
|
1,000 |
|
|
|
1,000,762 |
|
| Series D, 5.00%, 07/01/43 |
|
|
600 |
|
|
|
600,004 |
|
| New Jersey Higher Education Student Assistance Authority, RB |
|
|
|
|
|
|
|
|
| Series 1A-1, AMT, 4.00%, 12/01/29 |
|
|
930 |
|
|
|
931,057 |
|
| Series 1A-1, AMT, 4.25%, 12/01/32 |
|
|
335 |
|
|
|
335,968 |
|
| Series 1A-1, AMT, 4.50%, 12/01/36 |
|
|
295 |
|
|
|
295,930 |
|
| Series B, AMT, 4.00%, 12/01/44 |
|
|
1,575 |
|
|
|
1,528,070 |
|
| Sub-Series C, AMT, 4.00%, 12/01/48 |
|
|
3,210 |
|
|
|
2,774,923 |
|
| Series C, AMT, Subordinate, 5.00%, 12/01/53 |
|
|
985 |
|
|
|
962,177 |
|
| New Jersey Higher Education Student Assistance Authority, Refunding RB |
|
|
|
|
|
|
|
|
| Series B, AMT, 4.00%, 12/01/41 |
|
|
3,265 |
|
|
|
3,218,353 |
|
| Series B, Class B, AMT, 3.00%, 12/01/32 |
|
|
4,635 |
|
|
|
4,496,126 |
|
| Sub-Series C, AMT, 3.63%, 12/01/49 |
|
|
1,925 |
|
|
|
1,558,530 |
|
|
|
|
| 24 |
|
2 0 2 3 B L A C
K R O C K A N N U A L R E P O R
T T O S H A R E H O L D E R
S |
|
|
|
| Schedule of Investments (continued)
July 31, 2023 |
|
BlackRock MuniHoldings New Jersey Quality Fund, Inc. (MUJ)
(Percentages shown are based on Net Assets) |
|
|
|
|
|
|
|
|
|
| Security |
|
Par
(000) |
|
|
Value |
|
|
|
|
| Education (continued) |
|
|
|
|
|
|
| New Jersey Higher Education Student Assistance Authority, Refunding RB (continued) |
|
|
|
|
|
|
|
|
| Series C, AMT, Subordinate, 5.00%, 12/01/52 |
|
$ |
18,705 |
|
|
$ |
19,270,957 |
|
| New Jersey Institute of Technology, RB |
|
|
|
|
|
|
|
|
| Series A, 5.00%, 07/01/45 |
|
|
12,000 |
|
|
|
12,261,528 |
|
| Series A, AMT, 5.00%, 07/01/40 |
|
|
3,000 |
|
|
|
3,084,705 |
|
|
|
|
|
|
|
|
|
|
|
|
|
|
|
|
|
|
|
|
148,799,398 |
|
|
|
|
| Health — 7.9% |
|
|
|
|
|
|
| Camden County Improvement Authority, Refunding RB |
|
|
|
|
|
|
|
|
| 5.00%, 02/15/33 |
|
|
2,000 |
|
|
|
2,014,670 |
|
| 5.00%, 02/15/34 |
|
|
590 |
|
|
|
594,332 |
|
| Middlesex County Improvement Authority, RB, AMT, (AMBAC), 5.50%, 09/01/30 |
|
|
430 |
|
|
|
430,243 |
|
| New Jersey Economic Development Authority, Refunding RB |
|
|
|
|
|
|
|
|
| 5.00%, 01/01/34 |
|
|
1,230 |
|
|
|
1,172,349 |
|
| 5.00%, 01/01/39 |
|
|
1,980 |
|
|
|
1,751,429 |
|
| 5.00%, 01/01/49 |
|
|
1,500 |
|
|
|
1,222,628 |
|
| New Jersey Health Care Facilities Financing Authority, RB |
|
|
|
|
|
|
|
|
| 5.00%, 07/01/42 |
|
|
2,000 |
|
|
|
2,064,036 |
|
| 2.38%, 07/01/46 |
|
|
3,735 |
|
|
|
2,582,353 |
|
| 3.00%, 07/01/51 |
|
|
14,850 |
|
|
|
11,337,737 |
|
| 4.00%, 07/01/51 |
|
|
4,000 |
|
|
|
3,865,740 |
|
| Series A, 5.50%, 07/01/43 |
|
|
5,505 |
|
|
|
5,508,947 |
|
| Series B, 4.40%, 07/01/43(g) |
|
|
10,450 |
|
|
|
10,450,000 |
|
| New Jersey Health Care Facilities Financing Authority, Refunding RB |
|
|
|
|
|
|
|
|
| 5.00%, 01/01/24(b) |
|
|
180 |
|
|
|
181,199 |
|
| 5.00%, 07/01/28 |
|
|
2,820 |
|
|
|
2,839,407 |
|
| 5.00%, 07/01/29 |
|
|
715 |
|
|
|
719,974 |
|
| 5.00%, 07/01/34 |
|
|
2,190 |
|
|
|
2,317,397 |
|
| 4.00%, 07/01/41 |
|
|
3,000 |
|
|
|
2,986,176 |
|
| Series A, 4.00%, 07/01/43 |
|
|
3,500 |
|
|
|
3,477,379 |
|
|
|
|
|
|
|
|
|
|
|
|
|
|
|
|
|
|
|
|
55,515,996 |
|
|
|
|
| Housing — 2.8% |
|
|
|
|
|
|
| New Jersey Housing & Mortgage Finance Agency, RB, Series A, (AGM), 5.00%, 05/01/27 |
|
|
1,570 |
|
|
|
1,569,554 |
|
| New Jersey Housing & Mortgage Finance Agency, RB, S/F Housing, Series H, 2.15%, 10/01/41 |
|
|
2,995 |
|
|
|
2,181,459 |
|
| New Jersey Housing & Mortgage Finance Agency, Refunding RB |
|
|
|
|
|
|
|
|
| Series A, 4.00%, 11/01/48 |
|
|
675 |
|
|
|
575,064 |
|
| Series A, 4.10%, 11/01/53 |
|
|
400 |
|
|
|
360,434 |
|
| New Jersey Housing & Mortgage Finance Agency, Refunding RB, M/F Housing |
|
|
|
|
|
|
|
|
| Series A, 2.45%, 11/01/45 |
|
|
860 |
|
|
|
568,018 |
|
| Series A, 2.65%, 11/01/46 |
|
|
1,150 |
|
|
|
778,250 |
|
| Series A, 2.55%, 11/01/50 |
|
|
780 |
|
|
|
487,227 |
|
| Series A, 2.70%, 11/01/51 |
|
|
1,150 |
|
|
|
738,611 |
|
| Series A, 2.63%, 11/01/56 |
|
|
780 |
|
|
|
467,275 |
|
| Series A, 2.75%, 11/01/56 |
|
|
1,150 |
|
|
|
714,495 |
|
| Series D, AMT, 4.25%, 11/01/37 |
|
|
1,750 |
|
|
|
1,620,712 |
|
| Series D, AMT, 4.35%, 11/01/42 |
|
|
1,000 |
|
|
|
895,956 |
|
|
|
|
|
|
|
|
|
|
| Security |
|
Par
(000) |
|
|
Value |
|
|
|
|
| Housing (continued) |
|
|
|
|
|
|
| New Jersey Housing & Mortgage Finance Agency, Refunding RB, S/F Housing |
|
|
|
|
|
|
|
|
| Series A, 3.75%, 10/01/35 |
|
$ |
5,295 |
|
|
$ |
5,068,623 |
|
| Series E, 2.40%, 10/01/45 |
|
|
1,885 |
|
|
|
1,347,865 |
|
| Newark Housing Authority, RB, M/F Housing, Series A, AMT, 5.00%, 12/01/30 |
|
|
2,000 |
|
|
|
2,008,810 |
|
|
|
|
|
|
|
|
|
|
|
|
|
|
|
|
|
|
|
|
19,382,353 |
|
|
|
|
| State — 22.0% |
|
|
|
|
|
|
|
|
| Casino Reinvestment Development Authority, Inc., Refunding RB |
|
|
|
|
|
|
|
|
| 5.25%, 11/01/39 |
|
|
13,410 |
|
|
|
13,543,792 |
|
| 5.25%, 11/01/44 |
|
|
15,755 |
|
|
|
15,836,312 |
|
| Garden State Preservation Trust, RB(c) |
|
|
|
|
|
|
|
|
| Series B, (AGM), 0.00%, 11/01/23 |
|
|
17,185 |
|
|
|
17,037,175 |
|
| Series B, (AGM), 0.00%, 11/01/25 |
|
|
10,000 |
|
|
|
9,274,490 |
|
| Series B, (AGM), 0.00%, 11/01/26 |
|
|
6,000 |
|
|
|
5,389,524 |
|
| Series B, (AGM), 0.00%, 11/01/27 |
|
|
4,000 |
|
|
|
3,479,184 |
|
| Series B, (AGM), 0.00%, 11/01/28 |
|
|
4,540 |
|
|
|
3,822,925 |
|
| New Jersey Economic Development Authority, RB |
|
|
|
|
|
|
|
|
| 4.00%, 06/15/49 |
|
|
5,310 |
|
|
|
5,076,195 |
|
| Series A, (NPFGC), 5.25%, 07/01/24 |
|
|
1,785 |
|
|
|
1,810,577 |
|
| Series A, (NPFGC), 5.25%, 07/01/25 |
|
|
7,915 |
|
|
|
8,164,797 |
|
| Series A, (NPFGC), 5.25%, 07/01/26 |
|
|
6,085 |
|
|
|
6,389,792 |
|
| Series A, 5.00%, 06/15/42 |
|
|
2,000 |
|
|
|
2,087,982 |
|
| Series B, 5.00%, 06/15/35 |
|
|
3,750 |
|
|
|
4,043,456 |
|
| Series B, 5.00%, 06/15/43 |
|
|
3,470 |
|
|
|
3,650,502 |
|
| New Jersey Economic Development Authority, Refunding RB |
|
|
|
|
|
|
|
|
| 4.00%, 07/01/46 |
|
|
5,025 |
|
|
|
5,037,191 |
|
| Series N-1, (NPFGC), 5.50%, 09/01/27 |
|
|
1,000 |
|
|
|
1,089,069 |
|
| Sub-Series A, 4.00%, 07/01/32 |
|
|
5,000 |
|
|
|
5,041,645 |
|
| Sub-Series A, 5.00%, 07/01/33 |
|
|
5,050 |
|
|
|
5,307,075 |
|
| Sub-Series A, 4.00%, 07/01/34 |
|
|
8,570 |
|
|
|
8,592,419 |
|
| New Jersey Educational Facilities Authority, RB |
|
|
|
|
|
|
|
|
| Series A, 4.00%, 09/01/28 |
|
|
9,705 |
|
|
|
9,766,520 |
|
| Series A, 5.00%, 09/01/32 |
|
|
4,000 |
|
|
|
4,070,136 |
|
| Series A, 5.00%, 09/01/33 |
|
|
5,370 |
|
|
|
5,464,974 |
|
| State of New Jersey, GO |
|
|
|
|
|
|
|
|
| 2.00%, 06/01/37 |
|
|
5,825 |
|
|
|
4,566,916 |
|
| 5.00%, 06/01/40 |
|
|
5,085 |
|
|
|
5,527,146 |
|
|
|
|
|
|
|
|
|
|
|
|
|
|
|
|
|
|
|
|
154,069,794 |
|
|
|
|
| Tobacco — 7.5% |
|
|
|
|
|
|
| Tobacco Settlement Financing Corp., Refunding RB |
|
|
|
|
|
|
|
|
| Series A, 5.00%, 06/01/46 |
|
|
10,000 |
|
|
|
10,306,070 |
|
| Series A, 5.25%, 06/01/46 |
|
|
6,500 |
|
|
|
6,778,415 |
|
| Sub-Series B, 5.00%, 06/01/46 |
|
|
35,420 |
|
|
|
35,354,756 |
|
|
|
|
|
|
|
|
|
|
|
|
|
|
|
|
|
|
|
|
52,439,241 |
|
|
|
|
| Transportation — 36.3% |
|
|
|
|
|
|
| New Jersey Economic Development Authority, RB |
|
|
|
|
|
|
|
|
| 4.00%, 11/01/44 |
|
|
4,715 |
|
|
|
4,543,926 |
|
| Class A, 5.25%, 11/01/47 |
|
|
7,800 |
|
|
|
8,584,212 |
|
| AMT, (AGM), 5.00%, 01/01/31 |
|
|
1,000 |
|
|
|
1,003,861 |
|
| AMT, 5.13%, 01/01/34 |
|
|
2,290 |
|
|
|
2,297,871 |
|
| AMT, 5.38%, 01/01/43 |
|
|
23,510 |
|
|
|
23,565,789 |
|
| New Jersey Economic Development Authority, Refunding ARB |
|
|
|
|
|
|
|
|
| AMT, 5.00%, 10/01/37 |
|
|
2,750 |
|
|
|
2,874,855 |
|
|
|
|
| S C H E D U L E
O F I N V E S T M E N T S |
|
25 |
|
|
|
| Schedule of Investments (continued)
July 31, 2023 |
|
BlackRock MuniHoldings New Jersey Quality Fund, Inc. (MUJ)
(Percentages shown are based on Net Assets) |
|
|
|
|
|
|
|
|
|
| Security |
|
Par
(000) |
|
|
Value |
|
|
|
|
| Transportation (continued) |
|
|
|
|
|
|
| New Jersey Economic Development Authority, Refunding ARB (continued) |
|
|
|
|
|
|
|
|
| AMT, 5.00%, 10/01/47 |
|
$ |
1,450 |
|
|
$ |
1,459,093 |
|
| New Jersey Transportation Trust Fund Authority, RB |
|
|
|
|
|
|
|
|
| 5.00%, 06/15/42 |
|
|
785 |
|
|
|
852,564 |
|
| 5.25%, 06/15/46 |
|
|
790 |
|
|
|
870,899 |
|
| 4.50%, 06/15/49 |
|
|
4,600 |
|
|
|
4,665,941 |
|
| Class BB, 5.00%, 06/15/36 |
|
|
3,750 |
|
|
|
4,150,642 |
|
| Class BB, 4.00%, 06/15/37 |
|
|
1,550 |
|
|
|
1,554,210 |
|
| Class BB, 4.00%, 06/15/40 |
|
|
6,000 |
|
|
|
5,879,388 |
|
| Class BB, 4.00%, 06/15/50 |
|
|
8,290 |
|
|
|
7,844,205 |
|
| Series A, (NPFGC), 5.75%, 06/15/24 |
|
|
1,205 |
|
|
|
1,228,217 |
|
| Series A, 5.00%, 06/15/30 |
|
|
4,250 |
|
|
|
4,468,620 |
|
| Series AA, 5.25%, 06/15/34 |
|
|
1,305 |
|
|
|
1,352,271 |
|
| Series AA, 4.00%, 06/15/36 |
|
|
2,565 |
|
|
|
2,599,330 |
|
| Series AA, 5.00%, 06/15/38 |
|
|
11,830 |
|
|
|
12,004,398 |
|
| Series AA, 5.25%, 06/15/41 |
|
|
5,000 |
|
|
|
5,142,265 |
|
| Series AA, 4.00%, 06/15/45 |
|
|
10,980 |
|
|
|
10,567,580 |
|
| Series AA, 5.00%, 06/15/45 |
|
|
5,000 |
|
|
|
5,338,715 |
|
| Series AA, 4.00%, 06/15/50 |
|
|
13,535 |
|
|
|
12,896,486 |
|
| Series B, 5.00%, 06/15/33 |
|
|
2,450 |
|
|
|
2,668,569 |
|
| Series BB, 4.00%, 06/15/44 |
|
|
5,100 |
|
|
|
4,944,460 |
|
| Series BB, 4.00%, 06/15/50 |
|
|
10,100 |
|
|
|
9,617,745 |
|
| Series C, (AGM), 0.00%, 12/15/32(c) |
|
|
14,050 |
|
|
|
10,075,438 |
|
| Series C, (AMBAC), 0.00%, 12/15/35(c) |
|
|
8,300 |
|
|
|
4,973,327 |
|
| Series C, (AMBAC), 0.00%, 12/15/36(c) |
|
|
7,210 |
|
|
|
4,102,036 |
|
| Series D, 5.00%, 06/15/32 |
|
|
3,300 |
|
|
|
3,378,190 |
|
| New Jersey Transportation Trust Fund Authority, RB, CAB, Series A, 0.00%, 12/15/35(c) |
|
|
6,000 |
|
|
|
3,595,176 |
|
| New Jersey Transportation Trust Fund Authority, Refunding RB |
|
|
|
|
|
|
|
|
| 4.00%, 12/15/39 |
|
|
4,795 |
|
|
|
4,760,951 |
|
| Series A, 5.00%, 06/15/31 |
|
|
12,270 |
|
|
|
12,907,341 |
|
| Series A, 4.00%, 06/15/35 |
|
|
1,605 |
|
|
|
1,637,333 |
|
| Series A, 5.00%, 12/15/35 |
|
|
2,000 |
|
|
|
2,151,086 |
|
| Series A, 4.00%, 06/15/36 |
|
|
3,695 |
|
|
|
3,735,142 |
|
| Series A, 5.00%, 12/15/36 |
|
|
500 |
|
|
|
534,622 |
|
| Series A, 5.25%, 06/15/41 |
|
|
4,000 |
|
|
|
4,460,792 |
|
| Series AA, 4.25%, 06/15/44 |
|
|
6,170 |
|
|
|
6,169,679 |
|
| New Jersey Turnpike Authority, RB |
|
|
|
|
|
|
|
|
| Series A, 4.00%, 01/01/42 |
|
|
4,000 |
|
|
|
4,024,096 |
|
| Series A-1, 5.00%, 01/01/35 |
|
|
2,500 |
|
|
|
2,675,460 |
|
| Series E, 5.00%, 01/01/45 |
|
|
8,720 |
|
|
|
8,866,949 |
|
| New Jersey Turnpike Authority, Refunding RB |
|
|
|
|
|
|
|
|
| Series A, (AGM), 5.25%, 01/01/29 |
|
|
4,000 |
|
|
|
4,489,944 |
|
| Series A, (BHAC-CR AGM), 5.25%, 01/01/29 |
|
|
500 |
|
|
|
562,102 |
|
| Series A, (AGM), 5.25%, 01/01/30 |
|
|
4,000 |
|
|
|
4,581,192 |
|
| South Jersey Port Corp., ARB |
|
|
|
|
|
|
|
|
| Series A, 5.00%, 01/01/49 |
|
|
4,150 |
|
|
|
4,253,140 |
|
| Series B, AMT, 5.00%, 01/01/42 |
|
|
12,870 |
|
|
|
13,046,036 |
|
| South Jersey Transportation Authority, RB |
|
|
|
|
|
|
|
|
| Series A, (AGM-CR), 4.00%, 11/01/50 |
|
|
4,260 |
|
|
|
4,169,535 |
|
| Series A, Subordinate, (BAM), 4.00%, 11/01/50 |
|
|
2,000 |
|
|
|
1,939,954 |
|
|
|
|
|
|
|
|
|
|
|
|
|
|
|
|
|
|
|
|
254,065,633 |
|
|
|
|
|
|
|
|
|
|
| Security |
|
Par
(000) |
|
|
Value |
|
|
|
|
| Utilities — 5.2% |
|
|
|
|
|
|
| Passaic Valley Sewerage Commission, Refunding RB |
|
|
|
|
|
|
|
|
| Series J, (AGM), 3.00%, 12/01/40 |
|
$ |
2,060 |
|
|
$ |
1,772,006 |
|
| Series J, (AGM), 3.00%, 12/01/41 |
|
|
2,110 |
|
|
|
1,783,503 |
|
| Series J, (AGM), 3.00%, 12/01/42 |
|
|
2,155 |
|
|
|
1,779,907 |
|
| Series J, (AGM), 3.00%, 12/01/43 |
|
|
2,205 |
|
|
|
1,801,860 |
|
| Series J, (AGM), 3.00%, 12/01/44 |
|
|
2,255 |
|
|
|
1,809,795 |
|
| Series J, (AGM), 3.00%, 12/01/45 |
|
|
2,305 |
|
|
|
1,815,563 |
|
| Rahway Valley Sewerage Authority, RB(c) |
|
|
|
|
|
|
|
|
| Series A, (NPFGC), 0.00%, 09/01/26 |
|
|
4,100 |
|
|
|
3,725,412 |
|
| Series A, (NPFGC), 0.00%, 09/01/28 |
|
|
6,600 |
|
|
|
5,638,156 |
|
| Series A, (NPFGC), 0.00%, 09/01/29 |
|
|
9,650 |
|
|
|
7,986,861 |
|
| Series A, (NPFGC), 0.00%, 09/01/31 |
|
|
6,000 |
|
|
|
4,642,086 |
|
| Series A, (NPFGC), 0.00%, 09/01/33 |
|
|
5,000 |
|
|
|
3,584,375 |
|
|
|
|
|
|
|
|
|
|
|
|
|
|
|
|
|
|
|
|
36,339,524 |
|
|
|
|
|
|
|
|
|
|
|
|
|
| Total Municipal Bonds in New Jersey |
|
|
|
|
|
|
891,724,233 |
|
|
|
|
| New York — 6.9% |
|
|
|
|
|
|
|
|
|
| Transportation — 6.9% |
|
|
|
|
|
|
| Port Authority of New York & New Jersey, ARB |
|
|
|
|
|
|
|
|
| 93rd Series, 6.13%, 06/01/94 |
|
|
6,000 |
|
|
|
6,159,558 |
|
| AMT, 5.00%, 11/01/30 |
|
|
2,000 |
|
|
|
2,195,580 |
|
| AMT, 5.00%, 11/01/33 |
|
|
1,030 |
|
|
|
1,124,252 |
|
| AMT, 4.00%, 11/01/37 |
|
|
1,715 |
|
|
|
1,725,257 |
|
| 218th Series, AMT, 5.00%, 11/01/32 |
|
|
3,105 |
|
|
|
3,396,122 |
|
| 218th Series, AMT, 4.00%, 11/01/47 |
|
|
835 |
|
|
|
778,527 |
|
| 221st Series, AMT, 4.00%, 07/15/40 |
|
|
1,500 |
|
|
|
1,477,083 |
|
| 221th Series, AMT, 4.00%, 07/15/50 |
|
|
4,415 |
|
|
|
4,077,204 |
|
| Port Authority of New York & New Jersey, RB, AMT, 4.00%, 09/01/38 |
|
|
1,085 |
|
|
|
1,088,511 |
|
| Port Authority of New York & New Jersey, Refunding ARB |
|
|
|
|
|
|
|
|
| AMT, 5.00%, 01/15/47 |
|
|
7,720 |
|
|
|
8,139,173 |
|
| 206th Series, AMT, 5.00%, 11/15/42 |
|
|
4,475 |
|
|
|
4,625,302 |
|
| 206th Series, AMT, 5.00%, 11/15/47 |
|
|
5,000 |
|
|
|
5,133,440 |
|
| 238th Series, AMT, 5.00%, 07/15/39 |
|
|
1,670 |
|
|
|
1,828,734 |
|
| Series 178th, AMT, 5.00%, 12/01/33 |
|
|
4,005 |
|
|
|
4,019,662 |
|
| Series 223, AMT, 4.00%, 07/15/41 |
|
|
2,530 |
|
|
|
2,475,418 |
|
|
|
|
|
|
|
|
|
|
|
|
|
| Total Municipal Bonds in New York |
|
|
|
|
|
|
48,243,823 |
|
|
|
|
| Pennsylvania — 2.3% |
|
|
|
|
|
|
|
|
|
| Transportation — 2.3% |
|
|
|
|
|
|
| Delaware River Joint Toll Bridge Commission, RB, 5.00%, 07/01/42 |
|
|
2,460 |
|
|
|
2,571,576 |
|
| Delaware River Port Authority, RB |
|
|
|
|
|
|
|
|
| 5.00%, 01/01/24(b) |
|
|
2,000 |
|
|
|
2,013,318 |
|
| 5.00%, 01/01/37 |
|
|
7,330 |
|
|
|
7,397,898 |
|
| 5.00%, 01/01/40 |
|
|
4,000 |
|
|
|
4,016,644 |
|
|
|
|
|
|
|
|
|
|
|
|
|
| Total Municipal Bonds in Pennsylvania |
|
|
|
|
|
|
15,999,436 |
|
|
|
|
| Puerto Rico — 4.9% |
|
|
|
|
|
|
|
|
|
|
|
| State — 4.9% |
|
|
|
|
|
|
| Puerto Rico Sales Tax Financing Corp. Sales Tax Revenue, RB |
|
|
|
|
|
|
|
|
| Series A-1, Restructured, 4.75%, 07/01/53 |
|
|
2,878 |
|
|
|
2,719,379 |
|
| Series A-1, Restructured, 5.00%, 07/01/58 |
|
|
12,646 |
|
|
|
12,338,373 |
|
| Series A-2, Restructured, 4.78%, 07/01/58 |
|
|
2,906 |
|
|
|
2,734,325 |
|
| Series A-2, Restructured, 4.33%, 07/01/40 |
|
|
12,863 |
|
|
|
12,166,121 |
|
|
|
|
| 26 |
|
2 0 2 3 B L A C
K R O C K A N N U A L R E P O R
T T O S H A R E H O L D E R
S |
|
|
|
| Schedule of Investments (continued)
July 31, 2023 |
|
BlackRock MuniHoldings New Jersey Quality Fund, Inc. (MUJ)
(Percentages shown are based on Net Assets) |
|
|
|
|
|
|
|
|
|
| Security |
|
Par
(000) |
|
|
Value |
|
|
|
|
| State (continued) |
|
|
|
|
|
|
|
|
| Puerto Rico Sales Tax Financing Corp. Sales Tax Revenue, RB (continued) |
|
|
|
|
|
|
|
|
| Series B-1, Restructured, 4.75%, 07/01/53 |
|
$ |
638 |
|
|
$ |
602,692 |
|
| Series B-2, Restructured, 4.78%, 07/01/58 |
|
|
618 |
|
|
|
581,638 |
|
| Puerto Rico Sales Tax Financing Corp. Sales Tax Revenue, RB, CAB,
Series A-1, Restructured, 0.00%,
07/01/46(c) |
|
|
11,852 |
|
|
|
3,341,280 |
|
|
|
|
|
|
|
|
|
|
|
|
|
| Total Municipal Bonds in Puerto Rico |
|
|
|
|
34,483,808 |
|
|
|
|
|
|
|
|
|
|
|
|
|
| Total Municipal Bonds — 141.5%
(Cost: $999,448,479) |
|
|
|
|
|
|
990,451,300 |
|
|
|
|
|
|
|
|
|
|
|
| Municipal Bonds Transferred to Tender Option Bond Trusts(h) |
|
|
|
|
| New Jersey — 5.2% |
|
|
|
|
|
|
|
|
|
| County/City/Special District/School District — 1.7% |
|
| Union County Utilities Authority, Refunding RB, Series A, 5.00%, 06/15/41 |
|
|
11,685 |
|
|
|
11,697,444 |
|
|
|
|
|
|
|
|
|
|
|
|
|
| Health — 0.7% |
|
|
|
|
|
|
| New Jersey Health Care Facilities Financing Authority, RB, 4.00%, 07/01/47 |
|
|
5,555 |
|
|
|
5,253,483 |
|
|
|
|
|
|
|
|
|
|
|
|
|
| State — 2.8% |
|
|
|
|
|
|
| Garden State Preservation Trust, RB, Series A, 5.75%, 11/01/28 |
|
|
17,920 |
|
|
|
19,396,478 |
|
|
|
|
|
|
|
|
|
|
|
|
|
| Total Municipal Bonds in New Jersey |
|
|
|
|
36,347,405 |
|
|
|
|
|
|
|
|
|
|
|
|
| Total Municipal Bonds Transferred to Tender Option Bond Trusts — 5.2%
(Cost:
$35,631,132) |
|
|
|
36,347,405 |
|
|
|
|
|
|
|
|
|
|
|
|
| Total Long-Term Investments — 146.7%
(Cost: $1,035,079,611) |
|
|
|
1,026,798,705 |
|
|
|
|
|
|
|
|
|
|
|
|
|
|
|
|
|
|
|
| Security |
|
Shares |
|
|
Value |
|
|
|
|
| Short-Term Securities |
|
|
|
|
|
|
|
|
|
| Money Market Funds — 14.9% |
|
|
|
|
|
|
| BlackRock Liquidity Funds, MuniCash, Institutional Class,
3.57%(i)(j) |
|
|
104,186,840 |
|
|
$ |
104,186,840 |
|
|
|
|
|
|
|
|
|
|
|
|
| Total Short-Term Securities — 14.9%
(Cost: $104,179,148) |
|
|
|
104,186,840 |
|
|
|
|
|
|
|
|
|
|
|
|
| Total Investments — 161.6%
(Cost: $1,139,258,759) |
|
|
|
1,130,985,545 |
|
|
|
| Other Assets Less Liabilities — 1.1% |
|
|
|
7,428,688 |
|
|
|
| Liability for TOB Trust Certificates, Including Interest Expense and Fees Payable —
(3.2)% |
|
|
|
(22,209,666 |
) |
|
|
| VRDP Shares at Liquidation Value, Net of Deferred Offering Costs — (59.5)% |
|
|
|
(416,356,885 |
) |
|
|
|
|
|
|
|
|
| Net Assets Applicable to Common Shares — 100.0% |
|
|
$ |
699,847,682 |
|
|
|
|
|
|
|
|
|
|
| (a) |
Security is collateralized by municipal bonds or U.S. Treasury obligations. |
| (b) |
U.S. Government securities held in escrow, are used to pay interest on this security as well as to retire the bond in
full at the date indicated, typically at a premium to par. |
| (d) |
Issuer filed for bankruptcy and/or is in default. |
| (e) |
Non-income producing security. |
| (f) |
Security exempt from registration pursuant to Rule 144A under the Securities Act of 1933, as amended. These securities
may be resold in transactions exempt from registration to qualified institutional investors. |
| (g) |
Variable rate security. Interest rate resets periodically. The rate shown is the effective interest rate as of period
end. Security description also includes the reference rate and spread if published and available. |
| (h) |
Represent bonds transferred to a TOB Trust in exchange of cash and residual certificates received by the Fund. These
bonds serve as collateral in a secured borrowing. See Note 4 of the Notes to Financial Statements for details. |
| (i) |
Affiliate of the Fund. |
| (j) |
Annualized 7-day yield as of period end.
|
For Fund compliance purposes, the
Fund’s sector classifications refer to one or more of the sector sub-classifications used by one or more widely recognized market indexes or rating group indexes, and/or as defined by the investment adviser. These definitions may not apply for
purposes of this report, which may combine such sector sub-classifications for reporting ease.
Affiliates
Investments in issuers considered to be affiliate(s) of the Fund during the year ended July 31, 2023 for purposes of Section 2(a)(3) of the
Investment Company Act of 1940, as amended, were as follows:
|
|
|
|
|
|
|
|
|
|
|
|
|
|
|
|
|
|
|
|
|
|
|
|
|
|
|
|
|
|
|
|
|
|
|
|
|
| |
|
|
|
|
|
|
|
|
|
| Affiliated Issuer |
|
Value at
07/31/22 |
|
|
Purchases
at Cost |
|
|
Proceeds
from Sales |
|
|
Net
Realized
Gain (Loss) |
|
|
Change in
Unrealized
Appreciation
(Depreciation) |
|
|
Value at
07/31/23 |
|
|
Shares
Held at
07/31/23 |
|
|
Income |
|
|
Capital Gain
Distributions
from
Underlying
Funds |
|
| BlackRock Liquidity Funds, MuniCash, Institutional Class |
|
$ |
42,316,790 |
|
|
$ |
61,877,513 |
(a) |
|
$ |
— |
|
|
$ |
(4,972 |
) |
|
$ |
(2,491 |
) |
|
$ |
104,186,840 |
|
|
|
104,186,840 |
|
|
$ |
1,412,567 |
|
|
$ |
— |
|
|
|
|
|
|
|
|
|
|
|
|
|
|
|
|
|
|
|
|
|
|
|
|
|
|
|
|
|
|
|
|
|
|
|
|
|
|
| |
(a) |
Represents net amount purchased (sold). |
|
|
|
|
| S C H E D U L E
O F I N V E S T M E N T S |
|
27 |
|
|
|
| Schedule of Investments (continued)
July 31, 2023 |
|
BlackRock MuniHoldings New Jersey Quality Fund, Inc. (MUJ) |
Derivative Financial Instruments Categorized by Risk Exposure
For the period ended July 31, 2023, the effect of derivative financial instruments in the Statements of Operations was as follows:
|
|
|
|
|
|
|
|
|
|
|
|
|
|
|
|
|
|
|
|
|
|
|
|
|
|
|
|
|
| |
|
|
|
|
|
|
|
| |
|
Commodity
Contracts |
|
|
Credit
Contracts |
|
|
Equity
Contracts |
|
|
Foreign
Currency Exchange
Contracts |
|
|
Interest
Rate
Contracts |
|
|
Other
Contracts |
|
|
Total |
|
| Net Realized Gain (Loss) from: |
|
|
|
|
|
|
|
|
|
|
|
|
|
|
|
|
|
|
|
|
|
|
|
|
|
|
|
|
| Futures contracts |
|
$ |
— |
|
|
$ |
— |
|
|
$ |
— |
|
|
$ |
— |
|
|
$ |
5,923,092 |
|
|
$ |
— |
|
|
$ |
5,923,092 |
|
|
|
|
|
|
|
|
|
|
|
|
|
|
|
|
|
|
|
|
|
|
|
|
|
|
|
|
|
|
|
|
|
|
|
|
|
|
| Net Change in Unrealized Appreciation (Depreciation) on: |
|
|
|
|
|
|
|
|
|
|
|
|
|
|
|
|
|
|
|
|
|
|
|
|
|
|
|
|
| Futures contracts |
|
$ |
— |
|
|
$ |
— |
|
|
$ |
— |
|
|
$ |
— |
|
|
$ |
1,481,240 |
|
|
$ |
— |
|
|
$ |
1,481,240 |
|
|
|
|
|
|
|
|
|
|
|
|
|
|
|
|
|
|
|
|
|
|
|
|
|
|
|
|
|
|
Average Quarterly Balances of Outstanding Derivative Financial Instruments
|
|
|
|
|
| Futures contracts: |
|
|
|
|
|
|
| Average notional value of contracts — short |
|
$ |
39,640,492 |
|
For more information about the Fund’s investment risks regarding derivative financial instruments, refer to the Notes
to Financial Statements.
Fair Value Hierarchy as of Period End
Various inputs are used in determining the fair value of financial instruments. For a description of the input levels and information about the
Fund’s policy regarding valuation of financial instruments, refer to the Notes to Financial Statements.
The following table summarizes the
Fund’s financial instruments categorized in the fair value hierarchy. The breakdown of the Fund’s financial instruments into major categories is disclosed in the Schedule of Investments above.
|
|
|
|
|
|
|
|
|
|
|
|
|
|
|
|
|
|
|
|
|
|
|
| |
|
|
|
|
|
|
|
| |
|
Level 1 |
|
|
|
|
Level 2 |
|
|
|
|
Level 3 |
|
|
|
|
Total |
|
| Assets |
|
|
|
|
|
|
|
|
|
|
|
|
|
|
|
|
|
|
|
|
|
|
| Investments |
|
|
|
|
|
|
|
|
|
|
|
|
|
|
|
|
|
|
|
|
|
|
| Long-Term Investments |
|
|
|
|
|
|
|
|
|
|
|
|
|
|
|
|
|
|
|
|
|
|
| Municipal Bonds |
|
$ |
— |
|
|
|
|
$ |
990,451,300 |
|
|
|
|
$ |
— |
|
|
|
|
$ |
990,451,300 |
|
| Municipal Bonds Transferred to Tender Option Bond Trusts |
|
|
— |
|
|
|
|
|
36,347,405 |
|
|
|
|
|
— |
|
|
|
|
|
36,347,405 |
|
| Short-Term Securities |
|
|
|
|
|
|
|
|
|
|
|
|
|
|
|
|
|
|
|
|
|
|
| Money Market Funds |
|
|
104,186,840 |
|
|
|
|
|
— |
|
|
|
|
|
— |
|
|
|
|
|
104,186,840 |
|
|
|
|
|
|
|
|
|
|
|
|
|
|
|
|
|
|
|
|
|
|
|
|
|
|
|
|
|
|
|
|
|
|
$ |
104,186,840 |
|
|
|
|
$ |
1,026,798,705 |
|
|
|
|
$ |
— |
|
|
|
|
$ |
1,130,985,545 |
|
|
|
|
|
|
|
|
|
|
|
|
|
|
|
|
|
|
|
|
|
|
|
|
The Fund may hold assets and/or liabilities in which the fair value approximates the carrying amount for financial
statement purposes. As of period end, such assets and/or liabilities are categorized within the fair value hierarchy as follows:
|
|
|
|
|
|
|
|
|
|
|
|
|
|
|
|
|
|
|
|
|
|
|
| |
|
|
|
|
|
|
|
| |
|
Level 1 |
|
|
|
|
Level 2 |
|
|
|
|
Level 3 |
|
|
|
|
Total |
|
| Liabilities |
|
|
|
|
|
|
|
|
|
|
|
|
|
|
|
|
|
|
|
|
|
|
| TOB Trust Certificates |
|
$ |
— |
|
|
|
|
$ |
(22,059,998 |
) |
|
|
|
$ |
— |
|
|
|
|
$ |
(22,059,998 |
) |
| VRDP Shares at Liquidation Value |
|
|
— |
|
|
|
|
|
(417,100,000 |
) |
|
|
|
|
— |
|
|
|
|
|
(417,100,000 |
) |
|
|
|
|
|
|
|
|
|
|
|
|
|
|
|
|
|
|
|
|
|
|
|
|
|
|
|
|
|
|
|
|
|
$ |
— |
|
|
|
|
$ |
(439,159,998 |
) |
|
|
|
$ |
— |
|
|
|
|
$ |
(439,159,998 |
) |
|
|
|
|
|
|
|
|
|
|
|
|
|
|
|
|
|
|
|
|
|
|
|
See notes to financial statements.
|
|
|
| 28 |
|
2 0 2 3 B L A C
K R O C K A N N U A L R E P O R
T T O S H A R E H O L D E R
S |
|
|
|
| Schedule of Investments July 31, 2023 |
|
BlackRock MuniYield Michigan Quality Fund, Inc. (MIY)
(Percentages shown are based on Net Assets) |
|
|
|
|
|
|
|
|
|
| Security |
|
Par
(000) |
|
|
Value |
|
|
|
|
| Municipal Bonds |
|
|
|
|
|
|
|
|
|
|
|
| Michigan — 147.9% |
|
|
|
|
|
|
|
|
|
| County/City/Special District/School District — 35.5% |
|
| Belding Area Schools, GO, (Q-SBLF), 5.25%, 05/01/48 |
|
$ |
1,620 |
|
|
$ |
1,769,612 |
|
| Bloomfield Hills School District, GO, 5.00%, 05/01/48 |
|
|
1,250 |
|
|
|
1,361,601 |
|
| Byron Center Public Schools, GO, Series I, (Q-SBLF), 5.00%, 05/01/43 |
|
|
2,895 |
|
|
|
3,013,660 |
|
| Cedar Springs Public School District, GO |
|
|
|
|
|
|
|
|
| Series II, (Q-SBLF), 5.00%, 05/01/46 |
|
|
1,100 |
|
|
|
1,191,963 |
|
| Series II, (Q-SBLF), 4.50%, 05/01/49 |
|
|
1,950 |
|
|
|
1,980,127 |
|
| Chippewa Valley Schools, GO, (Q-SBLF), 5.00%, 05/01/43 |
|
|
4,275 |
|
|
|
4,560,450 |
|
| City of Lansing Michigan, Refunding GO |
|
|
|
|
|
|
|
|
| 4.00%, 06/01/43 |
|
|
2,000 |
|
|
|
1,968,772 |
|
| Series B, (AGM), 4.13%, 06/01/48 |
|
|
5,325 |
|
|
|
5,191,151 |
|
| Clarkston Community Schools, GO |
|
|
|
|
|
|
|
|
| Series I, (Q-SBLF), 5.00%, 05/01/45 |
|
|
8,360 |
|
|
|
9,181,128 |
|
| Series I, (Q-SBLF), 5.00%, 05/01/47 |
|
|
2,500 |
|
|
|
2,729,255 |
|
| Columbia School District, GO, (Q-SBLF), 5.00%,
11/01/23(a) |
|
|
5,185 |
|
|
|
5,205,164 |
|
| Coopersville Area Public Schools, GO |
|
|
|
|
|
|
|
|
| Series I, (Q-SBLF), 4.50%, 05/01/41 |
|
|
425 |
|
|
|
445,266 |
|
| Series I, (Q-SBLF), 4.50%, 05/01/43 |
|
|
320 |
|
|
|
332,874 |
|
| Series I, (Q-SBLF), 4.00%, 05/01/45 |
|
|
850 |
|
|
|
830,767 |
|
| Series I, (Q-SBLF), 4.00%, 05/01/48 |
|
|
745 |
|
|
|
715,429 |
|
| Series I, (Q-SBLF), 4.13%, 05/01/52 |
|
|
1,000 |
|
|
|
989,351 |
|
| Dearborn School District, GO, Series A, (Q-SBLF), 5.00%, 11/01/23(a) |
|
|
4,300 |
|
|
|
4,316,723 |
|
| Farmington Public School District, Refunding GO |
|
|
|
|
|
|
|
|
| (AGM), 5.00%, 05/01/33 |
|
|
1,500 |
|
|
|
1,551,044 |
|
| (AGM), 5.00%, 05/01/34 |
|
|
1,500 |
|
|
|
1,551,049 |
|
| (AGM), 5.00%, 05/01/35 |
|
|
1,000 |
|
|
|
1,034,039 |
|
| Grand Ledge Public Schools, GO, (Q-SBLF), 5.00%, 05/01/44 |
|
|
1,585 |
|
|
|
1,687,315 |
|
| Gull Lake Community School District, GO, Series I, (Q-SBLF), 5.00%, 05/01/48 |
|
|
4,000 |
|
|
|
4,190,552 |
|
| Hudsonville Public Schools, GO, Series I, (Q-SBLF), 4.00%, 05/01/45 |
|
|
2,040 |
|
|
|
1,961,344 |
|
| Hudsonville Public Schools, Refunding GO |
|
|
|
|
|
|
|
|
| (Q-SBLF), 5.00%, 05/01/46 |
|
|
2,500 |
|
|
|
2,709,007 |
|
| (Q-SBLF), 5.00%, 05/01/49 |
|
|
2,375 |
|
|
|
2,555,234 |
|
| Karegnondi Water Authority, Refunding RB |
|
|
|
|
|
|
|
|
| 5.00%, 11/01/41 |
|
|
2,750 |
|
|
|
2,850,933 |
|
| 5.00%, 11/01/45 |
|
|
3,000 |
|
|
|
3,091,416 |
|
| Kentwood Public Schools, GO |
|
|
|
|
|
|
|
|
| 5.00%, 05/01/41 |
|
|
1,120 |
|
|
|
1,165,847 |
|
| 5.00%, 05/01/49 |
|
|
5,000 |
|
|
|
5,325,170 |
|
| Lowell Area Schools, GO, Series I, (Q-SBLF), 5.00%, 05/01/47 |
|
|
1,500 |
|
|
|
1,577,259 |
|
| Michigan Finance Authority, RB |
|
|
|
|
|
|
|
|
| Series H-1, 5.00%, 10/01/39(a) |
|
|
5,400 |
|
|
|
5,468,936 |
|
| 2nd Lien, 4.00%, 11/01/50 |
|
|
1,500 |
|
|
|
1,435,292 |
|
| Novi Community School District, GO |
|
|
|
|
|
|
|
|
| Series II, 4.00%, 05/01/43 |
|
|
1,320 |
|
|
|
1,293,439 |
|
| Series II, 4.00%, 05/01/47 |
|
|
1,150 |
|
|
|
1,115,981 |
|
| Rockford Public Schools, GO, Series II, 5.00%, 05/01/49 |
|
|
5,710 |
|
|
|
6,206,096 |
|
| Saline Area Schools, GO, Series I, (Q-SBLF), 5.00%, 05/01/42 |
|
|
3,635 |
|
|
|
3,996,137 |
|
|
|
|
|
|
|
|
|
|
| Security |
|
Par
(000) |
|
|
Value |
|
|
| County/City/Special District/School District (continued) |
|
| Southfield Public Schools, GO, 5.00%, 05/01/49 |
|
$ |
1,740 |
|
|
$ |
1,891,413 |
|
| Three Rivers Community Schools, GO |
|
|
|
|
|
|
|
|
| Series II, (Q-SBLF), 4.13%, 05/01/46 |
|
|
2,000 |
|
|
|
1,963,662 |
|
| Series II, (Q-SBLF), 4.25%, 05/01/49 |
|
|
7,000 |
|
|
|
7,001,813 |
|
| Troy School District, GO, (Q-SBLF), 5.00%, 05/01/47 |
|
|
6,445 |
|
|
|
7,052,216 |
|
| Walled Lake Consolidated School District, GO |
|
|
|
|
|
|
|
|
| (Q-SBLF), 5.00%, 11/01/23(a) |
|
|
5,480 |
|
|
|
5,501,312 |
|
| (Q-SBLF), 5.00%, 05/01/47 |
|
|
1,000 |
|
|
|
1,081,862 |
|
| (Q-SBLF), 5.00%, 05/01/49 |
|
|
2,500 |
|
|
|
2,698,825 |
|
| Wayne-Westland Community Schools, GO |
|
|
|
|
|
|
|
|
| (Q-SBLF), 5.00%, 11/01/44 |
|
|
2,360 |
|
|
|
2,572,176 |
|
| (Q-SBLF), 4.50%, 11/01/46 |
|
|
5,250 |
|
|
|
5,375,869 |
|
| West Ottawa Public Schools, GO, (AGM), 4.00%, 11/01/46 |
|
|
1,730 |
|
|
|
1,637,194 |
|
| Zeeland Public Schools, GO, Series A, (AGM), 5.00%, 05/01/33 |
|
|
1,000 |
|
|
|
1,032,145 |
|
|
|
|
|
|
|
|
|
|
|
|
|
|
|
|
|
|
|
|
134,357,870 |
|
|
|
|
| Education — 31.0% |
|
|
|
|
|
|
| Eastern Michigan University, RB, Series A, (AGM), 4.00%, 03/01/44 |
|
|
10,000 |
|
|
|
9,593,660 |
|
| Grand Valley State University, RB, 5.00%, 12/01/43 |
|
|
1,600 |
|
|
|
1,682,888 |
|
| Lake Superior State University, RB, (AGM), 5.00%, 01/15/48 |
|
|
3,750 |
|
|
|
3,839,475 |
|
| Michigan Finance Authority, Refunding RB |
|
|
|
|
|
|
|
|
| 4.00%, 02/01/29 |
|
|
700 |
|
|
|
662,901 |
|
| 5.00%, 02/01/33 |
|
|
830 |
|
|
|
828,203 |
|
| 4.00%, 12/01/33 |
|
|
1,720 |
|
|
|
1,699,998 |
|
| 5.00%, 12/01/36 |
|
|
1,550 |
|
|
|
1,553,007 |
|
| 5.00%, 09/01/40 |
|
|
1,000 |
|
|
|
951,817 |
|
| 5.00%, 12/01/40 |
|
|
2,900 |
|
|
|
2,903,118 |
|
| 5.00%, 12/01/45 |
|
|
4,400 |
|
|
|
4,401,712 |
|
| 4.00%, 09/01/50 |
|
|
1,550 |
|
|
|
1,329,553 |
|
| Series 25-A, AMT, 4.00%, 11/01/28 |
|
|
6,315 |
|
|
|
6,313,630 |
|
| Series 25-A, AMT, 4.00%, 11/01/29 |
|
|
5,480 |
|
|
|
5,478,734 |
|
| Series 25-A, AMT, 4.00%, 11/01/30 |
|
|
2,645 |
|
|
|
2,644,921 |
|
| Series 25-A, AMT, 4.00%, 11/01/31 |
|
|
3,150 |
|
|
|
3,149,950 |
|
| Michigan State University, Refunding RB |
|
|
|
|
|
|
|
|
| Series B, 4.00%, 02/15/44 |
|
|
4,000 |
|
|
|
3,949,792 |
|
| Series B, 5.00%, 02/15/44 |
|
|
3,820 |
|
|
|
4,078,148 |
|
| Series C, 4.00%, 02/15/44 |
|
|
9,000 |
|
|
|
8,887,032 |
|
| Michigan Technological University, RB |
|
|
|
|
|
|
|
|
| Series A, 5.00%, 10/01/45 |
|
|
1,800 |
|
|
|
1,839,371 |
|
| Series A, (AGM), 5.25%, 10/01/52 |
|
|
1,675 |
|
|
|
1,781,778 |
|
| Oakland University, RB, 5.00%, 03/01/41 |
|
|
3,635 |
|
|
|
3,746,242 |
|
| Wayne State University, RB |
|
|
|
|
|
|
|
|
| Series A, 5.00%, 11/15/40 |
|
|
13,000 |
|
|
|
13,075,101 |
|
| Series A, 5.00%, 11/15/43 |
|
|
8,530 |
|
|
|
9,054,296 |
|
| Series A, 4.00%, 11/15/48 |
|
|
2,000 |
|
|
|
1,916,642 |
|
| Western Michigan University, RB, Series A, 5.00%, 11/15/53 |
|
|
1,500 |
|
|
|
1,565,421 |
|
| Western Michigan University, Refunding RB |
|
|
|
|
|
|
|
|
| (AGM), 5.00%, 11/15/23(a) |
|
|
1,750 |
|
|
|
1,757,917 |
|
| 5.25%, 11/15/23(a) |
|
|
8,475 |
|
|
|
8,519,307 |
|
| (AGM), 5.25%, 11/15/23(a) |
|
|
1,000 |
|
|
|
1,005,228 |
|
| 5.00%, 11/15/49 |
|
|
8,435 |
|
|
|
8,866,973 |
|
|
|
|
|
|
|
|
|
|
|
|
|
|
|
|
|
|
|
|
117,076,815 |
|
|
|
|
| S C H E D U L E
O F I N V E S T M E N T S |
|
29 |
|
|
|
| Schedule of Investments (continued)
July 31, 2023 |
|
BlackRock MuniYield Michigan Quality Fund, Inc. (MIY)
(Percentages shown are based on Net Assets) |
|
|
|
|
|
|
|
|
|
| Security |
|
Par
(000) |
|
|
Value |
|
|
|
|
| Health — 29.6% |
|
|
|
|
|
|
|
|
| Grand Traverse County Hospital Finance Authority, RB |
|
|
|
|
|
|
|
|
| Series A, 5.00%, 07/01/44 |
|
$
|
4,230 |
|
|
$
|
4,264,009 |
|
| Series A, 5.00%, 07/01/47 |
|
|
2,200 |
|
|
|
2,216,966 |
|
| Series A, 5.00%, 07/01/49 |
|
|
2,610 |
|
|
|
2,708,405 |
|
| Series B, 4.00%, 07/01/49 |
|
|
2,000 |
|
|
|
1,862,888 |
|
| Kalamazoo Economic Development Corp., Refunding RB, 5.00%, 05/15/42 |
|
|
425 |
|
|
|
362,259 |
|
| Kentwood Economic Development Corp., Refunding RB, 4.00%, 11/15/43 |
|
|
750 |
|
|
|
560,619 |
|
| Michigan Finance Authority, RB |
|
|
|
|
|
|
|
|
| Series S, 5.00%, 11/01/44 |
|
|
15,000 |
|
|
|
15,318,090 |
|
| Series S, 4.00%, 11/01/46 |
|
|
1,025 |
|
|
|
967,219 |
|
| Michigan Finance Authority, Refunding RB |
|
|
|
|
|
|
|
|
| 5.00%, 11/15/37 |
|
|
3,000 |
|
|
|
3,085,902 |
|
| 5.00%, 11/15/41 |
|
|
1,000 |
|
|
|
1,024,564 |
|
| 4.00%, 04/15/42 |
|
|
3,210 |
|
|
|
3,121,889 |
|
| 5.00%, 11/15/45 |
|
|
1,690 |
|
|
|
1,704,717 |
|
| 5.00%, 12/01/45 |
|
|
18,445 |
|
|
|
18,915,126 |
|
| 4.00%, 11/15/46 |
|
|
8,500 |
|
|
|
7,994,547 |
|
| Series 2, 4.00%, 03/01/51 |
|
|
4,000 |
|
|
|
3,735,460 |
|
| Series A, 4.00%, 12/01/40 |
|
|
3,085 |
|
|
|
3,027,662 |
|
| Series A, 4.00%, 12/01/49 |
|
|
1,500 |
|
|
|
1,406,232 |
|
| Series S, 5.00%, 05/15/34 |
|
|
1,500 |
|
|
|
1,540,964 |
|
| Series S, 5.00%, 05/15/35 |
|
|
4,945 |
|
|
|
5,097,108 |
|
| Michigan State Hospital Finance Authority, Refunding RB, 5.00%, 11/15/47 |
|
|
4,000 |
|
|
|
4,190,440 |
|
| Michigan Strategic Fund, RB, 5.00%, 11/15/42 |
|
|
3,500 |
|
|
|
3,116,036 |
|
| Royal Oak Hospital Finance Authority, Refunding RB, Series D, 5.00%, 03/01/24(a) |
|
|
25,505 |
|
|
|
25,745,971 |
|
|
|
|
|
|
|
|
|
|
|
|
|
|
|
|
|
|
|
|
111,967,073 |
|
|
|
|
| Housing — 8.7% |
|
|
|
|
|
|
| Michigan State Housing Development Authority, RB, M/F Housing |
|
|
|
|
|
|
|
|
| Series A, 4.45%, 10/01/34 |
|
|
1,000 |
|
|
|
999,737 |
|
| Series A, 4.63%, 10/01/39 |
|
|
3,490 |
|
|
|
3,488,869 |
|
| Series A, 4.30%, 10/01/40 |
|
|
3,320 |
|
|
|
3,299,635 |
|
| Series A, 4.00%, 10/01/43 |
|
|
7,420 |
|
|
|
6,971,832 |
|
| Series A, 4.75%, 10/01/44 |
|
|
5,000 |
|
|
|
4,998,190 |
|
| Series A, 5.00%, 10/01/48 |
|
|
7,000 |
|
|
|
7,209,944 |
|
| AMT, (GNMA), 4.75%, 04/20/37 |
|
|
2,660 |
|
|
|
2,655,204 |
|
| Series A, AMT, 2.55%, 10/01/51 |
|
|
5,175 |
|
|
|
3,352,298 |
|
|
|
|
|
|
|
|
|
|
|
|
|
|
|
|
|
|
|
|
32,975,709 |
|
|
|
|
| State — 20.2% |
|
|
|
|
|
|
| Michigan Finance Authority, RB |
|
|
|
|
|
|
|
|
| Series F, 5.00%, 04/01/31 |
|
|
1,000 |
|
|
|
1,000,941 |
|
| Series F, 5.25%, 10/01/41 |
|
|
8,595 |
|
|
|
8,606,294 |
|
| Michigan State Building Authority, Refunding RB |
|
|
|
|
|
|
|
|
| Series I, 4.00%, 10/15/40 |
|
|
3,300 |
|
|
|
3,328,901 |
|
| Series I, 5.00%, 04/15/41 |
|
|
2,750 |
|
|
|
2,870,134 |
|
| Series I, 5.00%, 10/15/45 |
|
|
5,150 |
|
|
|
5,282,010 |
|
| Series I, 5.00%, 10/15/47 |
|
|
5,000 |
|
|
|
5,452,920 |
|
| Series I, 4.00%, 10/15/49 |
|
|
7,000 |
|
|
|
6,764,835 |
|
| Michigan Strategic Fund, RB |
|
|
|
|
|
|
|
|
| Series A, 5.25%, 10/15/40 |
|
|
3,000 |
|
|
|
3,110,988 |
|
| AMT, (AGM), 4.25%, 12/31/38 |
|
|
14,000 |
|
|
|
13,999,692 |
|
|
|
|
|
|
|
|
|
|
| Security |
|
Par
(000) |
|
|
Value |
|
|
|
|
| State (continued) |
|
|
|
|
|
|
| Michigan Strategic Fund, RB (continued) |
|
|
|
|
|
|
|
|
| AMT, 5.00%, 12/31/43 |
|
$ |
15,000 |
|
|
$ |
15,177,945 |
|
| State of Michigan Trunk Line Revenue, RB, 4.00%, 11/15/46 |
|
|
3,590 |
|
|
|
3,499,069 |
|
| State of Michigan Trunk Line Revenue, RB, BAB, Series B, 4.00%, 11/15/45 |
|
|
7,500 |
|
|
|
7,429,785 |
|
|
|
|
|
|
|
|
|
|
|
|
|
|
|
|
|
|
|
|
76,523,514 |
|
|
|
|
| Tobacco — 2.3% |
|
|
|
|
|
|
| Michigan Finance Authority, Refunding RB |
|
|
|
|
|
|
|
|
| Series A, Class 1, 4.00%, 06/01/39 |
|
|
1,250 |
|
|
|
1,240,819 |
|
| Series A, Class 1, 4.00%, 06/01/49 |
|
|
2,750 |
|
|
|
2,439,868 |
|
| Michigan Finance Authority, Refunding RB, CAB, Series B-2, Class 2, 0.00%, 06/01/65(b) |
|
|
50,000 |
|
|
|
4,823,000 |
|
|
|
|
|
|
|
|
|
|
|
|
|
|
|
|
|
|
|
|
8,503,687 |
|
|
|
|
| Transportation — 8.5% |
|
|
|
|
|
|
| Gerald R Ford International Airport Authority, ARB, AMT, (GTD), 5.00%, 01/01/51 |
|
|
5,435 |
|
|
|
5,767,845 |
|
| Wayne County Airport Authority, ARB |
|
|
|
|
|
|
|
|
| Series A, 5.00%, 12/01/42 |
|
|
1,000 |
|
|
|
1,047,500 |
|
| Series A, 5.00%, 12/01/46 |
|
|
4,000 |
|
|
|
4,299,140 |
|
| Series D, 5.00%, 12/01/35 |
|
|
3,850 |
|
|
|
4,030,056 |
|
| Series D, 5.00%, 12/01/45 |
|
|
5,000 |
|
|
|
5,120,895 |
|
| Series B, AMT, 5.00%, 12/01/42 |
|
|
2,000 |
|
|
|
2,058,882 |
|
| Series C, AMT, 5.00%, 12/01/39 |
|
|
1,475 |
|
|
|
1,491,855 |
|
| Wayne County Airport Authority, Refunding RB, Series F, AMT, 5.00%, 12/01/34 |
|
|
8,000 |
|
|
|
8,237,592 |
|
|
|
|
|
|
|
|
|
|
|
|
|
|
|
|
|
|
|
|
32,053,765 |
|
|
|
|
| Utilities — 12.1% |
|
|
|
|
|
|
| City of Detroit Michigan Water Supply System Revenue, RB, Series A, Senior Lien, (NPFGC), 5.00%,
07/01/34 |
|
|
10 |
|
|
|
10,010 |
|
| Downriver Utility Wastewater Authority, Refunding RB, (AGM), 5.00%, 04/01/43 |
|
|
1,000 |
|
|
|
1,033,733 |
|
| Great Lakes Water Authority Sewage Disposal System Revenue, RB, Series A, Senior Lien, 5.25%,
07/01/47 |
|
|
8,000 |
|
|
|
8,593,656 |
|
| Great Lakes Water Authority Water Supply System Revenue, RB, Series B, 2nd Lien, 5.00%, 07/01/46 . |
|
|
10,000 |
|
|
|
10,238,800 |
|
| Lansing Board of Water & Light, Refunding RB |
|
|
|
|
|
|
|
|
| Series A, 5.00%, 07/01/44 |
|
|
1,000 |
|
|
|
1,063,724 |
|
| Series A, 5.00%, 07/01/48 |
|
|
14,000 |
|
|
|
14,791,728 |
|
| Michigan Finance Authority, Refunding RB |
|
|
|
|
|
|
|
|
| Series D-1, 5.00%, 07/01/35 |
|
|
750 |
|
|
|
777,384 |
|
| Series C-3, Senior Lien, (AGM), 5.00%, 07/01/31 |
|
|
1,000 |
|
|
|
1,017,014 |
|
| Series C-3, Senior Lien, (AGM), 5.00%, 07/01/32 |
|
|
5,250 |
|
|
|
5,335,344 |
|
| Series C-3, Senior Lien, (AGM), 5.00%, 07/01/33 |
|
|
3,000 |
|
|
|
3,047,121 |
|
|
|
|
|
|
|
|
|
|
|
|
|
|
|
|
|
|
|
|
45,908,514 |
|
|
|
|
|
|
|
|
|
|
|
|
|
| Total Municipal Bonds in Michigan |
|
|
|
|
|
|
559,366,947 |
|
|
|
|
| Puerto Rico — 5.1% |
|
|
|
|
|
|
|
|
|
| State — 5.1% |
|
|
|
|
|
|
| Commonwealth of Puerto Rico, GO, Series A-1, Restructured,
5.75%, 07/01/31 |
|
|
1,061 |
|
|
|
1,155,795 |
|
|
|
|
| 30 |
|
2 0 2 3 B L A C
K R O C K A N N U A L R E P O R
T T O S H A R E H O L D E R
S |
|
|
|
| Schedule of Investments (continued)
July 31, 2023 |
|
BlackRock MuniYield Michigan Quality Fund, Inc. (MIY)
(Percentages shown are based on Net Assets) |
|
|
|
|
|
|
|
|
|
| Security |
|
Par
(000) |
|
|
Value |
|
|
|
|
| State (continued) |
|
|
|
|
|
|
| Puerto Rico Sales Tax Financing Corp. Sales Tax Revenue, RB |
|
|
|
|
|
|
|
|
| Series A-1, Restructured, 4.75%, 07/01/53 |
|
$ |
534 |
|
|
$ |
504,569 |
|
| Series A-1, Restructured, 5.00%, 07/01/58 |
|
|
825 |
|
|
|
804,931 |
|
| Series A-2, Restructured, 4.78%, 07/01/58 |
|
|
103 |
|
|
|
96,915 |
|
| Series A-2, Restructured, 4.33%, 07/01/40 |
|
|
1,109 |
|
|
|
1,048,918 |
|
| Series B-1, Restructured, 4.75%, 07/01/53 |
|
|
616 |
|
|
|
581,909 |
|
| Series B-1, Restructured, 5.00%, 07/01/58 |
|
|
7,451 |
|
|
|
7,272,184 |
|
| Series B-2, Restructured, 4.33%, 07/01/40 |
|
|
5,880 |
|
|
|
5,550,314 |
|
| Series B-2, Restructured, 4.78%, 07/01/58 |
|
|
597 |
|
|
|
561,873 |
|
| Puerto Rico Sales Tax Financing Corp. Sales Tax Revenue, RB, CAB, Series A-1, Restructured, 0.00%, 07/01/46(b) |
|
|
6,202 |
|
|
|
1,748,449 |
|
|
|
|
|
|
|
|
|
|
|
|
|
| Total Municipal Bonds in Puerto Rico |
|
|
|
|
19,325,857 |
|
|
|
|
|
|
|
|
|
|
|
|
|
| Total Municipal Bonds — 153.0%
(Cost: $579,746,588) |
|
|
|
|
|
|
578,692,804 |
|
|
|
|
|
|
|
|
|
|
|
| Municipal Bonds Transferred to Tender Option Bond Trusts(c) |
|
|
|
|
| Michigan — 3.5% |
|
|
|
|
|
|
|
|
|
|
|
| Education — 1.7% |
|
|
|
|
|
|
| Michigan State University, Refunding RB, Series B, 5.00%, 02/15/48 |
|
|
6,160 |
|
|
|
6,513,630 |
|
|
|
|
|
|
|
|
|
|
|
|
|
| Housing — 1.8% |
|
|
|
|
|
|
| Michigan State Housing Development Authority, RB, S/F Housing, Series D, 5.50%, 06/01/53 |
|
|
6,508 |
|
|
|
6,858,382 |
|
|
|
|
|
|
|
|
|
|
|
|
|
| Total Municipal Bonds in Michigan |
|
|
|
|
13,372,012 |
|
|
|
|
|
|
|
|
|
|
|
|
| Total Municipal Bonds Transferred to Tender Option Bond Trusts — 3.5%
(Cost:
$13,194,243) |
|
|
|
13,372,012 |
|
|
|
|
|
|
|
|
|
|
|
|
| Total Long-Term Investments — 156.5%
(Cost: $592,940,831) |
|
|
|
592,064,816 |
|
|
|
|
|
|
|
|
|
|
|
|
|
|
|
|
|
|
|
| Security |
|
Shares |
|
|
Value |
|
|
|
|
| Short-Term Securities |
|
|
|
|
|
|
|
|
|
|
|
| Money Market Funds — 4.8% |
|
|
|
|
|
|
|
|
| BlackRock Liquidity Funds, MuniCash, Institutional Class,
3.57%(d)(e) |
|
|
18,024,108 |
|
|
$ |
18,024,108 |
|
|
|
|
|
|
|
|
|
|
|
|
| Total Short-Term Securities — 4.8%
(Cost: $18,024,699) |
|
|
|
18,024,108 |
|
|
|
|
|
|
|
|
|
|
|
|
| Total Investments — 161.3%
(Cost: $610,965,530) |
|
|
|
610,088,924 |
|
|
|
| Other Assets Less Liabilities — 1.6% |
|
|
|
6,035,559 |
|
|
|
| Liability for TOB Trust Certificates, Including Interest Expense and Fees Payable —
(1.7)% |
|
|
|
(6,398,402 |
) |
|
|
| VRDP Shares at Liquidation Value, Net of Deferred Offering Costs — (61.2)% |
|
|
|
(231,553,356 |
) |
|
|
|
|
|
|
|
|
|
|
|
| Net Assets Applicable to Common Shares — 100.0% |
|
|
$ |
378,172,725 |
|
|
|
|
|
|
|
|
|
|
| (a) |
U.S. Government securities held in escrow, are used to pay interest on this security as well as to retire the bond in
full at the date indicated, typically at a premium to par. |
| (c) |
Represent bonds transferred to a TOB Trust in exchange of cash and residual certificates received by the Fund. These
bonds serve as collateral in a secured borrowing. See Note 4 of the Notes to Financial Statements for details. |
| (d) |
Affiliate of the Fund. |
| (e) |
Annualized 7-day yield as of period end.
|
For Fund compliance purposes, the
Fund’s sector classifications refer to one or more of the sector sub-classifications used by one or more widely recognized market indexes or rating group indexes, and/or as defined by the investment adviser. These definitions may not apply for
purposes of this report, which may combine such sector sub-classifications for reporting ease.
Affiliates
Investments in issuers considered to be affiliate(s) of the Fund during the year ended July 31, 2023 for purposes of Section 2(a)(3) of the
Investment Company Act of 1940, as amended, were as follows:
|
|
|
|
|
|
|
|
|
|
|
|
|
|
|
|
|
|
|
|
|
|
|
|
|
|
|
|
|
|
|
|
|
|
|
|
|
| |
|
|
|
|
|
|
|
|
|
| Affiliated Issuer |
|
Value at
07/31/22 |
|
|
Purchases
at Cost |
|
|
Proceeds
from Sales |
|
|
Net
Realized
Gain (Loss) |
|
|
Change in
Unrealized
Appreciation
(Depreciation) |
|
|
Value at
07/31/23 |
|
|
Shares
Held at
07/31/23 |
|
|
Income |
|
|
Capital Gain
Distributions
from
Underlying
Funds |
|
| BlackRock Liquidity Funds, MuniCash, Institutional Class |
|
$ |
2,981,267 |
|
|
$ |
15,041,163 |
(a) |
|
$ |
— |
|
|
$ |
2,364 |
|
|
$ |
(686 |
) |
|
$ |
18,024,108 |
|
|
|
18,024,108 |
|
|
$ |
187,208 |
|
|
$ |
— |
|
|
|
|
|
|
|
|
|
|
|
|
|
|
|
|
|
|
|
|
|
|
|
|
|
|
|
|
|
|
|
|
|
|
|
|
|
|
| |
(a) |
Represents net amount purchased (sold). |
|
|
|
|
| S C H E D U L E
O F I N V E S T M E N T S |
|
31 |
|
|
|
| Schedule of Investments (continued)
July 31, 2023 |
|
BlackRock MuniYield Michigan Quality Fund, Inc. (MIY) |
Derivative Financial Instruments Categorized by Risk Exposure
For the period ended July 31, 2023, the effect of derivative financial instruments in the Statements of Operations was as follows:
|
|
|
|
|
|
|
|
|
|
|
|
|
|
|
|
|
|
|
|
|
|
|
|
|
|
|
|
|
| |
|
|
|
|
|
|
|
| |
|
Commodity
Contracts |
|
|
Credit
Contracts |
|
|
Equity
Contracts |
|
|
Foreign
Currency Exchange
Contracts |
|
|
Interest
Rate
Contracts |
|
|
Other
Contracts |
|
|
Total |
|
| Net Realized Gain (Loss) from: |
|
|
|
|
|
|
|
|
|
|
|
|
|
|
|
|
|
|
|
|
|
|
|
|
|
|
|
|
| Futures contracts |
|
$ |
— |
|
|
$ |
— |
|
|
$ |
— |
|
|
$ |
— |
|
|
$ |
(790,254 |
) |
|
$ |
— |
|
|
$ |
(790,254 |
) |
|
|
|
|
|
|
|
|
|
|
|
|
|
|
|
|
|
|
|
|
|
|
|
|
|
|
|
|
|
Average Quarterly Balances of Outstanding Derivative Financial Instruments
|
|
|
|
|
| Futures contracts: |
|
|
|
|
| Average notional value of contracts — short |
|
$ |
12,220,883 |
|
For more information about the Fund’s investment risks regarding derivative financial instruments, refer to the Notes
to Financial Statements.
Fair Value Hierarchy as of Period End
Various inputs are used in determining the fair value of financial instruments. For a description of the input levels and information about the
Fund’s policy regarding valuation of financial instruments, refer to the Notes to Financial Statements.
The following table summarizes the
Fund’s financial instruments categorized in the fair value hierarchy. The breakdown of the Fund’s financial instruments into major categories is disclosed in the Schedule of Investments above.
|
|
|
|
|
|
|
|
|
|
|
|
|
|
|
|
|
|
|
|
|
|
|
|
|
|
|
|
|
| |
|
|
|
|
|
|
|
| |
|
Level 1 |
|
|
|
|
|
Level 2 |
|
|
|
|
|
Level 3 |
|
|
|
|
|
Total |
|
| Assets |
|
|
|
|
|
|
|
|
|
|
|
|
|
|
|
|
|
|
|
|
|
|
|
|
|
|
|
|
| Investments |
|
|
|
|
|
|
|
|
|
|
|
|
|
|
|
|
|
|
|
|
|
|
|
|
|
|
|
|
| Long-Term Investments |
|
|
|
|
|
|
|
|
|
|
|
|
|
|
|
|
|
|
|
|
|
|
|
|
|
|
|
|
| Municipal Bonds |
|
$ |
— |
|
|
|
|
|
|
$ |
578,692,804 |
|
|
|
|
|
|
$ |
— |
|
|
|
|
|
|
$ |
578,692,804 |
|
| Municipal Bonds Transferred to Tender Option Bond Trusts |
|
|
— |
|
|
|
|
|
|
|
13,372,012 |
|
|
|
|
|
|
|
— |
|
|
|
|
|
|
|
13,372,012 |
|
| Short-Term Securities |
|
|
|
|
|
|
|
|
|
|
|
|
|
|
|
|
|
|
|
|
|
|
|
|
|
|
|
|
| Money Market Funds |
|
|
18,024,108 |
|
|
|
|
|
|
|
— |
|
|
|
|
|
|
|
— |
|
|
|
|
|
|
|
18,024,108 |
|
|
|
|
|
|
|
|
|
|
|
|
|
|
|
|
|
|
|
|
|
|
|
|
|
|
|
|
|
|
|
|
|
|
|
|
|
|
|
|
$ |
18,024,108 |
|
|
|
|
|
|
$ |
592,064,816 |
|
|
|
|
|
|
$ |
— |
|
|
|
|
|
|
$ |
610,088,924 |
|
|
|
|
|
|
|
|
|
|
|
|
|
|
|
|
|
|
|
|
|
|
|
|
|
|
|
|
|
|
The Fund may hold assets and/or liabilities in which the fair value approximates the carrying amount for financial
statement purposes. As of period end, such assets and/or liabilities are categorized within the fair value hierarchy as follows:
|
|
|
|
|
|
|
|
|
|
|
|
|
|
|
|
|
|
|
|
|
|
|
|
|
|
|
|
|
| |
|
|
|
|
|
|
|
| |
|
Level 1 |
|
|
|
|
|
Level 2 |
|
|
|
|
|
Level 3 |
|
|
|
|
|
Total |
|
| Liabilities |
|
|
|
|
|
|
|
|
|
|
|
|
|
|
|
|
|
|
|
|
|
|
|
|
|
|
|
|
| TOB Trust Certificates |
|
$ |
— |
|
|
|
|
|
|
$ |
(6,333,877 |
) |
|
|
|
|
|
$ |
— |
|
|
|
|
|
|
$ |
(6,333,877 |
) |
| VRDP Shares at Liquidation Value |
|
|
— |
|
|
|
|
|
|
|
(231,900,000 |
) |
|
|
|
|
|
|
— |
|
|
|
|
|
|
|
(231,900,000 |
) |
|
|
|
|
|
|
|
|
|
|
|
|
|
|
|
|
|
|
|
|
|
|
|
|
|
|
|
|
|
|
|
|
|
|
|
|
|
|
|
$ |
— |
|
|
|
|
|
|
$ |
(238,233,877 |
) |
|
|
|
|
|
$ |
— |
|
|
|
|
|
|
$ |
(238,233,877 |
) |
|
|
|
|
|
|
|
|
|
|
|
|
|
|
|
|
|
|
|
|
|
|
|
|
|
|
|
|
|
See notes to financial statements.
|
|
|
| 32 |
|
2 0 2 3 B L A C
K R O C K A N N U A L R E P O R
T T O S H A R E H O L D E R
S |
|
|
|
| Schedule of Investments July 31, 2023 |
|
BlackRock MuniYield New York Quality Fund, Inc. (MYN)
(Percentages shown are based on Net Assets) |
|
|
|
|
|
|
|
|
|
| Security |
|
Par
(000) |
|
|
Value |
|
|
|
|
| Municipal Bonds |
|
|
|
|
|
|
|
|
|
|
|
| Alabama — 0.4% |
|
|
|
|
|
|
|
|
|
| Corporate — 0.4% |
|
|
|
|
|
|
| Lower Alabama Gas District, RB, Series A, 5.00%, 09/01/46 |
|
$ |
1,920 |
|
|
$ |
1,952,724 |
|
|
|
|
|
|
|
|
|
|
|
|
|
| Guam — 0.2% |
|
|
|
|
|
|
|
|
|
| Utilities — 0.2% |
|
|
|
|
|
|
| Guam Power Authority, Refunding RB, Series A, 5.00%, 10/01/41 |
|
|
710 |
|
|
|
735,987 |
|
|
|
|
|
|
|
|
|
|
|
|
|
| New York — 140.9% |
|
|
|
|
|
|
|
|
|
| Corporate — 3.8% |
|
|
|
|
|
|
| New York Liberty Development Corp., RB, 5.50%, 10/01/37 |
|
|
1,015 |
|
|
|
1,166,422 |
|
| New York Liberty Development Corp., Refunding RB, 5.25%, 10/01/35 |
|
|
7,385 |
|
|
|
8,446,801 |
|
| New York State Energy Research & Development Authority, Refunding RB, Series C, 4.00%,
04/01/34 |
|
|
860 |
|
|
|
868,917 |
|
| New York State Environmental Facilities Corp., RB, AMT, 2.75%, 09/01/50(a) |
|
|
205 |
|
|
|
196,917 |
|
| New York Transportation Development Corp., ARB, AMT, 5.00%, 01/01/30 |
|
|
2,500 |
|
|
|
2,586,370 |
|
| New York Transportation Development Corp., RB |
|
|
|
|
|
|
|
|
| AMT, 5.00%, 10/01/35 |
|
|
1,895 |
|
|
|
1,984,139 |
|
| AMT, 5.00%, 10/01/40 |
|
|
500 |
|
|
|
509,980 |
|
| New York Transportation Development Corp., Refunding ARB, AMT, 3.00%, 08/01/31 |
|
|
1,755 |
|
|
|
1,545,400 |
|
|
|
|
|
|
|
|
|
|
|
|
|
|
|
|
|
|
|
|
17,304,946 |
|
|
| County/City/Special District/School District — 28.5% |
|
| Battery Park City Authority, RB, Sustainability Bonds, 4.00%, 11/01/44 |
|
|
4,605 |
|
|
|
4,632,823 |
|
| City of New York, GO |
|
|
|
|
|
|
|
|
| Series A-1, 4.00%, 09/01/46 |
|
|
2,695 |
|
|
|
2,634,810 |
|
| Series D-1, 5.50%, 05/01/46 |
|
|
1,360 |
|
|
|
1,549,120 |
|
| Series F-1, 4.00%, 03/01/47 |
|
|
2,730 |
|
|
|
2,684,911 |
|
| Sub-Series A-1, 5.00%, 08/01/33 |
|
|
2,100 |
|
|
|
2,102,512 |
|
| Sub-Series D-1, 5.00%, 08/01/31 |
|
|
1,300 |
|
|
|
1,301,189 |
|
| Sub-Series E-1, 4.00%, 04/01/45 |
|
|
2,880 |
|
|
|
2,839,450 |
|
| City of New York, Refunding GO, Series E, 5.00%, 08/01/32 |
|
|
2,040 |
|
|
|
2,041,869 |
|
| County of Nassau New York, GO |
|
|
|
|
|
|
|
|
| Series A, 5.00%, 01/15/31 |
|
|
1,770 |
|
|
|
1,910,763 |
|
| Series A, 4.25%, 04/01/52 |
|
|
5,000 |
|
|
|
5,050,070 |
|
| County of Nassau New York, Refunding GO |
|
|
|
|
|
|
|
|
| Series A, (AGM), 4.00%, 04/01/49 |
|
|
4,235 |
|
|
|
4,126,127 |
|
| Series B, (AGM), 5.00%, 04/01/40 |
|
|
2,155 |
|
|
|
2,326,501 |
|
| Erie County Industrial Development Agency, Refunding RB |
|
|
|
|
|
|
|
|
| Series A, (SAW), 5.00%, 05/01/28 |
|
|
750 |
|
|
|
783,991 |
|
| Series A, (SAW), 5.00%, 05/01/29 |
|
|
4,060 |
|
|
|
4,246,297 |
|
| Ithaca City School District, Refunding GO, (BAM SAW), 2.00%, 06/15/33 |
|
|
450 |
|
|
|
396,390 |
|
| Mahopac Central School District, Refunding GO, (SAW), 2.00%, 06/01/32 |
|
|
685 |
|
|
|
617,596 |
|
| New York City Industrial Development Agency,
RB(b) |
|
|
|
|
|
|
|
|
| (AGC), 0.00%, 03/01/39 |
|
|
5,000 |
|
|
|
2,365,660 |
|
| (AGC), 0.00%, 03/01/43 |
|
|
4,330 |
|
|
|
1,609,924 |
|
|
|
|
|
|
|
|
|
|
| Security |
|
Par
(000) |
|
|
Value |
|
|
|
| County/City/Special District/School District (continued) |
|
|
|
|
| New York City Industrial Development Agency, Refunding RB, (AGM), 4.00%, 03/01/45 |
|
$ |
4,395 |
|
|
$ |
4,301,808 |
|
| New York City Transitional Finance Authority Future Tax Secured Revenue, RB |
|
|
|
|
|
|
|
|
| Series A-1, 5.00%, 11/01/38 |
|
|
1,000 |
|
|
|
1,003,709 |
|
| Series A-1, 5.00%, 08/01/40 |
|
|
1,025 |
|
|
|
1,094,446 |
|
| Series B-1, 5.00%, 08/01/45 |
|
|
4,425 |
|
|
|
4,612,045 |
|
| Sub-Series A-3, 4.00%, 08/01/43 |
|
|
3,320 |
|
|
|
3,284,894 |
|
| Sub-Series B-1, 5.00%, 11/01/35 |
|
|
2,510 |
|
|
|
2,550,850 |
|
| Sub-Series B-1, 5.00%, 11/01/36 |
|
|
1,690 |
|
|
|
1,714,819 |
|
| Sub-Series B-1, 5.00%, 11/01/38 |
|
|
4,000 |
|
|
|
4,154,536 |
|
| Sub-Series E-1, 5.00%, 02/01/43 |
|
|
3,725 |
|
|
|
3,886,427 |
|
| Series A, Subordinate, 4.00%, 05/01/53 |
|
|
1,585 |
|
|
|
1,531,288 |
|
| Series A-2, Subordinate, 5.00%, 08/01/39 |
|
|
4,105 |
|
|
|
4,333,632 |
|
| Series C, Subordinate, 4.00%, 05/01/45 |
|
|
2,725 |
|
|
|
2,651,575 |
|
| Series F-1, Subordinate, 5.00%, 02/01/44 |
|
|
430 |
|
|
|
467,959 |
|
| New York Convention Center Development Corp., RB,
CAB(b) |
|
|
|
|
|
|
|
|
| Series B, Sub Lien, 0.00%, 11/15/42 |
|
|
2,640 |
|
|
|
1,005,193 |
|
| Series B, Sub Lien, 0.00%, 11/15/47 |
|
|
6,740 |
|
|
|
1,900,478 |
|
| Series B, Sub Lien, 0.00%, 11/15/48 |
|
|
3,550 |
|
|
|
994,185 |
|
| Series B, Sub Lien, (AGM-CR), 0.00%, 11/15/56 |
|
|
7,825 |
|
|
|
1,416,716 |
|
| New York Convention Center Development Corp., Refunding RB |
|
|
|
|
|
|
|
|
| 5.00%, 11/15/40 |
|
|
7,370 |
|
|
|
7,548,229 |
|
| 5.00%, 11/15/45 |
|
|
13,995 |
|
|
|
14,263,620 |
|
| New York Liberty Development Corp., Refunding RB |
|
|
|
|
|
|
|
|
| Series 1, 5.00%, 11/15/44(c) |
|
|
6,110 |
|
|
|
5,963,116 |
|
| Series A, 3.00%, 11/15/51 |
|
|
4,805 |
|
|
|
3,487,282 |
|
| South Glens Falls Central School District, Refunding GO |
|
|
|
|
|
|
|
|
| Series A, (SAW), 2.00%, 07/15/34 |
|
|
1,400 |
|
|
|
1,201,327 |
|
| Series A, (SAW), 2.00%, 07/15/35 |
|
|
830 |
|
|
|
719,881 |
|
| Triborough Bridge & Tunnel Authority Sales Tax Revenue, RB |
|
|
|
|
|
|
|
|
| Class A, 4.00%, 05/15/57 |
|
|
1,600 |
|
|
|
1,556,574 |
|
| Series A, 4.13%, 05/15/53 |
|
|
1,980 |
|
|
|
1,950,957 |
|
| Series A, 5.00%, 05/15/53 |
|
|
3,955 |
|
|
|
4,314,241 |
|
| Trust for Cultural Resources of The City of New York, Refunding RB(d) |
|
|
|
|
|
|
|
|
| 5.00%, 08/01/23 |
|
|
2,000 |
|
|
|
2,000,000 |
|
| Series A, 5.00%, 08/01/23 |
|
|
750 |
|
|
|
750,000 |
|
| Yonkers Industrial Development Agency, Refunding RB, (SAW), 4.00%, 05/01/41 |
|
|
1,280 |
|
|
|
1,286,536 |
|
|
|
|
|
|
|
|
|
|
|
|
|
|
|
|
|
|
|
|
129,166,326 |
|
|
|
|
| Education — 13.9% |
|
|
|
|
|
|
| Albany Capital Resource Corp., Refunding RB |
|
|
|
|
|
|
|
|
| 4.00%, 07/01/41 |
|
|
880 |
|
|
|
554,536 |
|
| 4.00%, 07/01/51 |
|
|
915 |
|
|
|
508,076 |
|
| Build NYC Resource Corp., RB, 5.75%,
06/01/52(c) |
|
|
1,000 |
|
|
|
994,910 |
|
| Build NYC Resource Corp., Refunding RB |
|
|
|
|
|
|
|
|
| 4.00%, 08/01/42 |
|
|
975 |
|
|
|
882,680 |
|
| Series A, 5.00%, 06/01/43 |
|
|
525 |
|
|
|
533,298 |
|
| Dutchess County Local Development Corp., RB |
|
|
|
|
|
|
|
|
| 5.00%, 07/01/43 |
|
|
685 |
|
|
|
718,800 |
|
| 5.00%, 07/01/48 |
|
|
1,030 |
|
|
|
1,072,893 |
|
| 5.00%, 07/01/52 |
|
|
1,635 |
|
|
|
1,743,337 |
|
|
|
|
| S C H E D U L E
O F I N V E S T M E N T S |
|
33 |
|
|
|
| Schedule of Investments (continued)
July 31, 2023 |
|
BlackRock MuniYield New York Quality Fund, Inc. (MYN)
(Percentages shown are based on Net Assets) |
|
|
|
|
|
|
|
|
|
| Security |
|
Par
(000) |
|
|
Value |
|
|
|
|
| Education (continued) |
|
|
|
|
|
|
| Dutchess County Local Development Corp., Refunding RB |
|
|
|
|
|
|
|
|
| 5.00%, 07/01/42 |
|
$ |
1,180 |
|
|
$ |
1,237,313 |
|
| 4.00%, 07/01/46 |
|
|
2,235 |
|
|
|
2,219,925 |
|
| Madison County Capital Resource Corp., RB |
|
|
|
|
|
|
|
|
| Series B, 5.00%, 07/01/40 |
|
|
815 |
|
|
|
837,741 |
|
| Series B, 5.00%, 07/01/43 |
|
|
2,940 |
|
|
|
3,013,750 |
|
| Monroe County Industrial Development Corp., Refunding RB |
|
|
|
|
|
|
|
|
| Series A, 4.00%, 07/01/39 |
|
|
500 |
|
|
|
502,946 |
|
| Series A, 4.00%, 07/01/50 |
|
|
14,560 |
|
|
|
13,940,574 |
|
| New York State Dormitory Authority, RB |
|
|
|
|
|
|
|
|
| 1st Series, (AMBAC), 5.50%, 07/01/40 |
|
|
4,580 |
|
|
|
5,617,901 |
|
| Series A, 5.00%, 07/01/46 |
|
|
490 |
|
|
|
494,999 |
|
| New York State Dormitory Authority, Refunding RB |
|
|
|
|
|
|
|
|
| 5.00%, 07/01/44 |
|
|
2,130 |
|
|
|
2,150,180 |
|
| Series A, 5.00%, 07/01/35 |
|
|
1,380 |
|
|
|
1,428,674 |
|
| Series A, 4.00%, 07/01/37 |
|
|
240 |
|
|
|
240,559 |
|
| Series A, 5.00%, 07/01/38 |
|
|
1,475 |
|
|
|
1,555,110 |
|
| Series A, 5.00%, 07/01/43 |
|
|
2,520 |
|
|
|
2,568,077 |
|
| Series A, 5.00%, 07/01/48 |
|
|
6,900 |
|
|
|
7,055,098 |
|
| Onondaga County Trust for Cultural Resources, Refunding RB |
|
|
|
|
|
|
|
|
| 5.00%, 12/01/38 |
|
|
1,835 |
|
|
|
1,994,542 |
|
| 5.00%, 12/01/39 |
|
|
3,215 |
|
|
|
3,484,668 |
|
| 4.00%, 12/01/47 |
|
|
2,200 |
|
|
|
2,144,435 |
|
| Troy Capital Resource Corp., Refunding RB |
|
|
|
|
|
|
|
|
| 5.00%, 09/01/35 |
|
|
550 |
|
|
|
605,792 |
|
| 4.00%, 09/01/40 |
|
|
985 |
|
|
|
952,081 |
|
| Trust for Cultural Resources of The City of New York, Refunding RB |
|
|
|
|
|
|
|
|
| Series A, 5.00%, 07/01/37 |
|
|
2,265 |
|
|
|
2,308,549 |
|
| Series A, 5.00%, 07/01/41 |
|
|
825 |
|
|
|
838,549 |
|
| Yonkers Economic Development Corp., Refunding RB |
|
|
|
|
|
|
|
|
| Series A, 5.00%, 10/15/40 |
|
|
380 |
|
|
|
361,068 |
|
| Series A, 5.00%, 10/15/50 |
|
|
645 |
|
|
|
580,144 |
|
|
|
|
|
|
|
|
|
|
|
|
|
|
|
|
|
|
|
|
63,141,205 |
|
|
|
|
| Health — 7.2% |
|
|
|
|
|
|
| Build NYC Resource Corp., RB |
|
|
|
|
|
|
|
|
| Class A, 5.25%, 07/01/37 |
|
|
1,495 |
|
|
|
1,369,012 |
|
| Class A, 5.50%, 07/01/47 |
|
|
920 |
|
|
|
818,221 |
|
| Genesee County Funding Corp., Refunding RB, Series A, 5.25%, 12/01/52 |
|
|
1,810 |
|
|
|
1,876,610 |
|
| Huntington Local Development Corp., RB, Series A, 5.25%, 07/01/56 |
|
|
285 |
|
|
|
223,864 |
|
| Monroe County Industrial Development Corp., RB |
|
|
|
|
|
|
|
|
| 4.00%, 12/01/41 |
|
|
800 |
|
|
|
723,186 |
|
| 5.00%, 12/01/46 |
|
|
375 |
|
|
|
378,222 |
|
| Series A, 5.00%, 12/01/32 |
|
|
830 |
|
|
|
830,455 |
|
| Series A, 5.00%, 12/01/37 |
|
|
350 |
|
|
|
350,182 |
|
| Monroe County Industrial Development Corp., Refunding RB |
|
|
|
|
|
|
|
|
| 4.00%, 12/01/38 |
|
|
1,450 |
|
|
|
1,362,098 |
|
| 4.00%, 12/01/39 |
|
|
525 |
|
|
|
489,956 |
|
| 4.00%, 12/01/46 |
|
|
2,870 |
|
|
|
2,543,962 |
|
| New York State Dormitory Authority, RB |
|
|
|
|
|
|
|
|
| Series C, 4.25%, 05/01/39 |
|
|
1,000 |
|
|
|
999,877 |
|
| Series D, 4.25%, 05/01/39 |
|
|
300 |
|
|
|
299,963 |
|
|
|
|
|
|
|
|
|
|
| Security |
|
Par
(000) |
|
|
Value |
|
|
|
|
| Health (continued) |
|
|
|
|
|
|
| New York State Dormitory Authority, Refunding RB |
|
|
|
|
|
|
|
|
| 4.00%, 07/01/45 |
|
$ |
460 |
|
|
$ |
311,814 |
|
| 4.00%, 07/01/47 |
|
|
3,250 |
|
|
|
3,173,352 |
|
| 4.25%, 05/01/52 |
|
|
4,355 |
|
|
|
4,264,982 |
|
| 5.00%, 05/01/52 |
|
|
4,650 |
|
|
|
4,967,897 |
|
| Series A, 5.00%, 05/01/32 |
|
|
3,525 |
|
|
|
3,634,920 |
|
| Oneida County Local Development Corp., Refunding RB, (AGM), 3.00%, 12/01/44 |
|
|
3,070 |
|
|
|
2,368,702 |
|
| Suffolk County Economic Development Corp., RB, Series C, 5.00%, 07/01/32 |
|
|
625 |
|
|
|
635,117 |
|
| Westchester County Local Development Corp., Refunding
RB(c) |
|
|
|
|
|
|
|
|
| 5.00%, 07/01/41 |
|
|
610 |
|
|
|
514,189 |
|
| 5.00%, 07/01/56 |
|
|
680 |
|
|
|
525,269 |
|
|
|
|
|
|
|
|
|
|
|
|
|
|
|
|
|
|
|
|
32,661,850 |
|
|
|
|
| Housing — 7.8% |
|
|
|
|
|
|
| New York City Housing Development Corp., RB, M/F Housing |
|
|
|
|
|
|
|
|
| Series G-1, 3.90%, 05/01/45 |
|
|
550 |
|
|
|
489,585 |
|
| Sustainability Bonds, 4.80%, 02/01/53 |
|
|
3,440 |
|
|
|
3,482,498 |
|
| Class F-1, Sustainability Bonds, 4.60%, 11/01/42 |
|
|
275 |
|
|
|
277,446 |
|
| Series A, Sustainability Bonds, 4.75%, 11/01/48 |
|
|
420 |
|
|
|
425,872 |
|
| Series E-1, Sustainability Bonds, (SONYMA HUD SECT 8), 4.20%, 11/01/42 |
|
|
1,080 |
|
|
|
1,044,116 |
|
| New York City Housing Development Corp., Refunding RB, Series F-1-A, Sustainability Bonds, 3.30%,
11/01/46 |
|
|
560 |
|
|
|
474,266 |
|
| New York City Housing Development Corp., Refunding RB, M/F Housing |
|
|
|
|
|
|
|
|
| Sustainability Bonds, 3.85%, 05/01/58 |
|
|
2,084 |
|
|
|
1,748,835 |
|
| Series B-1-A, Sustainability Bonds, 3.75%, 11/01/54 |
|
|
1,615 |
|
|
|
1,377,908 |
|
| New York State Housing Finance Agency, RB |
|
|
|
|
|
|
|
|
| Series D, (SONYMA), 3.80%, 11/01/49 |
|
|
2,050 |
|
|
|
1,730,979 |
|
| Series B-1, Sustainability Bonds, (SONYMA), 4.85%, 11/01/48 |
|
|
1,525 |
|
|
|
1,546,208 |
|
| New York State Housing Finance Agency, RB, M/F Housing |
|
|
|
|
|
|
|
|
| (SONYMA), 4.65%, 11/01/48 |
|
|
625 |
|
|
|
627,411 |
|
| Series B, (FHLMC, FNMA, GNMA, SONYMA), 4.00%, 11/01/42 |
|
|
1,045 |
|
|
|
957,536 |
|
| Series E, (SONYMA), 3.80%, 11/01/49 |
|
|
1,130 |
|
|
|
953,477 |
|
| Series H, (FNMA, SONYMA), 4.15%, 11/01/43 |
|
|
1,650 |
|
|
|
1,534,612 |
|
| Series H, (FNMA, SONYMA), 4.20%, 11/01/48 |
|
|
1,095 |
|
|
|
997,485 |
|
| Series I, (FNMA, SONYMA), 4.05%, 11/01/48 |
|
|
1,210 |
|
|
|
1,076,769 |
|
| Series A, AMT, 4.65%, 11/15/38 |
|
|
1,500 |
|
|
|
1,455,571 |
|
| New York State Housing Finance Agency, Refunding RB, Series C, (FNMA, SONYMA), 3.85%, 11/01/39 . |
|
|
2,415 |
|
|
|
2,224,927 |
|
| State of New York Mortgage Agency, RB, S/F Housing |
|
|
|
|
|
|
|
|
| 250th Series, (SONYMA), 4.80%, 10/01/48 |
|
|
3,960 |
|
|
|
4,045,326 |
|
| Series 239, (SONYMA), 2.70%, 10/01/47 |
|
|
1,630 |
|
|
|
1,173,805 |
|
| State of New York Mortgage Agency, Refunding RB |
|
|
|
|
|
|
|
|
| Series 190, 3.80%, 10/01/40 |
|
|
1,680 |
|
|
|
1,643,391 |
|
| Series 194, AMT, 3.80%, 04/01/28 |
|
|
2,485 |
|
|
|
2,485,835 |
|
| Series 218, AMT, 3.60%, 04/01/33 |
|
|
1,040 |
|
|
|
1,024,253 |
|
| Series 218, AMT, 3.85%, 04/01/38 |
|
|
125 |
|
|
|
124,196 |
|
| Yonkers Industrial Development Agency, RB, AMT, (SONYMA), 5.25%, 04/01/37 |
|
|
2,445 |
|
|
|
2,445,235 |
|
|
|
|
|
|
|
|
|
|
|
|
|
|
|
|
|
|
|
|
35,367,542 |
|
|
|
|
| 34 |
|
2 0 2 3 B L A C
K R O C K A N N U A L R E P O R
T T O S H A R E H O L D E R
S |
|
|
|
| Schedule of Investments (continued)
July 31, 2023 |
|
BlackRock MuniYield New York Quality Fund, Inc. (MYN)
(Percentages shown are based on Net Assets) |
|
|
|
|
|
|
|
|
|
| Security |
|
Par
(000) |
|
|
Value |
|
|
|
|
| State — 12.9% |
|
|
|
|
|
|
| New York City Transitional Finance Authority Building Aid Revenue, Refunding RB |
|
|
|
|
|
|
|
|
| Series S-1, Subordinate, (SAW), 4.00%, 07/15/35 |
|
$ |
1,130 |
|
|
$ |
1,195,174 |
|
| Series S-3, Subordinate, (SAW), 4.00%, 07/15/38 |
|
|
6,070 |
|
|
|
6,162,422 |
|
| New York State Dormitory Authority, RB |
|
|
|
|
|
|
|
|
| Series A, 5.00%, 03/15/38 |
|
|
3,970 |
|
|
|
4,246,915 |
|
| Series A, 5.00%, 03/15/39 |
|
|
1,610 |
|
|
|
1,719,941 |
|
| Series A, 5.00%, 03/15/40 |
|
|
4,580 |
|
|
|
4,827,673 |
|
| Series A, 5.00%, 03/15/44 |
|
|
8,025 |
|
|
|
8,470,880 |
|
| Series B, 5.00%, 03/15/39 |
|
|
2,280 |
|
|
|
2,404,308 |
|
| Series C, 4.00%, 03/15/45 |
|
|
3,900 |
|
|
|
3,907,987 |
|
| New York State Dormitory Authority, Refunding RB |
|
|
|
|
|
|
|
|
| Series A, 5.00%, 03/15/40 |
|
|
3,550 |
|
|
|
3,812,221 |
|
| Series B, 5.00%, 02/15/37 |
|
|
2,130 |
|
|
|
2,289,036 |
|
| Series B, 4.00%, 02/15/46 |
|
|
2,835 |
|
|
|
2,803,126 |
|
| New York State Urban Development Corp., RB |
|
|
|
|
|
|
|
|
| Series A, 4.00%, 03/15/45 |
|
|
6,400 |
|
|
|
6,334,867 |
|
| Series A, 3.00%, 03/15/50 |
|
|
3,855 |
|
|
|
3,000,173 |
|
| Series C, 5.00%, 03/15/32 |
|
|
2,000 |
|
|
|
2,001,958 |
|
| New York State Urban Development Corp., Refunding RB, 4.00%, 03/15/46 |
|
|
5,500 |
|
|
|
5,408,997 |
|
|
|
|
|
|
|
|
|
|
|
|
|
|
|
|
|
|
|
|
58,585,678 |
|
|
|
|
| Tobacco — 2.9% |
|
|
|
|
|
|
| Chautauqua Tobacco Asset Securitization Corp., Refunding RB |
|
|
|
|
|
|
|
|
| 4.75%, 06/01/39 |
|
|
2,190 |
|
|
|
2,106,276 |
|
| 5.00%, 06/01/48 |
|
|
820 |
|
|
|
770,380 |
|
| New York Counties Tobacco Trust VI, Refunding RB |
|
|
|
|
|
|
|
|
| Series A-2B, 5.00%, 06/01/45 |
|
|
2,460 |
|
|
|
2,328,934 |
|
| Series A-2B, 5.00%, 06/01/51 |
|
|
800 |
|
|
|
748,781 |
|
| Series B, 5.00%, 06/01/41 |
|
|
655 |
|
|
|
662,253 |
|
| Niagara Tobacco Asset Securitization Corp., Refunding RB |
|
|
|
|
|
|
|
|
| 5.25%, 05/15/34 |
|
|
1,650 |
|
|
|
1,670,288 |
|
| 5.25%, 05/15/40 |
|
|
2,250 |
|
|
|
2,280,611 |
|
| TSASC, Inc., Refunding RB, Series A, 5.00%, 06/01/35 |
|
|
310 |
|
|
|
320,458 |
|
| Westchester Tobacco Asset Securitization Corp., Refunding RB, Sub-Series C, 4.00%, 06/01/42 |
|
|
2,350 |
|
|
|
2,310,671 |
|
|
|
|
|
|
|
|
|
|
|
|
|
|
|
|
|
|
|
|
13,198,652 |
|
|
|
|
| Transportation — 39.8% |
|
|
|
|
|
|
| Buffalo & Fort Erie Public Bridge Authority, RB, 5.00%, 01/01/47 |
|
|
2,795 |
|
|
|
2,887,112 |
|
| Hudson Yards Infrastructure Corp., Refunding RB |
|
|
|
|
|
|
|
|
| Series A, 5.00%, 02/15/42 |
|
|
1,525 |
|
|
|
1,593,890 |
|
| Series A, (AGM), 4.00%, 02/15/47 |
|
|
2,760 |
|
|
|
2,708,998 |
|
| Metropolitan Transportation Authority, RB |
|
|
|
|
|
|
|
|
| Series A-1, 5.25%, 11/15/23(d) |
|
|
5,405 |
|
|
|
5,434,392 |
|
| Series A-1, 4.00%, 11/15/45 |
|
|
1,125 |
|
|
|
1,059,900 |
|
| Series D-3, 4.00%, 11/15/49 |
|
|
3,730 |
|
|
|
3,427,717 |
|
| Series E, 5.00%, 11/15/38 |
|
|
7,785 |
|
|
|
7,803,668 |
|
| Metropolitan Transportation Authority, Refunding RB |
|
|
|
|
|
|
|
|
| Series A, 4.00%, 11/15/43 |
|
|
1,750 |
|
|
|
1,745,468 |
|
| Series A, 5.00%, 11/15/45 |
|
|
3,490 |
|
|
|
3,819,822 |
|
| Series A, (AGM), 4.00%, 11/15/46 |
|
|
1,035 |
|
|
|
1,022,980 |
|
| Series A-1, (AGM), 4.00%, 11/15/54 |
|
|
2,155 |
|
|
|
2,062,350 |
|
| Series C-1, 4.75%, 11/15/45 |
|
|
4,580 |
|
|
|
4,645,480 |
|
| Series C-1, 5.00%, 11/15/56 |
|
|
2,350 |
|
|
|
2,385,041 |
|
|
|
|
|
|
|
|
|
|
| Security |
|
Par
(000) |
|
|
Value |
|
|
|
|
| Transportation (continued) |
|
|
|
|
|
|
| Metropolitan Transportation Authority, Refunding RB (continued) |
|
|
|
|
|
|
|
|
| Sub-Series B-1, 5.00%, 11/15/31 |
|
$ |
3,465 |
|
|
$ |
3,483,008 |
|
| MTA Hudson Rail Yards Trust Obligations, Refunding RB, Series A, 5.00%, 11/15/56 |
|
|
5,655 |
|
|
|
5,664,342 |
|
| New York City Industrial Development Agency, Refunding RB, Series A, AMT, 5.00%, 07/01/28 |
|
|
800 |
|
|
|
799,857 |
|
| New York Liberty Development Corp., Refunding RB |
|
|
|
|
|
|
|
|
| Series 1, 2.25%, 02/15/41 |
|
|
5,700 |
|
|
|
4,200,683 |
|
| Series 1, 3.00%, 02/15/42 |
|
|
1,110 |
|
|
|
885,043 |
|
| New York State Thruway Authority, RB |
|
|
|
|
|
|
|
|
| 5.00%, 03/15/53 |
|
|
1,325 |
|
|
|
1,444,642 |
|
| Series N, 4.00%, 01/01/43 |
|
|
6,420 |
|
|
|
6,422,202 |
|
| Series N, 4.00%, 01/01/44 |
|
|
2,750 |
|
|
|
2,726,812 |
|
| Series A, Junior Lien, 5.00%, 01/01/36 |
|
|
1,715 |
|
|
|
1,800,580 |
|
| New York State Thruway Authority, Refunding RB |
|
|
|
|
|
|
|
|
| Series K, 5.00%, 01/01/29 |
|
|
2,225 |
|
|
|
2,290,433 |
|
| Series K, 5.00%, 01/01/31 |
|
|
1,500 |
|
|
|
1,544,165 |
|
| Series L, 5.00%, 01/01/35 |
|
|
970 |
|
|
|
1,054,535 |
|
| Series O, 4.00%, 01/01/44 |
|
|
2,005 |
|
|
|
1,975,817 |
|
| Series B, Subordinate, 4.00%, 01/01/45 |
|
|
5,945 |
|
|
|
5,809,228 |
|
| Series B, Subordinate, 4.00%, 01/01/50 |
|
|
3,240 |
|
|
|
3,099,808 |
|
| New York Transportation Development Corp., ARB |
|
|
|
|
|
|
|
|
| AMT, 5.00%, 12/01/35 |
|
|
1,595 |
|
|
|
1,716,201 |
|
| AMT, 5.00%, 12/01/36 |
|
|
2,500 |
|
|
|
2,669,533 |
|
| AMT, 5.00%, 12/01/39 |
|
|
950 |
|
|
|
999,180 |
|
| Series A, AMT, 5.00%, 07/01/46 |
|
|
9,945 |
|
|
|
9,972,190 |
|
| Series A, AMT, 5.25%, 01/01/50 |
|
|
4,675 |
|
|
|
4,684,766 |
|
| New York Transportation Development Corp., RB, AMT, 4.00%, 10/31/46 |
|
|
1,815 |
|
|
|
1,600,717 |
|
| Niagara Frontier Transportation Authority, Refunding ARB |
|
|
|
|
|
|
|
|
| AMT, 5.00%, 04/01/34 |
|
|
125 |
|
|
|
133,057 |
|
| AMT, 5.00%, 04/01/35 |
|
|
110 |
|
|
|
116,707 |
|
| AMT, 5.00%, 04/01/36 |
|
|
120 |
|
|
|
126,737 |
|
| AMT, 5.00%, 04/01/37 |
|
|
140 |
|
|
|
147,115 |
|
| AMT, 5.00%, 04/01/38 |
|
|
70 |
|
|
|
73,341 |
|
| AMT, 5.00%, 04/01/39 |
|
|
95 |
|
|
|
99,419 |
|
| Port Authority of New York & New Jersey, ARB |
|
|
|
|
|
|
|
|
| Series 221, AMT, 4.00%, 07/15/39 |
|
|
4,925 |
|
|
|
4,930,654 |
|
| Series 221, AMT, 4.00%, 07/15/55 |
|
|
8,850 |
|
|
|
8,173,400 |
|
| Port Authority of New York & New Jersey, Refunding ARB |
|
|
|
|
|
|
|
|
| 5.00%, 10/15/47 |
|
|
1,000 |
|
|
|
1,039,003 |
|
| 179th Series, 5.00%, 12/01/38 |
|
|
1,390 |
|
|
|
1,398,895 |
|
| 183th Series, 4.00%, 06/15/44 |
|
|
1,500 |
|
|
|
1,477,326 |
|
| 194th Series, 5.25%, 10/15/55 |
|
|
3,895 |
|
|
|
4,012,091 |
|
| 205th Series, 5.00%, 11/15/47 |
|
|
4,000 |
|
|
|
4,178,368 |
|
| AMT, 5.00%, 01/15/47 |
|
|
765 |
|
|
|
806,537 |
|
| 177th Series, AMT, 4.00%, 01/15/43 |
|
|
735 |
|
|
|
702,108 |
|
| 178th Series, AMT, 5.00%, 12/01/43 |
|
|
750 |
|
|
|
752,031 |
|
| 186th Series, AMT, 5.00%, 10/15/44 |
|
|
1,000 |
|
|
|
1,009,354 |
|
| 195th Series, AMT, 5.00%, 04/01/36 |
|
|
1,500 |
|
|
|
1,568,561 |
|
| Series 178th, AMT, 5.00%, 12/01/33 |
|
|
1,140 |
|
|
|
1,144,174 |
|
| Series 238, AMT, 5.00%, 07/15/38 |
|
|
790 |
|
|
|
866,461 |
|
| Triborough Bridge & Tunnel Authority, RB |
|
|
|
|
|
|
|
|
| Series A, 5.00%, 11/15/47 |
|
|
4,600 |
|
|
|
5,022,308 |
|
| Series A, 5.00%, 11/15/49 |
|
|
1,185 |
|
|
|
1,267,867 |
|
| Series A, 5.00%, 11/15/56 |
|
|
6,670 |
|
|
|
7,113,755 |
|
|
|
|
| S C H E D U L E
O F I N V E S T M E N T S |
|
35 |
|
|
|
| Schedule of Investments (continued)
July 31, 2023 |
|
BlackRock MuniYield New York Quality Fund, Inc. (MYN)
(Percentages shown are based on Net Assets) |
|
|
|
|
|
|
|
|
|
| Security |
|
Par
(000) |
|
|
Value |
|
|
|
|
| Transportation (continued) |
|
|
|
|
|
|
| Triborough Bridge & Tunnel Authority, Refunding RB |
|
|
|
|
|
|
|
|
| Series A, 5.00%, 11/15/45 |
|
$ |
510 |
|
|
$ |
538,036 |
|
| Series A, 5.25%, 11/15/45 |
|
|
1,460 |
|
|
|
1,502,125 |
|
| Series A, 5.00%, 11/15/50 |
|
|
6,115 |
|
|
|
6,228,329 |
|
| Series A, 4.00%, 05/15/51 |
|
|
1,365 |
|
|
|
1,320,486 |
|
| Series A, 5.00%, 05/15/57 |
|
|
1,360 |
|
|
|
1,462,790 |
|
| Series A-1, 5.00%, 05/15/51 |
|
|
2,750 |
|
|
|
2,970,160 |
|
| Series C, 5.00%, 05/15/47 |
|
|
2,135 |
|
|
|
2,325,589 |
|
| Series C, 4.13%, 05/15/52 |
|
|
4,900 |
|
|
|
4,776,858 |
|
| Triborough Bridge & Tunnel Authority, Refunding RB, CAB, Series B, 0.00%, 11/15/32(b) |
|
|
9,700 |
|
|
|
7,291,247 |
|
|
|
|
|
|
|
|
|
|
|
|
|
|
|
|
|
|
|
|
180,015,449 |
|
|
|
|
| Utilities — 24.1% |
|
|
|
|
|
|
| Long Island Power Authority, RB |
|
|
|
|
|
|
|
|
| 5.00%, 09/01/35 |
|
|
2,000 |
|
|
|
2,188,440 |
|
| 5.00%, 09/01/36 |
|
|
975 |
|
|
|
1,049,895 |
|
| 5.00%, 09/01/37 |
|
|
3,825 |
|
|
|
4,146,411 |
|
| 5.00%, 09/01/47 |
|
|
1,625 |
|
|
|
1,697,782 |
|
| Long Island Power Authority, Refunding RB, Series B, 5.00%, 09/01/41 |
|
|
930 |
|
|
|
970,915 |
|
| New York City Municipal Water Finance Authority, RB |
|
|
|
|
|
|
|
|
| Series AA-1, 4.00%, 06/15/51 |
|
|
1,365 |
|
|
|
1,327,465 |
|
| Series AA-1, 5.25%, 06/15/52 |
|
|
5,350 |
|
|
|
5,975,923 |
|
| Series BB-1, 3.00%, 06/15/50 |
|
|
2,730 |
|
|
|
2,089,856 |
|
| Series CC-1, 4.00%, 06/15/52 |
|
|
6,600 |
|
|
|
6,400,337 |
|
| Series DD, 5.00%, 06/15/47 |
|
|
2,750 |
|
|
|
2,855,968 |
|
| Series GG, 5.00%, 06/15/48 |
|
|
1,160 |
|
|
|
1,244,035 |
|
| New York City Municipal Water Finance Authority, Refunding RB |
|
|
|
|
|
|
|
|
| 5.00%, 06/15/38 |
|
|
1,390 |
|
|
|
1,480,499 |
|
| Series BB-1, 5.00%, 06/15/44 |
|
|
2,205 |
|
|
|
2,421,822 |
|
| Series BB-1, 4.00%, 06/15/45 |
|
|
1,935 |
|
|
|
1,906,583 |
|
| Series DD, 4.13%, 06/15/47 |
|
|
3,960 |
|
|
|
3,966,015 |
|
| Series DD, 5.00%, 06/15/47 |
|
|
3,860 |
|
|
|
4,253,813 |
|
| Series GG, 5.00%, 06/15/39 |
|
|
5,090 |
|
|
|
5,276,574 |
|
| Series HH, 5.00%, 06/15/39 |
|
|
3,000 |
|
|
|
3,102,954 |
|
| New York Power Authority, Refunding RB |
|
|
|
|
|
|
|
|
| Series A, 4.00%, 11/15/50 |
|
|
9,875 |
|
|
|
9,625,765 |
|
| Series A, 4.00%, 11/15/55 |
|
|
8,545 |
|
|
|
8,299,331 |
|
| Series A, 4.00%, 11/15/60 |
|
|
560 |
|
|
|
534,841 |
|
| New York State Environmental Facilities Corp., RB |
|
|
|
|
|
|
|
|
| 5.00%, 08/15/41 |
|
|
1,370 |
|
|
|
1,435,518 |
|
| Series B, 5.00%, 03/15/45 |
|
|
5,145 |
|
|
|
5,274,669 |
|
| New York State Environmental Facilities Corp., Refunding RB |
|
|
|
|
|
|
|
|
| 5.00%, 06/15/51 |
|
|
2,200 |
|
|
|
2,407,856 |
|
| Series A, 5.00%, 06/15/40 |
|
|
4,275 |
|
|
|
4,449,074 |
|
| Series A, 5.00%, 06/15/45 |
|
|
18,920 |
|
|
|
19,404,976 |
|
|
|
|
|
|
|
|
|
|
| Security |
|
Par
(000) |
|
|
Value |
|
|
|
|
| Utilities (continued) |
|
|
|
|
|
|
| Rockland County Solid Waste Management Authority, RB, Series A, AMT, 4.00%, 12/15/46 |
|
$ |
1,535 |
|
|
$
|
1,414,756 |
|
| Utility Debt Securitization Authority, Refunding RB, Series A, Restructured, 5.00%, 12/15/35 |
|
|
3,500 |
|
|
|
3,740,674 |
|
|
|
|
|
|
|
|
|
|
|
|
|
|
|
|
|
|
|
|
108,942,747 |
|
|
|
|
|
|
|
|
|
|
|
|
|
| Total Municipal Bonds in New York |
|
|
|
|
638,384,395 |
|
|
|
|
| Puerto Rico — 5.1% |
|
|
|
|
|
|
|
|
|
| State — 5.1% |
|
|
|
|
|
|
| Puerto Rico Sales Tax Financing Corp. Sales Tax Revenue, RB |
|
|
|
|
|
|
|
|
| Series A-1, Restructured, 4.75%, 07/01/53 |
|
|
724 |
|
|
|
684,097 |
|
| Series A-1, Restructured, 5.00%, 07/01/58 |
|
|
1,042 |
|
|
|
1,016,652 |
|
| Series A-2, Restructured, 4.78%, 07/01/58 |
|
|
123 |
|
|
|
115,734 |
|
| Series A-2, Restructured, 4.33%, 07/01/40 |
|
|
1,378 |
|
|
|
1,303,344 |
|
| Series B-1, Restructured, 4.75%, 07/01/53 |
|
|
746 |
|
|
|
704,715 |
|
| Series B-1, Restructured, 5.00%, 07/01/58 |
|
|
9,024 |
|
|
|
8,807,433 |
|
| Series B-2, Restructured, 4.33%, 07/01/40 |
|
|
7,120 |
|
|
|
6,720,789 |
|
| Series B-2, Restructured, 4.78%, 07/01/58 |
|
|
722 |
|
|
|
679,518 |
|
| Puerto Rico Sales Tax Financing Corp. Sales Tax Revenue, RB, CAB, Series A-1, Restructured, 0.00%, 07/01/46(b) |
|
|
10,409 |
|
|
|
2,934,474 |
|
|
|
|
|
|
|
|
|
|
|
|
|
| Total Municipal Bonds in Puerto Rico |
|
|
|
|
22,966,756 |
|
|
|
|
|
|
|
|
|
|
|
|
|
| Total Municipal Bonds — 146.6%
(Cost: $662,885,731) |
|
|
|
|
|
|
664,039,862 |
|
|
|
|
|
|
|
|
|
|
|
| Municipal Bonds Transferred to Tender Option Bond Trusts(e) |
|
|
|
|
| New York — 8.6% |
|
|
|
|
|
|
|
| County/City/Special District/School District — 2.1% |
|
| City of New York New York, GO, Sub-Series
1-I, 5.00%, 03/01/36 |
|
|
3,500 |
|
|
|
3,537,135 |
|
| City of New York, GO, Series B, 5.25%, 10/01/47 |
|
|
5,395 |
|
|
|
6,027,893 |
|
|
|
|
|
|
|
|
|
|
|
|
|
|
|
|
|
|
|
|
9,565,028 |
|
|
|
|
| Housing — 0.9% |
|
|
|
|
|
|
| New York City Housing Development Corp., Refunding RB, Series A, 4.25%, 11/01/43 |
|
|
3,991 |
|
|
|
3,897,771 |
|
|
|
|
|
|
|
|
|
|
|
|
|
| State — 2.3% |
|
|
|
|
|
|
| New York State Dormitory Authority, RB,
Series A, 5.00%, 03/15/44 |
|
|
10,000 |
|
|
|
10,600,080 |
|
|
|
|
|
|
|
|
|
|
|
|
|
| Transportation — 3.3% |
|
|
|
|
|
|
| Hudson Yards Infrastructure Corp., Refunding RB, Series A, 5.00%, 02/15/42 |
|
|
5,500 |
|
|
|
5,748,460 |
|
|
|
|
| 36 |
|
2 0 2 3 B L A C
K R O C K A N N U A L R E P O R
T T O S H A R E H O L D E R
S |
|
|
|
| Schedule of Investments (continued)
July 31, 2023 |
|
BlackRock MuniYield New York Quality Fund, Inc. (MYN)
(Percentages shown are based on Net Assets) |
|
|
|
|
|
|
|
|
|
| Security |
|
Par
(000) |
|
|
Value |
|
|
|
|
| Transportation (continued) |
|
|
|
|
|
|
|
|
| Port Authority of New York & New Jersey, Refunding ARB, AMT, 231st Series, 5.50%, 08/01/47(f) |
|
$ |
3,807 |
|
|
$ |
4,162,502 |
|
| Triborough Bridge & Tunnel Authority, Refunding RB, Series C, 4.13%, 05/15/52 |
|
|
5,000 |
|
|
|
4,874,345 |
|
|
|
|
|
|
|
|
|
|
|
|
|
|
|
|
|
|
|
|
14,785,307 |
|
|
|
|
|
|
|
|
|
|
|
|
| Total Municipal Bonds in New York |
|
|
38,848,186 |
|
|
|
|
|
|
|
|
|
|
|
|
| Total Municipal Bonds Transferred to Tender Option Bond Trusts — 8.6%
(Cost:
$37,650,630) |
|
|
|
38,848,186 |
|
|
|
|
|
|
|
|
|
|
|
|
| Total Long-Term Investments — 155.2%
(Cost: $700,536,361) |
|
|
|
702,888,048 |
|
|
|
|
|
|
|
|
|
|
|
|
|
| |
|
Shares |
|
|
|
|
|
|
|
| Short-Term Securities |
|
|
|
|
|
|
|
|
|
|
|
| Money Market Funds — 2.5% |
|
|
|
|
|
|
|
|
| BlackRock Liquidity Funds New York Money Fund Portfolio,
3.74%(g)(h) |
|
|
11,465,077 |
|
|
|
11,465,077 |
|
|
|
|
|
|
|
|
|
|
|
|
|
| Total Short-Term Securities — 2.5%
(Cost: $11,465,077) |
|
|
|
|
|
|
11,465,077 |
|
|
|
|
|
|
|
|
|
|
|
|
|
| Total Investments — 157.7%
(Cost: $712,001,438) |
|
|
|
|
|
|
714,353,125 |
|
|
|
|
| Other Assets Less Liabilities — 1.2% |
|
|
|
|
|
|
5,571,274 |
|
|
|
| Liability for TOB Trust Certificates, Including Interest
Expense and Fees Payable —
(4.3)% |
|
|
|
(19,465,141 |
) |
|
|
| VRDP Shares at Liquidation Value, Net of Deferred
Offering Costs —
(54.6)% |
|
|
|
(247,479,449 |
) |
|
|
|
|
|
|
|
|
|
|
|
| Net Assets Applicable to Common Shares — 100.0% |
|
|
$ |
452,979,809 |
|
| |
|
|
|
| (a) |
Variable rate security. Interest rate resets periodically. The rate shown is the effective interest rate as of period
end. Security description also includes the reference rate and spread if published and available. |
| (c) |
Security exempt from registration pursuant to Rule 144A under the Securities Act of 1933, as amended. These securities
may be resold in transactions exempt from registration to qualified institutional investors. |
| (d) |
U.S. Government securities held in escrow, are used to pay interest on this security as well as to retire the bond in
full at the date indicated, typically at a premium to par. |
| (e) |
Represent bonds transferred to a TOB Trust in exchange of cash and residual certificates received by the Fund. These
bonds serve as collateral in a secured borrowing. See Note 4 of the Notes to Financial Statements for details. |
| (f) |
All or a portion of the security is subject to a recourse agreement. The aggregate maximum potential amount the Fund
could ultimately be required to pay under the agreement, which expires on February 1, 2030, is $2,644,888. See Note 4 of the Notes to Financial Statements for details. |
| (g) |
Affiliate of the Fund. |
| (h) |
Annualized 7-day yield as of period end.
|
For Fund compliance purposes, the
Fund’s sector classifications refer to one or more of the sector sub-classifications used by one or more widely recognized market indexes or rating group indexes, and/or as defined by the investment adviser. These definitions may not apply for
purposes of this report, which may combine such sector sub-classifications for reporting ease.
Affiliates
Investments in issuers considered to be affiliate(s) of the Fund during the year ended July 31, 2023 for purposes of Section 2(a)(3) of the
Investment Company Act of 1940, as amended, were as follows:
|
|
|
|
|
|
|
|
|
|
|
|
|
|
|
|
|
|
|
|
|
|
|
|
|
|
|
|
|
|
|
|
|
|
|
|
|
| |
|
|
|
|
|
|
|
|
|
| Affiliated Issuer |
|
Value at
07/31/22 |
|
|
Purchases
at Cost |
|
|
Proceeds
from Sales |
|
|
Net
Realized
Gain (Loss) |
|
|
Change in
Unrealized
Appreciation
(Depreciation) |
|
|
Value at
07/31/23 |
|
|
Shares
Held at
07/31/23 |
|
|
Income |
|
|
Capital Gain
Distributions
from
Underlying
Funds |
|
|
|
|
|
|
|
|
|
|
|
| BlackRock Liquidity Funds New York Money Fund Portfolio |
|
$ |
— |
|
|
$ |
11,465,201 |
(a) |
|
$ |
— |
|
|
$ |
(124 |
) |
|
$ |
— |
|
|
$ |
11,465,077 |
|
|
|
11,465,077 |
|
|
$ |
163,390 |
|
|
$ |
— |
|
|
|
|
|
|
|
|
|
|
|
|
|
|
|
|
|
|
|
|
|
|
|
|
|
|
|
|
|
|
|
|
|
|
|
|
|
|
| |
(a) |
Represents net amount purchased (sold). |
|
|
|
|
| S C H E D U L E
O F I N V E S T M E N T S |
|
37 |
|
|
|
| Schedule of Investments (continued)
July 31, 2023 |
|
BlackRock MuniYield New York Quality Fund, Inc. (MYN) |
Derivative Financial Instruments Outstanding as of Period End
Futures Contracts
|
|
|
|
|
|
|
|
|
|
|
|
|
|
|
|
|
| |
|
|
|
|
| Description |
|
Number of
Contracts |
|
|
Expiration
Date |
|
|
Notional
Amount (000) |
|
|
Value/
Unrealized
Appreciation
(Depreciation) |
|
| Short Contracts |
|
|
|
|
|
|
|
|
|
|
|
|
|
|
|
|
| 10-Year U.S. Treasury Note |
|
|
49 |
|
|
|
09/20/23 |
|
|
$ |
5,462 |
|
|
$ |
(16,147 |
) |
| U.S. Long Bond |
|
|
62 |
|
|
|
09/20/23 |
|
|
|
7,727 |
|
|
|
(33,648 |
) |
| 5-Year U.S. Treasury Note |
|
|
53 |
|
|
|
09/29/23 |
|
|
|
5,665 |
|
|
|
(13,734 |
) |
|
|
|
|
|
|
|
|
|
|
|
|
|
|
|
|
|
|
|
|
|
|
|
|
|
|
|
|
|
|
|
|
|
|
|
|
$ |
(63,529 |
) |
|
|
|
|
|
|
|
|
|
|
|
|
|
|
|
|
|
Derivative Financial Instruments Categorized by Risk Exposure
As of period end, the fair values of derivative financial instruments located in the Statements of Assets and Liabilities were as follows:
|
|
|
|
|
|
|
|
|
|
|
|
|
|
|
|
|
|
|
|
|
|
|
|
|
|
|
|
|
| |
|
|
|
|
|
|
|
| |
|
Commodity
Contracts |
|
|
Credit
Contracts |
|
|
Equity
Contracts |
|
|
Foreign
Currency
Exchange
Contracts |
|
|
Interest
Rate
Contracts |
|
|
Other
Contracts |
|
|
Total |
|
| Liabilities — Derivative Financial Instruments |
|
|
|
|
|
|
|
|
|
|
|
|
|
|
|
|
|
|
|
|
|
|
|
|
|
|
|
|
| Futures contracts |
|
|
|
|
|
|
|
|
|
|
|
|
|
|
|
|
|
|
|
|
|
|
|
|
|
|
|
|
| Unrealized depreciation on futures contracts(a) |
|
$ |
— |
|
|
$ |
— |
|
|
$ |
— |
|
|
$ |
— |
|
|
$ |
63,529 |
|
|
$ |
— |
|
|
$ |
63,529 |
|
|
|
|
|
|
|
|
|
|
|
|
|
|
|
|
|
|
|
|
|
|
|
|
|
|
|
|
|
|
| |
(a) |
Net cumulative unrealized appreciation (depreciation) on futures contracts and centrally cleared swaps, if any, are
reported in the Schedule of Investments. In the Statements of Assets and Liabilities, only current day’s variation margin is reported in receivables or payables and the net cumulative unrealized appreciation (depreciation) is included in
accumulated earnings (loss). |
|
For the period ended July 31, 2023, the effect of derivative financial instruments in the Statements of
Operations was as follows:
|
|
|
|
|
|
|
|
|
|
|
|
|
|
|
|
|
|
|
|
|
|
|
|
|
|
|
|
|
| |
|
|
|
|
|
|
|
| |
|
Commodity
Contracts |
|
|
Credit
Contracts |
|
|
Equity
Contracts |
|
|
Foreign
Currency
Exchange
Contracts |
|
|
Interest
Rate
Contracts |
|
|
Other
Contracts |
|
|
Total |
|
| Net Realized Gain (Loss) from: |
|
|
|
|
|
|
|
|
|
|
|
|
|
|
|
|
|
|
|
|
|
|
|
|
|
|
|
|
| Futures contracts |
|
$ |
— |
|
|
$ |
— |
|
|
$ |
— |
|
|
$ |
— |
|
|
$ |
3,129,978 |
|
|
$ |
— |
|
|
$ |
3,129,978 |
|
|
|
|
|
|
|
|
|
|
|
|
|
|
|
|
|
|
|
|
|
|
|
|
|
|
|
|
|
|
|
|
|
|
|
|
|
|
| Net Change in Unrealized Appreciation (Depreciation) on: |
|
|
|
|
|
|
|
|
|
|
|
|
|
|
|
|
|
|
|
|
|
|
|
|
|
|
|
|
| Futures contracts |
|
$ |
— |
|
|
$ |
— |
|
|
$ |
— |
|
|
$ |
— |
|
|
$ |
2,842,177 |
|
|
$ |
— |
|
|
$ |
2,842,177 |
|
|
|
|
|
|
|
|
|
|
|
|
|
|
|
|
|
|
|
|
|
|
|
|
|
|
|
|
|
|
Average Quarterly Balances of Outstanding Derivative Financial Instruments
|
|
|
|
|
| Futures contracts: |
|
|
|
|
| Average notional value of contracts — short |
|
$ |
44,536,022 |
|
For more information about the Fund’s investment risks regarding derivative financial instruments, refer to the Notes
to Financial Statements.
Fair Value Hierarchy as of Period End
Various inputs are used in determining the fair value of financial instruments. For a description of the input levels and information about the
Fund’s policy regarding valuation of financial instruments, refer to the Notes to Financial Statements.
The following table summarizes the
Fund’s financial instruments categorized in the fair value hierarchy. The breakdown of the Fund’s financial instruments into major categories is disclosed in the Schedule of Investments above.
|
|
|
|
|
|
|
|
|
|
|
|
|
|
|
|
|
|
|
|
|
|
|
|
|
|
|
|
|
| |
|
|
|
|
|
|
|
| |
|
Level 1 |
|
|
|
|
|
Level 2 |
|
|
|
|
|
Level 3 |
|
|
|
|
|
Total |
|
| Assets |
|
|
|
|
|
|
|
|
|
|
|
|
|
|
|
|
|
|
|
|
|
|
|
|
|
|
|
|
| Investments |
|
|
|
|
|
|
|
|
|
|
|
|
|
|
|
|
|
|
|
|
|
|
|
|
|
|
|
|
| Long-Term Investments |
|
|
|
|
|
|
|
|
|
|
|
|
|
|
|
|
|
|
|
|
|
|
|
|
|
|
|
|
| Municipal Bonds |
|
$ |
— |
|
|
|
|
|
|
$ |
664,039,862 |
|
|
|
|
|
|
$ |
— |
|
|
|
|
|
|
$ |
664,039,862 |
|
| Municipal Bonds Transferred to Tender Option Bond Trusts |
|
|
— |
|
|
|
|
|
|
|
38,848,186 |
|
|
|
|
|
|
|
— |
|
|
|
|
|
|
|
38,848,186 |
|
|
|
|
| 38 |
|
2 0 2 3 B L A C
K R O C K A N N U A L R E P O R
T T O S H A R E H O L D E R
S |
|
|
|
| Schedule of Investments (continued)
July 31, 2023 |
|
BlackRock MuniYield New York Quality Fund, Inc. (MYN) |
Fair Value Hierarchy as of Period End (continued)
|
|
|
|
|
|
|
|
|
|
|
|
|
|
|
|
|
|
|
|
|
|
|
|
|
|
|
|
|
| |
|
|
|
|
|
|
|
| |
|
Level 1 |
|
|
|
|
|
Level 2 |
|
|
|
|
|
Level 3 |
|
|
|
|
|
Total |
|
| Short-Term Securities |
|
|
|
|
|
|
|
|
|
|
|
|
|
|
|
|
|
|
|
|
|
|
|
|
|
|
|
|
| Money Market Funds |
|
$ |
11,465,077 |
|
|
|
|
|
|
$ |
— |
|
|
|
|
|
|
$ |
— |
|
|
|
|
|
|
$ |
11,465,077 |
|
|
|
|
|
|
|
|
|
|
|
|
|
|
|
|
|
|
|
|
|
|
|
|
|
|
|
|
|
|
|
|
|
|
|
|
|
|
|
|
$ |
11,465,077 |
|
|
|
|
|
|
$ |
702,888,048 |
|
|
|
|
|
|
$ |
— |
|
|
|
|
|
|
$ |
714,353,125 |
|
|
|
|
|
|
|
|
|
|
|
|
|
|
|
|
|
|
|
|
|
|
|
|
|
|
|
|
|
|
|
|
|
|
|
|
|
|
| Derivative Financial Instruments(a) |
|
|
|
|
|
|
|
|
|
|
|
|
|
|
|
|
|
|
|
|
|
|
|
|
|
|
|
|
| Liabilities |
|
|
|
|
|
|
|
|
|
|
|
|
|
|
|
|
|
|
|
|
|
|
|
|
|
|
|
|
| Interest Rate Contracts |
|
$ |
(63,529 |
) |
|
|
|
|
|
$ |
— |
|
|
|
|
|
|
$ |
— |
|
|
|
|
|
|
$ |
(63,529 |
) |
|
|
|
|
|
|
|
|
|
|
|
|
|
|
|
|
|
|
|
|
|
|
|
|
|
|
|
|
|
| |
(a) |
Derivative financial instruments are futures contracts. Futures contracts are valued at the unrealized appreciation
(depreciation) on the instrument. |
|
The Fund may hold assets and/or liabilities in which the fair value approximates the carrying amount for financial
statement purposes. As of period end, such assets and/or liabilities are categorized within the fair value hierarchy as follows:
|
|
|
|
|
|
|
|
|
|
|
|
|
|
|
|
|
|
|
|
|
|
|
|
|
|
|
|
|
| |
|
|
|
|
|
|
|
| |
|
Level 1 |
|
|
|
|
|
Level 2 |
|
|
|
|
|
Level 3 |
|
|
|
|
|
Total |
|
| Liabilities |
|
|
|
|
|
|
|
|
|
|
|
|
|
|
|
|
|
|
|
|
|
|
|
|
|
|
|
|
| TOB Trust Certificates |
|
$ |
— |
|
|
|
|
|
|
$ |
(19,231,092 |
) |
|
|
|
|
|
$ |
— |
|
|
|
|
|
|
$ |
(19,231,092 |
) |
| VRDP Shares at Liquidation Value |
|
|
— |
|
|
|
|
|
|
|
(247,700,000 |
) |
|
|
|
|
|
|
— |
|
|
|
|
|
|
|
(247,700,000 |
) |
|
|
|
|
|
|
|
|
|
|
|
|
|
|
|
|
|
|
|
|
|
|
|
|
|
|
|
|
|
|
|
|
|
|
|
|
|
|
|
$ |
— |
|
|
|
|
|
|
$ |
(266,931,092 |
) |
|
|
|
|
|
$ |
— |
|
|
|
|
|
|
$ |
(266,931,092 |
) |
|
|
|
|
|
|
|
|
|
|
|
|
|
|
|
|
|
|
|
|
|
|
|
|
|
|
|
|
|
See notes to financial statements.
|
|
|
| S C H E D U L E
O F I N V E S T M E N T S |
|
39 |
|
|
|
| Schedule of Investments July 31, 2023 |
|
BlackRock MuniYield Pennsylvania Quality Fund (MPA)
(Percentages shown are based on Net Assets) |
|
|
|
|
|
|
|
|
|
| Security |
|
Par
(000) |
|
|
Value |
|
|
|
|
| Municipal Bonds |
|
|
|
|
|
|
|
|
|
|
|
| Pennsylvania — 125.8% |
|
|
|
|
|
|
|
|
|
|
|
| Corporate — 2.8% |
|
|
|
|
|
|
| Lehigh County Industrial Development Authority, Refunding RB, Series A, 3.00%, 09/01/29 |
|
$ |
1,900 |
|
|
$ |
1,846,036 |
|
| Montgomery County Industrial Development Authority, Refunding RB, 4.10%, 04/01/53(a) |
|
|
855 |
|
|
|
871,621 |
|
| Pennsylvania Economic Development Financing Authority, RB, Series A, AMT, 3.25%, 08/01/39(b) |
|
|
1,950 |
|
|
|
1,446,253 |
|
| Pennsylvania Economic Development Financing Authority, Refunding RB |
|
|
|
|
|
|
|
|
| AMT, 5.50%, 11/01/44 |
|
|
135 |
|
|
|
135,043 |
|
| Series A, AMT, 4.10%, 04/01/34(a) |
|
|
495 |
|
|
|
495,000 |
|
|
|
|
|
|
|
|
|
|
|
|
|
|
|
|
|
|
|
|
4,793,953 |
|
|
| County/City/Special District/School District — 23.4% |
|
| Altoona Area School District, GO, Series A, AMT, (AGM), 5.00%, 12/01/36 |
|
|
1,180 |
|
|
|
1,227,213 |
|
| Bethlehem Area School District, GO |
|
|
|
|
|
|
|
|
| Series A, AMT, (BAM SAW), 5.00%, 08/01/34 |
|
|
1,610 |
|
|
|
1,669,952 |
|
| Series A, AMT, (BAM SAW), 5.00%, 08/01/35 |
|
|
1,210 |
|
|
|
1,254,480 |
|
| Borough of West Chester Pennsylvania, Refunding GO, 3.50%, 11/15/35 |
|
|
1,095 |
|
|
|
1,102,305 |
|
| Boyertown Area School District, GO |
|
|
|
|
|
|
|
|
| (SAW), 5.00%, 10/01/36 |
|
|
610 |
|
|
|
618,305 |
|
| (SAW), 5.00%, 10/01/38 |
|
|
920 |
|
|
|
932,537 |
|
| Bristol Township School District, GO, (BAM SAW), 5.00%, 06/01/42 |
|
|
1,685 |
|
|
|
1,751,884 |
|
| Chester County Industrial Development Authority,
SAB(b) |
|
|
|
|
|
|
|
|
| 4.25%, 03/01/35 |
|
|
715 |
|
|
|
651,268 |
|
| 4.75%, 03/01/50 |
|
|
1,520 |
|
|
|
1,330,157 |
|
| City of Lancaster Pennsylvania, GO, (BAM), 4.00%, 11/01/42 |
|
|
1,705 |
|
|
|
1,638,669 |
|
| City of Philadelphia Pennsylvania, Refunding GO, Series A, 5.00%, 08/01/37 |
|
|
1,360 |
|
|
|
1,433,294 |
|
| City of Pittsburgh Pennsylvania, GO, 5.00%, 09/01/43 |
|
|
100 |
|
|
|
108,902 |
|
| Coatesville School District, GO, CAB(c) |
|
|
|
|
|
|
|
|
| Series A, (BAM SAW), 0.00%, 10/01/34 |
|
|
160 |
|
|
|
99,989 |
|
| Series A, (BAM SAW), 0.00%, 10/01/35 |
|
|
1,435 |
|
|
|
845,858 |
|
| Series A, (BAM SAW), 0.00%, 10/01/37 |
|
|
1,395 |
|
|
|
723,599 |
|
| Coatesville School District, Refunding GO,
CAB(c) |
|
|
|
|
|
|
|
|
| Series B, (BAM SAW), 0.00%, 10/01/33 |
|
|
275 |
|
|
|
180,985 |
|
| Series B, (BAM SAW), 0.00%, 10/01/34 |
|
|
550 |
|
|
|
343,713 |
|
| Series C, (BAM SAW), 0.00%, 10/01/33 |
|
|
360 |
|
|
|
236,643 |
|
| Northampton County Industrial Development Authority, TA, 7.00%, 07/01/32 |
|
|
120 |
|
|
|
120,031 |
|
| Pennsylvania Economic Development Financing Authority, RB |
|
|
|
|
|
|
|
|
| AMT, 5.00%, 06/30/32 |
|
|
925 |
|
|
|
1,014,716 |
|
| AMT, 5.50%, 06/30/43 |
|
|
2,500 |
|
|
|
2,752,822 |
|
| AMT, 5.75%, 06/30/48 |
|
|
1,980 |
|
|
|
2,195,388 |
|
| AMT, 6.00%, 06/30/61 |
|
|
1,305 |
|
|
|
1,454,405 |
|
| School District of Philadelphia, GO |
|
|
|
|
|
|
|
|
| Series A, (SAW), 5.00%, 09/01/44 |
|
|
1,000 |
|
|
|
1,049,287 |
|
| Series D, (AGM), 3.00%, 09/01/44 |
|
|
2,345 |
|
|
|
1,845,555 |
|
| Shaler Area School District, GO, (XLCA SAW), 0.00%,
09/01/30(c) |
|
|
6,145 |
|
|
|
4,919,822 |
|
| Springfield School District/Delaware County, GO |
|
|
|
|
|
|
|
|
| (SAW), 5.00%, 03/01/36 |
|
|
870 |
|
|
|
949,715 |
|
| (SAW), 5.00%, 03/01/40 |
|
|
1,025 |
|
|
|
1,094,874 |
|
|
|
|
|
|
|
|
|
|
| Security |
|
Par
(000) |
|
|
Value |
|
|
| County/City/Special District/School District (continued) |
|
| Springfield School District/Delaware County, GO (continued) |
|
|
|
|
|
|
|
|
| (SAW), 5.00%, 03/01/43 |
|
$ |
775 |
|
|
$ |
822,752 |
|
| State Public School Building Authority, RB(c) |
|
|
|
|
|
|
|
|
| (AGM), 0.00%, 12/15/23 |
|
|
1,980 |
|
|
|
1,954,739 |
|
| (AGM), 0.00%, 12/15/24 |
|
|
1,980 |
|
|
|
1,890,029 |
|
| (AGM), 0.00%, 12/15/25 |
|
|
1,770 |
|
|
|
1,635,135 |
|
|
|
|
|
|
|
|
|
|
|
|
|
|
|
|
|
|
|
|
39,849,023 |
|
|
|
|
| Education — 21.2% |
|
|
|
|
|
|
| Berks County Municipal Authority, Refunding RB |
|
|
|
|
|
|
|
|
| 5.00%, 10/01/39 |
|
|
160 |
|
|
|
150,044 |
|
| 5.00%, 10/01/49 |
|
|
430 |
|
|
|
385,114 |
|
| Chester County Industrial Development Authority, RB, Sustainability Bonds, 4.00%, 12/01/51 |
|
|
3,600 |
|
|
|
3,393,119 |
|
| Delaware County Authority, RB |
|
|
|
|
|
|
|
|
| 5.00%, 08/01/40 |
|
|
1,005 |
|
|
|
1,033,200 |
|
| 5.00%, 08/01/45 |
|
|
1,610 |
|
|
|
1,647,260 |
|
| East Hempfield Township Industrial Development Authority, RB, 5.00%, 07/01/25(d) |
|
|
1,255 |
|
|
|
1,297,644 |
|
| Latrobe Industrial Development Authority, Refunding RB, 4.00%, 03/01/46 |
|
|
285 |
|
|
|
232,170 |
|
| Northampton County General Purpose Authority, Refunding RB, 4.00%, 11/01/38 |
|
|
1,160 |
|
|
|
1,162,214 |
|
| Pennsylvania Higher Education Assistance Agency, RB |
|
|
|
|
|
|
|
|
| Series A, AMT, 2.63%, 06/01/42 |
|
|
1,030 |
|
|
|
857,096 |
|
| Series B, AMT, Subordinate, 3.13%, 06/01/48 |
|
|
350 |
|
|
|
268,777 |
|
| Series B, AMT, Subordinate, 5.00%, 06/01/50 |
|
|
520 |
|
|
|
503,611 |
|
| Pennsylvania Higher Educational Facilities Authority, RB, Series AT-1, 4.00%, 06/15/34 |
|
|
2,000 |
|
|
|
2,046,414 |
|
| Pennsylvania Higher Educational Facilities Authority, Refunding RB |
|
|
|
|
|
|
|
|
| 5.00%, 05/01/37 |
|
|
1,325 |
|
|
|
1,199,966 |
|
| 5.00%, 05/01/41 |
|
|
500 |
|
|
|
517,678 |
|
| Series A, 5.00%, 11/01/31 |
|
|
845 |
|
|
|
911,512 |
|
| Series A, (AGM), 4.00%, 05/01/50 |
|
|
4,645 |
|
|
|
4,428,738 |
|
| Philadelphia Authority for Industrial Development, RB |
|
|
|
|
|
|
|
|
| 4.00%, 06/15/29 |
|
|
280 |
|
|
|
262,023 |
|
| 5.00%, 06/15/39 |
|
|
335 |
|
|
|
312,142 |
|
| 4.00%, 12/01/48 |
|
|
3,300 |
|
|
|
3,143,191 |
|
| 5.00%, 06/15/49 |
|
|
935 |
|
|
|
817,771 |
|
| 5.00%, 06/15/50 |
|
|
575 |
|
|
|
516,456 |
|
| 5.25%, 11/01/52 |
|
|
1,355 |
|
|
|
1,430,277 |
|
| Philadelphia Authority for Industrial Development, Refunding RB |
|
|
|
|
|
|
|
|
| 5.00%, 06/15/40(b) |
|
|
300 |
|
|
|
291,785 |
|
| Series 2015, 5.00%, 04/01/45 |
|
|
2,170 |
|
|
|
2,212,740 |
|
| Series A, 5.25%, 06/15/52 |
|
|
375 |
|
|
|
338,481 |
|
| Sports & Exhibition Authority of Pittsburgh and Allegheny County, RB, Series A, (AGM), 4.10%,
11/01/38(a) |
|
|
2,390 |
|
|
|
2,390,000 |
|
| Swarthmore Borough Authority, Refunding RB |
|
|
|
|
|
|
|
|
| 5.00%, 09/15/38 |
|
|
830 |
|
|
|
831,790 |
|
| 5.00%, 09/15/47 |
|
|
1,950 |
|
|
|
2,169,435 |
|
| University of Pittsburgh-of the Commonwealth System of Higher Education, RB, 4.34%, 02/15/24(a) |
|
|
1,380 |
|
|
|
1,379,632 |
|
|
|
|
|
|
|
|
|
|
|
|
|
|
|
|
|
|
|
|
36,130,280 |
|
|
|
|
| Health — 29.7% |
|
|
|
|
|
|
| Allegheny County Hospital Development Authority, RB |
|
|
|
|
|
|
|
|
| Series B, (NPFGC), 6.00%, 07/01/26 |
|
|
2,000 |
|
|
|
2,151,064 |
|
| Series D2, 4.68%, 11/15/47(a) |
|
|
1,040 |
|
|
|
1,060,723 |
|
|
|
|
| 40 |
|
2 0 2 3 B L A C
K R O C K A N N U A L R E P O R
T T O S H A R E H O L D E R
S |
|
|
|
| Schedule of Investments (continued)
July 31, 2023 |
|
BlackRock MuniYield Pennsylvania Quality Fund (MPA)
(Percentages shown are based on Net Assets) |
|
|
|
|
|
|
|
|
|
| Security |
|
Par
(000) |
|
|
Value |
|
|
|
|
| Health (continued) |
|
|
|
|
|
|
|
|
| Allegheny County Hospital Development Authority, Refunding RB |
|
|
|
|
|
|
|
|
| Series A, 4.00%, 04/01/37 |
|
$ |
1,700 |
|
|
$ |
1,628,330 |
|
| Series A, (AGM-CR), 4.00%, 04/01/44 |
|
|
3,440 |
|
|
|
3,215,674 |
|
| Series A, 5.00%, 04/01/47 |
|
|
700 |
|
|
|
706,875 |
|
| Bucks County Industrial Development Authority, RB, 4.00%, 07/01/46 |
|
|
1,000 |
|
|
|
754,801 |
|
| Cumberland County Municipal Authority, Refunding RB |
|
|
|
|
|
|
|
|
| 5.00%, 01/01/25(d) |
|
|
255 |
|
|
|
261,172 |
|
| 5.00%, 01/01/29(d) |
|
|
580 |
|
|
|
647,743 |
|
| 4.00%, 01/01/36 |
|
|
395 |
|
|
|
352,581 |
|
| 4.13%, 01/01/38 |
|
|
160 |
|
|
|
139,232 |
|
| 5.00%, 01/01/38 |
|
|
1,290 |
|
|
|
1,253,173 |
|
| Doylestown Hospital Authority, RB, Series A, 5.00%, 07/01/49 |
|
|
500 |
|
|
|
422,329 |
|
| DuBois Hospital Authority, Refunding RB, 4.00%, 07/15/48 |
|
|
2,060 |
|
|
|
1,836,296 |
|
| Geisinger Authority, Refunding RB, Series A-1, 5.00%, 02/15/45 |
|
|
4,395 |
|
|
|
4,507,833 |
|
| Hospitals & Higher Education Facilities Authority of Philadelphia, Refunding RB, (AGM), 4.00%,
07/01/40 |
|
|
825 |
|
|
|
803,137 |
|
| Lancaster County Hospital Authority, Refunding RB, 5.00%, 11/01/35 |
|
|
575 |
|
|
|
583,350 |
|
| Lancaster Industrial Development Authority, RB |
|
|
|
|
|
|
|
|
| 4.00%, 12/01/44 |
|
|
420 |
|
|
|
370,176 |
|
| 4.00%, 12/01/49 |
|
|
565 |
|
|
|
480,681 |
|
| Montgomery County Higher Education and Health Authority, Refunding RB |
|
|
|
|
|
|
|
|
| 4.00%, 09/01/49 |
|
|
665 |
|
|
|
610,473 |
|
| Series A, 5.00%, 09/01/37 |
|
|
840 |
|
|
|
875,440 |
|
| Series A, 5.00%, 09/01/48 |
|
|
1,100 |
|
|
|
1,126,627 |
|
| Montgomery County Industrial Development Authority, RB |
|
|
|
|
|
|
|
|
| Series C, 4.00%, 11/15/43 |
|
|
200 |
|
|
|
161,332 |
|
| Series C, 5.00%, 11/15/45 |
|
|
915 |
|
|
|
856,186 |
|
| Montgomery County Industrial Development Authority, Refunding RB |
|
|
|
|
|
|
|
|
| 5.25%, 01/01/40 |
|
|
220 |
|
|
|
200,496 |
|
| 5.00%, 12/01/46 |
|
|
400 |
|
|
|
366,155 |
|
| Mount Lebanon Hospital Authority, RB, 4.00%, 07/01/48 |
|
|
2,345 |
|
|
|
2,205,888 |
|
| Northampton County General Purpose Authority, Refunding RB |
|
|
|
|
|
|
|
|
| 5.00%, 08/15/46 |
|
|
1,000 |
|
|
|
1,001,737 |
|
| 5.00%, 08/15/48 |
|
|
1,125 |
|
|
|
1,148,246 |
|
| Pennsylvania Economic Development Financing Authority, RB |
|
|
|
|
|
|
|
|
| Series A-2, 4.00%, 05/15/53 |
|
|
1,020 |
|
|
|
952,974 |
|
| Series B, 4.00%, 03/15/40 |
|
|
8,000 |
|
|
|
8,015,800 |
|
| Pennsylvania Higher Educational Facilities Authority, RB, 3.00%, 08/15/47 |
|
|
1,600 |
|
|
|
1,234,878 |
|
| Pennsylvania Higher Educational Facilities Authority, Refunding RB, Series A, 5.00%, 09/01/45 |
|
|
2,000 |
|
|
|
2,018,440 |
|
| Pottsville Hospital Authority, Refunding RB, Series B, 5.00%, 07/01/41 |
|
|
3,000 |
|
|
|
3,087,561 |
|
|
|
|
|
|
|
|
|
|
| Security |
|
Par
(000) |
|
|
Value |
|
|
|
|
| Health (continued) |
|
|
|
|
|
|
|
|
| St Mary Hospital Authority, Refunding RB |
|
|
|
|
|
|
|
|
| 5.00%, 12/01/28(d) |
|
$ |
2,495 |
|
|
$ |
2,781,740 |
|
| 5.00%, 12/01/48 |
|
|
1,255 |
|
|
|
1,308,363 |
|
| Wayne County Hospital & Health Facilities Authority, RB, Series A, (GTD), 4.00%, 07/01/46 |
|
|
1,595 |
|
|
|
1,465,661 |
|
|
|
|
|
|
|
|
|
|
|
|
|
|
|
|
|
|
|
|
50,593,167 |
|
|
|
|
| Housing — 4.8% |
|
|
|
|
|
|
| Pennsylvania Housing Finance Agency, RB, S/F Housing, Series 137, 2.60%, 04/01/46 |
|
|
2,730 |
|
|
|
1,924,418 |
|
| Pennsylvania Housing Finance Agency, Refunding RB, S/F Housing |
|
|
|
|
|
|
|
|
| Series 142-A, 5.00%, 10/01/50 |
|
|
2,030 |
|
|
|
2,099,651 |
|
| Series 2022, 4.15%, 10/01/42 |
|
|
2,000 |
|
|
|
1,932,718 |
|
| Philadelphia Authority for Industrial Development, RB, M/F Housing(e)(f) |
|
|
|
|
|
|
|
|
| Series A, 3.50%, 12/01/36 |
|
|
810 |
|
|
|
405,000 |
|
| Series A, 4.00%, 12/01/46 |
|
|
2,970 |
|
|
|
1,485,000 |
|
| Series A, 4.00%, 12/01/51 |
|
|
805 |
|
|
|
402,500 |
|
|
|
|
|
|
|
|
|
|
|
|
|
|
|
|
|
|
|
|
8,249,287 |
|
|
|
|
| Tobacco — 5.9% |
|
|
|
|
|
|
| Commonwealth Financing Authority, RB |
|
|
|
|
|
|
|
|
| 5.00%, 06/01/34 |
|
|
4,175 |
|
|
|
4,481,069 |
|
| 5.00%, 06/01/35 |
|
|
1,295 |
|
|
|
1,383,643 |
|
| (AGM), 4.00%, 06/01/39 |
|
|
4,300 |
|
|
|
4,242,169 |
|
|
|
|
|
|
|
|
|
|
|
|
|
|
|
|
|
|
|
|
10,106,881 |
|
|
|
|
| Transportation — 29.2% |
|
|
|
|
|
|
| City of Philadelphia Pennsylvania Airport Revenue, Refunding ARB, Series B, AMT, 5.00%, 07/01/37 |
|
|
1,100 |
|
|
|
1,139,641 |
|
| Delaware River Joint Toll Bridge Commission, RB, 5.00%, 07/01/42 |
|
|
2,110 |
|
|
|
2,205,701 |
|
| Delaware River Port Authority, RB, 5.00%, 01/01/37 |
|
|
2,285 |
|
|
|
2,306,166 |
|
| Pennsylvania Economic Development Financing Authority, RB |
|
|
|
|
|
|
|
|
| AMT, 5.00%, 12/31/38 |
|
|
2,000 |
|
|
|
2,021,878 |
|
| AMT, 5.00%, 06/30/42 |
|
|
7,380 |
|
|
|
7,419,800 |
|
| AMT, 5.25%, 06/30/53 |
|
|
500 |
|
|
|
523,803 |
|
| Pennsylvania Turnpike Commission Oil Franchise Tax Revenue, Refunding RB, Series A, 4.00%, 12/01/51 |
|
|
3,920 |
|
|
|
3,796,179 |
|
| Pennsylvania Turnpike Commission, RB |
|
|
|
|
|
|
|
|
| Sub-Series B-1, 5.00%, 06/01/42 |
|
|
2,730 |
|
|
|
2,840,065 |
|
| Sub-Series B-1, 5.25%, 06/01/47 |
|
|
1,000 |
|
|
|
1,044,728 |
|
| 1st Series, Subordinate, 5.00%, 12/01/40 |
|
|
2,035 |
|
|
|
2,242,151 |
|
| Series A, Subordinate, 4.00%, 12/01/46 |
|
|
1,000 |
|
|
|
966,090 |
|
| Series A, Subordinate, 4.00%, 12/01/50 |
|
|
2,500 |
|
|
|
2,376,723 |
|
| Series A, Subordinate, (BAM-TCRS), 4.00%, 12/01/50 |
|
|
1,385 |
|
|
|
1,340,823 |
|
| Pennsylvania Turnpike Commission, RB, CAB(c) |
|
|
|
|
|
|
|
|
| Sub-Series A-3, (AGM), 0.00%, 12/01/40 |
|
|
1,975 |
|
|
|
925,908 |
|
| Sub-Series A-3, 0.00%, 12/01/42 |
|
|
4,760 |
|
|
|
1,970,749 |
|
| Pennsylvania Turnpike Commission, Refunding RB |
|
|
|
|
|
|
|
|
| 3.98%, 12/01/39(a) |
|
|
2,500 |
|
|
|
2,500,000 |
|
| Series B, 5.25%, 12/01/52 |
|
|
775 |
|
|
|
846,858 |
|
| Series B-2, (AGM), 5.00%, 06/01/35 |
|
|
1,850 |
|
|
|
1,971,153 |
|
|
|
|
| S C H E D U L E
O F I N V E S T M E N T S |
|
41 |
|
|
|
| Schedule of Investments (continued)
July 31, 2023 |
|
BlackRock MuniYield Pennsylvania Quality Fund (MPA)
(Percentages shown are based on Net Assets) |
|
|
|
|
|
|
|
|
|
| Security |
|
Par
(000) |
|
|
Value |
|
|
|
|
| Transportation (continued) |
|
|
|
|
|
|
|
|
| Southeastern Pennsylvania Transportation Authority, RB |
|
|
|
|
|
|
|
|
| 5.25%, 06/01/47 |
|
$ |
2,305 |
|
|
$ |
2,555,855 |
|
| 5.25%, 06/01/52 |
|
|
8,000 |
|
|
|
8,795,064 |
|
|
|
|
|
|
|
|
|
|
|
|
|
|
|
|
|
|
|
|
49,789,335 |
|
|
|
|
| Utilities — 8.8% |
|
|
|
|
|
|
| Bucks County Water and Sewer Authority, RB |
|
|
|
|
|
|
|
|
| Series A, (AGM), 5.00%, 12/01/37 |
|
|
780 |
|
|
|
798,057 |
|
| Series A, (AGM), 5.00%, 12/01/40 |
|
|
1,000 |
|
|
|
1,018,343 |
|
| City of Philadelphia Pennsylvania Water & Wastewater Revenue, RB |
|
|
|
|
|
|
|
|
| Series C, 5.50%, 06/01/47 |
|
|
1,900 |
|
|
|
2,109,114 |
|
| Series A, AMT, 5.00%, 10/01/43 |
|
|
3,040 |
|
|
|
3,191,255 |
|
| Series A, AMT, 5.25%, 10/01/52 |
|
|
810 |
|
|
|
843,549 |
|
| New Kensington Municipal Sanitary Authority, RB, (AGM), 3.25%, 12/01/47 |
|
|
1,195 |
|
|
|
986,745 |
|
| Oxford Area Sewer Authority, Refunding RB, (BAM), 3.00%, 07/01/46 |
|
|
1,255 |
|
|
|
972,398 |
|
| Pennsylvania Economic Development Financing Authority, Refunding RB, Class B, 5.20%, 12/01/38(a) |
|
|
1,000 |
|
|
|
1,000,000 |
|
| Philadelphia Gas Works Co., Refunding RB |
|
|
|
|
|
|
|
|
| 5.00%, 08/01/30 |
|
|
800 |
|
|
|
828,653 |
|
| 5.00%, 08/01/31 |
|
|
600 |
|
|
|
621,507 |
|
| 5.00%, 08/01/32 |
|
|
800 |
|
|
|
828,649 |
|
| 5.00%, 08/01/33 |
|
|
400 |
|
|
|
414,793 |
|
| 5.00%, 08/01/34 |
|
|
700 |
|
|
|
725,103 |
|
| Williamsport Sanitary Authority, Refunding RB, (BAM), 4.00%, 01/01/40 |
|
|
580 |
|
|
|
574,868 |
|
|
|
|
|
|
|
|
|
|
|
|
|
|
|
|
|
|
|
|
14,913,034 |
|
|
|
|
|
|
|
|
|
|
|
|
| Total Municipal Bonds in Pennsylvania |
|
|
214,424,960 |
|
|
| Puerto Rico — 5.0% |
|
|
| State — 5.0% |
|
| Puerto Rico Sales Tax Financing Corp. Sales Tax Revenue, RB |
|
|
|
|
|
|
|
|
| Series A-1, Restructured, 4.75%, 07/01/53 |
|
|
265 |
|
|
|
250,395 |
|
| Series A-1, Restructured, 5.00%, 07/01/58 |
|
|
389 |
|
|
|
379,537 |
|
| Series A-2, Restructured, 4.78%, 07/01/58 |
|
|
46 |
|
|
|
43,283 |
|
| Series A-2, Restructured, 4.33%, 07/01/40 |
|
|
519 |
|
|
|
490,882 |
|
| Series B-1, Restructured, 4.75%, 07/01/53 |
|
|
283 |
|
|
|
267,338 |
|
| Series B-1, Restructured, 5.00%, 07/01/58 |
|
|
3,423 |
|
|
|
3,340,851 |
|
| Series B-2, Restructured, 4.33%, 07/01/40 |
|
|
2,701 |
|
|
|
2,549,558 |
|
| Series B-2, Restructured, 4.78%, 07/01/58 |
|
|
274 |
|
|
|
257,878 |
|
| Puerto Rico Sales Tax Financing Corp. Sales Tax Revenue, RB, CAB, Series A-1, Restructured, 0.00%, 07/01/46(c) |
|
|
3,575 |
|
|
|
1,007,853 |
|
|
|
|
|
|
|
|
|
|
|
|
|
| Total Municipal Bonds in Puerto Rico |
|
|
|
|
8,587,575 |
|
|
|
|
|
|
|
|
|
|
|
|
|
| Total Municipal Bonds — 130.8%
(Cost: $228,115,697) |
|
|
|
|
|
|
223,012,535 |
|
|
|
|
|
|
|
|
|
|
|
| Municipal Bonds Transferred to Tender Option Bond Trusts(g) |
|
|
|
|
| Pennsylvania — 14.5% |
|
|
|
|
|
|
|
|
|
| Education — 6.7% |
|
|
|
|
|
|
| Pennsylvania Higher Educational Facilities Authority, RB, Series AR, 4.00%, 06/15/38 |
|
|
11,335 |
|
|
|
11,397,793 |
|
|
|
|
|
|
|
|
|
|
|
|
|
|
|
|
|
|
|
| Security |
|
Par
(000) |
|
|
Value |
|
|
|
|
| Health — 4.2% |
|
|
|
|
|
|
|
|
| General Authority of Southcentral Pennsylvania, Refunding RB, Series A, 5.00%, 06/01/44(d) |
|
$ |
7,000 |
|
|
$ |
7,095,512 |
|
|
|
|
|
|
|
|
|
|
|
|
|
| State — 3.6% |
|
|
|
|
|
|
|
|
| Commonwealth of Pennsylvania, GO, 1st Series, 4.00%,
03/01/38(h) |
|
|
6,000 |
|
|
|
6,125,586 |
|
|
|
|
|
|
|
|
|
|
|
|
| Total Municipal Bonds in Pennsylvania |
|
|
24,618,891 |
|
|
|
|
|
|
|
|
|
|
|
|
| Total Municipal Bonds Transferred to Tender Option Bond Trusts — 14.5%
(Cost:
$24,399,995) |
|
|
|
24,618,891 |
|
|
|
|
|
|
|
|
|
|
|
|
| Total Long-Term Investments — 145.3%
(Cost: $252,515,692) |
|
|
|
247,631,426 |
|
|
|
|
|
|
|
|
|
|
|
|
|
| |
|
Shares |
|
|
|
|
|
|
|
| Short-Term Securities |
|
|
|
|
|
|
|
|
|
|
|
| Money Market Funds — 10.1% |
|
|
|
|
|
|
|
|
| BlackRock Liquidity Funds, MuniCash, Institutional Class,
3.57%(i)(j) |
|
|
17,292,797 |
|
|
|
17,292,797 |
|
|
|
|
|
|
|
|
|
|
|
|
| Total Short-Term Securities — 10.1%
(Cost: $17,291,247) |
|
|
|
17,292,797 |
|
|
|
|
|
|
|
|
|
| Total Investments — 155.4%
(Cost: $269,806,939) |
|
|
|
264,924,223 |
|
|
|
| Other Assets Less Liabilities — 1.2% |
|
|
|
2,070,594 |
|
|
|
| Liability for TOB Trust Certificates, Including Interest Expense and Fees Payable —
(8.3)% |
|
|
|
(14,153,737 |
) |
|
|
| VRDP Shares at Liquidation Value, Net of Deferred Offering Costs — (48.3)% |
|
|
|
(82,374,060 |
) |
|
|
|
|
|
|
|
|
|
|
|
| Net Assets Applicable to Common
Shares — 100.0% |
|
|
$ |
170,467,020 |
|
|
|
|
|
|
|
|
|
|
| (a) |
Variable rate security. Interest rate resets periodically. The rate shown is the effective interest rate as of period
end. Security description also includes the reference rate and spread if published and available. |
| (b) |
Security exempt from registration pursuant to Rule 144A under the Securities Act of 1933, as amended. These securities
may be resold in transactions exempt from registration to qualified institutional investors. |
| (d) |
U.S. Government securities held in escrow, are used to pay interest on this security as well as to retire the bond in
full at the date indicated, typically at a premium to par. |
| (e) |
Issuer filed for bankruptcy and/or is in default. |
| (f) |
Non-income producing security. |
| (g) |
Represent bonds transferred to a TOB Trust in exchange of cash and residual certificates received by the Fund. These
bonds serve as collateral in a secured borrowing. See Note 4 of the Notes to Financial Statements for details. |
| (h) |
All or a portion of the security is subject to a recourse agreement. The aggregate maximum potential amount the Fund
could ultimately be required to pay under the agreement, which expires on March 1, 2026, is $3,123,333. See Note 4 of the Notes to Financial Statements for details. |
| (i) |
Affiliate of the Fund. |
| (j) |
Annualized 7-day yield as of period end.
|
For Fund compliance purposes, the
Fund’s sector classifications refer to one or more of the sector sub-classifications used by one or more widely recognized market indexes or rating group indexes, and/or as defined by the investment adviser. These definitions may not apply for
purposes of this report, which may combine such sector sub-classifications for reporting ease.
|
|
|
| 42 |
|
2 0 2 3 B L A C
K R O C K A N N U A L R E P O R
T T O S H A R E H O L D E R
S |
|
|
|
| Schedule of Investments (continued)
July 31, 2023 |
|
BlackRock MuniYield Pennsylvania Quality Fund (MPA) |
Affiliates
Investments in issuers considered to be affiliate(s) of the Fund during the year ended July 31, 2023 for purposes of Section 2(a)(3) of the
Investment Company Act of 1940, as amended, were as follows:
|
|
|
|
|
|
|
|
|
|
|
|
|
|
|
|
|
|
|
|
|
|
|
|
|
|
|
|
|
|
|
|
|
|
|
|
|
| |
|
|
|
|
|
|
|
|
|
| Affiliated Issuer |
|
Value at
07/31/22 |
|
|
Purchases
at Cost |
|
|
Proceeds
from Sales |
|
|
Net
Realized
Gain (Loss) |
|
|
Change in
Unrealized
Appreciation
(Depreciation) |
|
|
Value at
07/31/23 |
|
|
Shares
Held at
07/31/23 |
|
|
Income |
|
|
Capital Gain
Distributions
from
Underlying
Funds |
|
| BlackRock Liquidity Funds, MuniCash, Institutional Class |
|
$ |
3,965,312 |
|
|
$ |
13,329,988 |
(a) |
|
$ |
— |
|
|
$ |
(3,140 |
) |
|
$ |
637 |
|
|
$ |
17,292,797 |
|
|
|
17,292,797 |
|
|
$ |
310,090 |
|
|
$ |
— |
|
|
|
|
|
|
|
|
|
|
|
|
|
|
|
|
|
|
|
|
|
|
|
|
|
|
|
|
|
|
|
|
|
|
|
|
|
|
| |
(a) |
Represents net amount purchased (sold). |
|
Derivative Financial Instruments Categorized by Risk Exposure
For the period ended July 31, 2023, the effect of derivative financial instruments in the Statements of Operations was as follows:
|
|
|
|
|
|
|
|
|
|
|
|
|
|
|
|
|
|
|
|
|
|
|
|
|
|
|
|
|
| |
|
|
|
|
|
|
|
| |
|
Commodity
Contracts |
|
|
Credit
Contracts |
|
|
Equity
Contracts |
|
|
Foreign
Currency
Exchange
Contracts |
|
|
Interest
Rate
Contracts |
|
|
Other
Contracts |
|
|
Total |
|
| Net Realized Gain (Loss) from: |
|
|
|
|
|
|
|
|
|
|
|
|
|
|
|
|
|
|
|
|
|
|
|
|
|
|
|
|
| Futures contracts |
|
$ |
— |
|
|
$ |
— |
|
|
$ |
— |
|
|
$ |
— |
|
|
$ |
2,042,572 |
|
|
$ |
— |
|
|
$ |
2,042,572 |
|
|
|
|
|
|
|
|
|
|
|
|
|
|
|
|
|
|
|
|
|
|
|
|
|
|
|
|
|
|
|
|
|
|
|
|
|
|
| Net Change in Unrealized Appreciation (Depreciation) on: |
|
|
|
|
|
|
|
|
|
|
|
|
|
|
|
|
|
|
|
|
|
|
|
|
|
|
|
|
| Futures contracts |
|
$ |
— |
|
|
$ |
— |
|
|
$ |
— |
|
|
$ |
— |
|
|
$ |
420,844 |
|
|
$ |
— |
|
|
$ |
420,844 |
|
|
|
|
|
|
|
|
|
|
|
|
|
|
|
|
|
|
|
|
|
|
|
|
|
|
|
|
|
|
Average Quarterly Balances of Outstanding Derivative Financial Instruments
|
|
|
|
|
| Futures contracts: |
|
|
|
|
| Average notional value of contracts — short |
|
$ |
12,163,309 |
|
For more information about the Fund’s investment risks regarding derivative financial instruments, refer to the Notes
to Financial Statements.
Fair Value Hierarchy as of Period End
Various inputs are used in determining the fair value of financial instruments. For a description of the input levels and information about the
Fund’s policy regarding valuation of financial instruments, refer to the Notes to Financial Statements.
The following table summarizes the
Fund’s financial instruments categorized in the fair value hierarchy. The breakdown of the Fund’s financial instruments into major categories is disclosed in the Schedule of Investments above.
|
|
|
|
|
|
|
|
|
|
|
|
|
|
|
|
|
|
|
|
|
|
|
|
|
|
|
|
|
| |
|
|
|
|
|
|
|
| |
|
Level 1 |
|
|
|
|
|
Level 2 |
|
|
|
|
|
Level 3 |
|
|
|
|
|
Total |
|
| Assets |
|
|
|
|
|
|
|
|
|
|
|
|
|
|
|
|
|
|
|
|
|
|
|
|
|
|
|
|
| Investments |
|
|
|
|
|
|
|
|
|
|
|
|
|
|
|
|
|
|
|
|
|
|
|
|
|
|
|
|
| Long-Term Investments |
|
|
|
|
|
|
|
|
|
|
|
|
|
|
|
|
|
|
|
|
|
|
|
|
|
|
|
|
| Municipal Bonds |
|
$ |
— |
|
|
|
|
|
|
$ |
223,012,535 |
|
|
|
|
|
|
$ |
— |
|
|
|
|
|
|
$ |
223,012,535 |
|
| Municipal Bonds Transferred to Tender Option Bond Trusts |
|
|
— |
|
|
|
|
|
|
|
24,618,891 |
|
|
|
|
|
|
|
— |
|
|
|
|
|
|
|
24,618,891 |
|
| Short-Term Securities |
|
|
|
|
|
|
|
|
|
|
|
|
|
|
|
|
|
|
|
|
|
|
|
|
|
|
|
|
| Money Market Funds |
|
|
17,292,797 |
|
|
|
|
|
|
|
— |
|
|
|
|
|
|
|
— |
|
|
|
|
|
|
|
17,292,797 |
|
|
|
|
|
|
|
|
|
|
|
|
|
|
|
|
|
|
|
|
|
|
|
|
|
|
|
|
|
|
|
|
|
|
|
|
|
|
|
|
$ |
17,292,797 |
|
|
|
|
|
|
$ |
247,631,426 |
|
|
|
|
|
|
$ |
— |
|
|
|
|
|
|
$ |
264,924,223 |
|
|
|
|
|
|
|
|
|
|
|
|
|
|
|
|
|
|
|
|
|
|
|
|
|
|
|
|
|
|
The Fund may hold assets and/or liabilities in which the fair value approximates the carrying amount for financial
statement purposes. As of period end, such assets and/or liabilities are categorized within the fair value hierarchy as follows:
|
|
|
|
|
|
|
|
|
|
|
|
|
|
|
|
|
|
|
|
|
|
|
|
|
|
|
|
|
| |
|
|
|
|
|
|
|
| |
|
Level 1 |
|
|
|
|
|
Level 2 |
|
|
|
|
|
Level 3 |
|
|
|
|
|
Total |
|
| Liabilities |
|
|
|
|
|
|
|
|
|
|
|
|
|
|
|
|
|
|
|
|
|
|
|
|
|
|
|
|
| TOB Trust Certificates |
|
$ |
— |
|
|
|
|
|
|
$ |
(14,060,000 |
) |
|
|
|
|
|
$ |
— |
|
|
|
|
|
|
$ |
(14,060,000 |
) |
| VRDP Shares at Liquidation Value |
|
|
— |
|
|
|
|
|
|
|
(82,600,000 |
) |
|
|
|
|
|
|
— |
|
|
|
|
|
|
|
(82,600,000 |
) |
|
|
|
|
|
|
|
|
|
|
|
|
|
|
|
|
|
|
|
|
|
|
|
|
|
|
|
|
|
|
|
|
|
|
|
|
|
|
|
$ |
— |
|
|
|
|
|
|
$ |
(96,660,000 |
) |
|
|
|
|
|
$ |
— |
|
|
|
|
|
|
$ |
(96,660,000 |
) |
|
|
|
|
|
|
|
|
|
|
|
|
|
|
|
|
|
|
|
|
|
|
|
|
|
|
|
|
|
See notes to financial statements.
|
|
|
| S C H E D U L E
O F I N V E S T M E N T S |
|
43 |
|
|
|
| Schedule of Investments July 31, 2023 |
|
BlackRock MuniYield Quality Fund III, Inc. (MYI)
(Percentages shown are based on Net Assets) |
|
|
|
|
|
|
|
|
|
| Security |
|
Par
(000) |
|
|
Value |
|
|
|
|
| Municipal Bonds |
|
|
|
|
|
|
|
|
|
|
|
| Alabama — 1.3% |
|
|
|
|
|
|
|
|
| Homewood Educational Building Authority, Refunding RB, Series A, 5.00%, 12/01/47 |
|
$ |
2,835 |
|
|
$ |
2,890,430 |
|
| Huntsville Public Building Authority, RB, 5.00%, 02/01/47 |
|
|
7,000 |
|
|
|
7,660,135 |
|
|
|
|
|
|
|
|
|
|
|
|
|
|
|
|
|
|
|
|
10,550,565 |
|
|
|
|
| Arizona — 1.6% |
|
|
|
|
|
|
| Arizona Industrial Development Authority,
RB(a) |
|
|
|
|
|
|
|
|
| 4.38%, 07/01/39 |
|
|
810 |
|
|
|
704,839 |
|
| 5.00%, 07/01/54 |
|
|
945 |
|
|
|
812,645 |
|
| Series A, 5.00%, 07/01/49 |
|
|
1,675 |
|
|
|
1,481,819 |
|
| Series A, 5.00%, 07/01/54 |
|
|
1,290 |
|
|
|
1,115,918 |
|
| City of Mesa Arizona Utility System Revenue, RB, Series A, 5.00%, 07/01/43 |
|
|
6,000 |
|
|
|
6,450,426 |
|
| Industrial Development Authority of the County of Pima, Refunding RB, 5.00%, 06/15/52(a) |
|
|
1,620 |
|
|
|
1,406,996 |
|
| Maricopa County Industrial Development Authority, Refunding RB |
|
|
|
|
|
|
|
|
| 5.00%, 07/01/54(a) |
|
|
855 |
|
|
|
763,164 |
|
| Series A, 5.00%, 09/01/42 |
|
|
435 |
|
|
|
451,298 |
|
|
|
|
|
|
|
|
|
|
|
|
|
|
|
|
|
|
|
|
13,187,105 |
|
|
|
|
| Arkansas — 0.6% |
|
|
|
|
|
|
| Arkansas Development Finance Authority, RB |
|
|
|
|
|
|
|
|
| AMT, 5.70%, 05/01/53 |
|
|
1,430 |
|
|
|
1,454,786 |
|
| Series A, AMT, 4.50%, 09/01/49(a) |
|
|
4,100 |
|
|
|
3,719,725 |
|
|
|
|
|
|
|
|
|
|
|
|
|
|
|
|
|
|
|
|
5,174,511 |
|
|
|
|
| California — 10.4% |
|
|
|
|
|
|
| California Community Housing Agency, RB, M/F Housing, 3.00%, 08/01/56(a) |
|
|
380 |
|
|
|
249,586 |
|
| California Enterprise Development Authority, RB, 8.00%, 11/15/62(a) |
|
|
1,250 |
|
|
|
1,224,363 |
|
| California State Public Works Board, RB, Series I, 5.00%, 11/01/38 |
|
|
5,040 |
|
|
|
5,070,094 |
|
| City of Los Angeles Department of Airports, Refunding ARB, AMT, 5.50%, 05/15/47 |
|
|
2,000 |
|
|
|
2,212,164 |
|
| CSCDA Community Improvement Authority, RB, M/F
Housing(a) |
|
|
|
|
|
|
|
|
| 5.00%, 09/01/37 |
|
|
320 |
|
|
|
314,664 |
|
| 4.00%, 10/01/56 |
|
|
470 |
|
|
|
387,689 |
|
| 4.00%, 12/01/56 |
|
|
495 |
|
|
|
351,111 |
|
| Series A, 4.00%, 06/01/58 |
|
|
2,955 |
|
|
|
2,301,115 |
|
| Senior Lien, 3.13%, 06/01/57 |
|
|
1,780 |
|
|
|
1,218,599 |
|
| Series A, Senior Lien, 4.00%, 12/01/58 |
|
|
2,555 |
|
|
|
1,967,350 |
|
| Grossmont Union High School District, GO, Election 2004, 0.00%, 08/01/31(b) |
|
|
5,110 |
|
|
|
4,064,806 |
|
| Long Beach Unified School District, GO, Series B, Election 2008, 0.00%, 08/01/34(b) |
|
|
5,000 |
|
|
|
3,525,100 |
|
| Mount San Antonio Community College District, Refunding GO, CAB, CAB,
Series A, Convertible,
Election 2013, 6.25%, 08/01/28(c) |
|
|
3,975 |
|
|
|
3,701,667 |
|
| Norwalk-La Mirada Unified School District, Refunding GO, Series E, Election 2002, (AGC), 0.00%, 08/01/38(b) |
|
|
7,620 |
|
|
|
4,148,762 |
|
| Poway Unified School District, Refunding
GO(b) |
|
|
|
|
|
|
|
|
| 0.00%, 08/01/35 |
|
|
7,820 |
|
|
|
5,190,947 |
|
| Series B, 0.00%, 08/01/36 |
|
|
10,000 |
|
|
|
6,194,110 |
|
| Rio Hondo Community College District, GO(b) |
|
|
|
|
|
|
|
|
| Series C, Election 2004, 0.00%, 08/01/37 |
|
|
8,000 |
|
|
|
4,651,872 |
|
|
|
|
|
|
|
|
|
|
| Security |
|
Par
(000) |
|
|
Value |
|
|
|
|
| California (continued) |
|
|
|
|
|
|
| Rio Hondo Community College District, GO(b)
(continued) |
|
|
|
|
|
|
|
|
| Series C, Election 2004, 0.00%, 08/01/38 |
|
$ |
12,940 |
|
|
$ |
7,105,820 |
|
| San Diego Unified School District, GO, CAB, Series G, Election 2008, 0.00%, 01/01/24(b)(d) |
|
|
8,765 |
|
|
|
4,506,874 |
|
| San Diego Unified School District, Refunding GO, CAB, Series R-1, 0.00%, 07/01/31(b) |
|
|
3,485 |
|
|
|
2,740,325 |
|
| San Francisco City & County Airport Comm-San Francisco International Airport, Refunding ARB,
Series A, AMT, 5.00%, 05/01/44 |
|
|
14,215 |
|
|
|
14,754,943 |
|
| State of California, GO, Series 2007-2, (NPFGC-IBC), 5.50%, 04/01/30 |
|
|
10 |
|
|
|
10,016 |
|
| Val Verde Unified School District, GO, Series G, Election 2012, (AGM), 4.00%, 08/01/48 |
|
|
7,660 |
|
|
|
7,472,521 |
|
| Walnut Valley Unified School District, GO, Series B, Election 2007, 0.00%, 08/01/36(b) |
|
|
6,545 |
|
|
|
4,042,624 |
|
|
|
|
|
|
|
|
|
|
|
|
|
|
|
|
|
|
|
|
87,407,122 |
|
|
|
|
| Colorado — 4.4% |
|
|
|
|
|
|
| City & County of Denver Colorado Airport System Revenue, Refunding ARB |
|
|
|
|
|
|
|
|
| Series A, AMT, 5.25%, 12/01/43 |
|
|
5,835 |
|
|
|
6,098,404 |
|
| Series D, AMT, 5.75%, 11/15/37 |
|
|
5,000 |
|
|
|
5,810,570 |
|
| City of Colorado Springs Colorado Utilities System Revenue, RB,
Series B, 4.00%, 11/15/46 |
|
|
11,820 |
|
|
|
11,594,368 |
|
| Colorado Educational & Cultural Facilities Authority, RB, 5.00%, 03/01/50(a) |
|
|
2,530 |
|
|
|
2,325,389 |
|
| Colorado Educational & Cultural Facilities Authority, Refunding RB, Class A, 5.00%, 10/01/59(a) |
|
|
3,365 |
|
|
|
2,925,615 |
|
| Colorado Health Facilities Authority, RB |
|
|
|
|
|
|
|
|
| 5.00%, 11/01/42 |
|
|
2,500 |
|
|
|
2,614,707 |
|
| 5.25%, 11/01/52 |
|
|
2,750 |
|
|
|
2,919,081 |
|
| Denver Convention Center Hotel Authority, Refunding RB, 5.00%, 12/01/36 |
|
|
1,500 |
|
|
|
1,524,968 |
|
| STC Metropolitan District No. 2, Refunding GO, Series A, 5.00%, 12/01/38 |
|
|
1,285 |
|
|
|
1,208,334 |
|
|
|
|
|
|
|
|
|
|
|
|
|
|
|
|
|
|
|
|
37,021,436 |
|
|
|
|
| Connecticut — 0.0% |
|
|
|
|
|
|
| Connecticut State Health & Educational Facilities Authority, RB, Series A-1, 5.00%, 10/01/54(a) |
|
|
390 |
|
|
|
291,090 |
|
|
|
|
|
|
|
|
|
|
|
|
|
| District of Columbia — 0.4% |
|
|
|
|
|
|
| Metropolitan Washington Airports Authority Aviation Revenue, Refunding ARB, Series A, AMT, 5.25%,
10/01/48 |
|
|
1,400 |
|
|
|
1,500,896 |
|
| Washington Metropolitan Area Transit Authority Dedicated Revenue, RB, Series A, 4.13%, 07/15/47 |
|
|
1,890 |
|
|
|
1,893,973 |
|
|
|
|
|
|
|
|
|
|
|
|
|
|
|
|
|
|
|
|
3,394,869 |
|
|
|
|
| Florida — 17.3% |
|
|
|
|
|
|
| Brevard County Health Facilities Authority, Refunding RB, 5.00%, 04/01/39 |
|
|
4,535 |
|
|
|
4,584,096 |
|
| Broward County Florida Water & Sewer Utility Revenue, RB, Series A, 4.00%, 10/01/47 |
|
|
5,000 |
|
|
|
4,906,940 |
|
| Capital Trust Agency, Inc., RB(a) |
|
|
|
|
|
|
|
|
| 5.00%, 01/01/55 |
|
|
1,640 |
|
|
|
1,265,821 |
|
| Series A, 5.00%, 06/01/55 |
|
|
1,475 |
|
|
|
1,242,400 |
|
| Series A, 5.50%, 06/01/57 |
|
|
500 |
|
|
|
453,880 |
|
| City of Jacksonville Florida, Refunding RB, Series A, 5.25%, 10/01/42 |
|
|
4,000 |
|
|
|
4,245,424 |
|
| City of Miami Beach Florida, RB, 5.00%, 09/01/45 |
|
|
5,000 |
|
|
|
5,121,930 |
|
|
|
|
| 44 |
|
2 0 2 3 B L A C
K R O C K A N N U A L R E P O R
T T O S H A R E H O L D E R
S |
|
|
|
| Schedule of Investments (continued)
July 31, 2023 |
|
BlackRock MuniYield Quality Fund III, Inc. (MYI)
(Percentages shown are based on Net Assets) |
|
|
|
|
|
|
|
|
|
| Security |
|
Par
(000) |
|
|
Value |
|
|
|
|
| Florida (continued) |
|
|
|
|
|
|
| City of South Miami Health Facilities Authority, Inc., Refunding RB, 5.00%, 08/15/47 |
|
$ |
3,655 |
|
|
$ |
3,770,187 |
|
| City of Tampa Florida, RB, CAB(b) |
|
|
|
|
|
|
|
|
| Series A, 0.00%, 09/01/40 |
|
|
3,290 |
|
|
|
1,446,251 |
|
| Series A, 0.00%, 09/01/42 |
|
|
1,150 |
|
|
|
452,167 |
|
| Series A, 0.00%, 09/01/45 |
|
|
2,000 |
|
|
|
691,462 |
|
| County of Broward Florida Airport System Revenue, ARB, Series A, AMT, 5.00%, 10/01/40 |
|
|
3,000 |
|
|
|
3,048,804 |
|
| County of Miami-Dade Florida Aviation Revenue, Refunding RB |
|
|
|
|
|
|
|
|
| AMT, 5.00%, 10/01/34 |
|
|
530 |
|
|
|
536,889 |
|
| Series B, AMT, 5.00%, 10/01/40 |
|
|
9,365 |
|
|
|
9,659,080 |
|
| County of Miami-Dade Florida Transit System, RB, 5.00%, 07/01/48 |
|
|
1,750 |
|
|
|
1,900,141 |
|
| County of Miami-Dade Florida Water & Sewer System Revenue, Refunding RB, Series A, 4.00%,
10/01/44 |
|
|
9,500 |
|
|
|
9,336,324 |
|
| County of Miami-Dade Seaport Department, ARB(d) |
|
|
|
|
|
|
|
|
| Series A, 6.00%, 10/01/23 |
|
|
5,695 |
|
|
|
5,718,765 |
|
| Series B, AMT, 6.00%, 10/01/23 |
|
|
3,685 |
|
|
|
3,697,610 |
|
| Series B, AMT, 6.25%, 10/01/23 |
|
|
1,165 |
|
|
|
1,169,455 |
|
| County of Miami-Dade Seaport Department, Refunding RB, Series B-2, AMT, Subordinate, 4.00%, 10/01/50 |
|
|
3,500 |
|
|
|
3,266,197 |
|
| County of Pasco Florida, RB |
|
|
|
|
|
|
|
|
| (AGM), 5.00%, 09/01/48 |
|
|
7,790 |
|
|
|
8,312,039 |
|
| (AGM), 5.75%, 09/01/54 |
|
|
1,400 |
|
|
|
1,569,957 |
|
| Florida Development Finance Corp., RB(a) |
|
|
|
|
|
|
|
|
| 6.50%, 06/30/57 |
|
|
1,085 |
|
|
|
1,058,553 |
|
| AMT, 5.00%, 05/01/29 |
|
|
1,500 |
|
|
|
1,418,682 |
|
| Florida Development Finance Corp., Refunding RB, Series C, 5.00%, 09/15/50(a) |
|
|
820 |
|
|
|
658,275 |
|
| Greater Orlando Aviation Authority, ARB |
|
|
|
|
|
|
|
|
| Series A, AMT, 5.00%, 10/01/34 |
|
|
5,060 |
|
|
|
5,461,779 |
|
| Series A, AMT, 5.00%, 10/01/49 |
|
|
2,670 |
|
|
|
2,744,755 |
|
| Sub-Series A, AMT, 5.00%, 10/01/42 |
|
|
4,760 |
|
|
|
4,920,898 |
|
| Hillsborough County Aviation Authority, ARB, AMT, 5.00%, 10/01/47 |
|
|
2,500 |
|
|
|
2,621,725 |
|
| LT Ranch Community Development District, SAB |
|
|
|
|
|
|
|
|
| 4.00%, 05/01/40 |
|
|
1,415 |
|
|
|
1,232,911 |
|
| 4.00%, 05/01/50 |
|
|
2,000 |
|
|
|
1,584,712 |
|
| Miami-Dade County Educational Facilities Authority, Refunding RB, Series A, 5.00%, 04/01/40 |
|
|
14,360 |
|
|
|
14,618,394 |
|
| Miami-Dade County Health Facilities Authority, Refunding RB, 5.00%, 08/01/42 |
|
|
1,675 |
|
|
|
1,727,026 |
|
| Orange County Health Facilities Authority, Refunding RB |
|
|
|
|
|
|
|
|
| 5.00%, 08/01/41 |
|
|
1,550 |
|
|
|
1,596,500 |
|
| 5.00%, 08/01/47 |
|
|
4,590 |
|
|
|
4,727,700 |
|
| Palm Beach County School District, COP, Series B, 5.25%, 08/01/40 |
|
|
8,000 |
|
|
|
8,948,680 |
|
| Parker Road Community Development District, Refunding SAB |
|
|
|
|
|
|
|
|
| 3.88%, 05/01/40 |
|
|
900 |
|
|
|
771,668 |
|
| 4.10%, 05/01/50 |
|
|
1,000 |
|
|
|
806,292 |
|
| School District of Broward County, GO, 5.00%, 07/01/46 |
|
|
5,000 |
|
|
|
5,435,870 |
|
| Seminole Improvement District, RB |
|
|
|
|
|
|
|
|
| 5.00%, 10/01/32 |
|
|
230 |
|
|
|
226,880 |
|
| 5.30%, 10/01/37 |
|
|
260 |
|
|
|
257,981 |
|
|
|
|
|
|
|
|
|
|
| Security |
|
Par
(000) |
|
|
Value |
|
|
|
|
| Florida (continued) |
|
|
|
|
|
|
| Town of Davie Florida, Refunding RB, 5.00%, 04/01/37 |
|
$ |
4,630 |
|
|
$ |
4,811,413 |
|
| Viera Stewardship District, SAB, Series 2023, 5.50%, 05/01/54 |
|
|
790 |
|
|
|
784,739 |
|
| Village Community Development District No. 14, SAB, 5.50%, 05/01/53 |
|
|
1,730 |
|
|
|
1,780,872 |
|
| Village Community Development District No. 15, SAB, 5.25%, 05/01/54(a) |
|
|
730 |
|
|
|
739,007 |
|
| Westside Community Development District, Refunding
SAB(a) |
|
|
|
|
|
|
|
|
| 4.10%, 05/01/37 |
|
|
640 |
|
|
|
580,653 |
|
| 4.13%, 05/01/38 |
|
|
630 |
|
|
|
568,055 |
|
|
|
|
|
|
|
|
|
|
|
|
|
|
|
|
|
|
|
|
146,479,839 |
|
|
|
|
| Georgia — 0.7% |
|
|
|
|
|
|
| East Point Business & Industrial Development Authority, RB, Series A, 5.25%, 06/15/62(a) |
|
|
630 |
|
|
|
564,381 |
|
| Main Street Natural Gas, Inc., RB |
|
|
|
|
|
|
|
|
| Series A, 5.00%, 05/15/43 |
|
|
1,105 |
|
|
|
1,102,339 |
|
| Series A, 5.00%, 06/01/53(e) |
|
|
4,195 |
|
|
|
4,355,463 |
|
|
|
|
|
|
|
|
|
|
|
|
|
|
|
|
|
|
|
|
6,022,183 |
|
|
|
|
| Hawaii — 1.1% |
|
|
|
|
|
|
| State of Hawaii Airports System Revenue, COP |
|
|
|
|
|
|
|
|
| AMT, 5.00%, 08/01/27 |
|
|
2,000 |
|
|
|
2,001,002 |
|
| AMT, 5.00%, 08/01/28 |
|
|
1,775 |
|
|
|
1,775,873 |
|
| State of Hawaii Department of Budget & Finance, Refunding RB, AMT, 4.00%, 03/01/37 |
|
|
5,275 |
|
|
|
5,160,327 |
|
|
|
|
|
|
|
|
|
|
|
|
|
|
|
|
|
|
|
|
8,937,202 |
|
|
|
|
| Illinois — 10.2% |
|
|
|
|
|
|
| Chicago Board of Education, GO |
|
|
|
|
|
|
|
|
| Series A, 5.00%, 12/01/34 |
|
|
3,955 |
|
|
|
4,117,665 |
|
| Series A, 5.00%, 12/01/40 |
|
|
1,270 |
|
|
|
1,284,106 |
|
| Series A, 5.00%, 12/01/41 |
|
|
1,000 |
|
|
|
1,007,265 |
|
| Series A, 5.00%, 12/01/47 |
|
|
1,115 |
|
|
|
1,099,021 |
|
| Chicago Board of Education, Refunding GO, Series B, 5.00%, 12/01/36 |
|
|
1,300 |
|
|
|
1,335,662 |
|
| Chicago O’Hare International Airport, ARB |
|
|
|
|
|
|
|
|
| Class A, AMT, Senior Lien, 5.00%, 01/01/48 |
|
|
1,935 |
|
|
|
2,021,202 |
|
| Series D, Senior Lien, 5.25%, 01/01/42 |
|
|
8,285 |
|
|
|
8,669,109 |
|
| Cook County Community College District No. 508, GO, 5.13%, 12/01/38 |
|
|
3,250 |
|
|
|
3,256,428 |
|
| Illinois Finance Authority, Refunding RB |
|
|
|
|
|
|
|
|
| 4.00%, 08/15/41 |
|
|
1,750 |
|
|
|
1,700,823 |
|
| Series C, 5.00%, 08/15/44 |
|
|
985 |
|
|
|
995,590 |
|
| Illinois State Toll Highway Authority, RB,
Series B, 5.00%, 01/01/40 |
|
|
2,930 |
|
|
|
3,020,265 |
|
| Metropolitan Pier & Exposition Authority,
RB(b) |
|
|
|
|
|
|
|
|
| Series A, (NPFGC), 0.00%, 12/15/33 |
|
|
20,000 |
|
|
|
13,695,040 |
|
| Series A, (NPFGC), 0.00%, 12/15/34 |
|
|
41,880 |
|
|
|
27,348,603 |
|
| Metropolitan Pier & Exposition Authority, Refunding RB, Series B, (AGM), 0.00%, 06/15/44(b) |
|
|
9,430 |
|
|
|
3,698,342 |
|
| State of Illinois, GO |
|
|
|
|
|
|
|
|
| 5.25%, 02/01/33 |
|
|
5,860 |
|
|
|
5,897,680 |
|
| 5.25%, 02/01/34 |
|
|
5,360 |
|
|
|
5,392,734 |
|
| Series B, 5.25%, 05/01/43 |
|
|
1,640 |
|
|
|
1,744,958 |
|
|
|
|
|
|
|
|
|
|
|
|
|
|
|
|
|
|
|
|
86,284,493 |
|
|
|
|
| S C H E D U L E
O F I N V E S T M E N T S |
|
45 |
|
|
|
| Schedule of Investments (continued)
July 31, 2023 |
|
BlackRock MuniYield Quality Fund III, Inc. (MYI)
(Percentages shown are based on Net Assets) |
|
|
|
|
|
|
|
|
|
| Security |
|
Par
(000) |
|
|
Value |
|
|
|
|
| Indiana — 0.2% |
|
|
|
|
|
|
| Indiana Finance Authority, RB, 1st Lien, 4.00%, 10/01/51 |
|
$ |
2,025 |
|
|
$ |
1,894,687 |
|
|
|
|
|
|
|
|
|
|
|
|
|
| Kentucky — 1.2% |
|
|
|
|
|
|
| City of Henderson Kentucky, RB, Series A, AMT, 4.70%,
01/01/52(a) |
|
|
475 |
|
|
|
454,304 |
|
| Kentucky Public Transportation Infrastructure Authority, RB, CAB, Series C, Convertible, 6.60%, 07/01/39(c) |
|
|
8,225 |
|
|
|
9,647,753 |
|
|
|
|
|
|
|
|
|
|
|
|
|
|
|
|
|
|
|
|
10,102,057 |
|
|
|
|
| Louisiana — 0.7% |
|
|
|
|
|
|
| Lafayette Parish School Board Sale Tax Revenue, RB, 4.00%, 04/01/48 |
|
|
1,200 |
|
|
|
1,176,296 |
|
| New Orleans Aviation Board, ARB, Series B, AMT, 5.00%, 01/01/40 |
|
|
4,825 |
|
|
|
4,854,447 |
|
|
|
|
|
|
|
|
|
|
|
|
|
|
|
|
|
|
|
|
6,030,743 |
|
|
|
|
| Maryland — 0.3% |
|
|
|
|
|
|
| Maryland Health & Higher Educational Facilities Authority, RB, Series B, 4.00%, 04/15/50 |
|
|
2,815 |
|
|
|
2,655,533 |
|
|
|
|
|
|
|
|
|
|
|
|
|
| Massachusetts — 2.6% |
|
|
|
|
|
|
| Commonwealth of Massachusetts, GO, Series C, 5.25%, 10/01/47 |
|
|
10,000 |
|
|
|
11,183,850 |
|
| Massachusetts Development Finance Agency, RB, Series A, 5.00%, 01/01/47 |
|
|
9,720 |
|
|
|
9,733,725 |
|
| Massachusetts Housing Finance Agency, Refunding RB, Series A, AMT, 4.45%, 12/01/42 |
|
|
1,140 |
|
|
|
1,086,772 |
|
|
|
|
|
|
|
|
|
|
|
|
|
|
|
|
|
|
|
|
22,004,347 |
|
|
|
|
| Michigan — 6.0% |
|
|
|
|
|
|
| Lansing Board of Water & Light, RB,
Series A, 5.00%, 07/01/51 |
|
|
1,600 |
|
|
|
1,710,834 |
|
| Lansing Board of Water & Light, Refunding RB |
|
|
|
|
|
|
|
|
| Series A, 5.00%, 07/01/44 |
|
|
2,335 |
|
|
|
2,483,796 |
|
| Series A, 5.00%, 07/01/48 |
|
|
4,000 |
|
|
|
4,226,208 |
|
| Michigan Finance Authority, RB |
|
|
|
|
|
|
|
|
| 4.00%, 02/15/47 |
|
|
1,855 |
|
|
|
1,750,061 |
|
| Series S, 5.00%, 11/01/44 |
|
|
5,590 |
|
|
|
5,708,541 |
|
| Michigan State Building Authority, Refunding RB |
|
|
|
|
|
|
|
|
| Series I, 5.00%, 10/15/45 |
|
|
2,410 |
|
|
|
2,471,775 |
|
| Series I, 4.00%, 10/15/46 |
|
|
5,980 |
|
|
|
5,829,358 |
|
| Michigan State Housing Development Authority, RB, M/F Housing, Series A, 5.00%, 10/01/48 |
|
|
8,405 |
|
|
|
8,657,083 |
|
| Michigan State University, Refunding RB, Series B, 4.00%, 02/15/39 |
|
|
2,125 |
|
|
|
2,157,353 |
|
| Michigan Strategic Fund, RB |
|
|
|
|
|
|
|
|
| AMT, (AGM), 4.25%, 12/31/38 |
|
|
2,000 |
|
|
|
1,999,956 |
|
| AMT, 5.00%, 12/31/43 |
|
|
9,940 |
|
|
|
10,057,918 |
|
| State of Michigan Trunk Line Revenue, RB, BAB, Series B, 4.00%, 11/15/45 |
|
|
2,500 |
|
|
|
2,476,595 |
|
| Western Michigan University, Refunding RB, (AGM), 5.00%, 11/15/23(d) |
|
|
1,080 |
|
|
|
1,084,886 |
|
|
|
|
|
|
|
|
|
|
|
|
|
|
|
|
|
|
|
|
50,614,364 |
|
|
|
|
| Minnesota — 0.4% |
|
|
|
|
|
|
| Minnesota Housing Finance Agency, RB, S/F Housing, Series N, (FHLMC, FNMA, GNMA), 6.00%, 01/01/53(f) |
|
|
3,345 |
|
|
|
3,580,046 |
|
|
|
|
|
|
|
|
|
|
|
|
|
|
|
|
|
|
|
| Security |
|
Par
(000) |
|
|
Value |
|
|
|
|
| Nevada — 0.3% |
|
|
|
|
|
|
| City of Las Vegas Nevada Special Improvement District No. 814, SAB |
|
|
|
|
|
|
|
|
| 4.00%, 06/01/39 |
|
$ |
375 |
|
|
$ |
328,155 |
|
| 4.00%, 06/01/44 |
|
|
1,005 |
|
|
|
828,615 |
|
| Tahoe-Douglas Visitors Authority, RB, 5.00%, 07/01/51 |
|
|
1,610 |
|
|
|
1,546,173 |
|
|
|
|
|
|
|
|
|
|
|
|
|
|
|
|
|
|
|
|
2,702,943 |
|
|
|
|
| New Jersey — 8.3% |
|
|
|
|
|
|
| Hudson County Improvement Authority, RB, 5.00%, 05/01/46 |
|
|
2,320 |
|
|
|
2,393,498 |
|
| New Jersey Economic Development Authority, RB |
|
|
|
|
|
|
|
|
| Series DDD, 5.00%, 06/15/27(d) |
|
|
590 |
|
|
|
637,519 |
|
| Series WW, 5.00%, 06/15/25(d) |
|
|
3,205 |
|
|
|
3,311,006 |
|
| Series WW, 5.25%, 06/15/25(d) |
|
|
1,470 |
|
|
|
1,525,350 |
|
| AMT, 5.13%, 01/01/34 |
|
|
1,930 |
|
|
|
1,936,633 |
|
| AMT, 5.38%, 01/01/43 |
|
|
4,920 |
|
|
|
4,931,675 |
|
| New Jersey Economic Development Authority, Refunding RB, Series N-1, (NPFGC), 5.50%, 09/01/28 |
|
|
1,685 |
|
|
|
1,874,123 |
|
| New Jersey Transportation Trust Fund Authority, RB |
|
|
|
|
|
|
|
|
| Series A, (NPFGC), 5.75%, 06/15/25 |
|
|
4,000 |
|
|
|
4,170,460 |
|
| Series AA, 5.00%, 06/15/38 |
|
|
3,990 |
|
|
|
4,048,820 |
|
| Series C, (AGC-ICC AMBAC), 0.00%, 12/15/25(b) |
|
|
8,550 |
|
|
|
7,903,466 |
|
| Series D, 5.00%, 06/15/32 |
|
|
1,825 |
|
|
|
1,868,241 |
|
| New Jersey Transportation Trust Fund Authority, RB, CAB, Series A, 0.00%, 12/15/35(b) |
|
|
10,000 |
|
|
|
5,991,960 |
|
| New Jersey Transportation Trust Fund Authority, Refunding RB, Series A, 4.25%, 06/15/40 |
|
|
10,945 |
|
|
|
11,074,600 |
|
| New Jersey Turnpike Authority, RB, Series B, 5.00%, 01/01/46 |
|
|
5,265 |
|
|
|
5,786,019 |
|
| Tobacco Settlement Financing Corp., Refunding RB |
|
|
|
|
|
|
|
|
| Series A, 5.00%, 06/01/46 |
|
|
4,000 |
|
|
|
4,122,428 |
|
| Series A, 5.25%, 06/01/46 |
|
|
6,035 |
|
|
|
6,293,497 |
|
| Sub-Series B, 5.00%, 06/01/46 |
|
|
2,495 |
|
|
|
2,490,404 |
|
|
|
|
|
|
|
|
|
|
|
|
|
|
|
|
|
|
|
|
70,359,699 |
|
|
|
|
| New Mexico — 0.1% |
|
|
|
|
|
|
| City of Santa Fe New Mexico, RB, Series A, 5.00%, 05/15/44 |
|
|
425 |
|
|
|
367,730 |
|
|
|
|
|
|
|
|
|
|
|
|
|
| New York — 12.6% |
|
|
|
|
|
|
| City of New York, GO |
|
|
|
|
|
|
|
|
| Series B, 5.25%, 10/01/42 |
|
|
2,500 |
|
|
|
2,835,167 |
|
| Series C, 5.00%, 08/01/43 |
|
|
2,585 |
|
|
|
2,807,124 |
|
| Series D-1, 5.25%, 05/01/42 |
|
|
1,155 |
|
|
|
1,303,940 |
|
| Sub-Series F-1, 5.00%, 04/01/43 |
|
|
6,000 |
|
|
|
6,361,878 |
|
| Metropolitan Transportation Authority, Refunding RB, Series A-1, 5.25%, 11/15/57 |
|
|
4,000 |
|
|
|
4,106,300 |
|
| New York City Municipal Water Finance Authority, Refunding RB |
|
|
|
|
|
|
|
|
| Series DD, 4.13%, 06/15/46 |
|
|
3,825 |
|
|
|
3,822,640 |
|
| Series DD, 4.13%, 06/15/47 |
|
|
5,035 |
|
|
|
5,042,648 |
|
| New York City Transitional Finance Authority Future Tax Secured Revenue, RB |
|
|
|
|
|
|
|
|
| Series A-1, 5.00%, 08/01/38 |
|
|
2,500 |
|
|
|
2,679,022 |
|
| Series E-1, 4.00%, 02/01/42 |
|
|
3,325 |
|
|
|
3,332,092 |
|
| Series E-1, 4.00%, 02/01/46 |
|
|
1,930 |
|
|
|
1,872,335 |
|
| Series C-1, Subordinate, 4.00%, 02/01/42 |
|
|
8,000 |
|
|
|
8,018,984 |
|
| Series C-1, Subordinate, 4.00%, 02/01/43 |
|
|
8,355 |
|
|
|
8,223,960 |
|
| Series F-1, Subordinate, 4.00%, 02/01/38 |
|
|
1,700 |
|
|
|
1,727,062 |
|
|
|
|
| 46 |
|
2 0 2 3 B L A C
K R O C K A N N U A L R E P O R
T T O S H A R E H O L D E R
S |
|
|
|
| Schedule of Investments (continued)
July 31, 2023 |
|
BlackRock MuniYield Quality Fund III, Inc. (MYI)
(Percentages shown are based on Net Assets) |
|
|
|
|
|
|
|
|
|
| Security |
|
Par
(000) |
|
|
Value |
|
|
|
|
| New York (continued) |
|
|
|
|
|
|
| New York Liberty Development Corp., Refunding RB |
|
|
|
|
|
|
|
|
| Series 1, 5.00%, 11/15/44(a) |
|
$ |
3,055 |
|
|
$ |
2,981,558 |
|
| Series A, 2.88%, 11/15/46 |
|
|
3,120 |
|
|
|
2,280,792 |
|
| Series A, (BAM-TCRS), 3.00%, 11/15/51 |
|
|
7,430 |
|
|
|
5,490,220 |
|
| New York State Dormitory Authority, Refunding RB |
|
|
|
|
|
|
|
|
| Series A, 4.00%, 03/15/42 |
|
|
1,160 |
|
|
|
1,166,903 |
|
| Series E, 5.00%, 03/15/40 |
|
|
480 |
|
|
|
515,652 |
|
| Series E, 4.00%, 03/15/46 |
|
|
1,825 |
|
|
|
1,793,641 |
|
| New York Transportation Development Corp., ARB, Series A, AMT, 5.25%, 01/01/50 |
|
|
8,300 |
|
|
|
8,317,339 |
|
| New York Transportation Development Corp., RB, AMT, 5.00%, 10/01/35 |
|
|
3,275 |
|
|
|
3,429,053 |
|
| Port Authority of New York & New Jersey, ARB, AMT, 4.00%, 09/01/43 |
|
|
3,000 |
|
|
|
2,893,236 |
|
| Port Authority of New York & New Jersey, Refunding RB, Series 226, AMT, 5.00%, 10/15/39 |
|
|
2,500 |
|
|
|
2,702,530 |
|
| Triborough Bridge & Tunnel Authority Sales Tax Revenue, RB |
|
|
|
|
|
|
|
|
| Series A, 4.00%, 05/15/48 |
|
|
10,090 |
|
|
|
9,968,194 |
|
| Series A, 5.00%, 05/15/48 |
|
|
1,325 |
|
|
|
1,457,370 |
|
| Triborough Bridge & Tunnel Authority, Refunding RB, Series A, 5.00%, 05/15/47 |
|
|
10,000 |
|
|
|
10,876,640 |
|
|
|
|
|
|
|
|
|
|
|
|
|
|
|
|
|
|
|
|
106,006,280 |
|
|
|
|
| Ohio — 3.9% |
|
|
|
|
|
|
| Buckeye Tobacco Settlement Financing Authority, Refunding RB, Series B-2, Class 2, 5.00%, 06/01/55 |
|
|
16,600 |
|
|
|
15,457,903 |
|
| County of Franklin Ohio, RB, Series A, 5.00%, 12/01/47 |
|
|
4,500 |
|
|
|
4,629,173 |
|
| County of Montgomery Ohio, RB, 5.45%,
11/13/23(d) |
|
|
11,135 |
|
|
|
11,197,445 |
|
| Ohio Air Quality Development Authority, RB, AMT, 5.00%, 07/01/49(a) |
|
|
1,810 |
|
|
|
1,660,098 |
|
|
|
|
|
|
|
|
|
|
|
|
|
|
|
|
|
|
|
|
32,944,619 |
|
|
|
|
| Oregon — 0.5% |
|
|
|
|
|
|
| Clackamas County School District No. 12 North Clackamas, GO, CAB, Series A, (GTD), 0.00%, 06/15/38(b) |
|
|
2,800 |
|
|
|
1,460,780 |
|
| Port of Portland Oregon Airport Revenue, Refunding ARB, 29th Series, AMT, 5.50%, 07/01/48 |
|
|
2,400 |
|
|
|
2,656,065 |
|
|
|
|
|
|
|
|
|
|
|
|
|
|
|
|
|
|
|
|
4,116,845 |
|
|
|
|
| Pennsylvania — 6.4% |
|
|
|
|
|
|
| Bucks County Industrial Development Authority, RB, 4.00%, 07/01/46 |
|
|
405 |
|
|
|
305,695 |
|
| Montgomery County Industrial Development Authority, RB, Series C, 5.00%, 11/15/45 |
|
|
450 |
|
|
|
421,075 |
|
| Pennsylvania Economic Development Financing Authority, RB |
|
|
|
|
|
|
|
|
| AMT, 5.00%, 12/31/34 |
|
|
7,115 |
|
|
|
7,263,682 |
|
| AMT, 5.00%, 12/31/38 |
|
|
6,850 |
|
|
|
6,924,932 |
|
| AMT, 5.00%, 06/30/42 |
|
|
8,805 |
|
|
|
8,852,485 |
|
| AMT, 5.75%, 06/30/48 |
|
|
1,645 |
|
|
|
1,823,947 |
|
| Pennsylvania Higher Educational Facilities Authority, Refunding RB, Series A, 5.25%, 09/01/50 |
|
|
6,075 |
|
|
|
6,114,694 |
|
| Pennsylvania Turnpike Commission, RB |
|
|
|
|
|
|
|
|
| Series A-1, 5.00%, 12/01/41 |
|
|
2,320 |
|
|
|
2,397,316 |
|
| Series B, 5.00%, 12/01/40 |
|
|
4,920 |
|
|
|
5,061,504 |
|
| Series C, 5.50%, 12/01/23(d) |
|
|
1,565 |
|
|
|
1,575,774 |
|
| Sub-Series B-1, 5.00%, 06/01/42 |
|
|
7,330 |
|
|
|
7,625,524 |
|
|
|
|
|
|
|
|
|
|
| Security |
|
Par
(000) |
|
|
Value |
|
|
|
|
| Pennsylvania (continued) |
|
|
|
|
|
|
| Pennsylvania Turnpike Commission, Refunding RB |
|
|
|
|
|
|
|
|
| Series A, 5.00%, 12/01/38 |
|
$ |
1,775 |
|
|
$ |
1,814,703 |
|
| Series A-1, 5.00%, 12/01/40 |
|
|
2,165 |
|
|
|
2,215,778 |
|
| Series B, 5.25%, 12/01/44 |
|
|
1,500 |
|
|
|
1,665,717 |
|
|
|
|
|
|
|
|
|
|
|
|
|
|
|
|
|
|
|
|
54,062,826 |
|
|
|
|
| Puerto Rico — 4.6% |
|
|
|
|
|
|
| Puerto Rico Sales Tax Financing Corp. Sales Tax Revenue, RB |
|
|
|
|
|
|
|
|
| Series A-1, Restructured, 4.75%, 07/01/53 |
|
|
1,334 |
|
|
|
1,260,476 |
|
| Series A-1, Restructured, 5.00%, 07/01/58 |
|
|
2,007 |
|
|
|
1,958,178 |
|
| Series A-2, Restructured, 4.78%, 07/01/58 |
|
|
214 |
|
|
|
201,358 |
|
| Series A-2, Restructured, 4.33%, 07/01/40 |
|
|
2,372 |
|
|
|
2,243,492 |
|
| Series B-1, Restructured, 4.75%, 07/01/53 |
|
|
1,302 |
|
|
|
1,229,945 |
|
| Series B-1, Restructured, 5.00%, 07/01/58 |
|
|
15,757 |
|
|
|
15,378,848 |
|
| Series B-2, Restructured, 4.33%, 07/01/40 |
|
|
12,433 |
|
|
|
11,735,894 |
|
| Series B-2, Restructured, 4.78%, 07/01/58 |
|
|
1,261 |
|
|
|
1,186,804 |
|
| Puerto Rico Sales Tax Financing Corp. Sales Tax Revenue, RB, CAB, Series A-1, Restructured, 0.00%, 07/01/46(b) |
|
|
13,259 |
|
|
|
3,737,937 |
|
|
|
|
|
|
|
|
|
|
|
|
|
|
|
|
|
|
|
|
38,932,932 |
|
|
|
|
| South Carolina — 4.6% |
|
|
|
|
|
|
| South Carolina Jobs-Economic Development Authority, RB |
|
|
|
|
|
|
|
|
| 5.00%, 01/01/40(a) |
|
|
2,630 |
|
|
|
2,419,895 |
|
| 5.00%, 11/01/43 |
|
|
5,000 |
|
|
|
5,253,550 |
|
| 7.50%, 08/15/62(a) |
|
|
1,290 |
|
|
|
1,193,969 |
|
| South Carolina Ports Authority, ARB, AMT, 5.25%,
07/01/25(d) |
|
|
6,530 |
|
|
|
6,717,084 |
|
| South Carolina Public Service Authority, RB |
|
|
|
|
|
|
|
|
| Series A, 4.00%, 12/01/43 |
|
|
3,000 |
|
|
|
2,866,215 |
|
| Series A, 5.50%, 12/01/54 |
|
|
11,450 |
|
|
|
11,554,138 |
|
| South Carolina Public Service Authority, Refunding RB |
|
|
|
|
|
|
|
|
| 5.00%, 12/01/38 |
|
|
5,870 |
|
|
|
5,899,749 |
|
| Series B, 5.00%, 12/01/51 |
|
|
3,000 |
|
|
|
3,148,347 |
|
|
|
|
|
|
|
|
|
|
|
|
|
|
|
|
|
|
|
|
39,052,947 |
|
|
|
|
| Tennessee — 1.0% |
|
|
|
|
|
|
| Metropolitan Government Nashville & Davidson County Health & Educational Facilities
Board, Refunding RB, Series A, 5.25%, 10/01/58 |
|
|
4,665 |
|
|
|
4,489,750 |
|
| Metropolitan Nashville Airport Authority, ARB |
|
|
|
|
|
|
|
|
| Series B, AMT, 5.50%, 07/01/41 |
|
|
1,875 |
|
|
|
2,078,872 |
|
| Series B, AMT, 5.50%, 07/01/42 |
|
|
2,000 |
|
|
|
2,209,116 |
|
|
|
|
|
|
|
|
|
|
|
|
|
|
|
|
|
|
|
|
8,777,738 |
|
|
|
|
| Texas — 11.0% |
|
|
|
|
|
|
| Arlington Higher Education Finance Corp.,
RB(a) |
|
|
|
|
|
|
|
|
| 7.50%, 04/01/62 |
|
|
1,420 |
|
|
|
1,392,577 |
|
| 7.88%, 11/01/62 |
|
|
1,195 |
|
|
|
1,221,559 |
|
| City of El Paso Texas Water & Sewer Revenue, Refunding RB, Series A, 4.00%, 03/01/44 |
|
|
9,540 |
|
|
|
9,302,941 |
|
| City of Houston Texas Airport System Revenue, ARB, Series A, AMT, 6.63%, 07/15/38 |
|
|
1,295 |
|
|
|
1,295,063 |
|
| City of Houston Texas Airport System Revenue, Refunding ARB, AMT, 5.00%, 07/15/27 |
|
|
710 |
|
|
|
720,256 |
|
| City of Houston Texas Airport System Revenue, Refunding RB, Series A, AMT, 5.00%, 07/01/27 |
|
|
690 |
|
|
|
700,915 |
|
| City of San Antonio Texas Electric & Gas Systems Revenue, Refunding RB, Junior Lien, 5.00%,
02/01/44 |
|
|
4,500 |
|
|
|
4,899,271 |
|
|
|
|
| S C H E D U L E
O F I N V E S T M E N T S |
|
47 |
|
|
|
| Schedule of Investments (continued)
July 31, 2023 |
|
BlackRock MuniYield Quality Fund III, Inc. (MYI)
(Percentages shown are based on Net Assets) |
|
|
|
|
|
|
|
|
|
| Security |
|
Par
(000) |
|
|
Value |
|
|
|
|
| Texas (continued) |
|
|
|
|
|
|
| Dallas Fort Worth International Airport, Refunding RB, Series F, 5.25%, 11/01/33 |
|
$ |
2,745 |
|
|
$ |
2,759,340 |
|
| Fort Worth Independent School District, GO, (PSF), 4.00%, 02/15/48 |
|
|
470 |
|
|
|
455,384 |
|
| Galveston Independent School District, GO, (PSF), 4.00%, 02/01/47 |
|
|
8,075 |
|
|
|
7,835,100 |
|
| Harris County Flood Control District, Refunding GO, Series A, Sustainability Bonds, 4.00%, 09/15/48 |
|
|
2,500 |
|
|
|
2,404,433 |
|
| Houston Independent School District, Refunding GO, (PSF), 5.00%, 02/15/42 |
|
|
10,000 |
|
|
|
10,475,690 |
|
| Klein Independent School District, GO, (PSF), 4.00%, 08/01/47 |
|
|
5,000 |
|
|
|
4,835,385 |
|
| Lake Travis Independent School District, GO, 4.00%, 02/15/48 |
|
|
3,100 |
|
|
|
2,999,207 |
|
| Leander Independent School District, Refunding GO, CAB, Series D, (PSF), 0.00%, 08/15/24(b)(d) |
|
|
9,685 |
|
|
|
4,800,080 |
|
| Midland County Fresh Water Supply District No. 1, RB, CAB, Series A, 0.00%, 09/15/27(b)(d) |
|
|
5,810 |
|
|
|
3,285,090 |
|
| New Hope Cultural Education Facilities Finance Corp., RB, Series A, 5.00%, 08/15/50(a) |
|
|
1,385 |
|
|
|
1,209,313 |
|
| North Texas Tollway Authority, Refunding RB, Series A, 5.00%, 01/01/39 |
|
|
9,080 |
|
|
|
9,534,463 |
|
| Port Authority of Houston of Harris County Texas, ARB, 4.00%, 10/01/46 |
|
|
1,025 |
|
|
|
1,001,566 |
|
| Tarrant County Cultural Education Facilities Finance Corp., RB |
|
|
|
|
|
|
|
|
| Series A, 4.00%, 07/01/53 |
|
|
960 |
|
|
|
880,650 |
|
| Series A, 5.00%, 07/01/53 |
|
|
1,180 |
|
|
|
1,256,709 |
|
| Series B, 5.00%, 07/01/34 |
|
|
5,000 |
|
|
|
5,374,245 |
|
| Tarrant County Cultural Education Facilities Finance Corp., Refunding RB, 5.25%, 12/01/39 |
|
|
2,095 |
|
|
|
2,107,208 |
|
| Texas City Industrial Development Corp., RB, Series 2012, 4.13%, 12/01/45 |
|
|
820 |
|
|
|
705,069 |
|
| Texas Private Activity Bond Surface Transportation Corp., RB, AMT, Senior Lien, 5.00%, 12/31/45 |
|
|
3,630 |
|
|
|
3,635,597 |
|
| Texas State Technical College, RB, (AGM), 5.50%, 08/01/42 |
|
|
3,335 |
|
|
|
3,779,996 |
|
| Texas Water Development Board, RB, Series B, 4.00%, 10/15/43 |
|
|
4,315 |
|
|
|
4,313,766 |
|
|
|
|
|
|
|
|
|
|
|
|
|
|
|
|
|
|
|
|
93,180,873 |
|
|
|
|
| Utah — 2.3% |
|
|
|
|
|
|
| City of Salt Lake City Utah Airport Revenue, ARB |
|
|
|
|
|
|
|
|
| Series A, AMT, 5.00%, 07/01/36 |
|
|
3,475 |
|
|
|
3,665,173 |
|
| Series A, AMT, 5.00%, 07/01/43 |
|
|
3,490 |
|
|
|
3,618,195 |
|
| Series A, AMT, 5.00%, 07/01/48 |
|
|
3,140 |
|
|
|
3,232,203 |
|
| City of Salt Lake City Utah Airport Revenue, RB, Series A, AMT, 5.25%, 07/01/48(f) |
|
|
2,650 |
|
|
|
2,850,107 |
|
| Intermountain Power Agency, Refunding RB, Series A, 5.00%, 07/01/44 |
|
|
5,000 |
|
|
|
5,454,730 |
|
| Utah Charter School Finance Authority, RB(a) |
|
|
|
|
|
|
|
|
| Series A, 5.00%, 06/15/39 |
|
|
190 |
|
|
|
177,528 |
|
| Series A, 5.00%, 06/15/49 |
|
|
380 |
|
|
|
333,539 |
|
|
|
|
|
|
|
|
|
|
|
|
|
|
|
|
|
|
|
|
19,331,475 |
|
|
|
|
|
|
|
|
|
|
| Security |
|
Par
(000) |
|
|
Value |
|
|
|
|
| Virginia — 0.3% |
|
|
|
|
|
|
| Tobacco Settlement Financing Corp., Refunding RB, Series B-1, 5.00%, 06/01/47 |
|
$ |
3,030 |
|
|
$ |
2,850,045 |
|
|
|
|
|
|
|
|
|
|
|
|
|
| Washington — 1.1% |
|
|
|
|
|
|
| Port of Seattle Washington, Refunding ARB, AMT, Intermediate Lien, 5.00%, 08/01/47 |
|
|
4,350 |
|
|
|
4,559,348 |
|
| Washington Health Care Facilities Authority, Refunding RB, Series B, 4.00%, 08/15/41 |
|
|
5,000 |
|
|
|
4,708,855 |
|
|
|
|
|
|
|
|
|
|
|
|
|
|
|
|
|
|
|
|
9,268,203 |
|
|
|
|
| Wisconsin — 3.4% |
|
|
|
|
|
|
| Public Finance Authority, RB |
|
|
|
|
|
|
|
|
| 5.00%, 10/15/51(a) |
|
|
650 |
|
|
|
560,002 |
|
| Class A, 4.25%, 06/15/31(a) |
|
|
270 |
|
|
|
243,100 |
|
| Class A, 5.00%, 06/15/41(a) |
|
|
895 |
|
|
|
763,084 |
|
| Class A, 5.00%, 06/15/51(a) |
|
|
590 |
|
|
|
464,806 |
|
| Class A, 6.00%, 06/15/52 |
|
|
450 |
|
|
|
409,529 |
|
| Class A, 6.13%, 06/15/57 |
|
|
505 |
|
|
|
463,512 |
|
| Public Finance Authority, Refunding RB(a) |
|
|
|
|
|
|
|
|
| 5.00%, 09/01/39 |
|
|
100 |
|
|
|
83,402 |
|
| 5.00%, 09/01/49 |
|
|
845 |
|
|
|
640,113 |
|
| Wisconsin Health & Educational Facilities Authority, Refunding RB |
|
|
|
|
|
|
|
|
| 5.00%, 04/01/44 |
|
|
7,350 |
|
|
|
7,787,788 |
|
| 4.00%, 12/01/46 |
|
|
5,130 |
|
|
|
4,917,638 |
|
| 4.00%, 12/01/51 |
|
|
3,000 |
|
|
|
2,840,142 |
|
| Series A, 5.00%, 11/15/36 |
|
|
8,955 |
|
|
|
9,346,181 |
|
|
|
|
|
|
|
|
|
|
|
|
|
|
|
|
|
|
|
|
28,519,297 |
|
|
|
|
|
|
|
|
|
|
|
|
|
| Total Municipal Bonds — 119.8%
(Cost: $991,311,692) |
|
|
|
|
|
|
1,012,106,644 |
|
|
|
|
|
|
|
|
|
|
|
| Municipal Bonds Transferred to Tender Option Bond Trusts(g) |
|
|
|
|
| Alabama — 1.4% |
|
|
|
|
|
|
| Alabama Special Care Facilities Financing Authority- Birmingham Alabama, Refunding RB, Series B, 5.00%,
11/15/46 |
|
|
11,790 |
|
|
|
12,110,517 |
|
|
|
|
|
|
|
|
|
|
|
|
|
| Arizona — 1.0% |
|
|
|
|
|
|
| City of Phoenix Civic Improvement Corp., RB, AMT, Senior Lien, 5.00%, 07/01/43 |
|
|
8,500 |
|
|
|
8,821,870 |
|
|
|
|
|
|
|
|
|
|
|
|
|
| California — 2.7% |
|
|
|
|
|
|
| Los Angeles Unified School District, GO,
Series QRR, 5.25%, 07/01/47 |
|
|
9,750 |
|
|
|
11,006,526 |
|
| State of California, Refunding GO, 5.00%, 04/01/45 |
|
|
10,500 |
|
|
|
11,336,178 |
|
|
|
|
|
|
|
|
|
|
|
|
|
|
|
|
|
|
|
|
22,342,704 |
|
|
|
|
| Florida — 3.0% |
|
|
|
|
|
|
| Central Florida Expressway Authority, RB, Series B, Senior Lien, 5.00%, 07/01/49 |
|
|
14,090 |
|
|
|
14,906,184 |
|
| City of Tampa Florida, RB, Series A, 5.00%, 11/15/46 |
|
|
10,500 |
|
|
|
10,785,432 |
|
|
|
|
|
|
|
|
|
|
|
|
|
|
|
|
|
|
|
|
25,691,616 |
|
|
|
|
| Illinois — 7.7% |
|
|
|
|
|
|
| Chicago Transit Authority Sales Tax Receipts Fund, Refunding RB, Series A, Second Lien, (BAM), 5.00%,
12/01/46 |
|
|
10,000 |
|
|
|
10,741,725 |
|
|
|
|
| 48 |
|
2 0 2 3 B L A C
K R O C K A N N U A L R E P O R
T T O S H A R E H O L D E R
S |
|
|
|
| Schedule of Investments (continued)
July 31, 2023 |
|
BlackRock MuniYield Quality Fund III, Inc. (MYI)
(Percentages shown are based on Net Assets) |
|
|
|
|
|
|
|
|
|
| Security |
|
Par
(000) |
|
|
Value |
|
|
|
|
| Illinois (continued) |
|
|
|
|
|
|
| Illinois Finance Authority, Refunding RB, Series A, 5.00%, 07/15/42 |
|
$ |
20,000 |
|
|
$ |
20,994,930 |
|
| Illinois State Toll Highway Authority, RB |
|
|
|
|
|
|
|
|
| Series A, 5.00%, 01/01/38 |
|
|
5,833 |
|
|
|
5,838,109 |
|
| Series A, 5.00%, 01/01/40 |
|
|
7,630 |
|
|
|
7,732,695 |
|
| Series A, 5.00%, 01/01/44 |
|
|
8,000 |
|
|
|
8,487,224 |
|
| Series A, 5.00%, 01/01/46 |
|
|
10,470 |
|
|
|
11,261,642 |
|
|
|
|
|
|
|
|
|
|
|
|
|
|
|
|
|
|
|
|
65,056,325 |
|
|
|
|
| Massachusetts — 1.3% |
|
|
|
|
|
|
| Commonwealth of Massachusetts, GO, Series A, 5.25%, 01/01/44 |
|
|
10,000 |
|
|
|
10,844,265 |
|
|
|
|
|
|
|
|
|
|
|
|
|
| Michigan — 1.9% |
|
|
|
|
|
|
| Michigan State Housing Development Authority, RB, S/F Housing, Series D, 5.50%, 06/01/53 |
|
|
5,202 |
|
|
|
5,482,535 |
|
| Michigan State University, Refunding RB, Series B, 5.00%, 02/15/48 |
|
|
10,000 |
|
|
|
10,574,075 |
|
|
|
|
|
|
|
|
|
|
|
|
|
|
|
|
|
|
|
|
16,056,610 |
|
|
|
|
| Nebraska — 1.2% |
|
|
|
|
|
|
| Omaha Public Power District, RB, Series A, 5.00%, 02/01/47 |
|
|
8,975 |
|
|
|
9,678,343 |
|
|
|
|
|
|
|
|
|
|
|
|
|
| New Jersey — 1.3% |
|
|
|
|
|
|
| Garden State Preservation Trust, RB,
Series A, (AGM), 5.75%, 11/01/28 |
|
|
10,000 |
|
|
|
10,823,928 |
|
|
|
|
|
|
|
|
|
|
|
|
|
| New York — 10.6% |
|
|
|
|
|
|
| New York City Municipal Water Finance Authority, Refunding RB, Series DD, 5.00%, 06/15/35 |
|
|
4,740 |
|
|
|
4,838,609 |
|
| New York City Transitional Finance Authority Future Tax Secured Revenue, RB |
|
|
|
|
|
|
|
|
| Series D-1, 5.25%, 11/01/43 |
|
|
12,040 |
|
|
|
13,456,127 |
|
| Series D-1, 5.50%, 11/01/45 |
|
|
5,900 |
|
|
|
6,695,155 |
|
| New York State Dormitory Authority, RB, Series A, 5.00%, 03/15/41 |
|
|
9,795 |
|
|
|
10,443,791 |
|
| New York State Urban Development Corp., RB, Series A-1, 5.00%, 03/15/43 |
|
|
14,280 |
|
|
|
14,293,780 |
|
| New York State Urban Development Corp., Refunding RB |
|
|
|
|
|
|
|
|
| 5.00%, 03/15/41 |
|
|
7,790 |
|
|
|
8,724,839 |
|
| 5.00%, 03/15/43 |
|
|
10,000 |
|
|
|
11,121,630 |
|
| 5.00%, 03/15/44 |
|
|
8,280 |
|
|
|
9,182,023 |
|
| Triborough Bridge & Tunnel Authority, RB, Series D-2, Senior Lien, 5.25%, 05/15/47 |
|
|
9,810 |
|
|
|
10,925,480 |
|
|
|
|
|
|
|
|
|
|
|
|
|
|
|
|
|
|
|
|
89,681,434 |
|
|
|
|
| Ohio — 1.9% |
|
|
|
|
|
|
| University of Cincinnati, RB, Series A, 5.00%, 06/01/45 |
|
|
15,025 |
|
|
|
15,645,208 |
|
|
|
|
|
|
|
|
|
|
|
|
|
| Texas — 1.2% |
|
|
|
|
|
|
| Dallas Area Rapid Transit, Refunding RB, Series B, Senior Lien, 5.00%, 12/01/47 |
|
|
9,480 |
|
|
|
10,165,674 |
|
|
|
|
|
|
|
|
|
|
|
|
|
|
|
|
|
|
|
| Security |
|
Par
(000) |
|
|
Value |
|
|
|
|
| Washington — 5.0% |
|
|
|
|
|
|
| Port of Seattle Washington, RB, Series A, AMT, 5.00%, 05/01/43 |
|
$ |
15,500 |
|
|
$ |
15,917,314 |
|
| Port of Seattle Washington, Refunding RB, AMT, Intermediate Lien, 5.50%, 08/01/47 |
|
|
10,665 |
|
|
|
11,567,337 |
|
| State of Washington, GO, Series A-3, 5.00%, 08/01/47 |
|
|
13,395 |
|
|
|
14,633,764 |
|
|
|
|
|
|
|
|
|
|
|
|
|
|
|
|
|
|
|
|
42,118,415 |
|
|
|
|
|
|
|
|
|
|
|
|
| Total Municipal Bonds Transferred to Tender Option Bond Trusts — 40.2%
(Cost:
$328,331,495) |
|
|
|
339,036,909 |
|
|
|
|
|
|
|
|
|
|
| Total Long-Term Investments — 160.0%
(Cost: $1,319,643,187) |
|
|
|
1,351,143,553 |
|
|
|
|
|
|
|
|
|
|
|
|
|
| |
|
Shares |
|
|
|
|
|
|
|
| Short-Term Securities |
|
|
|
|
|
|
|
|
|
|
|
| Money Market Funds — 1.1% |
|
|
|
|
|
|
| BlackRock Liquidity Funds, MuniCash, Institutional Class,
3.57%(h)(i) |
|
|
9,536,835 |
|
|
|
9,536,835 |
|
|
|
|
|
|
|
|
|
|
|
|
|
| Total Short-Term Securities — 1.1%
(Cost: $9,536,566) |
|
|
|
|
|
|
9,536,835 |
|
|
|
|
|
|
|
|
|
|
|
|
| Total Investments — 161.1%
(Cost: $1,329,179,753) |
|
|
|
1,360,680,388 |
|
| Other Assets Less Liabilities — 1.2% |
|
|
|
9,992,186 |
|
| Liability for TOB Trust Certificates, Including Interest Expense and Fees Payable —
(20.1)% |
|
|
|
(169,945,587 |
) |
| VRDP Shares at Liquidation Value, Net of Deferred Offering Costs — (42.2)% |
|
|
|
(356,123,124 |
) |
|
|
|
|
|
|
| Net Assets Applicable to Common Shares — 100.0% |
|
|
$ |
844,603,863 |
|
|
|
|
|
|
|
|
|
|
| (a) |
Security exempt from registration pursuant to Rule 144A under the Securities Act of 1933, as amended. These securities
may be resold in transactions exempt from registration to qualified institutional investors. |
| (c) |
Step coupon security. Coupon rate will either increase (step-up bond) or decrease (step-down bond) at regular intervals
until maturity. Interest rate shown reflects the rate currently in effect. |
| (d) |
U.S. Government securities held in escrow, are used to pay interest on this security as well as to retire the bond in
full at the date indicated, typically at a premium to par. |
| (e) |
Variable rate security. Interest rate resets periodically. The rate shown is the effective interest rate as of period
end. Security description also includes the reference rate and spread if published and available. |
| (f) |
When-issued security. |
| (g) |
Represent bonds transferred to a TOB Trust in exchange of cash and residual certificates received by the Fund. These
bonds serve as collateral in a secured borrowing. See Note 4 of the Notes to Financial Statements for details. |
| (h) |
Affiliate of the Fund. |
| (i) |
Annualized 7-day yield as of period end.
|
|
|
|
| S C H E D U L E
O F I N V E S T M E N T S |
|
49 |
|
|
|
| Schedule of Investments (continued)
July 31, 2023 |
|
BlackRock MuniYield Quality Fund III, Inc. (MYI) |
Affiliates
Investments in issuers considered to be affiliate(s) of the Fund during the year ended July 31, 2023 for purposes of Section 2(a)(3) of the
Investment Company Act of 1940, as amended, were as follows:
|
|
|
|
|
|
|
|
|
|
|
|
|
|
|
|
|
|
|
|
|
|
|
|
|
|
|
|
|
|
|
|
|
|
|
|
|
| |
|
|
|
|
|
|
|
|
|
| Affiliated Issuer |
|
Value at
07/31/22 |
|
|
Purchases
at Cost |
|
|
Proceeds
from Sales |
|
|
Net
Realized
Gain (Loss) |
|
|
Change in
Unrealized
Appreciation
(Depreciation) |
|
|
Value at
07/31/23 |
|
|
Shares
Held at
07/31/23 |
|
|
Income |
|
|
Capital Gain
Distributions
from
Underlying
Funds |
|
| BlackRock Liquidity Funds, MuniCash, Institutional Class |
|
$ |
3,050,831 |
|
|
$ |
6,477,747 |
(a) |
|
$ |
— |
|
|
$ |
8,293 |
|
|
$ |
(36 |
) |
|
$ |
9,536,835 |
|
|
|
9,536,835 |
|
|
$ |
362,203 |
|
|
$ |
— |
|
|
|
|
|
|
|
|
|
|
|
|
|
|
|
|
|
|
|
|
|
|
|
|
|
|
|
|
|
|
|
|
|
|
|
|
|
|
| |
(a) |
Represents net amount purchased (sold). |
|
Derivative Financial Instruments Categorized by Risk Exposure
For the period ended July 31, 2023, the effect of derivative financial instruments in the Statements of Operations was as follows:
|
|
|
|
|
|
|
|
|
|
|
|
|
|
|
|
|
|
|
|
|
|
|
|
|
|
|
|
|
| |
|
| |
|
Commodity
Contracts |
|
|
Credit
Contracts |
|
|
Equity
Contracts |
|
|
Foreign
Currency
Exchange
Contracts |
|
|
Interest
Rate Contracts |
|
|
Other
Contracts |
|
|
Total |
|
| |
|
| Net Realized Gain (Loss) from: |
|
| Futures contracts |
|
$ |
— |
|
|
$ |
— |
|
|
$ |
— |
|
|
$ |
— |
|
|
$ |
(335,523 |
) |
|
$ |
— |
|
|
$ |
(335,523 |
) |
|
|
|
|
|
|
|
|
|
|
|
|
|
|
|
|
|
|
|
|
|
|
|
|
|
|
|
|
|
| Net Change in Unrealized Appreciation (Depreciation) on: |
|
|
|
|
|
|
|
|
|
|
|
|
|
|
|
|
|
|
|
|
|
|
|
|
|
|
|
|
| Futures contracts |
|
$ |
— |
|
|
$ |
— |
|
|
$ |
— |
|
|
$ |
— |
|
|
$ |
1,474,611 |
|
|
$ |
— |
|
|
$ |
1,474,611 |
|
|
|
|
|
|
|
|
|
|
|
|
|
|
|
|
|
|
|
|
|
|
|
|
|
|
|
|
|
|
Average Quarterly Balances of Outstanding Derivative Financial Instruments
|
|
|
|
|
| Futures contracts: |
|
|
|
|
| Average notional value of contracts — short |
|
$ |
57,276,570 |
|
| |
|
For more information about the Fund’s investment risks regarding derivative financial instruments, refer to the Notes
to Financial Statements.
Fair Value Hierarchy as of Period End
Various inputs are used in determining the fair value of financial instruments. For a description of the input levels and information about the
Fund’s policy regarding valuation of financial instruments, refer to the Notes to Financial Statements.
The following table summarizes the
Fund’s financial instruments categorized in the fair value hierarchy. The breakdown of the Fund’s financial instruments into major categories is disclosed in the Schedule of Investments above.
|
|
|
|
|
|
|
|
|
|
|
|
|
|
|
|
|
| |
|
Level 1 |
|
|
Level 2 |
|
|
Level 3 |
|
|
Total |
|
| Assets |
|
|
|
|
|
|
|
|
|
|
|
|
|
|
|
|
| Investments |
|
|
|
|
|
|
|
|
|
|
|
|
|
|
|
|
| Long-Term Investments |
|
|
|
|
|
|
|
|
|
|
|
|
|
|
|
|
| Municipal Bonds |
|
$ |
— |
|
|
$ |
1,012,106,644 |
|
|
$ |
— |
|
|
$ |
1,012,106,644 |
|
| Municipal Bonds Transferred to Tender Option Bond Trusts |
|
|
— |
|
|
|
339,036,909 |
|
|
|
— |
|
|
|
339,036,909 |
|
| Short-Term Securities |
|
|
|
|
|
|
|
|
|
|
|
|
|
|
|
|
| Money Market Funds |
|
|
9,536,835 |
|
|
|
— |
|
|
|
— |
|
|
|
9,536,835 |
|
|
|
|
|
|
|
|
|
|
|
|
|
|
|
|
|
|
|
|
|
|
|
|
|
$ |
9,536,835 |
|
|
$ |
1,351,143,553 |
|
|
$ |
— |
|
|
$ |
1,360,680,388 |
|
|
|
|
|
|
|
|
|
|
|
|
|
|
|
|
|
|
The Fund may hold assets and/or liabilities in which the fair value approximates the carrying amount for financial
statement purposes. As of period end, such assets and/or liabilities are categorized within the fair value hierarchy as follows:
|
|
|
|
|
|
|
|
|
|
|
|
|
|
|
|
|
| |
|
Level 1 |
|
|
Level 2 |
|
|
Level 3 |
|
|
Total |
|
| Liabilities |
|
|
|
|
|
|
|
|
|
|
|
|
|
|
|
|
| TOB Trust Certificates |
|
$ |
— |
|
|
$ |
(168,574,218 |
) |
|
$ |
— |
|
|
$ |
(168,574,218 |
) |
| VRDP Shares at Liquidation Value |
|
|
— |
|
|
|
(356,400,000 |
) |
|
|
— |
|
|
|
(356,400,000 |
) |
|
|
|
|
|
|
|
|
|
|
|
|
|
|
|
|
|
|
|
|
|
|
|
|
$ |
— |
|
|
$ |
(524,974,218 |
) |
|
$ |
— |
|
|
$ |
(524,974,218 |
) |
|
|
|
|
|
|
|
|
|
|
|
|
|
|
|
|
|
See notes to financial statements.
|
|
|
| 50 |
|
2 0 2 3 B L A C
K R O C K A N N U A L R E P O R
T T O S H A R E H O L D E R
S |
|
|
|
| Schedule of Investments July 31, 2023 |
|
BlackRock New York Municipal Income Trust (BNY)
(Percentages shown are based on Net Assets) |
|
|
|
|
|
|
|
|
|
| Security |
|
Par
(000) |
|
|
Value |
|
|
|
|
| Municipal Bonds |
|
|
|
|
|
|
|
|
|
|
|
| Alabama — 0.2% |
|
|
|
|
|
|
|
|
|
| Corporate — 0.2% |
|
|
|
|
|
|
| Lower Alabama Gas District, RB, Series A, 5.00%, 09/01/46 |
|
$ |
645 |
|
|
$ |
655,993 |
|
|
|
|
|
|
|
|
|
|
|
|
|
| Guam — 0.2% |
|
|
|
|
|
|
|
|
|
| Utilities — 0.2% |
|
|
|
|
|
|
| Guam Power Authority, Refunding RB, Series A, 5.00%, 10/01/41 |
|
|
460 |
|
|
|
476,836 |
|
|
|
|
|
|
|
|
|
|
|
|
|
| New York — 150.4% |
|
|
|
|
|
|
|
|
|
| Corporate — 5.1% |
|
|
|
|
|
|
| Build NYC Resource Corp., Refunding RB, AMT, 5.00%,
01/01/35(a) |
|
|
420 |
|
|
|
428,260 |
|
| New York Liberty Development Corp., RB, 5.50%, 10/01/37 |
|
|
655 |
|
|
|
752,716 |
|
| New York Liberty Development Corp., Refunding RB, 5.25%, 10/01/35 |
|
|
5,160 |
|
|
|
5,901,894 |
|
| New York State Energy Research & Development Authority, Refunding RB, Series C, 4.00%,
04/01/34 |
|
|
575 |
|
|
|
580,962 |
|
| New York State Environmental Facilities Corp., RB, AMT, 2.75%, 09/01/50(b) |
|
|
120 |
|
|
|
115,269 |
|
| New York Transportation Development Corp., RB |
|
|
|
|
|
|
|
|
| AMT, 5.00%, 10/01/35 |
|
|
930 |
|
|
|
973,746 |
|
| AMT, 5.00%, 10/01/40 |
|
|
2,750 |
|
|
|
2,804,890 |
|
| New York Transportation Development Corp., Refunding ARB, AMT, 3.00%, 08/01/31 |
|
|
1,180 |
|
|
|
1,039,073 |
|
| Niagara Area Development Corp., Refunding RB, Series A, AMT, 4.75%, 11/01/42(a) |
|
|
2,710 |
|
|
|
2,390,813 |
|
|
|
|
|
|
|
|
|
|
|
|
|
|
|
|
|
|
|
|
14,987,623 |
|
|
| County/City/Special District/School District — 33.2% |
|
| Battery Park City Authority, RB, Sustainability Bonds, 4.00%, 11/01/44 |
|
|
2,280 |
|
|
|
2,293,776 |
|
| City of New York, GO |
|
|
|
|
|
|
|
|
| Series A-1, 4.00%, 09/01/46 |
|
|
800 |
|
|
|
782,133 |
|
| Series B, 5.25%, 10/01/39 |
|
|
525 |
|
|
|
600,545 |
|
| Series B, 5.25%, 10/01/40 |
|
|
405 |
|
|
|
462,017 |
|
| Series C, 5.00%, 08/01/43 |
|
|
385 |
|
|
|
418,082 |
|
| Series D, 5.38%, 06/01/32 |
|
|
25 |
|
|
|
25,032 |
|
| Series D-1, 4.00%, 03/01/42 |
|
|
545 |
|
|
|
546,226 |
|
| Series E-1, 5.00%, 03/01/39 |
|
|
1,620 |
|
|
|
1,728,840 |
|
| Series F-1, 5.00%, 03/01/43 |
|
|
2,000 |
|
|
|
2,186,974 |
|
| Series F-1, 4.00%, 03/01/47 |
|
|
1,945 |
|
|
|
1,912,876 |
|
| Sub-Series D-1, 5.00%, 08/01/31 |
|
|
1,820 |
|
|
|
1,821,665 |
|
| Sub-Series E-1, 4.00%, 04/01/45 |
|
|
1,910 |
|
|
|
1,883,107 |
|
| Sub-Series F-1, 5.00%, 04/01/43 |
|
|
930 |
|
|
|
986,091 |
|
| City of New York, Refunding GO, Series B, 4.00%, 08/01/32 |
|
|
1,790 |
|
|
|
1,811,188 |
|
| County of Nassau New York, GO |
|
|
|
|
|
|
|
|
| Series B, (AGM), 5.00%, 07/01/45 |
|
|
1,000 |
|
|
|
1,047,793 |
|
| Series C, 5.00%, 10/01/29 |
|
|
500 |
|
|
|
548,966 |
|
| Series C, 5.00%, 10/01/31 |
|
|
1,420 |
|
|
|
1,559,255 |
|
| Erie County Industrial Development Agency, Refunding RB, Series A, (SAW), 5.00%, 05/01/28 |
|
|
565 |
|
|
|
590,607 |
|
| Hudson Yards Infrastructure Corp., Refunding RB, Series A, 4.00%, 02/15/43 |
|
|
2,095 |
|
|
|
2,082,830 |
|
| New York City Industrial Development Agency,
RB(c) |
|
|
|
|
|
|
|
|
| (AGC), 0.00%, 03/01/35 |
|
|
500 |
|
|
|
307,367 |
|
| (AGC), 0.00%, 03/01/39 |
|
|
1,000 |
|
|
|
473,132 |
|
|
|
|
|
|
|
|
|
|
| Security |
|
Par
(000) |
|
|
Value |
|
|
| County/City/Special District/School District (continued) |
|
| New York City Industrial Development Agency, RB(c)
(continued) |
|
|
|
|
|
|
|
|
| (AGC), 0.00%, 03/01/42 |
|
$ |
3,710 |
|
|
$ |
1,465,795 |
|
| (AGC), 0.00%, 03/01/45 |
|
|
2,000 |
|
|
|
657,498 |
|
| New York City Industrial Development Agency, Refunding RB, (AGM), 4.00%, 03/01/45 |
|
|
3,970 |
|
|
|
3,885,820 |
|
| New York City Transitional Finance Authority Future Tax Secured Revenue, RB |
|
|
|
|
|
|
|
|
| Series A-1, 5.00%, 08/01/40 |
|
|
1,900 |
|
|
|
2,028,729 |
|
| Series D-1, 5.00%, 02/01/32 |
|
|
5,000 |
|
|
|
5,042,740 |
|
| Series E-1, 4.00%, 02/01/49 |
|
|
1,880 |
|
|
|
1,820,342 |
|
| Sub-Series A-3, 4.00%, 08/01/43 |
|
|
1,035 |
|
|
|
1,024,056 |
|
| Sub-Series B-1, 5.00%, 11/01/35 |
|
|
425 |
|
|
|
431,917 |
|
| Sub-Series B-1, 5.00%, 11/01/36 |
|
|
340 |
|
|
|
344,993 |
|
| Sub-Series E-1, 5.00%, 02/01/39 |
|
|
1,015 |
|
|
|
1,066,791 |
|
| Sub-Series E-1, 5.00%, 02/01/43 |
|
|
3,600 |
|
|
|
3,756,010 |
|
| Subordinate, 4.00%, 05/01/39 |
|
|
2,045 |
|
|
|
2,057,524 |
|
| Series A, Subordinate, 4.00%, 05/01/53 |
|
|
1,050 |
|
|
|
1,014,418 |
|
| Series A-1, Subordinate, 5.00%, 08/01/41 |
|
|
1,000 |
|
|
|
1,104,455 |
|
| Series A-1, Subordinate, 4.00%, 08/01/48 |
|
|
2,000 |
|
|
|
1,953,492 |
|
| Series A-2, Subordinate, 5.00%, 08/01/38 |
|
|
605 |
|
|
|
640,499 |
|
| Series F-1, Subordinate, 4.00%, 02/01/51 |
|
|
1,500 |
|
|
|
1,442,236 |
|
| New York Convention Center Development Corp., RB,
CAB(c) |
|
|
|
|
|
|
|
|
| Series A, Senior Lien, 0.00%, 11/15/47 |
|
|
3,000 |
|
|
|
926,340 |
|
| Series B, Sub Lien, (AGM-CR), 0.00%, 11/15/55 |
|
|
4,000 |
|
|
|
764,644 |
|
| New York Convention Center Development Corp., Refunding RB |
|
|
|
|
|
|
|
|
| 5.00%, 11/15/40 |
|
|
5,755 |
|
|
|
5,894,173 |
|
| 5.00%, 11/15/45 |
|
|
7,290 |
|
|
|
7,429,924 |
|
| New York Liberty Development Corp., Refunding RB |
|
|
|
|
|
|
|
|
| 3.13%, 09/15/50 |
|
|
965 |
|
|
|
757,494 |
|
| Class 2, 5.38%, 11/15/40(a) |
|
|
680 |
|
|
|
682,532 |
|
| Series 1, 5.00%, 11/15/44(a) |
|
|
2,730 |
|
|
|
2,664,371 |
|
| Triborough Bridge & Tunnel Authority Sales Tax Revenue, RB |
|
|
|
|
|
|
|
|
| 4.00%, 05/15/52 |
|
|
6,500 |
|
|
|
6,343,298 |
|
| Series A, 4.00%, 05/15/48 |
|
|
3,110 |
|
|
|
3,072,456 |
|
| Series A, 5.25%, 05/15/52 |
|
|
1,035 |
|
|
|
1,148,009 |
|
| Series A, 4.13%, 05/15/53 |
|
|
1,315 |
|
|
|
1,295,712 |
|
| Series A, 5.00%, 05/15/53 |
|
|
2,630 |
|
|
|
2,868,888 |
|
| Series A, 5.25%, 05/15/57 |
|
|
360 |
|
|
|
398,375 |
|
| Series A, 4.50%, 05/15/63 |
|
|
5,000 |
|
|
|
5,101,180 |
|
| Trust for Cultural Resources of The City of New York, Refunding RB, 5.00%, 08/01/23(d) |
|
|
4,000 |
|
|
|
4,000,000 |
|
|
|
|
|
|
|
|
|
|
|
|
|
|
|
|
|
|
|
|
97,153,213 |
|
|
|
|
| Education — 19.7% |
|
|
|
|
|
|
| Albany Capital Resource Corp., Refunding RB |
|
|
|
|
|
|
|
|
| 4.00%, 07/01/41 |
|
|
595 |
|
|
|
374,942 |
|
| 4.00%, 07/01/51 |
|
|
615 |
|
|
|
341,493 |
|
| Amherst Development Corp., Refunding RB |
|
|
|
|
|
|
|
|
| 5.00%, 10/01/43 |
|
|
535 |
|
|
|
535,249 |
|
| 5.00%, 10/01/48 |
|
|
410 |
|
|
|
404,659 |
|
| Buffalo & Erie County Industrial Land Development Corp., Refunding RB,
Series A, 5.00%,
06/01/35 |
|
|
345 |
|
|
|
355,072 |
|
| Build NYC Resource Corp., RB(a) |
|
|
|
|
|
|
|
|
| 5.00%, 02/01/33 |
|
|
370 |
|
|
|
353,714 |
|
| 5.75%, 02/01/49 |
|
|
455 |
|
|
|
418,806 |
|
| 5.75%, 06/01/62 |
|
|
665 |
|
|
|
652,938 |
|
| Series A, 5.13%, 05/01/38 |
|
|
660 |
|
|
|
629,207 |
|
|
|
|
| S C H E D U L E
O F I N V E S T M E N T S |
|
51 |
|
|
|
| Schedule of Investments (continued)
July 31, 2023 |
|
BlackRock New York Municipal Income Trust (BNY)
(Percentages shown are based on Net Assets) |
|
|
|
|
|
|
|
|
|
| Security |
|
Par
(000) |
|
|
Value |
|
|
|
|
| Education (continued) |
|
|
|
|
|
|
| Build NYC Resource Corp., RB(a) (continued) |
|
|
|
|
|
|
|
|
| Series A, 5.50%, 05/01/48 |
|
$ |
270 |
|
|
$ |
255,852 |
|
| Build NYC Resource Corp., Refunding RB |
|
|
|
|
|
|
|
|
| 5.00%, 06/01/33 |
|
|
300 |
|
|
|
307,882 |
|
| 5.00%, 06/01/35 |
|
|
350 |
|
|
|
359,166 |
|
| 5.00%, 06/01/40 |
|
|
690 |
|
|
|
702,169 |
|
| 5.00%, 11/01/47 |
|
|
515 |
|
|
|
581,700 |
|
| Series A, 5.00%, 06/01/38 |
|
|
750 |
|
|
|
761,854 |
|
| County of Cattaraugus New York, RB |
|
|
|
|
|
|
|
|
| 5.00%, 05/01/34 |
|
|
170 |
|
|
|
171,086 |
|
| 5.00%, 05/01/39 |
|
|
125 |
|
|
|
125,377 |
|
| Dobbs Ferry Local Development Corp., RB |
|
|
|
|
|
|
|
|
| 5.00%, 07/01/39 |
|
|
1,000 |
|
|
|
1,018,066 |
|
| 5.00%, 07/01/44 |
|
|
500 |
|
|
|
504,757 |
|
| Dutchess County Local Development Corp., RB |
|
|
|
|
|
|
|
|
| 5.00%, 07/01/43 |
|
|
450 |
|
|
|
472,204 |
|
| 5.00%, 07/01/48 |
|
|
680 |
|
|
|
708,318 |
|
| 4.00%, 07/01/49 |
|
|
3,000 |
|
|
|
2,839,029 |
|
| Dutchess County Local Development Corp., Refunding RB |
|
|
|
|
|
|
|
|
| 5.00%, 07/01/42 |
|
|
755 |
|
|
|
791,670 |
|
| 4.00%, 07/01/46 |
|
|
1,430 |
|
|
|
1,420,355 |
|
| Geneva Development Corp., RB, 5.25%,
09/01/23(d) |
|
|
900 |
|
|
|
901,358 |
|
| Hempstead Town Local Development Corp., Refunding RB |
|
|
|
|
|
|
|
|
| 5.00%, 10/01/34 |
|
|
310 |
|
|
|
315,851 |
|
| 5.00%, 10/01/35 |
|
|
935 |
|
|
|
952,665 |
|
| 4.00%, 07/01/37 |
|
|
220 |
|
|
|
221,902 |
|
| 5.00%, 07/01/47 |
|
|
320 |
|
|
|
331,727 |
|
| Monroe County Industrial Development Corp., Refunding RB, Series A, 4.00%, 07/01/50 |
|
|
7,505 |
|
|
|
7,185,715 |
|
| New York State Dormitory Authority, RB |
|
|
|
|
|
|
|
|
| 1st Series, (AMBAC), 5.50%, 07/01/40 |
|
|
1,440 |
|
|
|
1,766,327 |
|
| Series A, 5.25%, 07/01/24(d) |
|
|
2,000 |
|
|
|
2,035,852 |
|
| Series A, 5.50%, 07/01/24(d) |
|
|
2,000 |
|
|
|
2,040,316 |
|
| Series A, 5.00%, 07/01/43 |
|
|
1,260 |
|
|
|
1,328,108 |
|
| New York State Dormitory Authority, Refunding RB |
|
|
|
|
|
|
|
|
| 5.00%, 07/01/44 |
|
|
2,130 |
|
|
|
2,150,180 |
|
| Series A, 5.00%, 07/01/24(d) |
|
|
500 |
|
|
|
507,847 |
|
| Series A, 5.00%, 07/01/35 |
|
|
3,445 |
|
|
|
3,566,509 |
|
| Series A, 5.00%, 07/01/37 |
|
|
835 |
|
|
|
863,651 |
|
| Series A, 5.00%, 07/01/38 |
|
|
255 |
|
|
|
268,850 |
|
| Series A, 5.00%, 07/01/43 |
|
|
2,960 |
|
|
|
3,016,471 |
|
| Series A, 4.00%, 07/01/47 |
|
|
1,285 |
|
|
|
1,164,559 |
|
| Onondaga County Trust for Cultural Resources, Refunding RB |
|
|
|
|
|
|
|
|
| 5.00%, 05/01/40 |
|
|
1,065 |
|
|
|
1,104,056 |
|
| 4.00%, 12/01/47 |
|
|
6,000 |
|
|
|
5,848,458 |
|
| Orange County Funding Corp., Refunding RB |
|
|
|
|
|
|
|
|
| Series A, 5.00%, 07/01/37 |
|
|
540 |
|
|
|
539,985 |
|
| Series A, 5.00%, 07/01/42 |
|
|
335 |
|
|
|
334,918 |
|
| Schenectady County Capital Resource Corp., Refunding RB |
|
|
|
|
|
|
|
|
| 5.00%, 07/01/32 |
|
|
415 |
|
|
|
484,571 |
|
| 5.25%, 07/01/52 |
|
|
715 |
|
|
|
785,545 |
|
| Troy Capital Resource Corp., Refunding RB |
|
|
|
|
|
|
|
|
| 4.00%, 08/01/35 |
|
|
890 |
|
|
|
898,321 |
|
| 5.00%, 09/01/36 |
|
|
1,850 |
|
|
|
2,018,960 |
|
|
|
|
|
|
|
|
|
|
| Security |
|
Par
(000) |
|
|
Value |
|
|
|
|
| Education (continued) |
|
|
|
|
|
|
| Trust for Cultural Resources of The City of New York, Refunding RB |
|
|
|
|
|
|
|
|
| Series A, 5.00%, 07/01/37 |
|
$ |
1,105 |
|
|
$ |
1,126,246 |
|
| Series A, 5.00%, 07/01/41 |
|
|
500 |
|
|
|
508,211 |
|
| Yonkers Economic Development Corp., RB,
Series A, 5.00%, 10/15/54 |
|
|
300 |
|
|
|
265,817 |
|
| Yonkers Economic Development Corp., Refunding RB |
|
|
|
|
|
|
|
|
| Series A, 5.00%, 10/15/40 |
|
|
70 |
|
|
|
66,513 |
|
| Series A, 5.00%, 10/15/50 |
|
|
115 |
|
|
|
103,437 |
|
|
|
|
|
|
|
|
|
|
|
|
|
|
|
|
|
|
|
|
57,788,491 |
|
|
|
|
| Health — 8.2% |
|
|
|
|
|
|
| Buffalo & Erie County Industrial Land Development Corp., RB, 5.25%, 07/01/35 |
|
|
335 |
|
|
|
296,054 |
|
| Build NYC Resource Corp., RB |
|
|
|
|
|
|
|
|
| Class A, 5.25%, 07/01/37 |
|
|
1,010 |
|
|
|
924,884 |
|
| Class A, 5.50%, 07/01/47 |
|
|
620 |
|
|
|
551,410 |
|
| Genesee County Funding Corp., Refunding RB, Series A, 5.25%, 12/01/52 |
|
|
680 |
|
|
|
705,025 |
|
| Huntington Local Development Corp., RB, Series A, 5.25%, 07/01/56 |
|
|
305 |
|
|
|
239,574 |
|
| Monroe County Industrial Development Corp., RB |
|
|
|
|
|
|
|
|
| 4.00%, 12/01/41 |
|
|
600 |
|
|
|
542,390 |
|
| 5.00%, 12/01/46 |
|
|
280 |
|
|
|
282,405 |
|
| Series A, 5.00%, 12/01/32 |
|
|
420 |
|
|
|
420,230 |
|
| Monroe County Industrial Development Corp., Refunding RB |
|
|
|
|
|
|
|
|
| 4.00%, 12/01/36 |
|
|
2,800 |
|
|
|
2,713,015 |
|
| 4.00%, 12/01/46 |
|
|
2,150 |
|
|
|
1,905,756 |
|
| New York State Dormitory Authority, RB, Series D, 4.25%, 05/01/39 |
|
|
1,000 |
|
|
|
999,877 |
|
| New York State Dormitory Authority, Refunding RB |
|
|
|
|
|
|
|
|
| 4.00%, 07/01/38 |
|
|
890 |
|
|
|
665,573 |
|
| 4.00%, 07/01/39 |
|
|
1,165 |
|
|
|
858,945 |
|
| 4.00%, 07/01/47 |
|
|
2,090 |
|
|
|
2,040,709 |
|
| 4.25%, 05/01/52 |
|
|
3,000 |
|
|
|
2,937,990 |
|
| 5.00%, 05/01/52 |
|
|
500 |
|
|
|
534,183 |
|
| Series A, 5.00%, 05/01/43 |
|
|
3,430 |
|
|
|
3,493,671 |
|
| Oneida County Local Development Corp., RB, Class A, (AGM), 4.00%, 12/01/46 |
|
|
1,100 |
|
|
|
1,041,997 |
|
| Oneida County Local Development Corp., Refunding RB, (AGM), 3.00%, 12/01/44 |
|
|
1,800 |
|
|
|
1,388,815 |
|
| Suffolk County Economic Development Corp., RB, Series C, 5.00%, 07/01/32 |
|
|
530 |
|
|
|
538,579 |
|
| Tompkins County Development Corp., Refunding RB, 5.00%, 07/01/44 |
|
|
110 |
|
|
|
103,093 |
|
| Westchester County Healthcare Corp., Refunding RB, Series B, Senior Lien, 6.00%, 11/01/30 |
|
|
85 |
|
|
|
85,078 |
|
| Westchester County Local Development Corp., Refunding
RB(a) |
|
|
|
|
|
|
|
|
| 5.00%, 07/01/41 |
|
|
410 |
|
|
|
345,602 |
|
| 5.00%, 07/01/56 |
|
|
465 |
|
|
|
359,192 |
|
|
|
|
|
|
|
|
|
|
|
|
|
|
|
|
|
|
|
|
23,974,047 |
|
|
|
|
| Housing — 4.8% |
|
|
|
|
|
|
| New York City Housing Development Corp., RB, M/F Housing |
|
|
|
|
|
|
|
|
| Series C-1A, 4.20%, 11/01/44 |
|
|
1,000 |
|
|
|
996,635 |
|
| Sustainability Bonds, 3.15%, 11/01/44 |
|
|
200 |
|
|
|
165,296 |
|
| Sustainability Bonds, 4.80%, 02/01/53 |
|
|
2,280 |
|
|
|
2,308,167 |
|
| Class F-1, Sustainability Bonds, 4.30%, 11/01/37 |
|
|
1,000 |
|
|
|
1,004,459 |
|
|
|
|
| 52 |
|
2 0 2 3 B L A C
K R O C K A N N U A L R E P O R
T T O S H A R E H O L D E R
S |
|
|
|
| Schedule of Investments (continued)
July 31, 2023 |
|
BlackRock New York Municipal Income Trust (BNY)
(Percentages shown are based on Net Assets) |
|
|
|
|
|
|
|
|
|
| Security |
|
Par
(000) |
|
|
Value |
|
|
|
|
| Housing (continued) |
|
|
|
|
|
|
| New York City Housing Development Corp., RB, M/F Housing (continued) |
|
|
|
|
|
|
|
|
| Series A, Sustainability Bonds, 4.75%, 11/01/48 |
|
$ |
280 |
|
|
$ |
283,914 |
|
| New York State Housing Finance Agency, RB, Series B-1, Sustainability Bonds, (SONYMA), 4.85%,
11/01/48 |
|
|
1,015 |
|
|
|
1,029,116 |
|
| New York State Housing Finance Agency, RB, M/F Housing |
|
|
|
|
|
|
|
|
| (SONYMA), 4.65%, 11/01/48 |
|
|
405 |
|
|
|
406,562 |
|
| Series B, (FHLMC, FNMA, GNMA, SONYMA), 4.00%, 11/01/42 |
|
|
110 |
|
|
|
100,793 |
|
| Series E, (FNMA, SONYMA), 4.15%, 11/01/47 |
|
|
1,485 |
|
|
|
1,345,262 |
|
| Series H, (FNMA, SONYMA), 4.25%, 11/01/51 |
|
|
1,000 |
|
|
|
910,910 |
|
| Series G, Sustainability Bonds, (SONYMA), 2.60%, 11/01/46 |
|
|
2,000 |
|
|
|
1,379,572 |
|
| State of New York Mortgage Agency, RB, S/F Housing |
|
|
|
|
|
|
|
|
| 250th Series, (SONYMA), 4.80%, 10/01/48 |
|
|
2,630 |
|
|
|
2,686,669 |
|
| Series 239, (SONYMA), 2.70%, 10/01/47 |
|
|
1,995 |
|
|
|
1,436,651 |
|
|
|
|
|
|
|
|
|
|
|
|
|
|
|
|
|
|
|
|
14,054,006 |
|
|
|
|
| State — 13.7% |
|
|
|
|
|
|
| New York City Transitional Finance Authority Building Aid Revenue, RB, Series S-1, Subordinate, (SAW), 4.00%,
07/15/45 |
|
|
1,500 |
|
|
|
1,493,788 |
|
| New York City Transitional Finance Authority Building Aid Revenue, Refunding RB |
|
|
|
|
|
|
|
|
| Series S-1A, (SAW), 4.00%, 07/15/39 |
|
|
250 |
|
|
|
255,796 |
|
| Series S-3, Subordinate, (SAW), 4.00%, 07/15/38 |
|
|
5,715 |
|
|
|
5,802,017 |
|
| New York State Dormitory Authority, RB |
|
|
|
|
|
|
|
|
| Series A, 5.00%, 03/15/36 |
|
|
1,905 |
|
|
|
2,022,165 |
|
| Series A, 5.00%, 03/15/39 |
|
|
760 |
|
|
|
811,897 |
|
| Series A, 4.00%, 03/15/47 |
|
|
2,350 |
|
|
|
2,306,226 |
|
| Series B, 5.00%, 03/15/38 |
|
|
560 |
|
|
|
591,954 |
|
| Series B, 5.00%, 03/15/39 |
|
|
960 |
|
|
|
1,012,340 |
|
| Series C, 4.00%, 03/15/45 |
|
|
1,225 |
|
|
|
1,227,509 |
|
| New York State Dormitory Authority, Refunding RB |
|
|
|
|
|
|
|
|
| Series A, 5.25%, 03/15/39 |
|
|
3,045 |
|
|
|
3,315,557 |
|
| Series A, 4.00%, 03/15/43 |
|
|
2,500 |
|
|
|
2,487,662 |
|
| Series A, 4.00%, 03/15/47 |
|
|
1,170 |
|
|
|
1,162,173 |
|
| Series C, 5.00%, 03/15/39 |
|
|
1,000 |
|
|
|
1,068,286 |
|
| Series E, 5.00%, 03/15/41 |
|
|
2,200 |
|
|
|
2,359,839 |
|
| New York State Urban Development Corp., RB |
|
|
|
|
|
|
|
|
| Series A, 4.00%, 03/15/45 |
|
|
1,470 |
|
|
|
1,455,040 |
|
| Series A, 4.00%, 03/15/49 |
|
|
2,720 |
|
|
|
2,638,770 |
|
| Series C, 5.00%, 03/15/30 |
|
|
1,885 |
|
|
|
1,886,842 |
|
| New York State Urban Development Corp., Refunding RB |
|
|
|
|
|
|
|
|
| 4.00%, 03/15/45 |
|
|
3,425 |
|
|
|
3,400,919 |
|
| 4.00%, 03/15/46 |
|
|
5,000 |
|
|
|
4,917,270 |
|
|
|
|
|
|
|
|
|
|
|
|
|
|
|
|
|
|
|
|
40,216,050 |
|
|
|
|
| Tobacco — 3.6% |
|
|
|
|
|
|
| Chautauqua Tobacco Asset Securitization Corp., Refunding RB |
|
|
|
|
|
|
|
|
| 4.75%, 06/01/39 |
|
|
400 |
|
|
|
384,708 |
|
| 5.00%, 06/01/48 |
|
|
550 |
|
|
|
516,718 |
|
| New York Counties Tobacco Trust IV, Refunding RB, Series A, 6.25%, 06/01/41(a) |
|
|
1,400 |
|
|
|
1,400,381 |
|
| New York Counties Tobacco Trust VI, Refunding RB |
|
|
|
|
|
|
|
|
| Series A-2B, 5.00%, 06/01/45 |
|
|
430 |
|
|
|
407,090 |
|
| Series A-2B, 5.00%, 06/01/51 |
|
|
2,340 |
|
|
|
2,190,184 |
|
|
|
|
|
|
|
|
|
|
| Security |
|
Par
(000) |
|
|
Value |
|
|
|
|
| Tobacco (continued) |
|
|
|
|
|
|
| New York Counties Tobacco Trust VI, Refunding RB (continued) |
|
|
|
|
|
|
|
|
| Series C, 4.00%, 06/01/51 |
|
$ |
2,250 |
|
|
$ |
1,779,106 |
|
| Niagara Tobacco Asset Securitization Corp., Refunding RB |
|
|
|
|
|
|
|
|
| 5.25%, 05/15/34 |
|
|
250 |
|
|
|
253,074 |
|
| 5.25%, 05/15/40 |
|
|
630 |
|
|
|
638,571 |
|
| TSASC, Inc., Refunding RB, Series A, 5.00%, 06/01/41 |
|
|
910 |
|
|
|
925,414 |
|
| Westchester Tobacco Asset Securitization Corp., Refunding RB |
|
|
|
|
|
|
|
|
| Sub-Series C, 4.00%, 06/01/42 |
|
|
910 |
|
|
|
894,770 |
|
| Sub-Series C, 5.13%, 06/01/51 |
|
|
1,225 |
|
|
|
1,231,468 |
|
|
|
|
|
|
|
|
|
|
|
|
|
|
|
|
|
|
|
|
10,621,484 |
|
|
|
|
| Transportation — 37.1% |
|
|
|
|
|
|
| Buffalo & Fort Erie Public Bridge Authority, RB, 5.00%, 01/01/47 |
|
|
1,015 |
|
|
|
1,048,450 |
|
| Hudson Yards Infrastructure Corp., Refunding RB, Series A, 5.00%, 02/15/39 |
|
|
2,440 |
|
|
|
2,559,162 |
|
| Metropolitan Transportation Authority, RB |
|
|
|
|
|
|
|
|
| Series A-1, 5.25%, 11/15/23(d) |
|
|
1,080 |
|
|
|
1,085,874 |
|
| Series A-1, 4.00%, 11/15/46 |
|
|
2,000 |
|
|
|
1,867,416 |
|
| Series D-3, 4.00%, 11/15/49 |
|
|
2,410 |
|
|
|
2,214,691 |
|
| Series E, 5.00%, 11/15/38 |
|
|
5,650 |
|
|
|
5,663,549 |
|
| Metropolitan Transportation Authority, Refunding RB |
|
|
|
|
|
|
|
|
| Series A, 4.00%, 11/15/43 |
|
|
1,130 |
|
|
|
1,127,073 |
|
| Series A, 4.00%, 11/15/51 |
|
|
8,335 |
|
|
|
8,108,771 |
|
| Series A-1, (AGM), 4.00%, 11/15/54 |
|
|
1,395 |
|
|
|
1,335,025 |
|
| Series A-1, 5.25%, 11/15/57 |
|
|
1,000 |
|
|
|
1,026,575 |
|
| Series B, 5.00%, 11/15/37 |
|
|
1,000 |
|
|
|
1,030,916 |
|
| Series D, 5.25%, 11/15/23(d) |
|
|
1,660 |
|
|
|
1,669,028 |
|
| Sub-Series B-1, 5.00%, 11/15/31 |
|
|
1,500 |
|
|
|
1,507,796 |
|
| Sub-Series B-2, 4.00%, 11/15/34 |
|
|
1,750 |
|
|
|
1,802,918 |
|
| Sub-Series C-1, 5.00%, 11/15/34 |
|
|
1,860 |
|
|
|
1,915,380 |
|
| MTA Hudson Rail Yards Trust Obligations, Refunding RB, Series A, 5.00%, 11/15/56 |
|
|
5,160 |
|
|
|
5,168,524 |
|
| New York City Industrial Development Agency, Refunding RB, Series A, AMT, 5.00%, 07/01/28 |
|
|
970 |
|
|
|
969,826 |
|
| New York Liberty Development Corp., Refunding RB, Series 1, 3.00%, 02/15/42 |
|
|
1,015 |
|
|
|
809,296 |
|
| New York State Thruway Authority, RB |
|
|
|
|
|
|
|
|
| Series A, Junior Lien, 5.00%, 01/01/41 |
|
|
365 |
|
|
|
376,288 |
|
| Series A, Junior Lien, 5.00%, 01/01/46 |
|
|
1,285 |
|
|
|
1,318,844 |
|
| New York State Thruway Authority, Refunding RB |
|
|
|
|
|
|
|
|
| Series A, 4.00%, 03/15/42 |
|
|
500 |
|
|
|
504,068 |
|
| Series K, 5.00%, 01/01/32 |
|
|
3,325 |
|
|
|
3,422,958 |
|
| Series L, 5.00%, 01/01/33 |
|
|
90 |
|
|
|
98,330 |
|
| Series L, 5.00%, 01/01/35 |
|
|
170 |
|
|
|
184,815 |
|
| Series O, 4.00%, 01/01/44 |
|
|
1,295 |
|
|
|
1,276,151 |
|
| Series B, Subordinate, 4.00%, 01/01/45 |
|
|
7,305 |
|
|
|
7,138,168 |
|
| Series B, Subordinate, 4.00%, 01/01/50 |
|
|
3,720 |
|
|
|
3,559,039 |
|
| New York Transportation Development Corp., ARB |
|
|
|
|
|
|
|
|
| AMT, 5.00%, 12/01/35 |
|
|
5,000 |
|
|
|
5,379,940 |
|
| AMT, 4.00%, 12/01/42 |
|
|
5,000 |
|
|
|
4,636,260 |
|
| Series A, AMT, (AGM-CR), 4.00%, 07/01/41 |
|
|
1,100 |
|
|
|
1,039,291 |
|
| Series A, AMT, 5.00%, 07/01/46 |
|
|
1,040 |
|
|
|
1,042,843 |
|
| Series A, AMT, 5.25%, 01/01/50 |
|
|
9,165 |
|
|
|
9,184,146 |
|
| New York Transportation Development Corp., RB, AMT, 4.00%, 10/31/46 |
|
|
2,000 |
|
|
|
1,763,876 |
|
|
|
|
| S C H E D U L E
O F I N V E S T M E N T S |
|
53 |
|
|
|
| Schedule of Investments (continued)
July 31, 2023 |
|
BlackRock New York Municipal Income Trust (BNY)
(Percentages shown are based on Net Assets) |
|
|
|
|
|
|
|
|
|
| Security |
|
Par
(000) |
|
|
Value |
|
|
|
|
| Transportation (continued) |
|
|
|
|
|
|
| Port Authority of New York & New Jersey, RB |
|
|
|
|
|
|
|
|
| 221st Series, AMT, 4.00%, 07/15/45 |
|
$ |
1,105 |
|
|
$ |
1,056,109 |
|
| Consolidated, 218th Series, AMT, 5.00%, 11/01/44 |
|
|
1,450 |
|
|
|
1,507,446 |
|
| Port Authority of New York & New Jersey, Refunding ARB |
|
|
|
|
|
|
|
|
| 179th Series, 5.00%, 12/01/38 |
|
|
820 |
|
|
|
825,247 |
|
| 194th Series, 5.25%, 10/15/55 |
|
|
2,930 |
|
|
|
3,018,082 |
|
| AMT, 5.00%, 01/15/52 |
|
|
2,795 |
|
|
|
2,938,149 |
|
| 177th Series, AMT, 4.00%, 01/15/43 |
|
|
1,120 |
|
|
|
1,069,879 |
|
| 178th Series, AMT, 5.00%, 12/01/43 |
|
|
930 |
|
|
|
932,518 |
|
| 195th Series, AMT, 5.00%, 04/01/36 |
|
|
750 |
|
|
|
784,280 |
|
| Series 178th, AMT, 5.00%, 12/01/33 |
|
|
750 |
|
|
|
752,746 |
|
| Series 231st, AMT, 5.50%, 08/01/47 |
|
|
3,000 |
|
|
|
3,279,903 |
|
| Series 238, AMT, 5.00%, 07/15/38 |
|
|
530 |
|
|
|
581,297 |
|
| Triborough Bridge & Tunnel Authority, RB |
|
|
|
|
|
|
|
|
| Series A, 5.00%, 11/15/54 |
|
|
3,545 |
|
|
|
3,764,641 |
|
| Series A, 4.00%, 11/15/56 |
|
|
1,555 |
|
|
|
1,474,467 |
|
| Triborough Bridge & Tunnel Authority, Refunding RB |
|
|
|
|
|
|
|
|
| Series A, 5.25%, 11/15/45 |
|
|
1,330 |
|
|
|
1,368,375 |
|
| Series A, 5.00%, 11/15/50 |
|
|
1,000 |
|
|
|
1,018,533 |
|
| Series B, 5.00%, 11/15/37 |
|
|
725 |
|
|
|
772,081 |
|
| Triborough Bridge & Tunnel Authority, Refunding RB, CAB, Series B, 0.00%, 11/15/32(c) |
|
|
2,335 |
|
|
|
1,755,161 |
|
|
|
|
|
|
|
|
|
|
|
|
|
|
|
|
|
|
|
|
108,734,201 |
|
|
|
|
| Utilities — 25.0% |
|
|
|
|
|
|
| Long Island Power Authority, RB |
|
|
|
|
|
|
|
|
| (AGM), 0.00%, 06/01/28(c) |
|
|
3,515 |
|
|
|
3,000,703 |
|
| 5.00%, 09/01/36 |
|
|
340 |
|
|
|
366,117 |
|
| 5.00%, 09/01/38 |
|
|
3,375 |
|
|
|
3,658,848 |
|
| 5.00%, 09/01/47 |
|
|
2,195 |
|
|
|
2,293,312 |
|
| Series C, (AGC), 5.25%, 09/01/29 |
|
|
4,000 |
|
|
|
4,543,352 |
|
| New York City Municipal Water Finance Authority, RB |
|
|
|
|
|
|
|
|
| Series AA-1, 5.25%, 06/15/52 |
|
|
5,000 |
|
|
|
5,584,975 |
|
| Series CC-1, 4.00%, 06/15/52 |
|
|
5,000 |
|
|
|
4,848,740 |
|
| Series FF-1, Subordinate, 4.00%, 06/15/49 |
|
|
9,535 |
|
|
|
9,304,777 |
|
| New York City Municipal Water Finance Authority, Refunding RB |
|
|
|
|
|
|
|
|
| Series BB-1, 4.00%, 06/15/45 |
|
|
1,250 |
|
|
|
1,231,643 |
|
| Series DD, 4.13%, 06/15/46 |
|
|
4,000 |
|
|
|
3,997,532 |
|
| Series DD, 4.13%, 06/15/47 |
|
|
2,630 |
|
|
|
2,633,995 |
|
| Series DD, 5.00%, 06/15/47 |
|
|
2,565 |
|
|
|
2,826,692 |
|
| Series GG, 5.00%, 06/15/39 |
|
|
690 |
|
|
|
715,292 |
|
| Series HH, 5.00%, 06/15/39 |
|
|
3,500 |
|
|
|
3,620,113 |
|
| New York Power Authority, RB, (AGM), 4.00%, 11/15/47 |
|
|
2,210 |
|
|
|
2,155,634 |
|
| New York Power Authority, Refunding RB |
|
|
|
|
|
|
|
|
| Series A, 4.00%, 11/15/50 |
|
|
2,000 |
|
|
|
1,949,522 |
|
| Series A, 4.00%, 11/15/55 |
|
|
8,925 |
|
|
|
8,668,406 |
|
| Series A, 4.00%, 11/15/60 |
|
|
585 |
|
|
|
558,718 |
|
| New York State Environmental Facilities Corp., RB, Series B, 5.00%, 09/15/40 |
|
|
635 |
|
|
|
659,482 |
|
| New York State Environmental Facilities Corp., Refunding RB, 5.00%, 06/15/51 |
|
|
3,715 |
|
|
|
4,065,993 |
|
| Rockland County Solid Waste Management Authority, RB, Series A, AMT, 4.00%, 12/15/46 |
|
|
990 |
|
|
|
912,448 |
|
|
|
|
|
|
|
|
|
|
| Security |
|
Par
(000) |
|
|
Value |
|
|
|
|
| Utilities (continued) |
|
|
|
|
|
|
| Utility Debt Securitization Authority, Refunding RB |
|
|
|
|
|
|
|
|
| Restructured, 5.00%, 12/15/44 |
|
$ |
2,000 |
|
|
$ |
2,257,294 |
|
| Series A, Restructured, 5.00%, 12/15/35 |
|
|
3,000 |
|
|
|
3,206,292 |
|
|
|
|
|
|
|
|
|
|
|
|
|
|
|
|
|
|
|
|
73,059,880 |
|
|
|
|
|
|
|
|
|
|
|
|
|
| Total Municipal Bonds in New York |
|
|
|
|
|
|
440,588,995 |
|
|
|
|
| Puerto Rico — 4.8% |
|
|
|
|
|
|
|
|
|
|
|
| State — 4.8% |
|
|
|
|
|
|
|
|
| Puerto Rico Sales Tax Financing Corp. Sales Tax Revenue, RB |
|
|
|
|
|
|
|
|
| Series A-1, Restructured, 4.75%, 07/01/53 |
|
|
2,089 |
|
|
|
1,973,865 |
|
| Series A-1, Restructured, 5.00%, 07/01/58 |
|
|
5,938 |
|
|
|
5,793,552 |
|
| Series A-2, Restructured, 4.78%, 07/01/58 |
|
|
1,544 |
|
|
|
1,452,787 |
|
| Series A-2, Restructured, 4.33%, 07/01/40 |
|
|
3,004 |
|
|
|
2,841,252 |
|
| Series B-1, Restructured, 4.75%, 07/01/53 |
|
|
130 |
|
|
|
122,806 |
|
| Series B-2, Restructured, 4.78%, 07/01/58 |
|
|
126 |
|
|
|
118,586 |
|
| Puerto Rico Sales Tax Financing Corp. Sales Tax Revenue, RB, CAB, Series A-1, Restructured, 0.00%, 07/01/46(c) |
|
|
5,916 |
|
|
|
1,667,821 |
|
|
|
|
|
|
|
|
|
|
|
|
|
| Total Municipal Bonds in Puerto Rico |
|
|
|
|
|
|
13,970,669 |
|
|
|
|
|
|
|
|
|
|
|
|
|
| Total Municipal Bonds — 155.6%
(Cost: $455,126,419) |
|
|
|
|
|
|
455,692,493 |
|
|
|
|
|
|
|
|
|
|
|
| Municipal Bonds Transferred to Tender Option Bond Trusts(e) |
|
|
|
|
| New York — 3.3% |
|
|
|
|
|
|
|
| County/City/Special District/School District — 0.8% |
|
| City of New York New York, GO, Sub-Series 1-I, 5.00%, 03/01/36 |
|
|
2,250 |
|
|
|
2,273,873 |
|
|
|
|
|
|
|
|
|
|
|
|
|
| Housing — 1.6% |
|
|
|
|
|
|
| New York City Housing Development Corp., Refunding RB, Series A, 4.25%, 11/01/43 |
|
|
4,891 |
|
|
|
4,777,488 |
|
|
|
|
|
|
|
|
|
|
|
|
|
| Transportation — 0.9% |
|
|
|
|
|
|
| Port Authority of New York & New Jersey, RB, AMT, Series 221, 4.00%, 07/15/55 |
|
|
2,860 |
|
|
|
2,641,347 |
|
|
|
|
|
|
|
|
|
|
|
|
|
| Total Municipal Bonds in New York |
|
|
|
|
|
|
9,692,708 |
|
|
|
|
|
|
|
|
|
|
| Total Municipal Bonds Transferred to Tender Option Bond Trusts — 3.3% |
|
|
|
|
|
| (Cost: $9,914,072) |
|
|
|
9,692,708 |
|
|
|
|
|
|
|
|
|
|
| Total Long-Term Investments — 158.9%
(Cost: $465,040,491) |
|
|
|
465,385,201 |
|
|
|
|
|
|
|
|
|
|
|
|
|
| 54 |
|
2 0 2 3 B L A C
K R O C K A N N U A L R E P O R
T T O S H A R E H O L D E R
S |
|
|
|
| Schedule of Investments (continued)
July 31, 2023 |
|
BlackRock New York Municipal Income Trust (BNY)
(Percentages shown are based on Net Assets) |
|
|
|
|
|
|
|
|
|
| Security |
|
Shares |
|
|
Value |
|
|
|
|
| Short-Term Securities |
|
|
|
|
|
|
|
|
|
|
|
| Money Market Funds — 3.4% |
|
|
|
|
|
|
| BlackRock Liquidity Funds New York Money Fund Portfolio,
3.74%(f)(g) |
|
|
10,042,561 |
|
|
$ |
10,042,561 |
|
|
|
|
|
|
|
|
|
|
|
|
|
| Total Short-Term Securities — 3.4%
(Cost: $10,042,561) |
|
|
|
|
|
|
10,042,561 |
|
|
|
|
|
|
|
|
|
|
|
|
|
| Total Investments — 162.3%
(Cost: $475,083,052) |
|
|
|
|
|
|
475,427,762 |
|
|
|
| Other Assets Less Liabilities — 0.5% |
|
|
|
1,639,528 |
|
|
|
| Liability for TOB Trust Certificates, Including Interest Expense and Fees Payable —
(1.7)% |
|
|
|
(5,036,926 |
) |
|
|
| VRDP Shares at Liquidation Value, Net of Deferred Offering Costs — (61.1)% |
|
|
|
(179,073,750 |
) |
|
|
|
|
|
|
|
|
| Net Assets Applicable to Common Shares — 100.0% |
|
|
$ |
292,956,614 |
|
|
|
|
|
|
|
|
|
|
| (a) |
Security exempt from registration pursuant to Rule 144A under the Securities Act of 1933, as amended. These securities
may be resold in transactions exempt from registration to qualified institutional investors. |
| (b) |
Variable rate security. Interest rate resets periodically. The rate shown is the effective interest rate as of period
end. Security description also includes the reference rate and spread if published and available. |
| (d) |
U.S. Government securities held in escrow, are used to pay interest on this security as well as to retire the bond in
full at the date indicated, typically at a premium to par. |
| (e) |
Represent bonds transferred to a TOB Trust in exchange of cash and residual certificates received by the Fund. These
bonds serve as collateral in a secured borrowing. See Note 4 of the Notes to Financial Statements for details. |
| (f) |
Affiliate of the Fund. |
| (g) |
Annualized 7-day yield as of period end.
|
For Fund compliance purposes, the Fund’s sector classifications refer to one or more of the sector
sub-classifications used by one or more widely recognized market indexes or rating group indexes, and/or as defined by the investment adviser. These definitions may not apply for purposes of this report, which may combine such sector
sub-classifications for reporting ease.
Affiliates
Investments in issuers considered to be affiliate(s) of the Fund during the year ended July 31, 2023 for purposes of Section 2(a)(3) of the
Investment Company Act of 1940, as amended, were as follows:
|
|
|
|
|
|
|
|
|
|
|
|
|
|
|
|
|
|
|
|
|
|
|
|
|
|
|
|
|
|
|
|
|
|
|
|
|
| |
|
|
|
|
|
|
|
|
|
| Affiliated Issuer |
|
Value at
07/31/22 |
|
|
Purchases
at Cost |
|
|
Proceeds
from Sales |
|
|
Net
Realized Gain (Loss) |
|
|
Change in
Unrealized Appreciation
(Depreciation) |
|
|
Value at
07/31/23 |
|
|
Shares
Held at 07/31/23 |
|
|
Income |
|
|
Capital Gain
Distributions from
Underlying Funds |
|
|
|
|
|
|
|
|
|
|
|
| BlackRock Liquidity Funds New York Money Fund Portfolio |
|
$ |
694,571 |
|
|
$ |
9,348,084 |
(a) |
|
$ |
— |
|
|
$ |
(94 |
) |
|
$ |
— |
|
|
$ |
10,042,561 |
|
|
|
10,042,561 |
|
|
$ |
177,712 |
|
|
$ |
— |
|
|
|
|
|
|
|
|
|
|
|
|
|
|
|
|
|
|
|
|
|
|
|
|
|
|
|
|
|
|
|
|
|
|
|
|
|
|
| |
(a) |
Represents net amount purchased (sold). |
|
Derivative Financial Instruments Outstanding as of Period End
Futures Contracts
|
|
|
|
|
|
|
|
|
|
|
|
|
|
|
|
|
| |
|
|
|
|
| Description |
|
Number of
Contracts |
|
|
Expiration
Date |
|
|
Notional
Amount (000) |
|
|
Value/
Unrealized Appreciation
(Depreciation) |
|
| Short Contracts |
|
|
|
|
|
|
|
|
|
|
|
|
|
|
|
|
| 10-Year U.S. Treasury Note |
|
|
33 |
|
|
|
09/20/23 |
|
|
$ |
3,678 |
|
|
$ |
(10,875 |
) |
| U.S. Long Bond |
|
|
43 |
|
|
|
09/20/23 |
|
|
|
5,359 |
|
|
|
(23,336 |
) |
| 5-Year U.S. Treasury Note |
|
|
33 |
|
|
|
09/29/23 |
|
|
|
3,527 |
|
|
|
(8,552 |
) |
|
|
|
|
|
|
|
|
|
|
|
|
|
|
|
|
|
|
|
|
|
|
|
|
|
|
|
|
|
|
|
$ |
(42,763 |
) |
|
|
|
|
|
|
|
|
|
|
|
|
|
|
|
|
|
|
|
|
| S C H E D U L E
O F I N V E S T M E N T S |
|
55 |
|
|
|
| Schedule of Investments (continued)
July 31, 2023 |
|
BlackRock New York Municipal Income Trust (BNY) |
Derivative Financial Instruments Categorized by Risk Exposure
As of period end, the fair values of derivative financial instruments located in the Statements of Assets and Liabilities were as follows:
|
|
|
|
|
|
|
|
|
|
|
|
|
|
|
|
|
|
|
|
|
|
|
|
|
|
|
|
|
| |
|
|
|
|
|
|
|
| |
|
Commodity
Contracts |
|
|
Credit
Contracts |
|
|
Equity
Contracts |
|
|
Foreign
Currency Exchange
Contracts |
|
|
Interest
Rate Contracts |
|
|
Other
Contracts |
|
|
Total |
|
| Liabilities — Derivative Financial Instruments |
|
|
|
|
|
|
|
|
|
|
|
|
|
|
|
|
|
|
|
|
|
|
|
|
|
|
|
|
| Futures contracts |
|
|
|
|
|
|
|
|
|
|
|
|
|
|
|
|
|
|
|
|
|
|
|
|
|
|
|
|
| Unrealized depreciation on futures contracts(a) |
|
$ |
— |
|
|
$ |
— |
|
|
$ |
— |
|
|
$ |
— |
|
|
$ |
42,763 |
|
|
$ |
— |
|
|
$ |
42,763 |
|
|
|
|
|
|
|
|
|
|
|
|
|
|
|
|
|
|
|
|
|
|
|
|
|
|
|
|
|
|
| |
(a) |
Net cumulative unrealized appreciation (depreciation) on futures contracts and centrally cleared swaps, if any, are
reported in the Schedule of Investments. In the Statements of Assets and Liabilities, only current day’s variation margin is reported in receivables or payables and the net cumulative unrealized appreciation (depreciation) is included in
accumulated earnings (loss). |
|
For the period ended July 31, 2023, the effect of derivative financial instruments in the Statements of
Operations was as follows:
|
|
|
|
|
|
|
|
|
|
|
|
|
|
|
|
|
|
|
|
|
|
|
|
|
|
|
|
|
| |
|
|
|
|
|
|
|
| |
|
Commodity
Contracts |
|
|
Credit
Contracts |
|
|
Equity
Contracts |
|
|
Foreign
Currency Exchange
Contracts |
|
|
Interest
Rate Contracts |
|
|
Other
Contracts |
|
|
Total |
|
| Net Realized Gain (Loss) from: |
|
|
|
|
|
|
|
|
|
|
|
|
|
|
|
|
|
|
|
|
|
|
|
|
|
|
|
|
| Futures contracts |
|
$ |
— |
|
|
$ |
— |
|
|
$ |
— |
|
|
$ |
— |
|
|
$ |
4,176,250 |
|
|
$ |
— |
|
|
$ |
4,176,250 |
|
|
|
|
|
|
|
|
|
|
|
|
|
|
|
|
|
|
|
|
|
|
|
|
|
|
|
|
|
|
| Net Change in Unrealized Appreciation (Depreciation) on: |
|
|
|
|
|
|
|
|
|
|
|
|
|
|
|
|
|
|
|
|
|
|
|
|
|
|
|
|
| Futures contracts |
|
$ |
— |
|
|
$ |
— |
|
|
$ |
— |
|
|
$ |
— |
|
|
$ |
1,742,797 |
|
|
$ |
— |
|
|
$ |
1,742,797 |
|
|
|
|
|
|
|
|
|
|
|
|
|
|
|
|
|
|
|
|
|
|
|
|
|
|
|
|
|
|
Average Quarterly Balances of Outstanding Derivative Financial Instruments
|
|
|
|
|
| Futures contracts: |
|
|
|
|
| Average notional value of contracts — short |
|
$ |
41,435,791 |
|
For more information about the Fund’s investment risks regarding derivative financial instruments, refer to the Notes
to Financial Statements.
Fair Value Hierarchy as of Period End
Various inputs are used in determining the fair value of financial instruments. For a description of the input levels and information about the
Fund’s policy regarding valuation of financial instruments, refer to the Notes to Financial Statements.
The following table summarizes the
Fund’s financial instruments categorized in the fair value hierarchy. The breakdown of the Fund’s financial instruments into major categories is disclosed in the Schedule of Investments above.
|
|
|
|
|
|
|
|
|
|
|
|
|
|
|
|
|
| |
|
|
|
|
| |
|
Level 1 |
|
|
Level 2 |
|
|
Level 3 |
|
|
Total |
|
| Assets |
|
|
|
|
|
|
|
|
|
|
|
|
|
|
|
|
| Investments |
|
|
|
|
|
|
|
|
|
|
|
|
|
|
|
|
| Long-Term Investments |
|
|
|
|
|
|
|
|
|
|
|
|
|
|
|
|
| Municipal Bonds |
|
$ |
— |
|
|
$ |
455,692,493 |
|
|
$ |
— |
|
|
$ |
455,692,493 |
|
| Municipal Bonds Transferred to Tender Option Bond Trusts |
|
|
— |
|
|
|
9,692,708 |
|
|
|
— |
|
|
|
9,692,708 |
|
| Short-Term Securities |
|
|
|
|
|
|
|
|
|
|
|
|
|
|
|
|
| Money Market Funds |
|
|
10,042,561 |
|
|
|
— |
|
|
|
— |
|
|
|
10,042,561 |
|
|
|
|
|
|
|
|
|
|
|
|
|
|
|
|
|
|
|
|
|
|
|
|
|
$ |
10,042,561 |
|
|
$ |
465,385,201 |
|
|
$ |
— |
|
|
$ |
475,427,762 |
|
|
|
|
|
|
|
|
|
|
|
|
|
|
|
|
|
|
| Derivative Financial Instruments(a) |
|
|
|
|
|
|
|
|
|
|
|
|
|
|
|
|
| Liabilities |
|
|
|
|
|
|
|
|
|
|
|
|
|
|
|
|
| Interest Rate Contracts |
|
$ |
(42,763 |
) |
|
$ |
— |
|
|
$ |
— |
|
|
$ |
(42,763 |
) |
|
|
|
|
|
|
|
|
|
|
|
|
|
|
|
|
|
| |
(a) |
Derivative financial instruments are futures contracts. Futures contracts are valued at the unrealized appreciation
(depreciation) on the instrument. |
|
|
|
|
| 56 |
|
2 0 2 3 B L A C
K R O C K A N N U A L R E P O R
T T O S H A R E H O L D E R
S |
|
|
|
| Schedule of Investments (continued)
July 31, 2023 |
|
BlackRock New York Municipal Income Trust (BNY) |
The Fund may hold assets and/or liabilities in which the fair value approximates
the carrying amount for financial statement purposes. As of period end, such assets and/or liabilities are categorized within the fair value hierarchy as follows:
|
|
|
|
|
|
|
|
|
|
|
|
|
|
|
|
|
| |
|
|
|
|
| |
|
Level 1 |
|
|
Level 2 |
|
|
Level 3 |
|
|
Total |
|
| Liabilities |
|
|
|
|
|
|
|
|
|
|
|
|
|
|
|
|
| TOB Trust Certificates |
|
$ |
— |
|
|
$ |
(4,998,266 |
) |
|
$ |
— |
|
|
$ |
(4,998,266 |
) |
| VRDP Shares at Liquidation Value |
|
|
— |
|
|
|
(179,400,000 |
) |
|
|
— |
|
|
|
(179,400,000 |
) |
|
|
|
|
|
|
|
|
|
|
|
|
|
|
|
|
|
|
|
|
|
|
|
|
$ |
— |
|
|
$ |
(184,398,266 |
) |
|
$ |
— |
|
|
$ |
(184,398,266 |
) |
|
|
|
|
|
|
|
|
|
|
|
|
|
|
|
|
|
See notes to financial statements.
|
|
|
| S C H E D U L E
O F I N V E S T M E N T S |
|
57 |
Statements of Assets and Liabilities
July 31, 2023
|
|
|
|
|
|
|
|
|
|
|
|
|
|
|
|
|
| |
|
MUJ |
|
|
MIY |
|
|
MYN |
|
|
MPA |
|
| |
|
|
|
|
|
| ASSETS |
|
|
|
|
|
|
|
|
|
|
|
|
|
| Investments, at value — unaffiliated(a) |
|
$ |
1,026,798,705 |
|
|
$ |
592,064,816 |
|
|
$ |
702,888,048 |
|
|
$ |
247,631,426 |
|
| Investments, at value — affiliated(b) |
|
|
104,186,840 |
|
|
|
18,024,108 |
|
|
|
11,465,077 |
|
|
|
17,292,797 |
|
| Cash pledged for futures contracts |
|
|
— |
|
|
|
— |
|
|
|
415,000 |
|
|
|
— |
|
| Receivables: |
|
|
|
|
|
|
|
|
|
|
|
|
|
|
|
|
| Investments sold |
|
|
719,751 |
|
|
|
— |
|
|
|
— |
|
|
|
— |
|
| Dividends — affiliated |
|
|
238,752 |
|
|
|
22,945 |
|
|
|
36,324 |
|
|
|
39,499 |
|
| Interest — unaffiliated |
|
|
7,573,426 |
|
|
|
6,482,354 |
|
|
|
7,066,337 |
|
|
|
2,229,282 |
|
| Prepaid expenses |
|
|
56,432 |
|
|
|
109,843 |
|
|
|
214,555 |
|
|
|
84,019 |
|
|
|
|
|
|
|
|
|
|
|
|
|
|
|
|
|
|
|
|
|
|
|
| Total assets |
|
|
1,139,573,906 |
|
|
|
616,704,066 |
|
|
|
722,085,341 |
|
|
|
267,277,023 |
|
|
|
|
|
|
|
|
|
|
|
|
|
|
|
|
|
|
|
|
|
|
|
| ACCRUED LIABILITIES |
|
|
|
|
|
|
|
|
|
|
|
|
|
|
|
|
| Bank overdraft |
|
|
107,442 |
|
|
|
51,064 |
|
|
|
76,138 |
|
|
|
19,518 |
|
| Payables: |
|
|
|
|
|
|
|
|
|
|
|
|
|
|
|
|
| Investments purchased |
|
|
— |
|
|
|
— |
|
|
|
1,086,080 |
|
|
|
— |
|
| Accounting services fees |
|
|
60,324 |
|
|
|
40,458 |
|
|
|
44,504 |
|
|
|
22,074 |
|
| Capital shares redeemed |
|
|
192,100 |
|
|
|
93,831 |
|
|
|
132,987 |
|
|
|
25,541 |
|
| Custodian fees |
|
|
5,414 |
|
|
|
3,485 |
|
|
|
3,726 |
|
|
|
1,915 |
|
| Income dividend distributions — Common Shares |
|
|
174,365 |
|
|
|
52,629 |
|
|
|
97,901 |
|
|
|
22,461 |
|
| Interest expense and fees |
|
|
149,668 |
|
|
|
64,525 |
|
|
|
234,049 |
|
|
|
93,737 |
|
| Investment advisory fees |
|
|
475,360 |
|
|
|
255,923 |
|
|
|
305,289 |
|
|
|
109,905 |
|
| Directors’ and Officer’s fees |
|
|
38,241 |
|
|
|
2,183 |
|
|
|
283,912 |
|
|
|
11,363 |
|
| Other accrued expenses |
|
|
16,725 |
|
|
|
6,743 |
|
|
|
5,320 |
|
|
|
5,164 |
|
| Professional fees |
|
|
69,107 |
|
|
|
57,302 |
|
|
|
72,480 |
|
|
|
49,167 |
|
| Transfer agent fees |
|
|
20,595 |
|
|
|
15,965 |
|
|
|
16,607 |
|
|
|
15,098 |
|
| Variation margin on futures contracts |
|
|
— |
|
|
|
— |
|
|
|
35,998 |
|
|
|
— |
|
|
|
|
|
|
|
|
|
|
|
|
|
|
|
|
|
|
|
|
|
|
|
| Total accrued liabilities |
|
|
1,309,341 |
|
|
|
644,108 |
|
|
|
2,394,991 |
|
|
|
375,943 |
|
|
|
|
|
|
|
|
|
|
|
|
|
|
|
|
|
|
|
|
|
|
|
| OTHER LIABILITIES |
|
|
|
|
|
|
|
|
|
|
|
|
|
|
|
|
| TOB Trust Certificates |
|
|
22,059,998 |
|
|
|
6,333,877 |
|
|
|
19,231,092 |
|
|
|
14,060,000 |
|
| VRDP Shares, at liquidation value of $100,000 per share, net of deferred offering costs(c)(d)(e) |
|
|
416,356,885 |
|
|
|
231,553,356 |
|
|
|
247,479,449 |
|
|
|
82,374,060 |
|
|
|
|
|
|
|
|
|
|
|
|
|
|
|
|
|
|
|
|
|
|
|
| Total other liabilities |
|
|
438,416,883 |
|
|
|
237,887,233 |
|
|
|
266,710,541 |
|
|
|
96,434,060 |
|
|
|
|
|
|
|
|
|
|
|
|
|
|
|
|
|
|
|
|
|
|
|
| Total liabilities |
|
|
439,726,224 |
|
|
|
238,531,341 |
|
|
|
269,105,532 |
|
|
|
96,810,003 |
|
|
|
|
|
|
|
|
|
|
|
|
|
|
|
|
|
|
|
|
|
|
|
| Commitments and contingent liabilities |
|
|
|
|
|
|
|
|
|
|
|
|
|
|
|
|
| NET ASSETS APPLICABLE TO COMMON SHAREHOLDERS |
|
$ |
699,847,682 |
|
|
$ |
378,172,725 |
|
|
$ |
452,979,809 |
|
|
$ |
170,467,020 |
|
|
|
|
|
|
|
|
|
|
|
|
|
|
|
|
|
|
|
|
|
|
|
| NET ASSETS APPLICABLE TO COMMON SHAREHOLDERS CONSIST OF |
|
|
|
|
|
|
|
|
|
|
|
|
|
|
|
|
| Paid-in capital(f)(g)(h) |
|
$ |
754,871,465 |
|
|
$ |
413,410,031 |
|
|
$ |
512,358,984 |
|
|
$ |
189,847,831 |
|
| Accumulated loss |
|
|
(55,023,783 |
) |
|
|
(35,237,306 |
) |
|
|
(59,379,175 |
) |
|
|
(19,380,811 |
) |
|
|
|
|
|
|
|
|
|
|
|
|
|
|
|
|
|
|
|
|
|
|
| NET ASSETS APPLICABLE TO COMMON SHAREHOLDERS |
|
$ |
699,847,682 |
|
|
$ |
378,172,725 |
|
|
$ |
452,979,809 |
|
|
$ |
170,467,020 |
|
|
|
|
|
|
|
|
|
|
|
|
|
|
|
|
|
|
|
|
|
|
|
| Net asset value per Common Share |
|
$ |
13.03 |
|
|
$ |
12.94 |
|
|
$ |
11.70 |
|
|
$ |
13.09 |
|
|
|
|
|
|
|
|
|
|
|
|
|
|
|
|
|
|
|
|
|
|
|
| (a) Investments, at cost —
unaffiliated |
|
$ |
1,035,079,611 |
|
|
$ |
592,940,831 |
|
|
$ |
700,536,361 |
|
|
$ |
252,515,692 |
|
| (b) Investments, at cost —
affiliated |
|
$ |
104,179,148 |
|
|
$ |
18,024,699 |
|
|
$ |
11,465,077 |
|
|
$ |
17,291,247 |
|
| (c) Preferred Shares outstanding |
|
|
4,171 |
|
|
|
2,319 |
|
|
|
2,477 |
|
|
|
826 |
|
| (d) Preferred Shares authorized |
|
|
12,291 |
|
|
|
8,919 |
|
|
|
14,637 |
|
|
|
1,000,000 |
|
| (e) Par value per Preferred Share |
|
$ |
0.10 |
|
|
$ |
0.10 |
|
|
$ |
0.10 |
|
|
$ |
0.05 |
|
| (f) Common Shares outstanding |
|
|
53,692,147 |
|
|
|
29,232,196 |
|
|
|
38,721,746 |
|
|
|
13,024,822 |
|
| (g) Common Shares authorized |
|
|
199,987,709 |
|
|
|
199,991,081 |
|
|
|
199,985,363 |
|
|
|
Unlimited |
|
| (h) Par value per Common Share |
|
$ |
0.10 |
|
|
$ |
0.10 |
|
|
$ |
0.10 |
|
|
$ |
0.10 |
|
See notes to financial statements.
|
|
|
| 58 |
|
2 0 2 3 B L A C
K R O C K A N N U A L R E P O R
T T O S H A R E H O L D E R
S |
Statements of Assets and Liabilities (continued)
July 31, 2023
|
|
|
|
|
|
|
|
|
| |
|
MYI |
|
|
BNY |
|
| |
|
|
|
| ASSETS |
|
|
|
|
|
| Investments, at value — unaffiliated(a) |
|
$ |
1,351,143,553 |
|
|
$ |
465,385,201 |
|
| Investments, at value — affiliated(b) |
|
|
9,536,835 |
|
|
|
10,042,561 |
|
| Cash pledged for futures contracts |
|
|
— |
|
|
|
281,000 |
|
| Receivables: |
|
|
|
|
|
|
|
|
| Investments sold |
|
|
561,265 |
|
|
|
— |
|
| Dividends — affiliated |
|
|
38,451 |
|
|
|
29,251 |
|
| Interest — unaffiliated |
|
|
13,917,758 |
|
|
|
4,737,189 |
|
| Prepaid expenses |
|
|
291,071 |
|
|
|
61,736 |
|
|
|
|
|
|
|
|
|
|
|
|
|
| Total assets |
|
|
1,375,488,933 |
|
|
|
480,536,938 |
|
|
|
|
|
|
|
|
|
|
|
|
|
| ACCRUED LIABILITIES |
|
|
|
|
|
|
|
|
| Bank overdraft |
|
|
170,887 |
|
|
|
41,876 |
|
| Payables: |
|
|
|
|
|
|
|
|
| Investments purchased |
|
|
2,864,703 |
|
|
|
2,892,220 |
|
| Accounting services fees |
|
|
68,009 |
|
|
|
32,611 |
|
| Capital shares redeemed |
|
|
320,922 |
|
|
|
74,748 |
|
| Custodian fees |
|
|
6,102 |
|
|
|
2,792 |
|
| Income dividend distributions — Common Shares |
|
|
153,664 |
|
|
|
44,931 |
|
| Interest expense and fees |
|
|
1,371,369 |
|
|
|
38,660 |
|
| Investment advisory fees |
|
|
580,036 |
|
|
|
222,442 |
|
| Directors’ and Officer’s fees |
|
|
493,840 |
|
|
|
59,516 |
|
| Other accrued expenses |
|
|
8,516 |
|
|
|
8,979 |
|
| Professional fees |
|
|
116,415 |
|
|
|
51,985 |
|
| Transfer agent fees |
|
|
33,265 |
|
|
|
13,173 |
|
| Variation margin on futures contracts |
|
|
— |
|
|
|
24,375 |
|
|
|
|
|
|
|
|
|
|
|
|
|
| Total accrued liabilities |
|
|
6,187,728 |
|
|
|
3,508,308 |
|
|
|
|
|
|
|
|
|
|
|
|
|
| OTHER LIABILITIES |
|
|
|
|
|
|
|
|
| TOB Trust Certificates |
|
|
168,574,218 |
|
|
|
4,998,266 |
|
| VRDP Shares, at liquidation value of $100,000 per share, net of deferred offering costs(c)(d)(e) |
|
|
356,123,124 |
|
|
|
179,073,750 |
|
|
|
|
|
|
|
|
|
|
|
|
|
| Total other liabilities |
|
|
524,697,342 |
|
|
|
184,072,016 |
|
|
|
|
|
|
|
|
|
|
|
|
|
| Total liabilities |
|
|
530,885,070 |
|
|
|
187,580,324 |
|
|
|
|
|
|
|
|
|
|
|
|
|
| Commitments and contingent liabilities |
|
|
|
|
|
|
|
|
| NET ASSETS APPLICABLE TO COMMON SHAREHOLDERS |
|
$ |
844,603,863 |
|
|
$ |
292,956,614 |
|
|
|
|
|
|
|
|
|
|
|
|
|
| NET ASSETS APPLICABLE TO COMMON SHAREHOLDERS CONSIST OF |
|
|
|
|
|
|
|
|
| Paid-in capital(f)(g)(h) |
|
$ |
877,884,032 |
|
|
$ |
331,915,121 |
|
| Accumulated loss |
|
|
(33,280,169 |
) |
|
|
(38,958,507 |
) |
|
|
|
|
|
|
|
|
|
|
|
|
| NET ASSETS APPLICABLE TO COMMON SHAREHOLDERS |
|
$ |
844,603,863 |
|
|
$ |
292,956,614 |
|
|
|
|
|
|
|
|
|
|
|
|
|
| Net asset value per Common Share |
|
$ |
12.51 |
|
|
$ |
12.05 |
|
|
|
|
|
|
|
|
|
|
|
|
|
| (a) Investments, at cost —
unaffiliated |
|
$ |
1,319,643,187 |
|
|
$ |
465,040,491 |
|
| (b) Investments, at cost —
affiliated |
|
$ |
9,536,566 |
|
|
$ |
10,042,561 |
|
| (c) Preferred Shares
outstanding |
|
|
3,564 |
|
|
|
1,794 |
|
| (d) Preferred Shares
authorized |
|
|
26,364 |
|
|
|
Unlimited |
|
| (e) Par value per Preferred
Share |
|
$ |
0.10 |
|
|
$ |
0.001 |
|
| (f) Common Shares
outstanding |
|
|
67,505,760 |
|
|
|
24,318,174 |
|
| (g) Common Shares
authorized |
|
|
199,973,636 |
|
|
|
Unlimited |
|
| (h) Par value per Common
Share |
|
$ |
0.10 |
|
|
$ |
0.001 |
|
See notes to financial statements.
|
|
|
| F I N A N C I A
L S T A T E M E N T S |
|
59 |
Statements of Operations
Year Ended July 31, 2023
|
|
|
|
|
|
|
|
|
|
|
|
|
|
|
|
|
| |
|
MUJ |
|
|
MIY |
|
|
MYN |
|
|
MPA |
|
| |
|
|
|
|
|
|
| INVESTMENT INCOME |
|
|
|
|
|
|
|
|
|
|
|
|
|
|
|
|
| Dividends — affiliated |
|
$ |
1,412,567 |
|
|
$ |
187,208 |
|
|
$ |
163,390 |
|
|
$ |
310,090 |
|
| Interest — unaffiliated |
|
|
46,589,025 |
|
|
|
24,593,635 |
|
|
|
29,094,983 |
|
|
|
10,184,584 |
|
|
|
|
|
|
|
|
|
|
|
|
|
|
|
|
|
|
|
|
|
|
|
| Total investment income |
|
|
48,001,592 |
|
|
|
24,780,843 |
|
|
|
29,258,373 |
|
|
|
10,494,674 |
|
|
|
|
|
|
|
|
|
|
|
|
|
|
|
|
|
|
|
|
|
|
|
| EXPENSES |
|
|
|
|
|
|
|
|
|
|
|
|
|
|
|
|
| Investment advisory |
|
|
5,736,793 |
|
|
|
3,070,712 |
|
|
|
3,637,562 |
|
|
|
1,331,587 |
|
| Accounting services |
|
|
135,826 |
|
|
|
94,300 |
|
|
|
102,591 |
|
|
|
51,376 |
|
| Professional |
|
|
102,619 |
|
|
|
86,584 |
|
|
|
86,058 |
|
|
|
107,297 |
|
| Transfer agent |
|
|
55,280 |
|
|
|
38,615 |
|
|
|
42,051 |
|
|
|
44,586 |
|
| Directors and Officer |
|
|
43,873 |
|
|
|
20,281 |
|
|
|
34,398 |
|
|
|
10,411 |
|
| Liquidity fees |
|
|
42,482 |
|
|
|
— |
|
|
|
— |
|
|
|
— |
|
| Remarketing fees on Preferred Shares |
|
|
41,710 |
|
|
|
— |
|
|
|
— |
|
|
|
— |
|
| Registration |
|
|
18,708 |
|
|
|
9,951 |
|
|
|
13,363 |
|
|
|
8,234 |
|
| Printing and postage |
|
|
18,339 |
|
|
|
9,568 |
|
|
|
10,006 |
|
|
|
14,240 |
|
| Custodian |
|
|
12,304 |
|
|
|
15,593 |
|
|
|
17,001 |
|
|
|
5,540 |
|
| Miscellaneous |
|
|
93,466 |
|
|
|
75,188 |
|
|
|
75,649 |
|
|
|
69,386 |
|
|
|
|
|
|
|
|
|
|
|
|
|
|
|
|
|
|
|
|
|
|
|
| Total expenses excluding interest expense, fees and amortization of offering costs |
|
|
6,301,400 |
|
|
|
3,420,792 |
|
|
|
4,018,679 |
|
|
|
1,642,657 |
|
| Interest expense, fees and amortization of offering
costs(a) |
|
|
15,865,364 |
|
|
|
8,892,605 |
|
|
|
9,821,565 |
|
|
|
3,545,462 |
|
|
|
|
|
|
|
|
|
|
|
|
|
|
|
|
|
|
|
|
|
|
|
| Total expenses |
|
|
22,166,764 |
|
|
|
12,313,397 |
|
|
|
13,840,244 |
|
|
|
5,188,119 |
|
| Less: |
|
|
|
|
|
|
|
|
|
|
|
|
|
|
|
|
| Fees waived and/or reimbursed by the Manager |
|
|
(53,302 |
) |
|
|
(6,993 |
) |
|
|
(3,033 |
) |
|
|
(11,397 |
) |
|
|
|
|
|
|
|
|
|
|
|
|
|
|
|
|
|
|
|
|
|
|
| Total expenses after fees waived and/or reimbursed |
|
|
22,113,462 |
|
|
|
12,306,404 |
|
|
|
13,837,211 |
|
|
|
5,176,722 |
|
|
|
|
|
|
|
|
|
|
|
|
|
|
|
|
|
|
|
|
|
|
|
| Net investment income |
|
|
25,888,130 |
|
|
|
12,474,439 |
|
|
|
15,421,162 |
|
|
|
5,317,952 |
|
|
|
|
|
|
|
|
|
|
|
|
|
|
|
|
|
|
|
|
|
|
|
| REALIZED AND UNREALIZED GAIN (LOSS) |
|
|
|
|
|
|
|
|
|
|
|
|
|
|
|
|
| Net realized gain (loss) from: |
|
|
|
|
|
|
|
|
|
|
|
|
|
|
|
|
| Investments — unaffiliated |
|
|
(29,744,004 |
) |
|
|
(22,696,457 |
) |
|
|
(35,178,509 |
) |
|
|
(11,241,154 |
) |
| Investments — affiliated |
|
|
(4,972 |
) |
|
|
2,364 |
|
|
|
(124 |
) |
|
|
(3,140 |
) |
| Futures contracts |
|
|
5,923,092 |
|
|
|
(790,254 |
) |
|
|
3,129,978 |
|
|
|
2,042,572 |
|
|
|
|
|
|
|
|
|
|
|
|
|
|
|
|
|
|
|
|
|
|
|
|
|
|
(23,825,884 |
) |
|
|
(23,484,347 |
) |
|
|
(32,048,655 |
) |
|
|
(9,201,722 |
) |
|
|
|
|
|
|
|
|
|
|
|
|
|
|
|
|
|
| Net change in unrealized appreciation (depreciation) on: |
|
|
|
|
|
|
|
|
|
|
|
|
|
|
|
|
| Investments — unaffiliated |
|
|
(5,585,622 |
) |
|
|
6,666,217 |
|
|
|
11,808,528 |
|
|
|
(1,920,463 |
) |
| Investments — affiliated |
|
|
(2,491 |
) |
|
|
(686 |
) |
|
|
— |
|
|
|
637 |
|
| Futures contracts |
|
|
1,481,240 |
|
|
|
— |
|
|
|
2,842,177 |
|
|
|
420,844 |
|
|
|
|
|
|
|
|
|
|
|
|
|
|
|
|
|
|
|
|
|
|
|
|
|
|
(4,106,873 |
) |
|
|
6,665,531 |
|
|
|
14,650,705 |
|
|
|
(1,498,982 |
) |
|
|
|
|
|
|
|
|
|
|
|
|
|
|
|
|
|
|
|
|
|
|
| Net realized and unrealized loss |
|
|
(27,932,757 |
) |
|
|
(16,818,816 |
) |
|
|
(17,397,950 |
) |
|
|
(10,700,704 |
) |
|
|
|
|
|
|
|
|
|
|
|
|
|
|
|
|
|
|
|
|
|
|
| NET DECREASE IN NET ASSETS APPLICABLE TO COMMON SHAREHOLDERS RESULTING FROM OPERATIONS |
|
$ |
(2,044,627 |
) |
|
$ |
(4,344,377 |
) |
|
$ |
(1,976,788 |
) |
|
$ |
(5,382,752 |
) |
|
|
|
|
|
|
|
|
|
|
|
|
|
|
|
|
|
| (a) |
Related to TOB Trusts and/or VRDP Shares. |
See notes to financial statements.
|
|
|
| 60 |
|
2 0 2 3 B L A C
K R O C K A N N U A L R E P O R
T T O S H A R E H O L D E R
S |
Statements of Operations (continued)
Year Ended July 31, 2023
|
|
|
|
|
|
|
|
|
| |
|
MYI |
|
|
BNY |
|
| |
|
|
|
|
| INVESTMENT INCOME |
|
|
|
|
|
|
|
|
| Dividends — affiliated |
|
$ |
362,203 |
|
|
$ |
177,712 |
|
| Interest — unaffiliated |
|
|
58,041,879 |
|
|
|
19,409,720 |
|
|
|
|
|
|
|
|
|
|
|
|
|
| Total investment income |
|
|
58,404,082 |
|
|
|
19,587,432 |
|
|
|
|
|
|
|
|
|
|
|
|
|
| EXPENSES |
|
|
|
|
|
|
|
|
| Investment advisory |
|
|
6,950,251 |
|
|
|
2,665,793 |
|
| Accounting services |
|
|
158,417 |
|
|
|
75,695 |
|
| Professional |
|
|
110,307 |
|
|
|
82,058 |
|
| Transfer agent |
|
|
63,865 |
|
|
|
27,453 |
|
| Directors and Officer |
|
|
61,760 |
|
|
|
18,157 |
|
| Registration |
|
|
23,006 |
|
|
|
19,105 |
|
| Custodian |
|
|
16,487 |
|
|
|
6,629 |
|
| Printing and postage |
|
|
12,995 |
|
|
|
8,697 |
|
| Liquidity fees |
|
|
— |
|
|
|
18,272 |
|
| Remarketing fees on Preferred Shares |
|
|
— |
|
|
|
17,940 |
|
| Miscellaneous |
|
|
79,014 |
|
|
|
50,513 |
|
|
|
|
|
|
|
|
|
|
|
|
|
| Total expenses excluding interest expense, fees and amortization of offering costs |
|
|
7,476,102 |
|
|
|
2,990,312 |
|
| Interest expense, fees and amortization of offering
costs(a) |
|
|
18,998,777 |
|
|
|
6,852,612 |
|
|
|
|
|
|
|
|
|
|
|
|
|
| Total expenses |
|
|
26,474,879 |
|
|
|
9,842,924 |
|
| Less: |
|
|
|
|
|
|
|
|
| Fees waived and/or reimbursed by the Manager |
|
|
(13,352 |
) |
|
|
(3,481 |
) |
|
|
|
|
|
|
|
|
|
|
|
|
| Total expenses after fees waived and/or reimbursed |
|
|
26,461,527 |
|
|
|
9,839,443 |
|
|
|
|
|
|
|
|
|
|
|
|
|
| Net investment income |
|
|
31,942,555 |
|
|
|
9,747,989 |
|
|
|
|
|
|
|
|
|
|
|
|
|
| REALIZED AND UNREALIZED GAIN (LOSS) |
|
|
|
|
|
|
|
|
| Net realized gain (loss) from: |
|
|
|
|
|
|
|
|
| Investments — unaffiliated |
|
|
(52,017,933 |
) |
|
|
(26,819,992 |
) |
| Investments — affiliated |
|
|
8,293 |
|
|
|
(94 |
) |
| Futures contracts |
|
|
(335,523 |
) |
|
|
4,176,250 |
|
|
|
|
|
|
|
|
|
|
|
|
|
|
|
|
(52,345,163 |
) |
|
|
(22,643,836 |
) |
|
|
|
|
|
|
|
|
|
| Net change in unrealized appreciation (depreciation) on: |
|
|
|
|
|
|
|
|
| Investments — unaffiliated |
|
|
16,370,595 |
|
|
|
9,693,178 |
|
| Investments — affiliated |
|
|
(36 |
) |
|
|
— |
|
| Futures contracts |
|
|
1,474,611 |
|
|
|
1,742,797 |
|
|
|
|
|
|
|
|
|
|
|
|
|
|
|
|
17,845,170 |
|
|
|
11,435,975 |
|
|
|
|
|
|
|
|
|
|
|
|
|
| Net realized and unrealized loss |
|
|
(34,499,993 |
) |
|
|
(11,207,861 |
) |
|
|
|
|
|
|
|
|
|
|
|
|
| NET DECREASE IN NET ASSETS APPLICABLE TO COMMON SHAREHOLDERS RESULTING FROM OPERATIONS |
|
$ |
(2,557,438 |
) |
|
$ |
(1,459,872 |
) |
|
|
|
|
|
|
|
|
|
| (a) |
Related to TOB Trusts and/or VRDP Shares. |
See notes to financial statements.
|
|
|
| F I N A N C I A
L S T A T E M E N T S |
|
61 |
Statements of Changes in Net Assets
|
|
|
|
|
|
|
|
|
|
|
|
|
|
|
|
|
| |
|
MUJ |
|
|
MIY |
|
|
|
|
|
|
| |
|
Year Ended
07/31/23 |
|
|
Year Ended
07/31/22 |
|
|
Year Ended
07/31/23 |
|
|
Year Ended
07/31/22 |
|
| |
|
|
|
|
|
|
| INCREASE (DECREASE) IN NET ASSETS APPLICABLE TO COMMON SHAREHOLDERS |
|
|
|
|
|
|
|
|
|
|
|
|
|
|
|
|
|
|
|
|
|
| OPERATIONS |
|
|
|
|
|
|
|
|
|
|
|
|
|
|
|
|
| Net investment income |
|
$ |
25,888,130 |
|
|
$ |
23,907,994 |
|
|
$ |
12,474,439 |
|
|
$ |
17,888,520 |
|
| Net realized loss |
|
|
(23,825,884 |
) |
|
|
(9,162,261 |
) |
|
|
(23,484,347 |
) |
|
|
(2,128,297 |
) |
| Net change in unrealized appreciation (depreciation) |
|
|
(4,106,873 |
) |
|
|
(76,124,888 |
) |
|
|
6,665,531 |
|
|
|
(69,271,190 |
) |
|
|
|
|
|
|
|
|
|
|
|
|
|
|
|
|
|
|
|
|
|
|
| Net decrease in net assets applicable to Common Shareholders resulting from operations |
|
|
(2,044,627 |
) |
|
|
(61,379,155 |
) |
|
|
(4,344,377 |
) |
|
|
(53,510,967 |
) |
|
|
|
|
|
|
|
|
|
|
|
|
|
|
|
|
|
|
|
|
|
|
| DISTRIBUTIONS TO COMMON SHAREHOLDERS(a) |
|
|
|
|
|
|
|
|
|
|
|
|
|
|
|
|
| From net investment income |
|
|
(24,162,075 |
) |
|
|
(27,360,522 |
) |
|
|
(12,905,708 |
) |
|
|
(19,830,765 |
) |
| Return of capital |
|
|
(5,140,445 |
) |
|
|
— |
|
|
|
(1,655,675 |
) |
|
|
— |
|
|
|
|
|
|
|
|
|
|
|
|
|
|
|
|
|
|
|
|
|
|
|
| Decrease in net assets resulting from distributions to Common Shareholders |
|
|
(29,302,520 |
) |
|
|
(27,360,522 |
) |
|
|
(14,561,383 |
) |
|
|
(19,830,765 |
) |
|
|
|
|
|
|
|
|
|
|
|
|
|
|
|
|
|
|
|
|
|
|
| CAPITAL SHARE TRANSACTIONS |
|
|
|
|
|
|
|
|
|
|
|
|
|
|
|
|
| Net proceeds from the issuance of common shares due to reorganization |
|
|
— |
|
|
|
338,609,074 |
|
|
|
— |
|
|
|
— |
|
| Reinvestment of common distributions |
|
|
255,161 |
|
|
|
407,537 |
|
|
|
247,171 |
|
|
|
84,162 |
|
| Redemption of shares resulting from share repurchase program (including transaction costs) |
|
|
(9,439,913 |
) |
|
|
(571 |
) |
|
|
(3,374,623 |
) |
|
|
— |
|
|
|
|
|
|
|
|
|
|
|
|
|
|
|
|
|
|
|
|
|
|
|
| Net increase (decrease) in net assets derived from capital share transactions |
|
|
(9,184,752 |
) |
|
|
339,016,040 |
|
|
|
(3,127,452 |
) |
|
|
84,162 |
|
|
|
|
|
|
|
|
|
|
|
|
|
|
|
|
|
|
|
|
|
|
|
| NET ASSETS APPLICABLE TO COMMON SHAREHOLDERS |
|
|
|
|
|
|
|
|
|
|
|
|
|
|
|
|
| Total increase (decrease) in net assets applicable to Common Shareholders |
|
|
(40,531,899 |
) |
|
|
250,276,363 |
|
|
|
(22,033,212 |
) |
|
|
(73,257,570 |
) |
| Beginning of year |
|
|
740,379,581 |
|
|
|
490,103,218 |
|
|
|
400,205,937 |
|
|
|
473,463,507 |
|
|
|
|
|
|
|
|
|
|
|
|
|
|
|
|
|
|
|
|
|
|
|
| End of year |
|
$ |
699,847,682 |
|
|
$ |
740,379,581 |
|
|
$ |
378,172,725 |
|
|
$ |
400,205,937 |
|
|
|
|
|
|
|
|
|
|
|
|
|
|
|
|
|
|
| (a) |
Distributions for annual periods determined in accordance with U.S. federal income tax regulations.
|
See notes to financial statements.
|
|
|
| 62 |
|
2 0 2 3 B L A C
K R O C K A N N U A L R E P O R
T T O S H A R E H O L D E R
S |
Statements of Changes in Net Assets
(continued)
|
|
|
|
|
|
|
|
|
|
|
|
|
|
|
|
|
| |
|
MYN |
|
|
MPA |
|
|
|
|
|
|
| |
|
Year Ended
07/31/23 |
|
|
Year Ended
07/31/22 |
|
|
Year Ended
07/31/23 |
|
|
Year Ended
07/31/22 |
|
| |
|
|
|
|
|
|
| INCREASE (DECREASE) IN NET ASSETS APPLICABLE TO COMMON SHAREHOLDERS |
|
|
|
|
|
|
|
|
|
|
|
|
|
|
|
|
|
|
|
|
|
| OPERATIONS |
|
|
|
|
|
|
|
|
|
|
|
|
|
|
|
|
| Net investment income |
|
$ |
15,421,162 |
|
|
$ |
20,705,131 |
|
|
$ |
5,317,952 |
|
|
$ |
7,818,074 |
|
| Net realized loss |
|
|
(32,048,655 |
) |
|
|
(4,817,777 |
) |
|
|
(9,201,722 |
) |
|
|
(250,805 |
) |
| Net change in unrealized appreciation (depreciation) |
|
|
14,650,705 |
|
|
|
(95,645,562 |
) |
|
|
(1,498,982 |
) |
|
|
(34,970,876 |
) |
|
|
|
|
|
|
|
|
|
|
|
|
|
|
|
|
|
|
|
|
|
|
| Net decrease in net assets applicable to Common Shareholders resulting from operations |
|
|
(1,976,788 |
) |
|
|
(79,758,208 |
) |
|
|
(5,382,752 |
) |
|
|
(27,403,607 |
) |
|
|
|
|
|
|
|
|
|
|
|
|
|
|
|
|
|
|
|
|
|
|
| DISTRIBUTIONS TO COMMON SHAREHOLDERS(a) |
|
|
|
|
|
|
|
|
|
|
|
|
|
|
|
|
| From net investment income |
|
|
(14,186,413 |
) |
|
|
(23,593,604 |
) |
|
|
(5,216,562 |
) |
|
|
(8,786,444 |
) |
| Return of capital |
|
|
(2,141,070 |
) |
|
|
— |
|
|
|
(987,610 |
) |
|
|
— |
|
|
|
|
|
|
|
|
|
|
|
|
|
|
|
|
|
|
|
|
|
|
|
| Decrease in net assets resulting from distributions to Common Shareholders |
|
|
(16,327,483 |
) |
|
|
(23,593,604 |
) |
|
|
(6,204,172 |
) |
|
|
(8,786,444 |
) |
|
|
|
|
|
|
|
|
|
|
|
|
|
|
|
|
|
|
|
|
|
|
| CAPITAL SHARE TRANSACTIONS |
|
|
|
|
|
|
|
|
|
|
|
|
|
|
|
|
| Reinvestment of common distributions |
|
|
— |
|
|
|
— |
|
|
|
11,593 |
|
|
|
138,459 |
|
| Redemption of shares resulting from share repurchase program (including transaction costs) |
|
|
(8,585,038 |
) |
|
|
— |
|
|
|
(3,289,985 |
) |
|
|
— |
|
|
|
|
|
|
|
|
|
|
|
|
|
|
|
|
|
|
|
|
|
|
|
| Net increase (decrease) in net assets derived from capital share transactions |
|
|
(8,585,038 |
) |
|
|
— |
|
|
|
(3,278,392 |
) |
|
|
138,459 |
|
|
|
|
|
|
|
|
|
|
|
|
|
|
|
|
|
|
|
|
|
|
|
| NET ASSETS APPLICABLE TO COMMON SHAREHOLDERS |
|
|
|
|
|
|
|
|
|
|
|
|
|
|
|
|
| Total decrease in net assets applicable to Common Shareholders |
|
|
(26,889,309 |
) |
|
|
(103,351,812 |
) |
|
|
(14,865,316 |
) |
|
|
(36,051,592 |
) |
| Beginning of year |
|
|
479,869,118 |
|
|
|
583,220,930 |
|
|
|
185,332,336 |
|
|
|
221,383,928 |
|
|
|
|
|
|
|
|
|
|
|
|
|
|
|
|
|
|
|
|
|
|
|
| End of year |
|
$ |
452,979,809 |
|
|
$ |
479,869,118 |
|
|
$ |
170,467,020 |
|
|
$ |
185,332,336 |
|
|
|
|
|
|
|
|
|
|
|
|
|
|
|
|
|
|
| (a) |
Distributions for annual periods determined in accordance with U.S. federal income tax regulations.
|
See notes to financial statements.
|
|
|
| F I N A N C I A
L S T A T E M E N T S |
|
63 |
Statements of Changes in Net Assets (continued)
|
|
|
|
|
|
|
|
|
|
|
|
|
|
|
|
|
| |
|
MYI |
|
|
BNY |
|
|
|
|
|
|
| |
|
Year Ended
07/31/23 |
|
|
Year Ended
07/31/22 |
|
|
Year Ended
07/31/23 |
|
|
Year Ended
07/31/22 |
|
| |
|
|
|
|
|
|
| INCREASE (DECREASE) IN NET ASSETS APPLICABLE TO COMMON SHAREHOLDERS |
|
|
|
|
|
|
|
|
|
|
|
|
|
|
|
|
|
|
|
|
|
| OPERATIONS |
|
|
|
|
|
|
|
|
|
|
|
|
|
|
|
|
| Net investment income |
|
$ |
31,942,555 |
|
|
$ |
40,669,725 |
|
|
$ |
9,747,989 |
|
|
$ |
14,078,237 |
|
| Net realized gain (loss) |
|
|
(52,345,163 |
) |
|
|
1,374,770 |
|
|
|
(22,643,836 |
) |
|
|
(3,278,196 |
) |
| Net change in unrealized appreciation (depreciation) |
|
|
17,845,170 |
|
|
|
(177,133,252 |
) |
|
|
11,435,975 |
|
|
|
(63,935,629 |
) |
|
|
|
|
|
|
|
|
|
|
|
|
|
|
|
|
|
|
|
|
|
|
| Net decrease in net assets applicable to Common Shareholders resulting from operations |
|
|
(2,557,438 |
) |
|
|
(135,088,757 |
) |
|
|
(1,459,872 |
) |
|
|
(53,135,588 |
) |
|
|
|
|
|
|
|
|
|
|
|
|
|
|
|
|
|
|
|
|
|
|
| DISTRIBUTIONS TO COMMON SHAREHOLDERS(a) |
|
|
|
|
|
|
|
|
|
|
|
|
|
|
|
|
| From net investment income |
|
|
(34,274,769 |
) |
|
|
(42,117,121 |
) |
|
|
(8,824,872 |
) |
|
|
(15,550,539 |
) |
| Return of capital |
|
|
(328,022 |
) |
|
|
— |
|
|
|
(1,802,990 |
) |
|
|
— |
|
|
|
|
|
|
|
|
|
|
|
|
|
|
|
|
|
|
|
|
|
|
|
| Decrease in net assets resulting from distributions to Common Shareholders |
|
|
(34,602,791 |
) |
|
|
(42,117,121 |
) |
|
|
(10,627,862 |
) |
|
|
(15,550,539 |
) |
|
|
|
|
|
|
|
|
|
|
|
|
|
|
|
|
|
|
|
|
|
|
| CAPITAL SHARE TRANSACTIONS |
|
|
|
|
|
|
|
|
|
|
|
|
|
|
|
|
| Reinvestment of common distributions |
|
|
— |
|
|
|
— |
|
|
|
— |
|
|
|
349,246 |
|
| Redemption of shares resulting from share repurchase program (including transaction costs) |
|
|
(7,043,454 |
) |
|
|
— |
|
|
|
(3,263,323 |
) |
|
|
— |
|
|
|
|
|
|
|
|
|
|
|
|
|
|
|
|
|
|
|
|
|
|
|
| Net increase (decrease) in net assets derived from capital share transactions |
|
|
(7,043,454 |
) |
|
|
— |
|
|
|
(3,263,323 |
) |
|
|
349,246 |
|
|
|
|
|
|
|
|
|
|
|
|
|
|
|
|
|
|
|
|
|
|
|
| NET ASSETS APPLICABLE TO COMMON SHAREHOLDERS |
|
|
|
|
|
|
|
|
|
|
|
|
|
|
|
|
| Total decrease in net assets applicable to Common Shareholders |
|
|
(44,203,683 |
) |
|
|
(177,205,878 |
) |
|
|
(15,351,057 |
) |
|
|
(68,336,881 |
) |
| Beginning of year |
|
|
888,807,546 |
|
|
|
1,066,013,424 |
|
|
|
308,307,671 |
|
|
|
376,644,552 |
|
|
|
|
|
|
|
|
|
|
|
|
|
|
|
|
|
|
|
|
|
|
|
| End of year |
|
$ |
844,603,863 |
|
|
$ |
888,807,546 |
|
|
$ |
292,956,614 |
|
|
$ |
308,307,671 |
|
|
|
|
|
|
|
|
|
|
|
|
|
|
|
|
|
|
| (a) |
Distributions for annual periods determined in accordance with U.S. federal income tax regulations.
|
See notes to financial statements.
|
|
|
| 64 |
|
2 0 2 3 B L A C
K R O C K A N N U A L R E P O R
T T O S H A R E H O L D E R
S |
Statements of Cash Flows
Year Ended July 31, 2023
|
|
|
|
|
|
|
|
|
|
|
|
|
|
|
|
|
| |
|
MUJ |
|
|
MIY |
|
|
MYN |
|
|
MPA |
|
| |
|
|
|
|
|
|
| CASH PROVIDED BY (USED FOR) OPERATING ACTIVITIES |
|
|
|
|
|
|
|
|
|
|
|
|
|
|
|
|
| Net decrease in net assets resulting from operations |
|
$ |
(2,044,627 |
) |
|
$ |
(4,344,377 |
) |
|
$ |
(1,976,788 |
) |
|
$ |
(5,382,752 |
) |
| Adjustments to reconcile net decrease in net assets resulting from operations to net cash provided by
operating activities: |
|
|
|
|
|
|
|
|
|
|
|
|
|
|
|
|
| Proceeds from sales of long-term investments and principal paydowns/payups |
|
|
313,134,123 |
|
|
|
286,065,434 |
|
|
|
339,065,112 |
|
|
|
123,289,492 |
|
| Purchases of long-term investments |
|
|
(184,056,883 |
) |
|
|
(232,812,379 |
) |
|
|
(288,690,205 |
) |
|
|
(81,131,704 |
) |
| Net purchases of short-term securities |
|
|
(54,777,513 |
) |
|
|
(15,041,163 |
) |
|
|
(11,465,201 |
) |
|
|
(13,329,988 |
) |
| Amortization of premium and accretion of discount on investments and other fees |
|
|
135,630 |
|
|
|
3,885,664 |
|
|
|
3,004,112 |
|
|
|
593,465 |
|
| Net realized loss on investments |
|
|
29,748,976 |
|
|
|
22,694,093 |
|
|
|
35,178,633 |
|
|
|
11,244,294 |
|
| Net unrealized (appreciation) depreciation on investments |
|
|
5,588,113 |
|
|
|
(6,665,531 |
) |
|
|
(11,808,528 |
) |
|
|
1,919,826 |
|
| (Increase) Decrease in Assets |
|
|
|
|
|
|
|
|
|
|
|
|
|
|
|
|
| Receivables |
|
|
|
|
|
|
|
|
|
|
|
|
|
|
|
|
| Dividends — affiliated |
|
|
(209,534 |
) |
|
|
(22,033 |
) |
|
|
(35,441 |
) |
|
|
(35,676 |
) |
| From the Manager |
|
|
258,779 |
|
|
|
— |
|
|
|
— |
|
|
|
— |
|
| Interest — unaffiliated |
|
|
1,402,378 |
|
|
|
645,360 |
|
|
|
204,995 |
|
|
|
757,294 |
|
| Prepaid expenses |
|
|
78,435 |
|
|
|
28,211 |
|
|
|
28,527 |
|
|
|
26,974 |
|
| Increase (Decrease) in Liabilities |
|
|
|
|
|
|
|
|
|
|
|
|
|
|
|
|
| Payables |
|
|
|
|
|
|
|
|
|
|
|
|
|
|
|
|
| Accounting services fees |
|
|
(68,268 |
) |
|
|
(31,563 |
) |
|
|
(38,826 |
) |
|
|
(19,215 |
) |
| Custodian fees |
|
|
(5,499 |
) |
|
|
(1,367 |
) |
|
|
(3,494 |
) |
|
|
(3,679 |
) |
| Interest expense and fees |
|
|
(28,812 |
) |
|
|
(26,661 |
) |
|
|
125,722 |
|
|
|
8,985 |
|
| Investment advisory fees |
|
|
(530,877 |
) |
|
|
(294,054 |
) |
|
|
(263,123 |
) |
|
|
(133,523 |
) |
| Directors’ and Officer’s fees |
|
|
5,435 |
|
|
|
(1,241 |
) |
|
|
(10,064 |
) |
|
|
(221 |
) |
| Other accrued expenses |
|
|
774 |
|
|
|
(5,170 |
) |
|
|
(2,349 |
) |
|
|
(5,001 |
) |
| Professional fees |
|
|
670 |
|
|
|
(4,989 |
) |
|
|
(13,953 |
) |
|
|
(1,675 |
) |
| Transfer agent fees |
|
|
(108 |
) |
|
|
(2,204 |
) |
|
|
(1,588 |
) |
|
|
1,163 |
|
| Variation margin on futures contracts |
|
|
(57,205 |
) |
|
|
— |
|
|
|
(27,961 |
) |
|
|
(17,032 |
) |
|
|
|
|
|
|
|
|
|
|
|
|
|
|
|
|
|
|
|
|
|
|
| Net cash provided by operating activities |
|
|
108,573,987 |
|
|
|
54,066,030 |
|
|
|
63,269,580 |
|
|
|
37,781,027 |
|
|
|
|
|
|
|
|
|
|
|
|
|
|
|
|
|
|
|
|
|
|
|
| CASH PROVIDED BY (USED FOR) FINANCING ACTIVITIES |
|
|
|
|
|
|
|
|
|
|
|
|
|
|
|
|
| Cash dividends paid to Common Shareholders |
|
|
(32,306,661 |
) |
|
|
(15,914,475 |
) |
|
|
(17,832,839 |
) |
|
|
(6,902,463 |
) |
| Repayments of TOB Trust Certificates |
|
|
(68,778,276 |
) |
|
|
(41,303,178 |
) |
|
|
(53,218,788 |
) |
|
|
(28,123,181 |
) |
| Repayments of Loan for TOB Trust Certificates |
|
|
— |
|
|
|
— |
|
|
|
(1,321,238 |
) |
|
|
— |
|
| Net payments on Common Shares redeemed including change in redemptions payable |
|
|
(9,247,813 |
) |
|
|
(3,280,792 |
) |
|
|
(8,452,051 |
) |
|
|
(3,264,444 |
) |
| Proceeds from TOB Trust Certificates |
|
|
— |
|
|
|
6,370,000 |
|
|
|
14,271,237 |
|
|
|
— |
|
| Proceeds from Loan for TOB Trust Certificates |
|
|
— |
|
|
|
— |
|
|
|
1,321,238 |
|
|
|
— |
|
| Increase in bank overdraft |
|
|
79,317 |
|
|
|
51,064 |
|
|
|
76,138 |
|
|
|
19,518 |
|
| Amortization of deferred offering costs |
|
|
45,446 |
|
|
|
11,351 |
|
|
|
21,848 |
|
|
|
18,543 |
|
|
|
|
|
|
|
|
|
|
|
|
|
|
|
|
|
|
|
|
|
|
|
| Net cash used for financing activities |
|
|
(110,207,987 |
) |
|
|
(54,066,030 |
) |
|
|
(65,134,455 |
) |
|
|
(38,252,027 |
) |
|
|
|
|
|
|
|
|
|
|
|
|
|
|
|
|
|
|
|
|
|
|
| CASH |
|
|
|
|
|
|
|
|
|
|
|
|
|
|
|
|
| Net decrease in restricted and unrestricted cash |
|
|
(1,634,000 |
) |
|
|
— |
|
|
|
(1,864,875 |
) |
|
|
(471,000 |
) |
| Restricted and unrestricted cash at beginning of year |
|
|
1,634,000 |
|
|
|
— |
|
|
|
2,279,875 |
|
|
|
471,000 |
|
|
|
|
|
|
|
|
|
|
|
|
|
|
|
|
|
|
|
|
|
|
|
| Restricted and unrestricted cash at end of year |
|
$ |
— |
|
|
$ |
— |
|
|
$ |
415,000 |
|
|
$ |
— |
|
|
|
|
|
|
|
|
|
|
|
|
|
|
|
|
|
|
|
|
|
|
|
| SUPPLEMENTAL DISCLOSURE OF CASH FLOW INFORMATION |
|
|
|
|
|
|
|
|
|
|
|
|
|
|
|
|
|
|
|
|
|
| Cash paid during the year for interest expense |
|
$ |
15,848,730 |
|
|
$ |
8,907,915 |
|
|
$ |
9,673,995 |
|
|
$ |
3,517,934 |
|
|
|
|
|
|
|
|
|
|
|
|
|
|
|
|
|
|
|
|
|
|
|
| NON-CASH FINANCING ACTIVITIES |
|
|
|
|
|
|
|
|
|
|
|
|
|
|
|
|
|
|
|
|
|
| Reinvestment of common distributions |
|
$ |
255,161 |
|
|
$ |
247,171 |
|
|
$ |
— |
|
|
$ |
11,593 |
|
|
|
|
|
|
|
|
|
|
|
|
|
|
|
|
|
|
|
|
|
|
|
| RECONCILIATION OF RESTRICTED AND UNRESTRICTED CASH AT THE END OF YEAR TO THE STATEMENTS OF ASSETS AND
LIABILITIES |
|
|
|
|
|
|
|
|
|
|
|
|
|
|
|
|
| Cash pledged |
|
|
|
|
|
|
|
|
|
|
|
|
|
|
|
|
| Futures contracts |
|
|
— |
|
|
|
— |
|
|
|
415,000 |
|
|
|
— |
|
|
|
|
|
|
|
|
|
|
|
|
|
|
|
|
|
|
|
|
|
|
|
|
|
$ |
— |
|
|
$ |
— |
|
|
$ |
415,000 |
|
|
$ |
— |
|
|
|
|
|
|
|
|
|
|
|
|
|
|
|
|
|
|
See notes to financial statements.
|
|
|
| F I N A N C I A
L S T A T E M E N T S |
|
65 |
Statements of Cash Flows (continued)
Year Ended July 31, 2023
|
|
|
|
|
|
|
|
|
| |
|
MYI |
|
|
BNY |
|
| |
|
|
|
|
| CASH PROVIDED BY (USED FOR) OPERATING ACTIVITIES |
|
|
|
|
|
|
|
|
| Net decrease in net assets resulting from operations |
|
$ |
(2,557,438 |
) |
|
$ |
(1,459,872 |
) |
| Adjustments to reconcile net decrease in net assets resulting from operations to net cash provided by
operating activities: |
|
|
|
|
|
|
|
|
| Proceeds from sales of long-term investments |
|
|
757,056,537 |
|
|
|
219,482,804 |
|
| Purchases of long-term investments |
|
|
(669,476,691 |
) |
|
|
(174,124,450 |
) |
| Net purchases of short-term securities |
|
|
(6,477,747 |
) |
|
|
(9,348,084 |
) |
| Amortization of premium and accretion of discount on investments and other fees |
|
|
1,458,322 |
|
|
|
1,999,837 |
|
| Net realized loss on investments |
|
|
52,009,640 |
|
|
|
26,820,086 |
|
| Net unrealized appreciation on investments |
|
|
(16,370,559 |
) |
|
|
(9,693,178 |
) |
| (Increase) Decrease in Assets |
|
|
|
|
|
|
|
|
| Receivables |
|
|
|
|
|
|
|
|
| Dividends — affiliated |
|
|
(35,430 |
) |
|
|
(28,477 |
) |
| Interest — unaffiliated |
|
|
491,862 |
|
|
|
498,775 |
|
| Prepaid expenses |
|
|
28,610 |
|
|
|
(40,095 |
) |
| Increase (Decrease) in Liabilities |
|
|
|
|
|
|
|
|
| Payables |
|
|
|
|
|
|
|
|
| Accounting services fees |
|
|
(52,870 |
) |
|
|
(31,604 |
) |
| Custodian fees |
|
|
(4,016 |
) |
|
|
(2,923 |
) |
| Interest expense and fees |
|
|
908,517 |
|
|
|
(40,930 |
) |
| Investment advisory fees |
|
|
(630,649 |
) |
|
|
(212,831 |
) |
| Directors’ and Officer’s fees |
|
|
(15,789 |
) |
|
|
1,343 |
|
| Other accrued expenses |
|
|
2,005 |
|
|
|
(8,489 |
) |
| Professional fees |
|
|
(7,175 |
) |
|
|
2,332 |
|
| Transfer agent fees |
|
|
(8,217 |
) |
|
|
(7,072 |
) |
| Variation margin on futures contracts |
|
|
(50,156 |
) |
|
|
8,689 |
|
|
|
|
|
|
|
|
|
|
|
|
|
| Net cash provided by operating activities |
|
|
116,268,756 |
|
|
|
53,815,861 |
|
|
|
|
|
|
|
|
|
|
|
|
|
| CASH PROVIDED BY (USED FOR) FINANCING ACTIVITIES |
|
|
|
|
|
|
|
|
| Cash dividends paid to Common Shareholders |
|
|
(37,958,887 |
) |
|
|
(11,728,582 |
) |
| Repayments of TOB Trust Certificates |
|
|
(212,850,687 |
) |
|
|
(42,600,896 |
) |
| Repayments of Loan for TOB Trust Certificates |
|
|
(6,144,796 |
) |
|
|
(2,692,523 |
) |
| Net payments on Common Shares redeemed including change in redemptions payable |
|
|
(6,722,532 |
) |
|
|
(3,188,575 |
) |
| Proceeds from TOB Trust Certificates |
|
|
139,678,000 |
|
|
|
2,692,523 |
|
| Proceeds from Loan for TOB Trust Certificates |
|
|
6,144,796 |
|
|
|
2,692,523 |
|
| Increase in bank overdraft |
|
|
170,887 |
|
|
|
41,876 |
|
| Amortization of deferred offering costs |
|
|
29,463 |
|
|
|
19,208 |
|
|
|
|
|
|
|
|
|
|
|
|
|
| Net cash used for financing activities |
|
|
(117,653,756 |
) |
|
|
(54,764,446 |
) |
|
|
|
|
|
|
|
|
|
|
|
|
| CASH |
|
|
|
|
|
|
|
|
| Net decrease in restricted and unrestricted cash |
|
|
(1,385,000 |
) |
|
|
(948,585 |
) |
| Restricted and unrestricted cash at beginning of year |
|
|
1,385,000 |
|
|
|
1,229,585 |
|
|
|
|
|
|
|
|
|
|
|
|
|
| Restricted and unrestricted cash at end of year |
|
$ |
— |
|
|
$ |
281,000 |
|
|
|
|
|
|
|
|
|
|
|
|
|
| SUPPLEMENTAL DISCLOSURE OF CASH FLOW INFORMATION |
|
|
|
|
|
|
|
|
| Cash paid during the year for interest expense |
|
$ |
18,060,797 |
|
|
$ |
6,874,334 |
|
|
|
|
|
|
|
|
|
|
|
|
|
| RECONCILIATION OF RESTRICTED AND UNRESTRICTED CASH AT THE END OF YEAR TO THE STATEMENTS OF ASSETS AND
LIABILITIES |
|
|
|
|
|
|
|
|
| Cash pledged |
|
|
|
|
|
|
|
|
| Futures contracts |
|
|
— |
|
|
|
281,000 |
|
|
|
|
|
|
|
|
|
|
|
|
|
|
|
$ |
— |
|
|
$ |
281,000 |
|
|
|
|
|
|
|
|
|
|
See notes to financial statements.
|
|
|
| 66 |
|
2 0 2 3 B L A C
K R O C K A N N U A L R E P O R
T T O S H A R E H O L D E R
S |
Financial Highlights
(For a share outstanding throughout each period)
|
|
|
|
|
|
|
|
|
|
|
|
|
|
|
|
|
|
|
|
|
| |
|
MUJ |
|
|
|
|
|
|
|
| |
|
Year Ended
07/31/23 |
|
|
Year Ended
07/31/22 |
|
|
Year Ended
07/31/21 |
|
|
Year Ended
07/31/20 |
|
|
Year Ended
07/31/19 |
|
| |
|
|
|
|
|
| Net asset value, beginning of year |
|
$ |
13.58 |
|
|
$ |
16.29 |
|
|
$ |
15.83 |
|
|
$ |
15.95 |
|
|
$ |
15.28 |
|
|
|
|
|
|
|
|
|
|
|
|
|
|
|
|
|
|
|
|
|
|
|
|
|
|
|
|
| Net investment income(a) |
|
|
0.48 |
|
|
|
0.64 |
|
|
|
0.73 |
|
|
|
0.69 |
|
|
|
0.66 |
|
| Net realized and unrealized gain (loss) |
|
|
(0.49 |
) |
|
|
(2.59 |
) |
|
|
0.48 |
|
|
|
(0.16 |
) |
|
|
0.64 |
|
|
|
|
|
|
|
|
|
|
|
|
|
|
|
|
|
|
|
|
|
|
|
|
|
|
|
|
| Net increase (decrease) from investment operations |
|
|
(0.01 |
) |
|
|
(1.95 |
) |
|
|
1.21 |
|
|
|
0.53 |
|
|
|
1.30 |
|
|
|
|
|
|
|
|
|
|
|
|
|
|
|
|
|
|
|
|
|
|
|
|
|
|
|
|
| Distributions to Common Shareholders(b) |
|
|
|
|
|
|
|
|
|
|
|
|
|
|
|
| From net investment income |
|
|
(0.45 |
) |
|
|
(0.76 |
) |
|
|
(0.75 |
) |
|
|
(0.65 |
) |
|
|
(0.63 |
) |
| Return of capital |
|
|
(0.09 |
) |
|
|
— |
|
|
|
— |
|
|
|
— |
|
|
|
— |
|
|
|
|
|
|
|
|
|
|
|
|
|
|
|
|
|
|
|
|
|
|
|
|
|
|
|
|
| Total distributions to Common Shareholders |
|
|
(0.54 |
) |
|
|
(0.76 |
) |
|
|
(0.75 |
) |
|
|
(0.65 |
) |
|
|
(0.63 |
) |
|
|
|
|
|
|
|
|
|
|
|
|
|
|
|
|
|
|
|
|
|
|
|
|
|
|
|
| Net asset value, end of year |
|
$ |
13.03 |
|
|
$ |
13.58 |
|
|
$ |
16.29 |
|
|
$ |
15.83 |
|
|
$ |
15.95 |
|
|
|
|
|
|
|
|
|
|
|
|
|
|
|
|
|
|
|
|
|
|
|
|
|
|
|
|
| Market price, end of year |
|
$ |
11.20 |
|
|
$ |
13.36 |
|
|
$ |
15.63 |
|
|
$ |
14.21 |
|
|
$ |
14.43 |
|
|
|
|
|
|
|
|
|
|
|
|
|
|
|
|
|
|
|
|
|
|
|
|
|
|
|
|
| Total Return Applicable to Common
Shareholders(c) |
|
|
|
|
|
|
|
|
|
|
|
|
|
|
|
|
|
|
|
|
| Based on net asset value |
|
|
0.52 |
% |
|
|
(12.14 |
)% |
|
|
8.22 |
% |
|
|
3.98 |
% |
|
|
9.44 |
% |
|
|
|
|
|
|
|
|
|
|
|
|
|
|
|
|
|
|
|
|
|
|
|
|
|
|
|
| Based on market price |
|
|
(12.17 |
)% |
|
|
(9.91 |
)% |
|
|
15.67 |
% |
|
|
3.17 |
% |
|
|
17.28 |
% |
|
|
|
|
|
|
|
|
|
|
|
|
|
|
|
|
|
|
|
|
|
|
|
|
|
|
|
| Ratios to Average Net Assets Applicable to Common Shareholders(d) |
|
|
|
|
|
|
|
|
|
|
|
|
|
|
|
|
|
|
|
|
| Total expenses |
|
|
3.17 |
% |
|
|
1.77 |
%(e) |
|
|
1.44 |
% |
|
|
2.14 |
% |
|
|
2.49 |
% |
|
|
|
|
|
|
|
|
|
|
|
|
|
|
|
|
|
|
|
|
|
|
|
|
|
|
|
| Total expenses after fees waived and/or reimbursed |
|
|
3.17 |
% |
|
|
1.74 |
%(e) |
|
|
1.44 |
% |
|
|
2.14 |
% |
|
|
2.49 |
% |
|
|
|
|
|
|
|
|
|
|
|
|
|
|
|
|
|
|
|
|
|
|
|
|
|
|
|
| Total expenses after fees waived and/or reimbursed and excluding interest expense, fees and amortization of
offering costs(f)(g) |
|
|
0.89 |
% |
|
|
0.95 |
%(e) |
|
|
0.89 |
% |
|
|
0.92 |
% |
|
|
0.92 |
% |
|
|
|
|
|
|
|
|
|
|
|
|
|
|
|
|
|
|
|
|
|
|
|
|
|
|
|
| Net investment income to Common Shareholders |
|
|
3.71 |
% |
|
|
4.37 |
% |
|
|
4.59 |
% |
|
|
4.39 |
% |
|
|
4.28 |
% |
|
|
|
|
|
|
|
|
|
|
|
|
|
|
|
|
|
|
|
|
|
|
|
|
|
|
|
| Supplemental Data |
|
|
|
|
|
|
|
|
|
|
|
|
|
|
|
|
|
|
|
|
| Net assets applicable to Common Shareholders, end of year (000) |
|
$ |
699,848 |
|
|
$ |
740,380 |
|
|
$ |
490,103 |
|
|
$ |
476,309 |
|
|
$ |
481,024 |
|
|
|
|
|
|
|
|
|
|
|
|
|
|
|
|
|
|
|
|
|
|
|
|
|
|
|
|
| VRDP Shares outstanding at $100,000 liquidation value, end of year (000) |
|
$ |
417,100 |
|
|
$ |
417,100 |
|
|
$ |
237,100 |
|
|
$ |
237,100 |
|
|
$ |
237,100 |
|
|
|
|
|
|
|
|
|
|
|
|
|
|
|
|
|
|
|
|
|
|
|
|
|
|
|
|
| Asset coverage per VRDP Shares at $100,000 liquidation value, end of year |
|
$ |
259,361 |
(h) |
|
$ |
245,762 |
(h) |
|
$ |
306,707 |
(i) |
|
$ |
300,890 |
(i) |
|
$ |
302,878 |
(i) |
|
|
|
|
|
|
|
|
|
|
|
|
|
|
|
|
|
|
|
|
|
|
|
|
|
|
|
| TOB Trust Certificates, end of year (000) |
|
$ |
22,060 |
|
|
$ |
90,838 |
|
|
$ |
61,534 |
|
|
$ |
71,300 |
|
|
$ |
59,415 |
|
|
|
|
|
|
|
|
|
|
|
|
|
|
|
|
|
|
|
|
|
|
|
|
|
|
|
|
| Asset coverage per $1,000 of TOB Trust Certificates, end of
year(j) |
|
$ |
51,599 |
|
|
$ |
13,734 |
|
|
|
N/A |
|
|
|
N/A |
|
|
|
N/A |
|
|
|
|
|
|
|
|
|
|
|
|
|
|
|
|
|
|
|
|
|
|
|
|
|
|
|
|
| Portfolio turnover rate |
|
|
17 |
% |
|
|
20 |
% |
|
|
10 |
% |
|
|
13 |
% |
|
|
8 |
% |
|
|
|
|
|
|
|
|
|
|
|
|
|
|
|
|
|
|
|
|
|
| (a) |
Based on average Common Shares outstanding. |
| (b) |
Distributions for annual periods determined in accordance with U.S. federal income tax regulations.
|
| (c) |
Total returns based on market price, which can be significantly greater or less than the net asset value, may result in
substantially different returns. Where applicable, excludes the effects of any sales charges and assumes the reinvestment of distributions at actual reinvestment prices. |
| (d) |
Excludes fees and expenses incurred indirectly as a result of investments in underlying funds. |
| (e) |
Includes non-recurring expenses of reorganization costs. Without these costs, total expenses, total expenses after fees
waived and/or reimbursed and total expenses after fees waived and/or reimbursed and excluding interest expense, fees, and amortization of offering costs, would have been 1.71%, 1.70% and 0.92%, respectively. |
| (f) |
Interest expense, fees and amortization of offering costs related to TOB Trusts and/or VRDP Shares. See Note 4 and Note
10 of the Notes to Financial Statements for details. |
| (g) |
The total expense ratio after fees waived and/or reimbursed and excluding interest expense, fees, amortization of
offering costs, liquidity and remarketing fees as follows: |
|
|
|
|
|
|
|
|
|
|
|
|
|
|
|
|
|
|
|
|
|
| |
|
|
|
|
|
| |
|
Year Ended
07/31/23 |
|
|
Year Ended
07/31/22 |
|
|
Year Ended
07/31/21 |
|
|
Year Ended
07/31/20 |
|
|
Year Ended
07/31/19 |
|
|
|
|
|
|
|
| Expense ratios |
|
|
0.88 |
% |
|
|
0.94 |
% |
|
|
0.88 |
% |
|
|
0.91 |
% |
|
|
0.91 |
% |
|
|
|
|
|
|
|
|
|
|
|
|
|
|
|
|
|
|
|
|
|
| (h) |
Calculated by subtracting the Fund’s total liabilities (not including VRDP Shares and TOBs) from the Fund’s
total assets and dividing this by the sum of the amount of TOBs and liquidation value of the VRDP Shares, and by multiplying the results by 100,000. |
| (i) |
Calculated by subtracting the Fund’s total liabilities (not including VRDP Shares) from the Fund’s total
assets and dividing this by the liquidation value of the VRDP Shares, and by multiplying the results by 100,000. |
| (j) |
Effective July 18, 2022, TOB Trust Certificates are treated as senior securities pursuant to Rule 18f-4 of the
1940 Act. Calculated by subtracting the Fund’s total liabilities (not including VRDP Shares and TOBs) from the Fund’s total assets and dividing this by the amount of TOBs, and by multiplying the results by 1,000. |
See notes to financial statements.
|
|
|
| F I N A N C I A L
H I G H L I G H T S |
|
67 |
Financial Highlights (continued)
(For a share outstanding throughout each period)
|
|
|
|
|
|
|
|
|
|
|
|
|
|
|
|
|
|
|
|
|
| |
|
MIY |
|
|
|
|
|
|
|
| |
|
Year Ended
07/31/23 |
|
|
Year Ended
07/31/22 |
|
|
Year Ended
07/31/21 |
|
|
Year Ended
07/31/20 |
|
|
Year Ended
07/31/19 |
|
| |
|
|
|
|
|
| Net asset value, beginning of year |
|
$ |
13.56 |
|
|
$ |
16.04 |
|
|
$ |
15.88 |
|
|
$ |
15.70 |
|
|
$ |
15.04 |
|
|
|
|
|
|
|
|
|
|
|
|
|
|
|
|
|
|
|
|
|
|
|
|
|
|
|
|
| Net investment income(a) |
|
|
0.42 |
|
|
|
0.61 |
|
|
|
0.68 |
|
|
|
0.63 |
|
|
|
0.62 |
|
| Net realized and unrealized gain (loss) |
|
|
(0.55 |
) |
|
|
(2.42 |
) |
|
|
0.14 |
|
|
|
0.14 |
|
|
|
0.66 |
|
|
|
|
|
|
|
|
|
|
|
|
|
|
|
|
|
|
|
|
|
|
|
|
|
|
|
|
| Net increase (decrease) from investment operations |
|
|
(0.13 |
) |
|
|
(1.81 |
) |
|
|
0.82 |
|
|
|
0.77 |
|
|
|
1.28 |
|
|
|
|
|
|
|
|
|
|
|
|
|
|
|
|
|
|
|
|
|
|
|
|
|
|
|
|
| Distributions to Common Shareholders(b) |
|
|
|
|
|
|
|
|
|
|
|
|
|
|
|
| From net investment income |
|
|
(0.43 |
) |
|
|
(0.67 |
) |
|
|
(0.66 |
) |
|
|
(0.59 |
) |
|
|
(0.62 |
) |
| Return of capital |
|
|
(0.06 |
) |
|
|
— |
|
|
|
— |
|
|
|
— |
|
|
|
— |
|
|
|
|
|
|
|
|
|
|
|
|
|
|
|
|
|
|
|
|
|
|
|
|
|
|
|
|
| Total distributions to Common Shareholders |
|
|
(0.49 |
) |
|
|
(0.67 |
) |
|
|
(0.66 |
) |
|
|
(0.59 |
) |
|
|
(0.62 |
) |
|
|
|
|
|
|
|
|
|
|
|
|
|
|
|
|
|
|
|
|
|
|
|
|
|
|
|
| Net asset value, end of year |
|
$ |
12.94 |
|
|
$ |
13.56 |
|
|
$ |
16.04 |
|
|
$ |
15.88 |
|
|
$ |
15.70 |
|
|
|
|
|
|
|
|
|
|
|
|
|
|
|
|
|
|
|
|
|
|
|
|
|
|
|
|
| Market price, end of year |
|
$ |
11.12 |
|
|
$ |
13.67 |
|
|
$ |
15.80 |
|
|
$ |
14.24 |
|
|
$ |
14.24 |
|
|
|
|
|
|
|
|
|
|
|
|
|
|
|
|
|
|
|
|
|
|
|
|
|
|
|
|
| Total Return Applicable to Common
Shareholders(c) |
|
|
|
|
|
|
|
|
|
|
|
|
|
|
|
|
|
|
|
|
| Based on net asset value |
|
|
(0.40 |
)% |
|
|
(11.35 |
)% |
|
|
5.61 |
% |
|
|
5.52 |
% |
|
|
9.42 |
% |
|
|
|
|
|
|
|
|
|
|
|
|
|
|
|
|
|
|
|
|
|
|
|
|
|
|
|
| Based on market price |
|
|
(15.09 |
)% |
|
|
(9.28 |
)% |
|
|
16.02 |
% |
|
|
4.31 |
% |
|
|
15.80 |
% |
|
|
|
|
|
|
|
|
|
|
|
|
|
|
|
|
|
|
|
|
|
|
|
|
|
|
|
| Ratios to Average Net Assets Applicable to Common Shareholders(d) |
|
|
|
|
|
|
|
|
|
|
|
|
|
|
|
|
|
|
|
|
| Total expenses |
|
|
3.27 |
% |
|
|
1.66 |
% |
|
|
1.44 |
% |
|
|
2.07 |
% |
|
|
2.46 |
% |
|
|
|
|
|
|
|
|
|
|
|
|
|
|
|
|
|
|
|
|
|
|
|
|
|
|
|
| Total expenses after fees waived and/or reimbursed |
|
|
3.27 |
% |
|
|
1.66 |
% |
|
|
1.44 |
% |
|
|
2.07 |
% |
|
|
2.46 |
% |
|
|
|
|
|
|
|
|
|
|
|
|
|
|
|
|
|
|
|
|
|
| Total expenses after fees waived and/or reimbursed and excluding interest expense, fees and amortization of
offering costs(e)(f) |
|
|
0.91 |
% |
|
|
0.88 |
% |
|
|
0.85 |
% |
|
|
1.20 |
% |
|
|
1.09 |
% |
|
|
|
|
|
|
|
|
|
|
|
|
|
|
|
|
|
|
|
|
|
|
|
|
|
|
|
| Net investment income to Common Shareholders |
|
|
3.31 |
% |
|
|
4.10 |
% |
|
|
4.32 |
% |
|
|
4.06 |
% |
|
|
4.11 |
% |
|
|
|
|
|
|
|
|
|
|
|
|
|
|
|
|
|
|
|
|
|
|
|
|
|
|
|
| Supplemental Data |
|
|
|
|
|
|
|
|
|
|
|
|
|
|
|
|
|
|
|
|
| Net assets applicable to Common Shareholders, end of year (000) |
|
$ |
378,173 |
|
|
$ |
400,206 |
|
|
$ |
473,464 |
|
|
$ |
468,752 |
|
|
$ |
464,366 |
|
|
|
|
|
|
|
|
|
|
|
|
|
|
|
|
|
|
|
|
|
|
|
|
|
|
|
|
| VRDP Shares outstanding at $100,000 liquidation value, end of year (000) |
|
$ |
231,900 |
|
|
$ |
231,900 |
|
|
$ |
231,900 |
|
|
$ |
231,900 |
|
|
$ |
231,900 |
|
|
|
|
|
|
|
|
|
|
|
|
|
|
|
|
|
|
|
|
|
|
|
|
|
|
|
|
| Asset coverage per VRDP Shares at $100,000 liquidation value, end of year |
|
$ |
258,740 |
(g) |
|
$ |
246,506 |
(g) |
|
$ |
304,167 |
(h) |
|
$ |
302,135 |
(h) |
|
$ |
300,244 |
(h) |
|
|
|
|
|
|
|
|
|
|
|
|
|
|
|
|
|
|
|
|
|
|
|
|
|
|
|
| TOB Trust Certificates, end of year (000) |
|
$ |
6,334 |
|
|
$ |
41,267 |
|
|
$ |
41,267 |
|
|
$ |
41,362 |
|
|
$ |
64,527 |
|
|
|
|
|
|
|
|
|
|
|
|
|
|
|
|
|
|
|
|
|
|
|
|
|
|
|
|
| Asset coverage per $1,000 of TOB Trust Certificates, end of
year(i) |
|
$ |
97,262 |
|
|
$ |
16,309 |
|
|
|
N/A |
|
|
|
N/A |
|
|
|
N/A |
|
|
|
|
|
|
|
|
|
|
|
|
|
|
|
|
|
|
|
|
|
|
|
|
|
|
|
|
| Portfolio turnover rate |
|
|
37 |
% |
|
|
22 |
% |
|
|
7 |
% |
|
|
9 |
% |
|
|
15 |
% |
|
|
|
|
|
|
|
|
|
|
|
|
|
|
|
|
|
|
|
|
|
| (a) |
Based on average Common Shares outstanding. |
| (b) |
Distributions for annual periods determined in accordance with U.S. federal income tax regulations.
|
| (c) |
Total returns based on market price, which can be significantly greater or less than the net asset value, may result in
substantially different returns. Where applicable, excludes the effects of any sales charges and assumes the reinvestment of distributions at actual reinvestment prices. |
| (d) |
Excludes fees and expenses incurred indirectly as a result of investments in underlying funds. |
| (e) |
Interest expense, fees and amortization of offering costs related to TOB Trusts and/or VRDP Shares. See Note 4 and Note
10 of the Notes to Financial Statements for details. |
| (f) |
The total expense ratio after fees waived and/or reimbursed and excluding interest expense, fees, amortization of
offering costs, liquidity and remarketing fees as follows: |
|
|
|
|
|
|
|
|
|
|
|
|
|
|
|
|
|
|
|
|
|
| |
|
|
|
|
|
| |
|
Year Ended
07/31/23 |
|
|
Year Ended
07/31/22 |
|
|
Year Ended
07/31/21 |
|
|
Year Ended
07/31/20 |
|
|
Year Ended
07/31/19 |
|
|
|
|
|
|
|
| Expense ratios |
|
|
0.91 |
% |
|
|
0.88 |
% |
|
|
0.85 |
% |
|
|
0.88 |
% |
|
|
0.90 |
% |
|
|
|
|
|
|
|
|
|
|
|
|
|
|
|
|
|
|
|
|
|
| (g) |
Calculated by subtracting the Fund’s total liabilities (not including VRDP Shares and TOBs) from the Fund’s
total assets and dividing this by the sum of the amount of TOBs and liquidation value of the VRDP Shares, and by multiplying the results by 100,000. |
| (h) |
Calculated by subtracting the Fund’s total liabilities (not including VRDP Shares) from the Fund’s total
assets and dividing this by the liquidation value of the VRDP Shares, and by multiplying the results by 100,000. |
| (i) |
Effective July 18, 2022, TOB Trust Certificates are treated as senior securities pursuant to Rule 18f-4 of the
1940 Act. Calculated by subtracting the Fund’s total liabilities (not including VRDP Shares and TOBs) from the Fund’s total assets and dividing this by the amount of TOBs, and by multiplying the results by 1,000. |
See notes to financial statements.
|
|
|
| 68 |
|
2 0 2 3 B L A C
K R O C K A N N U A L R E P O R
T T O S H A R E H O L D E R
S |
Financial Highlights (continued)
(For a share outstanding throughout each period)
|
|
|
|
|
|
|
|
|
|
|
|
|
|
|
|
|
|
|
|
|
| |
|
MYN |
|
|
|
|
|
|
|
| |
|
Year Ended
07/31/23 |
|
|
Year Ended
07/31/22 |
|
|
Year Ended
07/31/21 |
|
|
Year Ended
07/31/20 |
|
|
Year Ended
07/31/19 |
|
| |
|
|
|
|
|
| Net asset value, beginning of year |
|
$ |
12.12 |
|
|
$ |
14.73 |
|
|
$ |
14.52 |
|
|
$ |
14.38 |
|
|
$ |
13.74 |
|
|
|
|
|
|
|
|
|
|
|
|
|
|
|
|
|
|
|
|
|
|
|
|
|
|
|
|
| Net investment income(a) |
|
|
0.39 |
|
|
|
0.52 |
|
|
|
0.60 |
|
|
|
0.56 |
|
|
|
0.52 |
|
| Net realized and unrealized gain (loss) |
|
|
(0.39 |
) |
|
|
(2.53 |
) |
|
|
0.22 |
|
|
|
0.10 |
|
|
|
0.63 |
|
|
|
|
|
|
|
|
|
|
|
|
|
|
|
|
|
|
|
|
|
|
|
|
|
|
|
|
| Net increase (decrease) from investment operations |
|
|
— |
|
|
|
(2.01 |
) |
|
|
0.82 |
|
|
|
0.66 |
|
|
|
1.15 |
|
|
|
|
|
|
|
|
|
|
|
|
|
|
|
|
|
|
|
|
|
|
|
|
|
|
|
|
| Distributions to Common Shareholders(b) |
|
|
|
|
|
|
|
|
|
|
|
|
|
|
|
| From net investment income |
|
|
(0.37 |
) |
|
|
(0.60 |
) |
|
|
(0.61 |
) |
|
|
(0.52 |
) |
|
|
(0.51 |
) |
| Return of capital |
|
|
(0.05 |
) |
|
|
— |
|
|
|
— |
|
|
|
— |
|
|
|
— |
|
|
|
|
|
|
|
|
|
|
|
|
|
|
|
|
|
|
|
|
|
|
|
|
|
|
|
|
| Total distributions to Common Shareholders |
|
|
(0.42 |
) |
|
|
(0.60 |
) |
|
|
(0.61 |
) |
|
|
(0.52 |
) |
|
|
(0.51 |
) |
|
|
|
|
|
|
|
|
|
|
|
|
|
|
|
|
|
|
|
|
|
|
|
|
|
|
|
| Net asset value, end of year |
|
$ |
11.70 |
|
|
$ |
12.12 |
|
|
$ |
14.73 |
|
|
$ |
14.52 |
|
|
$ |
14.38 |
|
|
|
|
|
|
|
|
|
|
|
|
|
|
|
|
|
|
|
|
|
|
|
|
|
|
|
|
| Market price, end of year |
|
$ |
10.08 |
|
|
$ |
10.94 |
|
|
$ |
14.56 |
|
|
$ |
13.26 |
|
|
$ |
13.19 |
|
|
|
|
|
|
|
|
|
|
|
|
|
|
|
|
|
|
|
|
|
|
|
|
|
|
|
|
| Total Return Applicable to Common
Shareholders(c) |
|
|
|
|
|
|
|
|
|
|
|
|
|
|
|
|
|
|
|
|
| Based on net asset value |
|
|
0.64 |
% |
|
|
(13.74 |
)% |
|
|
6.10 |
% |
|
|
5.11 |
% |
|
|
9.15 |
% |
|
|
|
|
|
|
|
|
|
|
|
|
|
|
|
|
|
|
|
|
|
|
|
|
|
|
|
| Based on market price |
|
|
(3.94 |
)% |
|
|
(21.23 |
)% |
|
|
14.84 |
% |
|
|
4.65 |
% |
|
|
15.69 |
% |
|
|
|
|
|
|
|
|
|
|
|
|
|
|
|
|
|
|
|
|
|
|
|
|
|
|
|
| Ratios to Average Net Assets Applicable to Common Shareholders(d) |
|
|
|
|
|
|
|
|
|
|
|
|
|
|
|
|
|
|
|
|
| Total expenses |
|
|
3.07 |
% |
|
|
1.59 |
% |
|
|
1.47 |
% |
|
|
2.05 |
% |
|
|
2.45 |
% |
|
|
|
|
|
|
|
|
|
|
|
|
|
|
|
|
|
|
|
|
|
|
|
|
|
|
|
| Total expenses after fees waived and/or reimbursed |
|
|
3.07 |
% |
|
|
1.59 |
% |
|
|
1.47 |
% |
|
|
2.05 |
% |
|
|
2.45 |
% |
|
|
|
|
|
|
|
|
|
|
|
|
|
|
|
|
|
|
|
|
|
| Total expenses after fees waived and/or reimbursed and excluding interest expense, fees and amortization of
offering costs(e)(f) |
|
|
0.89 |
% |
|
|
1.24 |
% |
|
|
1.27 |
% |
|
|
1.21 |
% |
|
|
1.08 |
% |
|
|
|
|
|
|
|
|
|
|
|
|
|
|
|
|
|
|
|
|
|
|
|
|
|
|
|
| Net investment income to Common Shareholders |
|
|
3.42 |
% |
|
|
3.91 |
% |
|
|
4.17 |
% |
|
|
3.91 |
% |
|
|
3.80 |
% |
|
|
|
|
|
|
|
|
|
|
|
|
|
|
|
|
|
|
|
|
|
|
|
|
|
|
|
| Supplemental Data |
|
|
|
|
|
|
|
|
|
|
|
|
|
|
|
|
|
|
|
|
| Net assets applicable to Common Shareholders, end of year (000) |
|
$ |
452,980 |
|
|
$ |
479,869 |
|
|
$ |
583,221 |
|
|
$ |
574,856 |
|
|
$ |
569,102 |
|
|
|
|
|
|
|
|
|
|
|
|
|
|
|
|
|
|
|
|
|
|
|
|
|
|
|
|
| VRDP Shares outstanding at $100,000 liquidation value, end of year (000) |
|
$ |
247,700 |
|
|
$ |
247,700 |
|
|
$ |
247,700 |
|
|
$ |
247,700 |
|
|
$ |
247,700 |
|
|
|
|
|
|
|
|
|
|
|
|
|
|
|
|
|
|
|
|
|
|
|
|
|
|
|
|
| Asset coverage per VRDP Shares at $100,000 liquidation value, end of year |
|
$ |
269,699 |
(g) |
|
$ |
256,882 |
(g) |
|
$ |
335,455 |
(h) |
|
$ |
332,077 |
(h) |
|
$ |
329,755 |
(h) |
|
|
|
|
|
|
|
|
|
|
|
|
|
|
|
|
|
|
|
|
|
|
|
|
|
|
|
| TOB Trust Certificates, end of year (000) |
|
$ |
19,231 |
|
|
$ |
58,179 |
|
|
$ |
103,573 |
|
|
$ |
111,089 |
|
|
$ |
104,473 |
|
|
|
|
|
|
|
|
|
|
|
|
|
|
|
|
|
|
|
|
|
|
|
|
|
|
|
|
| Asset coverage per $1,000 of TOB Trust Certificates, end of
year(i) |
|
$ |
37,423 |
|
|
$ |
13,502 |
|
|
|
N/A |
|
|
|
N/A |
|
|
|
N/A |
|
|
|
|
|
|
|
|
|
|
|
|
|
|
|
|
|
|
|
|
|
|
|
|
|
|
|
|
| Portfolio turnover rate |
|
|
40 |
% |
|
|
31 |
% |
|
|
11 |
% |
|
|
11 |
% |
|
|
19 |
% |
|
|
|
|
|
|
|
|
|
|
|
|
|
|
|
|
|
|
|
|
|
| (a) |
Based on average Common Shares outstanding. |
| (b) |
Distributions for annual periods determined in accordance with U.S. federal income tax regulations.
|
| (c) |
Total returns based on market price, which can be significantly greater or less than the net asset value, may result in
substantially different returns. Where applicable, excludes the effects of any sales charges and assumes the reinvestment of distributions at actual reinvestment prices. |
| (d) |
Excludes fees and expenses incurred indirectly as a result of investments in underlying funds. |
| (e) |
Interest expense, fees and amortization of offering costs related to TOB Trusts and/or VRDP Shares. See Note 4 and Note
10 of the Notes to Financial Statements for details. |
| (f) |
The total expense ratio after fees waived and/or reimbursed and excluding interest expense, fees, amortization of
offering costs, liquidity and remarketing fees as follows: |
|
|
|
|
|
|
|
|
|
|
|
|
|
|
|
|
|
|
|
|
|
| |
|
|
|
|
|
| |
|
Year Ended
07/31/23 |
|
|
Year Ended
07/31/22 |
|
|
Year Ended
07/31/21 |
|
|
Year Ended
07/31/20 |
|
|
Year Ended
07/31/19 |
|
|
|
|
|
|
|
| Expense ratios |
|
|
0.89 |
% |
|
|
0.88 |
% |
|
|
0.90 |
% |
|
|
0.89 |
% |
|
|
1.08 |
% |
|
|
|
|
|
|
|
|
|
|
|
|
|
|
|
|
|
|
|
|
|
| (g) |
Calculated by subtracting the Fund’s total liabilities (not including VRDP Shares and TOBs) from the Fund’s
total assets and dividing this by the sum of the amount of TOBs and liquidation value of the VRDP Shares, and by multiplying the results by 100,000. |
| (h) |
Calculated by subtracting the Fund’s total liabilities (not including VRDP Shares) from the Fund’s total
assets and dividing this by the liquidation value of the VRDP Shares, and by multiplying the results by 100,000. |
| (i) |
Effective July 18, 2022, TOB Trust Certificates are treated as senior securities pursuant to Rule 18f-4 of the
1940 Act. Calculated by subtracting the Fund’s total liabilities (not including VRDP Shares and TOBs) from the Fund’s total assets and dividing this by the amount of TOBs, and by multiplying the results by 1,000. |
See notes to financial statements.
|
|
|
| F I N A N C I A L
H I G H L I G H T S |
|
69 |
Financial Highlights (continued)
(For a share outstanding throughout each period)
|
|
|
|
|
|
|
|
|
|
|
|
|
|
|
|
|
|
|
|
|
| |
|
MPA |
|
|
|
|
|
|
|
| |
|
Year Ended
07/31/23 |
|
|
Year Ended
07/31/22 |
|
|
Year Ended
07/31/21 |
|
|
Year Ended
07/31/20 |
|
|
Year Ended
07/31/19 |
|
| |
|
|
|
|
|
| Net asset value, beginning of year |
|
$ |
13.92 |
|
|
$ |
16.64 |
|
|
$ |
16.09 |
|
|
$ |
16.06 |
|
|
$ |
15.27 |
|
|
|
|
|
|
|
|
|
|
|
|
|
|
|
|
|
|
|
|
|
|
|
|
|
|
|
|
| Net investment income(a) |
|
|
0.40 |
|
|
|
0.59 |
|
|
|
0.69 |
|
|
|
0.65 |
|
|
|
0.63 |
|
| Net realized and unrealized gain (loss) |
|
|
(0.76 |
) |
|
|
(2.65 |
) |
|
|
0.52 |
|
|
|
(0.05 |
) |
|
|
0.80 |
|
|
|
|
|
|
|
|
|
|
|
|
|
|
|
|
|
|
|
|
|
|
|
|
|
|
|
|
| Net increase (decrease) from investment operations |
|
|
(0.36 |
) |
|
|
(2.06 |
) |
|
|
1.21 |
|
|
|
0.60 |
|
|
|
1.43 |
|
|
|
|
|
|
|
|
|
|
|
|
|
|
|
|
|
|
|
|
|
|
|
|
|
|
|
|
| Distributions to Common Shareholders(b) |
|
|
|
|
|
|
|
|
|
|
|
|
|
|
|
| From net investment income |
|
|
(0.40 |
) |
|
|
(0.66 |
) |
|
|
(0.66 |
) |
|
|
(0.57 |
) |
|
|
(0.64 |
) |
| Return of capital |
|
|
(0.07 |
) |
|
|
— |
|
|
|
— |
|
|
|
— |
|
|
|
— |
|
|
|
|
|
|
|
|
|
|
|
|
|
|
|
|
|
|
|
|
|
|
|
|
|
|
|
|
| Total distributions to Common Shareholders |
|
|
(0.47 |
) |
|
|
(0.66 |
) |
|
|
(0.66 |
) |
|
|
(0.57 |
) |
|
|
(0.64 |
) |
|
|
|
|
|
|
|
|
|
|
|
|
|
|
|
|
|
|
|
|
|
|
|
|
|
|
|
| Net asset value, end of year |
|
$ |
13.09 |
|
|
$ |
13.92 |
|
|
$ |
16.64 |
|
|
$ |
16.09 |
|
|
$ |
16.06 |
|
|
|
|
|
|
|
|
|
|
|
|
|
|
|
|
|
|
|
|
|
|
|
|
|
|
|
|
| Market price, end of year |
|
$ |
11.69 |
|
|
$ |
13.54 |
|
|
$ |
16.23 |
|
|
$ |
14.09 |
|
|
$ |
14.18 |
|
|
|
|
|
|
|
|
|
|
|
|
|
|
|
|
|
|
|
|
|
|
|
|
|
|
|
|
| Total Return Applicable to Common
Shareholders(c) |
|
|
|
|
|
|
|
|
|
|
|
|
|
|
|
|
|
|
|
|
| Based on net asset value |
|
|
(2.05 |
)% |
|
|
(12.45 |
)% |
|
|
8.09 |
% |
|
|
4.33 |
% |
|
|
10.32 |
% |
|
|
|
|
|
|
|
|
|
|
|
|
|
|
|
|
|
|
|
|
|
|
|
|
|
|
|
| Based on market price |
|
|
(10.08 |
)% |
|
|
(12.69 |
)% |
|
|
20.40 |
% |
|
|
3.47 |
% |
|
|
12.18 |
% |
|
|
|
|
|
|
|
|
|
|
|
|
|
|
|
|
|
|
|
|
|
|
|
|
|
|
|
| Ratios to Average Net Assets Applicable to Common Shareholders(d) |
|
|
|
|
|
|
|
|
|
|
|
|
|
|
|
|
|
|
|
|
| Total expenses |
|
|
3.02 |
% |
|
|
1.63 |
% |
|
|
1.48 |
% |
|
|
2.13 |
% |
|
|
2.55 |
% |
|
|
|
|
|
|
|
|
|
|
|
|
|
|
|
|
|
|
|
|
|
|
|
|
|
|
|
| Total expenses after fees waived and/or reimbursed |
|
|
3.01 |
% |
|
|
1.63 |
% |
|
|
1.48 |
% |
|
|
2.12 |
% |
|
|
2.55 |
% |
|
|
|
|
|
|
|
|
|
|
|
|
|
|
|
|
|
|
|
|
|
| Total expenses after fees waived and/or reimbursed and excluding interest expense, fees and amortization of
offering costs(e)(f) |
|
|
0.95 |
% |
|
|
1.24 |
% |
|
|
1.25 |
% |
|
|
1.23 |
% |
|
|
0.99 |
% |
|
|
|
|
|
|
|
|
|
|
|
|
|
|
|
|
|
|
|
|
|
|
|
|
|
|
|
| Net investment income to Common Shareholders |
|
|
3.10 |
% |
|
|
3.85 |
% |
|
|
4.24 |
% |
|
|
4.08 |
% |
|
|
4.11 |
% |
|
|
|
|
|
|
|
|
|
|
|
|
|
|
|
|
|
|
|
|
|
|
|
|
|
|
|
| Supplemental Data |
|
|
|
|
|
|
|
|
|
|
|
|
|
|
|
|
|
|
|
|
| Net assets applicable to Common Shareholders, end of year (000) |
|
$ |
170,467 |
|
|
$ |
185,332 |
|
|
$ |
221,384 |
|
|
$ |
214,155 |
|
|
$ |
214,359 |
|
|
|
|
|
|
|
|
|
|
|
|
|
|
|
|
|
|
|
|
|
|
|
|
|
|
|
|
| VRDP Shares outstanding at $100,000 liquidation value, end of year (000) |
|
$ |
82,600 |
|
|
$ |
82,600 |
|
|
$ |
82,600 |
|
|
$ |
82,600 |
|
|
$ |
82,600 |
|
|
|
|
|
|
|
|
|
|
|
|
|
|
|
|
|
|
|
|
|
|
|
|
|
|
|
|
| Asset coverage per VRDP Shares at $100,000 liquidation value, end of year |
|
$ |
276,357 |
(g) |
|
$ |
248,524 |
(g) |
|
$ |
368,019 |
(h) |
|
$ |
359,268 |
(h) |
|
$ |
359,514 |
(h) |
|
|
|
|
|
|
|
|
|
|
|
|
|
|
|
|
|
|
|
|
|
|
|
|
|
|
|
| TOB Trust Certificates, end of year (000) |
|
$ |
14,060 |
|
|
$ |
42,183 |
|
|
$ |
44,012 |
|
|
$ |
54,482 |
|
|
$ |
52,814 |
|
|
|
|
|
|
|
|
|
|
|
|
|
|
|
|
|
|
|
|
|
|
|
|
|
|
|
|
| Asset coverage per $1,000 of TOB Trust Certificates, end of
year(i) |
|
$ |
18,983 |
|
|
$ |
7,346 |
|
|
|
N/A |
|
|
|
N/A |
|
|
|
N/A |
|
|
|
|
|
|
|
|
|
|
|
|
|
|
|
|
|
|
|
|
|
|
|
|
|
|
|
|
| Portfolio turnover rate |
|
|
31 |
% |
|
|
18 |
% |
|
|
13 |
% |
|
|
12 |
% |
|
|
21 |
% |
|
|
|
|
|
|
|
|
|
|
|
|
|
|
|
|
|
|
|
|
|
| (a) |
Based on average Common Shares outstanding. |
| (b) |
Distributions for annual periods determined in accordance with U.S. federal income tax regulations.
|
| (c) |
Total returns based on market price, which can be significantly greater or less than the net asset value, may result in
substantially different returns. Where applicable, excludes the effects of any sales charges and assumes the reinvestment of distributions at actual reinvestment prices. |
| (d) |
Excludes fees and expenses incurred indirectly as a result of investments in underlying funds. |
| (e) |
Interest expense, fees and amortization of offering costs related to TOB Trusts and/or VRDP Shares. See Note 4 and Note
10 of the Notes to Financial Statements for details. |
| (f) |
The total expense ratio after fees waived and/or reimbursed and excluding interest expense, fees, amortization of
offering costs, liquidity and remarketing fees as follows: |
|
|
|
|
|
|
|
|
|
|
|
|
|
|
|
|
|
|
|
|
|
| |
|
|
|
|
|
| |
|
Year Ended
07/31/23 |
|
|
Year Ended
07/31/22 |
|
|
Year Ended
07/31/21 |
|
|
Year Ended
07/31/20 |
|
|
Year Ended
07/31/19 |
|
|
|
|
|
|
|
| Expense ratios |
|
|
0.95 |
% |
|
|
0.93 |
% |
|
|
0.92 |
% |
|
|
0.93 |
% |
|
|
0.96 |
% |
|
|
|
|
|
|
|
|
|
|
|
|
|
|
|
|
|
|
|
|
|
| (g) |
Calculated by subtracting the Fund’s total liabilities (not including VRDP Shares and TOBs) from the Fund’s
total assets and dividing this by the sum of the amount of TOBs and liquidation value of the VRDP Shares, and by multiplying the results by 100,000. |
| (h) |
Calculated by subtracting the Fund’s total liabilities (not including VRDP Shares) from the Fund’s total
assets and dividing this by the liquidation value of the VRDP Shares, and by multiplying the results by 100,000. |
| (i) |
Effective July 18, 2022, TOB Trust Certificates are treated as senior securities pursuant to Rule 18f-4 of the
1940 Act. Calculated by subtracting the Fund’s total liabilities (not including VRDP Shares and TOBs) from the Fund’s total assets and dividing this by the amount of TOBs, and by multiplying the results by 1,000. |
See notes to financial statements.
|
|
|
| 70 |
|
2 0 2 3 B L A C
K R O C K A N N U A L R E P O R
T T O S H A R E H O L D E R
S |
Financial Highlights (continued)
(For a share outstanding throughout each period)
|
|
|
|
|
|
|
|
|
|
|
|
|
|
|
|
|
|
|
|
|
| |
|
MYI |
|
|
|
|
|
|
|
| |
|
Year Ended
07/31/23 |
|
|
Year Ended
07/31/22 |
|
|
Year Ended
07/31/21 |
|
|
Year Ended
07/31/20 |
|
|
Year Ended
07/31/19 |
|
| |
|
|
|
|
|
| Net asset value, beginning of year |
|
$ |
13.04 |
|
|
$ |
15.64 |
|
|
$ |
15.03 |
|
|
$ |
14.81 |
|
|
$ |
13.98 |
|
|
|
|
|
|
|
|
|
|
|
|
|
|
|
|
|
|
|
|
|
|
|
|
|
|
|
|
| Net investment income(a) |
|
|
0.47 |
|
|
|
0.60 |
|
|
|
0.64 |
|
|
|
0.58 |
|
|
|
0.58 |
|
| Net realized and unrealized gain (loss) |
|
|
(0.49 |
) |
|
|
(2.58 |
) |
|
|
0.57 |
|
|
|
0.17 |
|
|
|
0.85 |
|
|
|
|
|
|
|
|
|
|
|
|
|
|
|
|
|
|
|
|
|
|
|
|
|
|
|
|
| Net increase (decrease) from investment operations |
|
|
(0.02 |
) |
|
|
(1.98 |
) |
|
|
1.21 |
|
|
|
0.75 |
|
|
|
1.43 |
|
|
|
|
|
|
|
|
|
|
|
|
|
|
|
|
|
|
|
|
|
|
|
|
|
|
|
|
| Distributions to Common Shareholders(b) |
|
|
|
|
|
|
|
|
|
|
|
|
|
|
|
| From net investment income |
|
|
(0.51 |
) |
|
|
(0.62 |
) |
|
|
(0.60 |
) |
|
|
(0.53 |
) |
|
|
(0.60 |
) |
| Return of capital |
|
|
(0.00 |
)(c) |
|
|
— |
|
|
|
— |
|
|
|
— |
|
|
|
— |
|
|
|
|
|
|
|
|
|
|
|
|
|
|
|
|
|
|
|
|
|
|
|
|
|
|
|
|
| Total distributions to Common Shareholders |
|
|
(0.51 |
) |
|
|
(0.62 |
) |
|
|
(0.60 |
) |
|
|
(0.53 |
) |
|
|
(0.60 |
) |
|
|
|
|
|
|
|
|
|
|
|
|
|
|
|
|
|
|
|
|
|
|
|
|
|
|
|
| Net asset value, end of year |
|
$ |
12.51 |
|
|
$ |
13.04 |
|
|
$ |
15.64 |
|
|
$ |
15.03 |
|
|
$ |
14.81 |
|
|
|
|
|
|
|
|
|
|
|
|
|
|
|
|
|
|
|
|
|
|
|
|
|
|
|
|
| Market price, end of year |
|
$ |
11.13 |
|
|
$ |
12.24 |
|
|
$ |
15.12 |
|
|
$ |
13.55 |
|
|
$ |
13.44 |
|
|
|
|
|
|
|
|
|
|
|
|
|
|
|
|
|
|
|
|
|
|
|
|
|
|
|
|
| Total Return Applicable to Common
Shareholders(d) |
|
|
|
|
|
|
|
|
|
|
|
|
|
|
|
|
|
|
|
|
| Based on net asset value |
|
|
0.48 |
% |
|
|
(12.66 |
)% |
|
|
8.55 |
% |
|
|
5.61 |
% |
|
|
11.11 |
% |
|
|
|
|
|
|
|
|
|
|
|
|
|
|
|
|
|
|
|
|
|
|
|
|
|
|
|
| Based on market price |
|
|
(4.76 |
)% |
|
|
(15.20 |
)% |
|
|
16.40 |
% |
|
|
4.92 |
% |
|
|
13.13 |
% |
|
|
|
|
|
|
|
|
|
|
|
|
|
|
|
|
|
|
|
|
|
|
|
|
|
|
|
| Ratios to Average Net Assets Applicable to Common Shareholders(e) |
|
|
|
|
|
|
|
|
|
|
|
|
|
|
|
|
|
|
|
|
| Total expenses |
|
|
3.15 |
% |
|
|
1.55 |
% |
|
|
1.37 |
% |
|
|
1.95 |
% |
|
|
2.40 |
% |
|
|
|
|
|
|
|
|
|
|
|
|
|
|
|
|
|
|
|
|
|
|
|
|
|
|
|
| Total expenses after fees waived and/or reimbursed |
|
|
3.15 |
% |
|
|
1.55 |
% |
|
|
1.37 |
% |
|
|
1.95 |
% |
|
|
2.40 |
% |
|
|
|
|
|
|
|
|
|
|
|
|
|
|
|
|
|
|
|
|
|
|
|
|
|
|
|
| Total expenses after fees waived and/or reimbursed and excluding interest expense, fees and amortization of
offering costs(f)(g) |
|
|
0.89 |
% |
|
|
1.14 |
% |
|
|
1.15 |
% |
|
|
1.12 |
% |
|
|
1.03 |
% |
|
|
|
|
|
|
|
|
|
|
|
|
|
|
|
|
|
|
|
|
|
|
|
|
|
|
|
| Net investment income to Common Shareholders |
|
|
3.80 |
% |
|
|
4.18 |
% |
|
|
4.22 |
% |
|
|
3.93 |
% |
|
|
4.16 |
% |
|
|
|
|
|
|
|
|
|
|
|
|
|
|
|
|
|
|
|
|
|
|
|
|
|
|
|
| Supplemental Data |
|
|
|
|
|
|
|
|
|
|
|
|
|
|
|
|
|
|
|
|
| Net assets applicable to Common Shareholders, end of year (000) |
|
$ |
844,604 |
|
|
$ |
888,808 |
|
|
$ |
1,066,013 |
|
|
$ |
1,024,515 |
|
|
$ |
1,009,375 |
|
|
|
|
|
|
|
|
|
|
|
|
|
|
|
|
|
|
|
|
|
|
|
|
|
|
|
|
| VRDP Shares outstanding at $100,000 liquidation value, end of year (000) |
|
$ |
356,400 |
|
|
$ |
356,400 |
|
|
$ |
356,400 |
|
|
$ |
356,400 |
|
|
$ |
356,400 |
|
|
|
|
|
|
|
|
|
|
|
|
|
|
|
|
|
|
|
|
|
|
|
|
|
|
|
|
| Asset coverage per VRDP Shares at $100,000 liquidation value, end of year |
|
$ |
260,885 |
(h) |
|
$ |
248,593 |
(h) |
|
$ |
399,106 |
(i) |
|
$ |
387,462 |
(i) |
|
$ |
383,214 |
(i) |
|
|
|
|
|
|
|
|
|
|
|
|
|
|
|
|
|
|
|
|
|
|
|
|
|
|
|
| TOB Trust Certificates, end of year (000) |
|
$ |
168,574 |
|
|
$ |
241,747 |
|
|
$ |
239,177 |
|
|
$ |
233,968 |
|
|
$ |
246,471 |
|
|
|
|
|
|
|
|
|
|
|
|
|
|
|
|
|
|
|
|
|
|
|
|
|
|
|
|
| Asset coverage per $1,000 of TOB Trust Certificates, end of
year(j) |
|
$ |
8,123 |
|
|
$ |
6,150 |
|
|
|
N/A |
|
|
|
N/A |
|
|
|
N/A |
|
|
|
|
|
|
|
|
|
|
|
|
|
|
|
|
|
|
|
|
|
|
|
|
|
|
|
|
| Portfolio turnover rate |
|
|
49 |
% |
|
|
15 |
% |
|
|
5 |
% |
|
|
18 |
% |
|
|
23 |
% |
|
|
|
|
|
|
|
|
|
|
|
|
|
|
|
|
|
|
|
|
|
| (a) |
Based on average Common Shares outstanding. |
| (b) |
Distributions for annual periods determined in accordance with U.S. federal income tax regulations.
|
| (c) |
Amount is less than $0.005 per share. |
| (d) |
Total returns based on market price, which can be significantly greater or less than the net asset value, may result in
substantially different returns. Where applicable, excludes the effects of any sales charges and assumes the reinvestment of distributions at actual reinvestment prices. |
| (e) |
Excludes fees and expenses incurred indirectly as a result of investments in underlying funds. |
| (f) |
Interest expense, fees and amortization of offering costs related to TOB Trusts and/or VRDP Shares. See Note 4 and Note
10 of the Notes to Financial Statements for details. |
| (g) |
The total expense ratio after fees waived and/or reimbursed and excluding interest expense, fees, amortization of
offering costs, liquidity and remarketing fees as follows: |
|
|
|
|
|
|
|
|
|
|
|
|
|
|
|
|
|
|
|
|
|
| |
|
|
|
|
|
| |
|
Year Ended
07/31/23 |
|
|
Year Ended
07/31/22 |
|
|
Year Ended
07/31/21 |
|
|
Year Ended
07/31/20 |
|
|
Year Ended
07/31/19 |
|
|
|
|
|
|
|
| Expense ratios |
|
|
0.89 |
% |
|
|
0.86 |
% |
|
|
0.85 |
% |
|
|
0.86 |
% |
|
|
1.03 |
% |
|
|
|
|
|
|
|
|
|
|
|
|
|
|
|
|
|
|
|
|
|
| (h) |
Calculated by subtracting the Fund’s total liabilities (not including VRDP Shares and TOBs) from the Fund’s
total assets and dividing this by the sum of the amount of TOBs and liquidation value of the VRDP Shares, and by multiplying the results by 100,000. |
| (i) |
Calculated by subtracting the Fund’s total liabilities (not including VRDP Shares) from the Fund’s total
assets and dividing this by the liquidation value of the VRDP Shares, and by multiplying the results by 100,000. |
| (j) |
Effective July 18, 2022, TOB Trust Certificates are treated as senior securities pursuant to Rule 18f-4 of the
1940 Act. Calculated by subtracting the Fund’s total liabilities (not including VRDP Shares and TOBs) from the Fund’s total assets and dividing this by the amount of TOBs, and by multiplying the results by 1,000. |
See notes to financial statements.
|
|
|
| F I N A N C I A L
H I G H L I G H T S |
|
71 |
Financial Highlights (continued)
(For a share outstanding throughout each period)
|
|
|
|
|
|
|
|
|
|
|
|
|
|
|
|
|
|
|
|
|
| |
|
BNY |
|
|
|
|
|
|
|
| |
|
Year Ended
07/31/23 |
|
|
Year Ended
07/31/22 |
|
|
Year Ended
07/31/21 |
|
|
Year Ended
07/31/20 |
|
|
Year Ended
07/31/19 |
|
| |
|
|
|
|
|
| Net asset value, beginning of year |
|
$ |
12.51 |
|
|
$ |
15.30 |
|
|
$ |
15.09 |
|
|
$ |
15.09 |
|
|
$ |
14.52 |
|
|
|
|
|
|
|
|
|
|
|
|
|
|
|
|
|
|
|
|
|
|
|
|
|
|
|
|
| Net investment income(a) |
|
|
0.40 |
|
|
|
0.57 |
|
|
|
0.66 |
|
|
|
0.61 |
|
|
|
0.58 |
|
| Net realized and unrealized gain (loss) |
|
|
(0.43 |
) |
|
|
(2.73 |
) |
|
|
0.28 |
|
|
|
(0.05 |
) |
|
|
0.52 |
|
|
|
|
|
|
|
|
|
|
|
|
|
|
|
|
|
|
|
|
|
|
|
|
|
|
|
|
| Net increase (decrease) from investment operations |
|
|
(0.03 |
) |
|
|
(2.16 |
) |
|
|
0.94 |
|
|
|
0.56 |
|
|
|
1.10 |
|
|
|
|
|
|
|
|
|
|
|
|
|
|
|
|
|
|
|
|
|
|
|
|
|
|
|
|
| Distributions to Common Shareholders(b) |
|
|
|
|
|
|
|
|
|
|
|
|
|
|
|
| From net investment income |
|
|
(0.36 |
) |
|
|
(0.63 |
) |
|
|
(0.73 |
) |
|
|
(0.56 |
) |
|
|
(0.53 |
) |
| Return of capital |
|
|
(0.07 |
) |
|
|
— |
|
|
|
— |
|
|
|
— |
|
|
|
— |
|
|
|
|
|
|
|
|
|
|
|
|
|
|
|
|
|
|
|
|
|
|
|
|
|
|
|
|
| Total distributions to Common Shareholders |
|
|
(0.43 |
) |
|
|
(0.63 |
) |
|
|
(0.73 |
) |
|
|
(0.56 |
) |
|
|
(0.53 |
) |
|
|
|
|
|
|
|
|
|
|
|
|
|
|
|
|
|
|
|
|
|
|
|
|
|
|
|
| Net asset value, end of year |
|
$ |
12.05 |
|
|
$ |
12.51 |
|
|
$ |
15.30 |
|
|
$ |
15.09 |
|
|
$ |
15.09 |
|
|
|
|
|
|
|
|
|
|
|
|
|
|
|
|
|
|
|
|
|
|
|
|
|
|
|
|
| Market price, end of year |
|
$ |
10.35 |
|
|
$ |
11.46 |
|
|
$ |
15.49 |
|
|
$ |
14.10 |
|
|
$ |
13.81 |
|
|
|
|
|
|
|
|
|
|
|
|
|
|
|
|
|
|
|
|
|
|
|
|
|
|
|
|
| Total Return Applicable to Common
Shareholders(c) |
|
|
|
|
|
|
|
|
|
|
|
|
|
|
|
|
|
|
|
|
| Based on net asset value |
|
|
0.46 |
% |
|
|
(14.24 |
)% |
|
|
6.55 |
% |
|
|
4.12 |
% |
|
|
8.33 |
% |
|
|
|
|
|
|
|
|
|
|
|
|
|
|
|
|
|
|
|
|
|
|
|
|
|
|
|
| Based on market price |
|
|
(5.81 |
)% |
|
|
(22.40 |
)% |
|
|
15.45 |
% |
|
|
6.30 |
% |
|
|
14.88 |
% |
|
|
|
|
|
|
|
|
|
|
|
|
|
|
|
|
|
|
|
|
|
|
|
|
|
|
|
| Ratios to Average Net Assets Applicable to Common Shareholders(d) |
|
|
|
|
|
|
|
|
|
|
|
|
|
|
|
|
|
|
|
|
| Total expenses |
|
|
3.40 |
% |
|
|
1.78 |
% |
|
|
1.74 |
%(e) |
|
|
2.36 |
% |
|
|
2.73 |
% |
|
|
|
|
|
|
|
|
|
|
|
|
|
|
|
|
|
|
|
|
|
|
|
|
|
|
|
| Total expenses after fees waived and/or reimbursed |
|
|
3.40 |
% |
|
|
1.78 |
% |
|
|
1.74 |
%(e) |
|
|
2.36 |
% |
|
|
2.73 |
% |
|
|
|
|
|
|
|
|
|
|
|
|
|
|
|
|
|
|
|
|
|
|
|
|
|
|
|
| Total expenses after fees waived and/or reimbursed and excluding interest expense, fees and amortization of
offering costs(f)(g) |
|
|
1.03 |
% |
|
|
1.03 |
% |
|
|
1.16 |
%(e) |
|
|
1.16 |
% |
|
|
1.14 |
% |
|
|
|
|
|
|
|
|
|
|
|
|
|
|
|
|
|
|
|
|
|
|
|
|
|
|
|
| Net investment income to Common Shareholders |
|
|
3.37 |
% |
|
|
4.12 |
% |
|
|
4.35 |
% |
|
|
4.06 |
% |
|
|
3.98 |
% |
|
|
|
|
|
|
|
|
|
|
|
|
|
|
|
|
|
|
|
|
|
|
|
|
|
|
|
| Supplemental Data |
|
|
|
|
|
|
|
|
|
|
|
|
|
|
|
|
|
|
|
|
| Net assets applicable to Common Shareholders, end of year (000) |
|
$ |
292,957 |
|
|
$ |
308,308 |
|
|
$ |
376,645 |
|
|
$ |
195,844 |
|
|
$ |
195,868 |
|
|
|
|
|
|
|
|
|
|
|
|
|
|
|
|
|
|
|
|
|
|
|
|
|
|
|
|
| VRDP Shares outstanding at $100,000 liquidation value, end of year (000) |
|
$ |
179,400 |
|
|
$ |
179,400 |
|
|
$ |
179,400 |
|
|
$ |
— |
|
|
$ |
— |
|
|
|
|
|
|
|
|
|
|
|
|
|
|
|
|
|
|
|
|
|
|
|
|
|
|
|
|
| Asset coverage per VRDP Shares at $100,000 liquidation value, end of year |
|
$ |
258,872 |
(h) |
|
$ |
237,449 |
(h) |
|
$ |
309,947 |
(i) |
|
$ |
— |
|
|
$ |
— |
|
|
|
|
|
|
|
|
|
|
|
|
|
|
|
|
|
|
|
|
|
|
|
|
|
|
|
|
| VMTP Shares outstanding at $100,000 liquidation value, end of year (000) |
|
$ |
— |
|
|
$ |
— |
|
|
$ |
— |
|
|
$ |
94,500 |
|
|
$ |
94,500 |
|
|
|
|
|
|
|
|
|
|
|
|
|
|
|
|
|
|
|
|
|
|
|
|
|
|
|
|
| Asset coverage per VMTP Shares at $100,000 liquidation value, end of year |
|
$ |
— |
|
|
$ |
— |
|
|
$ |
— |
|
|
$ |
307,243 |
(i) |
|
$ |
307,268 |
(i) |
|
|
|
|
|
|
|
|
|
|
|
|
|
|
|
|
|
|
|
|
|
|
|
|
|
|
|
| TOB Trust Certificates, end of year (000) |
|
$ |
4,998 |
|
|
$ |
44,907 |
|
|
$ |
72,273 |
|
|
$ |
42,523 |
|
|
$ |
35,517 |
|
|
|
|
|
|
|
|
|
|
|
|
|
|
|
|
|
|
|
|
|
|
|
|
|
|
|
|
| Asset coverage per $1,000 of TOB Trust Certificates, end of
year(j) |
|
$ |
95,444 |
|
|
$ |
11,853 |
|
|
|
N/A |
|
|
|
N/A |
|
|
|
N/A |
|
|
|
|
|
|
|
|
|
|
|
|
|
|
|
|
|
|
|
|
|
|
|
|
|
|
|
|
| Portfolio turnover rate |
|
|
37 |
% |
|
|
35 |
% |
|
|
12 |
% |
|
|
17 |
% |
|
|
23 |
% |
|
|
|
|
|
|
|
|
|
|
|
|
|
|
|
|
|
|
|
|
|
| (a) |
Based on average Common Shares outstanding. |
| (b) |
Distributions for annual periods determined in accordance with U.S. federal income tax regulations.
|
| (c) |
Total returns based on market price, which can be significantly greater or less than the net asset value, may result in
substantially different returns. Where applicable, excludes the effects of any sales charges and assumes the reinvestment of distributions at actual reinvestment prices. |
| (d) |
Excludes fees and expenses incurred indirectly as a result of investments in underlying funds. |
| (e) |
Includes non-recurring expenses of reorganization costs. Without these costs, total expenses, total expenses after fees
waived and/or reimbursed and total expenses after fees waived and/or reimbursed and excluding interest expense, fees, and amortization of offering cost would have been 1.69%, 1.69% and 1.11%, respectively. |
| (f) |
Interest expense, fees and amortization of offering costs related to TOB Trusts and/or VRDP/VMTP Shares. See Note 4 and
Note 10 of the Notes to Financial Statements for details. |
| (g) |
The total expense ratio after fees waived and/or reimbursed and excluding interest expense, fees, amortization of
offering costs, liquidity and remarketing fees as follows: |
|
|
|
|
|
|
|
|
|
|
|
|
|
|
|
|
|
|
|
|
|
| |
|
|
|
|
|
| |
|
Year Ended
07/31/23 |
|
|
Year Ended
07/31/22 |
|
|
Year Ended
07/31/21 |
|
|
Year Ended
07/31/20 |
|
|
Year Ended
07/31/19 |
|
|
|
|
|
|
|
| Expense ratios |
|
|
1.02 |
% |
|
|
1.02 |
% |
|
|
— |
% |
|
|
— |
% |
|
|
— |
% |
|
|
|
|
|
|
|
|
|
|
|
|
|
|
|
|
|
|
|
|
|
| (h) |
Calculated by subtracting the Fund’s total liabilities (not including VRDP Shares and TOBs) from the Fund’s
total assets and dividing this by the sum of the amount of TOBs and liquidation value of the VRDP Shares, and by multiplying the results by 100,000. |
| (i) |
Calculated by subtracting the Fund’s total liabilities (not including VRDP/VMTP Shares) from the Fund’s total
assets and dividing this by the liquidation value of the VRDP/VMTP Shares, and by multiplying the results by 100,000. |
| (j) |
Effective July 18, 2022, TOB Trust Certificates are treated as senior securities pursuant to Rule 18f-4 of the
1940 Act. Calculated by subtracting the Fund’s total liabilities (not including VRDP Shares and TOBs) from the Fund’s total assets and dividing this by the amount of TOBs, and by multiplying the results by 1,000. |
See notes to financial statements.
|
|
|
| 72 |
|
2 0 2 3 B L A C
K R O C K A N N U A L R E P O R
T T O S H A R E H O L D E R
S |
Notes to Financial Statements
The following are registered under the Investment Company Act of 1940, as amended (the “1940 Act”), as closed-end management investment
companies and are referred to herein collectively as the “Funds”, or individually as a “Fund”:
|
|
|
|
|
|
|
|
|
|
|
| |
|
|
|
| Fund Name |
|
Herein Referred To As |
|
|
Organized |
|
|
Diversification
Classification |
| BlackRock MuniHoldings New Jersey Quality Fund, Inc. |
|
|
MUJ |
|
|
|
Maryland |
|
|
Non-diversified |
| BlackRock MuniYield Michigan Quality Fund, Inc. |
|
|
MIY |
|
|
|
Maryland |
|
|
Non-diversified |
| BlackRock MuniYield New York Quality Fund, Inc. |
|
|
MYN |
|
|
|
Maryland |
|
|
Non-diversified |
| BlackRock MuniYield Pennsylvania Quality Fund |
|
|
MPA |
|
|
|
Massachusetts |
|
|
Non-diversified |
| BlackRock MuniYield Quality Fund III, Inc. |
|
|
MYI |
|
|
|
Maryland |
|
|
Diversified |
| BlackRock New York Municipal Income Trust |
|
|
BNY |
|
|
|
Delaware |
|
|
Diversified |
The Boards of Directors and Boards of Trustees of the Funds are collectively referred to throughout this report as the
“Board,” and the directors/trustees thereof are collectively referred to throughout this report as “Directors”. The Funds determine and make available for publication the net asset values (“NAVs”) of their Common Shares
on a daily basis.
The Funds, together with certain other registered investment companies advised by BlackRock Advisors, LLC (the “Manager”)
or its affiliates, are included in a complex of funds referred to as the BlackRock Fixed-Income Complex.
Prior Year Reorganization: The Board
and shareholders of MUJ (the “Acquiring Fund”) and the Board and shareholders of BlackRock MuniYield New Jersey Fund (“MYJ”), (the “Target Fund”) approved the reorganization of the Target Fund into the Acquiring Fund.
As a result, the Acquiring Fund acquired substantially all of the assets and assumed substantially all of the liabilities of the Target Fund in exchange for an equal aggregate value of newly-issued Common Shares and Preferred Shares of the Acquiring
Fund.
Each Common Shareholder of the Target Fund received Common Shares of the Acquiring Fund in an amount equal to the aggregate NAV of such Common
Shareholder’s Target Fund Common Shares, as determined at the close of business on April 8, 2022, less the costs of the Target Fund’s reorganization. Cash was distributed for any fractional shares.
Each Preferred Shareholder of the Target Fund received Preferred Shares of the Acquiring Fund in an amount equal to the aggregate liquidation preference
of the Target Fund’s Preferred Shares held by such Preferred Shareholder prior to the Target Fund’s reorganization.
The reorganizations
were accomplished by a tax-free exchange of Common Shares and Preferred Shares of the Acquiring Fund in the following amounts and at the following conversion ratios:
|
|
|
|
|
|
|
|
|
|
|
|
|
|
|
|
|
|
|
|
|
| |
|
| Target Funds |
|
Target
Fund’s
Share
Class |
|
|
Shares Prior to
Reorganization |
|
|
Conversion
Ratio |
|
|
MUJ’s
Share
Class |
|
|
Shares of
MUJ |
|
| |
|
| MYJ |
|
|
Common |
|
|
|
24,124,417 |
|
|
|
1.01086784 |
|
|
|
Common |
|
|
|
24,386,556(a) |
|
| MYJ |
|
|
VRDP |
|
|
|
1,800 |
|
|
|
1 |
|
|
|
VRDP |
|
|
|
1,800 |
|
| |
|
| |
(a) |
Net of fractional shares redeemed. |
|
The Target Fund’s net assets and composition of net assets on April 8, 2022, the valuation date of the
reorganization, were as follows:
|
|
|
|
|
| |
|
| |
|
Target Fund |
|
| |
|
| Net assets applicable to Common Shareholders |
|
$ |
338,609,074 |
|
| Paid-in-capital |
|
|
345,890,140 |
|
| Accumulated loss |
|
|
(7,281,066 |
) |
| |
|
For financial reporting purposes, assets received and shares issued by the Acquiring Fund were recorded at fair value.
However, the cost basis of the investments received from the Target Fund was carried forward to align ongoing reporting of the Acquiring Fund’s realized and unrealized gains and losses with amounts distributable to shareholders for tax
purposes.
The net assets applicable to Common Shareholders of the Acquiring Fund before the reorganization were $417,894,578. The aggregate net
assets applicable to Common Shareholders of the Acquiring Fund immediately after the reorganizations amounted to $756,503,652. The Target Fund’s fair value and cost of financial instruments prior to the reorganization were as follows:
|
|
|
|
|
|
|
|
|
|
|
|
|
|
|
|
|
| |
|
| Target Funds |
|
Fair Value of
Investments |
|
|
Cost of
Investments |
|
|
TOB Trust
Certificates |
|
|
Preferred
Shares Value |
|
| |
|
| MYJ |
|
$ |
563,940,361 |
|
|
$ |
565,420,468 |
|
|
$ |
52,481,953 |
|
|
$ |
180,000,000 |
|
| |
|
The purpose of these transactions was to combine two funds managed by the Manager with similar investment objectives,
investment policies, strategies, risks and restrictions. The reorganization was a tax-free event and was effective on April 11, 2022.
|
|
|
| N O T E S T O F I
N A N C I A L S T A T E M E N
T S |
|
73 |
Notes to Financial Statements (continued)
Assuming the reorganization
had been completed on August 1, 2021, the beginning of the fiscal reporting period of the Acquiring Fund, the pro forma results of operations for the year ended July 31, 2022, were as follows:
•Net investment income (loss): $35,270,330
•Net realized and change in unrealized gain/loss on investments: $(139,323,174)
•Net decrease in net assets resulting from operations: $(104,052,844)
Because the combined investment portfolios have been managed as a single integrated portfolio since the reorganization was completed, it is not
practicable to separate the amounts of revenue and earnings of the Target Fund that have been included in the Acquiring Fund’s Statements of Operations since April 11, 2022.
Reorganization costs incurred by MUJ in connection with the reorganization were expensed by MUJ. The Manager reimbursed MUJ $161,495.
| 2. |
SIGNIFICANT ACCOUNTING POLICIES |
The financial statements are prepared in conformity with accounting principles generally accepted in the United States of America (“U.S.
GAAP”), which may require management to make estimates and assumptions that affect the reported amounts of assets and liabilities in the financial statements, disclosure of contingent assets and liabilities at the date of the financial
statements and the reported amounts of increases and decreases in net assets from operations during the reporting period. Actual results could differ from those estimates. Each Fund is considered an investment company under U.S. GAAP and follows the
accounting and reporting guidance applicable to investment companies. Below is a summary of significant accounting policies:
Investment
Transactions and Income Recognition: For financial reporting purposes, investment transactions are recorded on the dates the transactions are executed. Realized gains and losses on investment transactions are determined using the specific
identification method. Dividend income and capital gain distributions, if any, are recorded on the ex-dividend dates. Non-cash dividends, if any, are recorded on the ex-dividend dates at fair value. Interest income, including amortization and
accretion of premiums and discounts on debt securities, is recognized daily on an accrual basis.
Collateralization: If required by an exchange
or counterparty agreement, the Funds may be required to deliver/deposit cash and/or securities to/with an exchange, or broker-dealer or custodian as collateral for certain investments.
Distributions: Distributions from net investment income are declared and paid monthly. Distributions of capital gains are recorded on the
ex-dividend dates and made at least annually. The portion of distributions, if any, that exceeds a fund’s current and accumulated earnings and profits, as measured on a tax basis, constitute a non-taxable return of capital. The character and
timing of distributions are determined in accordance with U.S. federal income tax regulations, which may differ from U.S. GAAP.
Distributions to Preferred
Shareholders are accrued and determined as described in Note 10.
Deferred Compensation Plan: Under the Deferred Compensation Plan (the
“Plan”) approved by each Board, the directors who are not “interested persons” of the Funds, as defined in the 1940 Act (“Independent Directors”), may defer a portion of their annual complex-wide compensation. Deferred
amounts earn an approximate return as though equivalent dollar amounts had been invested in common shares of certain funds in the BlackRock Fixed-Income Complex selected by the Independent Directors. This has the same economic effect for the
Independent Directors as if the Independent Directors had invested the deferred amounts directly in certain funds in the BlackRock Fixed-Income Complex.
The Plan is not funded and obligations thereunder represent general unsecured claims against the general assets of each Fund, as applicable. Deferred
compensation liabilities, if any, are included in the Directors’ and Officer’s fees payable in the Statements of Assets and Liabilities and will remain as a liability of the Funds until such amounts are distributed in accordance with the
Plan. Net appreciation (depreciation) in the value of participants’ deferral accounts is allocated among the participating funds in the BlackRock Fixed-Income Complex and reflected as Directors and Officer expense on the Statements of
Operations. The Directors and Officer expense may be negative as a result of a decrease in value of the deferred accounts.
Indemnifications:
In the normal course of business, a Fund enters into contracts that contain a variety of representations that provide general indemnification. A Fund’s maximum exposure under these arrangements is unknown because it involves future
potential claims against a Fund, which cannot be predicted with any certainty.
Other: Expenses directly related to a Fund are charged to that
Fund. Other operating expenses shared by several funds, including other funds managed by the Manager, are prorated among those funds on the basis of relative net assets or other appropriate methods.
| 3. |
INVESTMENT VALUATION AND FAIR VALUE MEASUREMENTS |
Investment Valuation Policies: Each Fund’s investments are valued at fair value (also referred to as “market value” within the
financial statements) each day that the Fund is open for business and, for financial reporting purposes, as of the report date. U.S. GAAP defines fair value as the price a fund would receive to sell an asset or pay to transfer a liability in an
orderly transaction between market participants at the measurement date. The Board has approved the designation of each Fund’s Manager as the valuation designee for each Fund. Each Fund determines the fair values of its financial instruments
using various independent dealers or pricing services under the Manager’s policies. If a security’s market price is not readily available or does not otherwise accurately represent the fair value of the security, the security will be
valued in accordance with the Manager’s policies and procedures as reflecting fair value. The Manager has formed a committee (the “Valuation Committee”) to develop pricing policies and procedures and to oversee the pricing function
for all financial instruments, with assistance from other BlackRock pricing committees.
|
|
|
| 74 |
|
2 0 2 3 B L A C
K R O C K A N N U A L R E P O R
T T O S H A R E H O L D E R
S |
Notes to Financial Statements (continued)
Fair Value Inputs and
Methodologies: The following methods and inputs are used to establish the fair value of each Fund’s assets and liabilities:
| |
• |
|
Fixed-income investments for which market quotations are readily available are generally valued using the last available
bid price or current market quotations provided by independent dealers or third-party pricing services. Pricing services generally value fixed-income securities assuming orderly transactions of an institutional round lot size, but a fund may hold or
transact in such securities in smaller, odd lot sizes. Odd lots may trade at lower prices than institutional round lots. The pricing services may use matrix pricing or valuation models that utilize certain inputs and assumptions to derive values,
including transaction data (e.g., recent representative bids and offers), market data, credit quality information, perceived market movements, news, and other relevant information. Certain fixed-income securities, including asset-backed and mortgage
related securities may be valued based on valuation models that consider the estimated cash flows of each tranche of the entity, establish a benchmark yield and develop an estimated tranche specific spread to the benchmark yield based on the unique
attributes of the tranche. The amortized cost method of valuation may be used with respect to debt obligations with sixty days or less remaining to maturity unless the Manager determines such method does not represent fair value.
|
| |
• |
|
Investments in open-end U.S. mutual funds (including money market funds) are valued at that day’s published NAV.
|
| |
• |
|
Futures contracts are valued based on that day’s last reported settlement or trade price on the exchange where the
contract is traded. |
If events (e.g., market volatility, company announcement or a natural disaster) occur that are expected to
materially affect the value of such investment, or in the event that application of these methods of valuation results in a price for an investment that is deemed not to be representative of the market value of such investment, or if a price is not
available, the investment will be valued by the Valuation Committee in accordance with the Manager’s policies and procedures as reflecting fair value (“Fair Valued Investments”). The fair valuation approaches that may be used by the
Valuation Committee include market approach, income approach and cost approach. Valuation techniques such as discounted cash flow, use of market comparables and matrix pricing are types of valuation approaches and are typically used in determining
fair value. When determining the price for Fair Valued Investments, the Valuation Committee seeks to determine the price that each Fund might reasonably expect to receive or pay from the current sale or purchase of that asset or liability in an
arm’s-length transaction. Fair value determinations shall be based upon all available factors that the Valuation Committee deems relevant and consistent with the principles of fair value measurement.
Fair Value Hierarchy: Various inputs are used in determining the fair value of financial instruments. These inputs to valuation techniques are
categorized into a fair value hierarchy consisting of three broad levels for financial reporting purposes as follows:
| |
• |
|
Level 1 – Unadjusted price quotations in active markets/exchanges for identical assets or liabilities that each Fund
has the ability to access; |
| |
• |
|
Level 2 – Other observable inputs (including, but not limited to, quoted prices for similar assets or liabilities in
markets that are active, quoted prices for identical or similar assets or liabilities in markets that are not active, inputs other than quoted prices that are observable for the assets or liabilities (such as interest rates, yield curves,
volatilities, prepayment speeds, loss severities, credit risks and default rates) or other market–corroborated inputs); and |
| |
• |
|
Level 3 – Unobservable inputs based on the best information available in the circumstances, to the extent observable
inputs are not available (including the Valuation Committee’s assumptions used in determining the fair value of financial instruments). |
The hierarchy gives the highest priority to unadjusted quoted prices in active markets for identical assets or liabilities (Level 1 measurements) and the
lowest priority to unobservable inputs (Level 3 measurements). Accordingly, the degree of judgment exercised in determining fair value is greatest for instruments categorized in Level 3. The inputs used to measure fair value may fall into different
levels of the fair value hierarchy. In such cases, for disclosure purposes, the fair value hierarchy classification is determined based on the lowest level input that is significant to the fair value measurement in its entirety. Investments
classified within Level 3 have significant unobservable inputs used by the Valuation Committee in determining the price for Fair Valued Investments. Level 3 investments include equity or debt issued by privately held companies or funds that may not
have a secondary market and/or may have a limited number of investors. The categorization of a value determined for financial instruments is based on the pricing transparency of the financial instruments and is not necessarily an indication of the
risks associated with investing in those securities.
| 4. |
SECURITIES AND OTHER INVESTMENTS |
Zero-Coupon Bonds: Zero-coupon bonds are normally issued at a significant discount from face value and do not provide for periodic interest
payments. These bonds may experience greater volatility in market value than other debt obligations of similar maturity which provide for regular interest payments.
Forward Commitments, When-Issued and Delayed Delivery Securities: The Funds may purchase securities on a when-issued basis and may purchase or sell
securities on a forward commitment basis. Settlement of such transactions normally occurs within a month or more after the purchase or sale commitment is made. The Funds may purchase securities under such conditions with the intention of actually
acquiring them but may enter into a separate agreement to sell the securities before the settlement date. Since the value of securities purchased may fluctuate prior to settlement, the Funds may be required to pay more at settlement than the
security is worth. In addition, a fund is not entitled to any of the interest earned prior to settlement. When purchasing a security on a delayed delivery basis, the Funds assume the rights and risks of ownership of the security, including the risk
of price and yield fluctuations. In the event of default by the counterparty, the Funds’ maximum amount of loss is the unrealized appreciation of unsettled when-issued transactions.
Municipal Bonds Transferred to TOB Trusts: The Funds leverage their assets through the use of “TOB Trust” transactions. The funds
transfer municipal bonds into a special purpose trust (a “TOB Trust”). A TOB Trust issues two classes of beneficial interests: short-term floating rate interests (“TOB Trust Certificates”), which are sold to third-party
investors, and residual inverse floating rate interests (“TOB Residuals”), which are issued to the participating funds that contributed the municipal bonds to the TOB Trust. The TOB Trust Certificates have interest rates that reset weekly
and their holders have the option to tender such certificates to the TOB Trust for redemption at par and any accrued interest at each reset date. The TOB Residuals held by a fund provide the fund with the right to cause the holders of a proportional
share of the TOB Trust Certificates to tender their certificates to the TOB Trust at par plus accrued interest. The funds may withdraw a corresponding share of the municipal bonds from the TOB Trust. Other funds
|
|
|
| N O T E S T O F I
N A N C I A L S T A T E M E N
T S |
|
75 |
Notes to Financial Statements (continued)
managed by the investment
adviser may also contribute municipal bonds to a TOB Trust into which a fund has contributed bonds. If multiple BlackRock-advised funds participate in the same TOB Trust, the economic rights and obligations under the TOB Residuals will be shared
among the funds ratably in proportion to their participation in the TOB Trust.
TOB Trusts are supported by a liquidity facility provided by a
third-party bank or other financial institution (the “Liquidity Provider”) that allows the holders of the TOB Trust Certificates to tender their certificates in exchange for payment of par plus accrued interest on any business day. The
tendered TOB Trust Certificates are remarketed by a Remarketing Agent. In the event of a failed remarketing, the TOB Trust may draw upon a loan from the Liquidity Provider to purchase the tendered TOB Trust Certificates. Any loans made by the
Liquidity Provider will be secured by the purchased TOB Trust Certificates held by the TOB Trust and will be subject to an increased interest rate based on number of days the loan is outstanding.
The TOB Trust may be collapsed without the consent of a fund, upon the occurrence of a termination event as defined in the TOB Trust agreement. Upon the
occurrence of a termination event, a TOB Trust would be liquidated with the proceeds applied first to any accrued fees owed to the trustee of the TOB Trust, the Remarketing Agent and the Liquidity Provider. Upon certain termination events, TOB Trust
Certificates holders will be paid before the TOB Residuals holders (i.e., the Funds) whereas in other termination events, TOB Trust Certificates holders and TOB Residuals holders will be paid pro rata.
While a fund’s investment policies and restrictions expressly permit investments in inverse floating rate securities, such as TOB Residuals, they
restrict the ability of a fund to borrow money for purposes of making investments. MIY’s, MYN’s, MPA’s and MYI’s management believes that a fund’s restrictions on borrowings do not apply to the Funds’ TOB Trust
transactions. Each Fund’s transfer of the municipal bonds to a TOB Trust is considered a secured borrowing for financial reporting purposes. The cash received by the TOB Trust from the sale of the TOB Trust Certificates, less certain
transaction expenses, is paid to a Fund. A Fund typically invests the cash received in additional municipal bonds.
Accounting for TOB Trusts:
The municipal bonds deposited into a TOB Trust are presented in a Fund’s Schedule of Investments and the TOB Trust Certificates are shown in Other Liabilities in the Statements of Assets and Liabilities. Any loans drawn by the TOB Trust
pursuant to the liquidity facility to purchase tendered TOB Trust Certificates are shown as Loan for TOB Trust Certificates. The carrying amount of a Fund’s payable to the holder of the TOB Trust Certificates, as reported in the Statements of
Assets and Liabilities as TOB Trust Certificates, approximates its fair value.
Interest income, including amortization and accretion of premiums and
discounts, from the underlying municipal bonds is recorded by a Fund on an accrual basis. Interest expense incurred on the TOB Trust transaction and other expenses related to remarketing, administration, trustee, liquidity and other services to a
TOB Trust are shown as interest expense, fees and amortization of offering costs in the Statements of Operations. Fees paid upon creation of the TOB Trust are recorded as debt issuance costs and are amortized to interest expense, fees and
amortization of offering costs in the Statements of Operations to the expected maturity of the TOB Trust. In connection with the restructurings of the TOB Trusts to non-bank sponsored TOB Trusts, a Fund incurred non-recurring, legal and
restructuring fees, which are recorded as interest expense, fees and amortization of offering costs in the Statements of Operations. Amounts recorded within interest expense, fees and amortization of offering costs in the Statements of Operations
are:
|
|
|
|
|
|
|
|
|
|
|
|
|
|
|
|
|
| |
|
| Fund Name |
|
Interest Expense |
|
|
Liquidity Fees |
|
|
Other Expenses |
|
|
Total |
|
| |
|
| MUJ |
|
$ |
779,882 |
|
|
$ |
142,311 |
|
|
$ |
44,508 |
|
|
$ |
966,701 |
|
| MIY |
|
|
422,988 |
|
|
|
70,621 |
|
|
|
21,202 |
|
|
|
514,811 |
|
| MYN |
|
|
715,919 |
|
|
|
111,663 |
|
|
|
35,662 |
|
|
|
863,244 |
|
| MPA |
|
|
445,615 |
|
|
|
80,143 |
|
|
|
21,134 |
|
|
|
546,892 |
|
| MYI |
|
|
5,119,337 |
|
|
|
770,743 |
|
|
|
220,264 |
|
|
|
6,110,344 |
|
| BNY |
|
|
359,570 |
|
|
|
65,017 |
|
|
|
20,260 |
|
|
|
444,847 |
|
| |
|
For the year ended July 31, 2023, the following table is a summary of each Fund’s TOB Trusts:
|
|
|
|
|
|
|
|
|
|
|
|
|
|
|
|
|
|
|
|
|
| |
|
| Fund Name |
|
|
Underlying
Municipal Bonds
Transferred to
TOB Trusts |
(a) |
|
|
Liability for
TOB Trust
Certificates |
(b) |
|
|
Range of
Interest Rates
on TOB Trust
Certificates at
Period End |
|
|
|
Average
TOB Trust
Certificates
Outstanding |
|
|
|
Daily Weighted
Average Rate
of Interest and
Other Expenses
on TOB Trusts |
|
| |
|
| MUJ |
|
$ |
36,347,405 |
|
|
$ |
22,059,998 |
|
|
|
4.01% — 4.18 |
% |
|
$ |
31,265,168 |
|
|
|
3.09% |
|
| MIY |
|
|
13,372,012 |
|
|
|
6,333,877 |
|
|
|
4.01 — 4.01 |
|
|
|
17,375,984 |
|
|
|
2.96 |
|
| MYN |
|
|
38,848,186 |
|
|
|
19,231,092 |
|
|
|
4.01 — 4.05 |
|
|
|
28,685,007 |
|
|
|
3.00 |
|
| MPA |
|
|
24,618,891 |
|
|
|
14,060,000 |
|
|
|
4.01 — 4.04 |
|
|
|
17,389,145 |
|
|
|
3.15 |
|
| MYI |
|
|
339,036,909 |
|
|
|
168,574,218 |
|
|
|
3.98 — 4.13 |
|
|
|
191,717,855 |
|
|
|
3.18 |
|
| BNY |
|
|
9,692,708 |
|
|
|
4,998,266 |
|
|
|
4.01 — 4.05 |
|
|
|
15,623,669 |
|
|
|
2.83 |
|
| |
|
| |
(a) |
The municipal bonds transferred to a TOB Trust are generally high grade municipal bonds. In certain cases, when
municipal bonds transferred are lower grade municipal bonds, the TOB Trust transaction may include a credit enhancement feature that provides for the timely payment of principal and interest on the bonds to the TOB Trust by a credit enhancement
provider in the event of default of the municipal bond. The TOB Trust would be responsible for the payment of the credit enhancement fee and the Funds, as TOB Residuals holders, would be responsible for reimbursement of any payments of principal and
interest made by the credit enhancement provider. The maximum potential amounts owed by the Funds, for such reimbursements, as applicable, are included in the maximum potential amounts disclosed for recourse TOB Trusts in the Schedules of
Investments. |
|
|
|
|
| 76 |
|
2 0 2 3 B L A C
K R O C K A N N U A L R E P O R
T T O S H A R E H O L D E R
S |
Notes to Financial Statements (continued)
| |
(b) |
TOB Trusts may be structured on a non-recourse or recourse basis. When a Fund invests in TOB Trusts on a non-recourse
basis, the Liquidity Provider may be required to make a payment under the liquidity facility to allow the TOB Trust to repurchase TOB Trust Certificates. The Liquidity Provider will be reimbursed from the liquidation of bonds held in the TOB Trust.
If a Fund invests in a TOB Trust on a recourse basis, a Fund enters into a reimbursement agreement with the Liquidity Provider where a Fund is required to reimburse the Liquidity Provider for any shortfall between the amount paid by the Liquidity
Provider and proceeds received from liquidation of municipal bonds held in the TOB Trust (the “Liquidation Shortfall”). As a result, if a Fund invests in a recourse TOB Trust, a Fund will bear the risk of loss with respect to any
Liquidation Shortfall. If multiple funds participate in any such TOB Trust, these losses will be shared ratably, including the maximum potential amounts owed by a Fund at July 31, 2023, in proportion to their participation in the TOB Trust. The
recourse TOB Trusts are identified in the Schedules of Investments including the maximum potential amounts owed by a Fund at July 31, 2023. |
|
For the year ended July 31, 2023, the following table is a summary of each Fund’s Loan for TOB Trust Certificates:
|
|
|
|
|
|
|
|
|
|
|
|
|
|
|
| |
| Fund Name |
|
Loans
Outstanding
at Period End |
|
|
Range of
Interest Rates
on Loans at
Period End |
|
|
Average
Loans
Outstanding |
|
|
Daily Weighted
Average Rate
of Interest and
Other Expenses
on Loans |
| |
| MYN |
|
$ |
— |
|
|
|
— |
% |
|
$ |
57,917 |
|
|
0.71% |
| MYI |
|
|
— |
|
|
|
— |
|
|
|
449,787 |
|
|
0.67 |
| BNY |
|
|
— |
|
|
|
— |
|
|
|
66,391 |
|
|
0.71 |
| |
| 5. |
DERIVATIVE FINANCIAL INSTRUMENTS |
The Funds engage in various portfolio investment strategies using derivative contracts both to increase the returns of the Funds and/or to manage their
exposure to certain risks such as credit risk, equity risk, interest rate risk, foreign currency exchange rate risk, commodity price risk or other risks (e.g., inflation risk). Derivative financial instruments categorized by risk exposure are
included in the Schedules of Investments. These contracts may be transacted on an exchange or over-the-counter (“OTC”).
Futures
Contracts: Futures contracts are purchased or sold to gain exposure to, or manage exposure to, changes in interest rates (interest rate risk) and changes in the value of equity securities (equity risk) or foreign currencies (foreign currency
exchange rate risk).
Futures contracts are exchange-traded agreements between the Funds and a counterparty to buy or sell a specific quantity of an
underlying instrument at a specified price and on a specified date. Depending on the terms of a contract, it is settled either through physical delivery of the underlying instrument on the settlement date or by payment of a cash amount on the
settlement date. Upon entering into a futures contract, the Funds are required to deposit initial margin with the broker in the form of cash or securities in an amount that varies depending on a contract’s size and risk profile. The initial
margin deposit must then be maintained at an established level over the life of the contract. Amounts pledged, which are considered restricted, are included in cash pledged for futures contracts in the Statements of Assets and Liabilities.
Securities deposited as initial margin are designated in the Schedules of Investments and cash deposited, if any, are shown as cash pledged for futures
contracts in the Statements of Assets and Liabilities. Pursuant to the contract, the Funds agree to receive from or pay to the broker an amount of cash equal to the daily fluctuation in market value of the contract (“variation margin”).
Variation margin is recorded as unrealized appreciation (depreciation) and, if any, shown as variation margin receivable (or payable) on futures contracts in the Statements of Assets and Liabilities. When the contract is closed, a realized gain or
loss is recorded in the Statements of Operations equal to the difference between the notional amount of the contract at the time it was opened and the notional amount at the time it was closed. The use of futures contracts involves the risk of an
imperfect correlation in the movements in the price of futures contracts and interest rates, foreign currency exchange rates or underlying assets.
| 6. |
INVESTMENT ADVISORY AGREEMENT AND OTHER TRANSACTIONS WITH AFFILIATES |
Investment Advisory: Each Fund entered into an Investment Advisory Agreement with the Manager, the Funds’ investment adviser and an indirect,
wholly-owned subsidiary of BlackRock, Inc. (“BlackRock”), to provide investment advisory and administrative services. The Manager is responsible for the management of each Fund’s portfolio and provides the personnel, facilities,
equipment and certain other services necessary to the operations of each Fund.
For such services, each Fund, except BNY, pays the Manager a monthly
fee at an annual rate equal to the following percentages of the average daily value of each Fund’s net assets:
|
|
|
|
|
|
|
|
|
|
|
|
|
|
|
|
|
|
|
|
|
| |
|
|
|
|
|
| |
|
MUJ |
|
|
MIY |
|
|
MYN |
|
|
MPA |
|
|
MYI |
|
| Investment advisory fees |
|
|
0.50 |
% |
|
|
0.49 |
% |
|
|
0.50 |
% |
|
|
0.49 |
% |
|
|
0.50 |
% |
For purposes of calculating these fees, for each Fund except for BNY, “net assets” mean the total assets of the
Fund minus the sum of its accrued liabilities (which does not include liabilities represented by TOB Trusts and the liquidation preference of any outstanding preferred shares). It is understood that the liquidation preference of any outstanding
preferred stock (other than accumulated dividends) and TOB Trusts is not considered a liability in determining a Fund’s NAV.
For such services,
BNY pays the Manager a monthly fee at an annual rate equal to 0.55% of the average weekly value of the Fund’s managed assets.
For purposes of
calculating these fees, for BNY, “managed assets” are determined as total assets of the Fund (including any assets attributable to money borrowed for investment purposes) less the sum of its accrued liabilities (other than money borrowed
for investment purposes).
Expense Waivers and Reimbursements: With respect to each Fund, the Manager contractually agreed to waive its
investment advisory fees by the amount of investment advisory fees each Fund pays to the Manager indirectly through its investment in affiliated money market funds (the “affiliated money market fund waiver”) through June 30,
|
|
|
| N O T E S T O F I
N A N C I A L S T A T E M E N
T S |
|
77 |
Notes to Financial Statements (continued)
2025. The contractual
agreement may be terminated upon 90 days’ notice by a majority of the Independent Directors, or by a vote of a majority of the outstanding voting securities of a Fund. These amounts are included in fees waived and/or reimbursed by the Manager
in the Statements of Operations. For the year ended July 31, 2023, the amounts waived were as follows:
|
|
|
|
|
| |
|
| Fund Name |
|
Fees Waived and/or Reimbursed
by the Manager |
|
| |
|
| MUJ |
|
$ |
53,302 |
|
| MIY |
|
|
6,993 |
|
| MYN |
|
|
3,033 |
|
| MPA |
|
|
11,397 |
|
| MYI |
|
|
13,352 |
|
| BNY |
|
|
3,481 |
|
| |
|
The Manager has contractually agreed to waive its investment advisory fee with respect to any portion of each Fund’s
assets invested in affiliated equity and fixed-income mutual funds and affiliated exchange-traded funds that have a contractual management fee through June 30, 2025. The agreement can be renewed for annual periods thereafter, and may be
terminated on 90 days’ notice, each subject to approval by a majority of the Funds’ Independent Directors. For the year ended July 31, 2023, there were no fees waived by the Manager pursuant to this arrangement.
Directors and Officers: Certain directors and/or officers of the Funds are directors and/or officers of BlackRock or its affiliates. The Funds
reimburse the Manager for a portion of the compensation paid to the Funds’ Chief Compliance Officer, which is included in Directors and Officer in the Statements of Operations.
For the year ended July 31, 2023, purchases and sales of investments, excluding short-term securities, were as follows:
|
|
|
|
|
|
|
|
|
| |
|
| Fund Name |
|
Purchases |
|
|
Sales |
|
| |
|
| MUJ |
|
$ |
184,056,883 |
|
|
$ |
312,742,464 |
|
| MIY |
|
|
229,457,053 |
|
|
|
286,065,434 |
|
| MYN |
|
|
288,696,285 |
|
|
|
338,655,112 |
|
| MPA |
|
|
80,756,704 |
|
|
|
122,439,306 |
|
| MYI |
|
|
672,000,537 |
|
|
|
757,617,802 |
|
| BNY |
|
|
174,999,559 |
|
|
|
219,207,804 |
|
| |
|
| 8. |
INCOME TAX INFORMATION |
It is each Fund’s policy to comply with the requirements of the Internal Revenue Code of 1986, as amended, applicable to regulated investment
companies, and to distribute substantially all of its taxable income to its shareholders. Therefore, no U.S. federal income tax provision is required.
Each Fund files U.S. federal and various state and local tax returns. No income tax returns are currently under examination. The statute of limitations on
each Fund’s U.S. federal tax returns generally remains open for a period of three years after they are filed. The statutes of limitations on each Fund’s state and local tax returns may remain open for an additional year depending upon the
jurisdiction.
Management has analyzed tax laws and regulations and their application to the Funds as of July 31, 2023, inclusive of the open tax
return years, and does not believe that there are any uncertain tax positions that require recognition of a tax liability in the Funds’ financial statements.
U.S. GAAP requires that certain components of net assets be adjusted to reflect permanent differences between financial and tax reporting. These
reclassifications have no effect on net assets or NAVs per share. As of period end, permanent differences attributable to non-deductible expenses were reclassified to the following accounts:
|
|
|
|
|
|
|
|
|
| |
|
| Fund Name |
|
Paid-in Capital |
|
|
Accumulated
Earnings (Loss) |
|
| |
|
| MUJ |
|
$ |
(39,845 |
) |
|
$ |
39,845 |
|
| MYN |
|
|
(20,102 |
) |
|
|
20,102 |
|
| MPA |
|
|
(12,604 |
) |
|
|
12,604 |
|
| MYI |
|
|
(26,899 |
) |
|
|
26,899 |
|
| BNY |
|
|
(18,270 |
) |
|
|
18,270 |
|
| |
|
The tax character of distributions paid was as follows:
|
|
|
|
|
|
|
|
|
| |
|
| Fund Name |
|
Year Ended
07/31/23 |
|
|
Year Ended
07/31/22 |
|
| |
|
| MUJ |
|
|
|
|
|
|
|
|
| Tax-exempt income |
|
$ |
38,967,039 |
|
|
$ |
30,943,538 |
|
| Ordinary income |
|
|
48,253 |
|
|
|
7,045 |
|
| Return of capital |
|
|
5,140,445 |
|
|
|
— |
|
|
|
|
|
|
|
|
|
|
|
|
$ |
44,155,737 |
|
|
$ |
30,950,583 |
|
|
|
|
|
|
|
|
|
|
|
|
|
| 78 |
|
2 0 2 3 B L A C
K R O C K A N N U A L R E P O R
T T O S H A R E H O L D E R
S |
Notes to Financial Statements (continued)
|
|
|
|
|
|
|
|
|
| |
|
| Fund Name |
|
Year Ended
07/31/23 |
|
|
Year Ended
07/31/22 |
|
| |
|
| MIY |
|
|
|
|
|
|
|
|
| Tax-exempt income |
|
$ |
21,262,737 |
|
|
$ |
22,804,745 |
|
| Ordinary income |
|
|
9,414 |
|
|
|
— |
|
| Return of capital |
|
|
1,655,675 |
|
|
|
— |
|
|
|
|
|
|
|
|
|
|
|
|
|
|
|
$ |
22,927,826 |
|
|
$ |
22,804,745 |
|
|
|
|
|
|
|
|
|
|
| MYN |
|
|
|
|
|
|
|
|
| Tax-exempt income |
|
$ |
23,080,507 |
|
|
$ |
24,764,075 |
|
| Ordinary income |
|
|
42,379 |
|
|
|
1,048 |
|
| Return of capital |
|
|
2,141,070 |
|
|
|
— |
|
|
|
|
|
|
|
|
|
|
|
|
|
|
|
$ |
25,263,956 |
|
|
$ |
24,765,123 |
|
|
|
|
|
|
|
|
|
|
| MPA |
|
|
|
|
|
|
|
|
| Tax-exempt income |
|
$ |
8,187,485 |
|
|
$ |
9,177,045 |
|
| Ordinary income |
|
|
9,104 |
|
|
|
63 |
|
| Return of capital |
|
|
987,610 |
|
|
|
— |
|
|
|
|
|
|
|
|
|
|
|
|
|
|
|
$ |
9,184,199 |
|
|
$ |
9,177,108 |
|
|
|
|
|
|
|
|
|
|
| MYI |
|
|
|
|
|
|
|
|
| Tax-exempt income |
|
$ |
47,063,701 |
|
|
$ |
43,834,140 |
|
| Ordinary income |
|
|
70,038 |
|
|
|
437 |
|
| Return of capital |
|
|
328,022 |
|
|
|
— |
|
|
|
|
|
|
|
|
|
|
|
|
|
|
|
$ |
47,461,761 |
|
|
$ |
43,834,577 |
|
|
|
|
|
|
|
|
|
|
| BNY |
|
|
|
|
|
|
|
|
| Tax-exempt income |
|
$ |
15,168,344 |
|
|
$ |
17,533,480 |
|
| Ordinary income |
|
|
45,085 |
|
|
|
80,034 |
|
| Return of capital |
|
|
1,802,990 |
|
|
|
— |
|
|
|
|
|
|
|
|
|
|
|
|
|
|
|
$ |
17,016,419 |
|
|
$ |
17,613,514 |
|
|
|
|
|
|
|
|
|
|
As of July 31, 2023, the tax components of accumulated earnings (loss) were as follows:
|
|
|
|
|
|
|
|
|
|
|
|
|
| |
|
| Fund Name |
|
Non-Expiring
Capital Loss Carryforwards(a) |
|
|
Net Unrealized
Gains (Losses)(b) |
|
|
Total |
|
| |
|
| MUJ |
|
$ |
(46,287,545 |
) |
|
$ |
(8,736,238 |
) |
|
$ |
(55,023,783 |
) |
| MIY |
|
|
(34,354,147 |
) |
|
|
(883,159 |
) |
|
|
(35,237,306 |
) |
| MYN |
|
|
(61,783,947 |
) |
|
|
2,404,772 |
|
|
|
(59,379,175 |
) |
| MPA |
|
|
(14,441,556 |
) |
|
|
(4,939,255 |
) |
|
|
(19,380,811 |
) |
| MYI |
|
|
(64,501,068 |
) |
|
|
31,220,899 |
|
|
|
(33,280,169 |
) |
| BNY |
|
|
(39,177,228 |
) |
|
|
218,721 |
|
|
|
(38,958,507 |
) |
| |
|
| |
(a) |
Amounts available to offset future realized capital gains. |
|
| |
(b) |
The difference between book-basis and tax-basis net unrealized gains (losses) was attributable primarily to the tax
deferral of losses on wash sales, amortization methods for premiums on fixed income securities, the realization for tax purposes of unrealized gains (losses) on certain futures contracts, the treatment of residual interests in tender option bond
trusts and the deferral of compensation to Directors. |
|
As of July 31, 2023, gross unrealized appreciation and depreciation based on cost of investments (including
short positions and derivatives, if any) for U.S. federal income tax purposes were as follows:
|
|
|
|
|
|
|
|
|
|
|
|
|
|
|
|
|
| |
|
| Fund Name |
|
Tax Cost |
|
|
Gross Unrealized
Appreciation |
|
|
Gross Unrealized
Depreciation |
|
|
Net Unrealized
Appreciation (Depreciation) |
|
| |
|
| MUJ |
|
$ |
1,117,627,450 |
|
|
$ |
21,697,442 |
|
|
$ |
(30,399,345 |
) |
|
$ |
(8,701,903 |
) |
| MIY |
|
|
604,638,206 |
|
|
|
5,847,461 |
|
|
|
(6,730,620 |
) |
|
|
(883,159 |
) |
| MYN |
|
|
692,435,068 |
|
|
|
14,103,813 |
|
|
|
(11,416,847 |
) |
|
|
2,686,966 |
|
| MPA |
|
|
255,793,154 |
|
|
|
3,432,456 |
|
|
|
(8,361,387 |
) |
|
|
(4,928,931 |
) |
| MYI |
|
|
1,160,394,570 |
|
|
|
48,598,550 |
|
|
|
(16,886,950 |
) |
|
|
31,711,600 |
|
| BNY |
|
|
470,060,519 |
|
|
|
8,379,618 |
|
|
|
(8,010,641 |
) |
|
|
368,977 |
|
| |
|
In the normal course of business, the Funds invest in securities or other instruments and may enter into certain transactions, and such activities
subject each Fund to various risks, including among others, fluctuations in the market (market risk) or failure of an issuer to meet all of its obligations. The value of securities or other instruments may also be affected by various factors,
including, without limitation: (i) the general economy; (ii) the overall market as well as local, regional or global political and/or social instability;
|
|
|
| N O T E S T O F I
N A N C I A L S T A T E M E N
T S |
|
79 |
Notes to Financial Statements (continued)
(iii) regulation, taxation
or international tax treaties between various countries; or (iv) currency, interest rate and price fluctuations. Local, regional or global events such as war, acts of terrorism, the spread of infectious illness or other public health issues,
recessions, or other events could have a significant impact on the Funds and their investments.
The Funds may hold a significant amount of bonds
subject to calls by the issuers at defined dates and prices. When bonds are called by issuers and the Funds reinvest the proceeds received, such investments may be in securities with lower yields than the bonds originally held, and correspondingly,
could adversely impact the yield and total return performance of a Fund.
A Fund structures and “sponsors” the TOB Trusts in which it holds
TOB Residuals and has certain duties and responsibilities, which may give rise to certain additional risks including, but not limited to, compliance, securities law and operational risks.
As short-term interest rates rise, the Funds’ investments in the TOB Trusts may adversely affect the Funds’ net investment income and dividends
to Common Shareholders. Also, fluctuations in the market value of municipal bonds deposited into the TOB Trust may adversely affect the Funds’ NAVs per share.
The U.S. Securities and Exchange Commission (“SEC”) and various federal banking and housing agencies have adopted credit risk retention rules
for securitizations (the “Risk Retention Rules”). The Risk Retention Rules would require the sponsor of a TOB Trust to retain at least 5% of the credit risk of the underlying assets supporting the TOB Trust’s municipal bonds. The Risk
Retention Rules may adversely affect the Funds’ ability to engage in TOB Trust transactions or increase the costs of such transactions in certain circumstances.
TOB Trusts constitute an important component of the municipal bond market. Any modifications or changes to rules governing TOB Trusts may adversely impact
the municipal market and the Funds, including through reduced demand for and liquidity of municipal bonds and increased financing costs for municipal issuers. The ultimate impact of any potential modifications on the TOB Trust market and the overall
municipal market is not yet certain.
Illiquidity Risk: Each Fund may invest without limitation in illiquid or less liquid investments or
investments in which no secondary market is readily available or which are otherwise illiquid, including private placement securities. A Fund may not be able to readily dispose of such investments at prices that approximate those at which a Fund
could sell such investments if they were more widely traded and, as a result of such illiquidity, a Fund may have to sell other investments or engage in borrowing transactions if necessary to raise funds to meet its obligations. Limited liquidity
can also affect the market price of investments, thereby adversely affecting a Fund’s NAV and ability to make dividend distributions. Privately issued debt securities are often of below investment grade quality, frequently are unrated and
present many of the same risks as investing in below investment grade public debt securities.
Market Risk: Each Fund may be exposed to
prepayment risk, which is the risk that borrowers may exercise their option to prepay principal earlier than scheduled during periods of declining interest rates, which would force each Fund to reinvest in lower yielding securities. Each Fund may
also be exposed to reinvestment risk, which is the risk that income from each Fund’s portfolio will decline if each Fund invests the proceeds from matured, traded or called fixed-income securities at market interest rates that are below each
Fund portfolio’s current earnings rate.
Municipal securities are subject to the risk that litigation, legislation or other political events,
local business or economic conditions, credit rating downgrades, or the bankruptcy of the issuer could have a significant effect on an issuer’s ability to make payments of principal and/or interest or otherwise affect the value of such
securities. Municipal securities can be significantly affected by political or economic changes, including changes made in the law after issuance of the securities, as well as uncertainties in the municipal market related to, taxation, legislative
changes or the rights of municipal security holders, including in connection with an issuer insolvency. Municipal securities backed by current or anticipated revenues from a specific project or specific assets can be negatively affected by the
discontinuance of the tax benefits supporting the project or assets or the inability to collect revenues for the project or from the assets. Municipal securities may be less liquid than taxable bonds, and there may be less publicly available
information on the financial condition of municipal security issuers than for issuers of other securities.
Infectious Illness Risk: An
outbreak of an infectious illness, such as the COVID-19 pandemic, may adversely impact the economies of many nations and the global economy, and may impact individual issuers and capital markets in ways that cannot be foreseen. An infectious illness
outbreak may result in, among other things, closed international borders, prolonged quarantines, supply chain disruptions, market volatility or disruptions and other significant economic, social and political impacts.
Counterparty Credit Risk: The Funds may be exposed to counterparty credit risk, or the risk that an entity may fail to or be unable to perform on
its commitments related to unsettled or open transactions, including making timely interest and/or principal payments or otherwise honoring its obligations. The Funds manage counterparty credit risk by entering into transactions only with
counterparties that the Manager believes have the financial resources to honor their obligations and by monitoring the financial stability of those counterparties. Financial assets, which potentially expose the Funds to market, issuer and
counterparty credit risks, consist principally of financial instruments and receivables due from counterparties. The extent of the Funds’ exposure to market, issuer and counterparty credit risks with respect to these financial assets is
approximately their value recorded in the Statements of Assets and Liabilities, less any collateral held by the Funds.
A derivative contract may
suffer a mark-to-market loss if the value of the contract decreases due to an unfavorable change in the market rates or values of the underlying instrument. Losses can also occur if the counterparty does not perform under the contract.
With exchange-traded futures, there is less counterparty credit risk to the Funds since the exchange or clearinghouse, as counterparty to such
instruments, guarantees against a possible default. The clearinghouse stands between the buyer and the seller of the contract; therefore, credit risk is limited to failure of the clearinghouse. While offset rights may exist under applicable law, a
Fund does not have a contractual right of offset against a clearing broker or clearinghouse in the event of a default (including the bankruptcy or insolvency). Additionally, credit risk exists in exchange-traded futures with respect to initial and
variation margin that is held in a clearing broker’s customer accounts. While clearing brokers are required to segregate customer margin from their own assets, in the event that a clearing broker becomes insolvent or goes into bankruptcy and at
that time there is a shortfall in the aggregate amount of margin held by the clearing broker for all its clients, typically the shortfall would be allocated on a pro rata basis across all the clearing broker’s customers, potentially resulting
in losses to the Funds.
|
|
|
| 80 |
|
2 0 2 3 B L A C
K R O C K A N N U A L R E P O R
T T O S H A R E H O L D E R
S |
Notes to Financial Statements (continued)
Geographic/Asset Class
Risk: A diversified portfolio, where this is appropriate and consistent with a fund’s objectives, minimizes the risk that a price change of a particular investment will have a material impact on the NAV of a fund. The investment
concentrations within each Fund’s portfolio are disclosed in its Schedule of Investments.
Certain Funds invest a substantial amount of their
assets in issuers located in a single state or limited number of states. When a fund concentrates its investments in this manner, it assumes the risk that economic, regulatory, political or social conditions affecting that state or group of states
could have a significant impact on the fund and could affect the income from, or the value or liquidity of, the fund’s portfolio. Investment percentages in specific states or U.S. territories are presented in the Schedules of Investments.
Certain Funds invest a significant portion of their assets in securities within a single or limited number of market sectors. When a fund concentrates its
investments in this manner, it assumes the risk that economic, regulatory, political and social conditions affecting such sectors may have a significant impact on the Fund and could affect the income from, or the value or liquidity of, the
Fund’s portfolio. Investment percentages in specific sectors are presented in the Schedules of Investments.
The Funds invest a significant
portion of their assets in fixed-income securities and/or use derivatives tied to the fixed-income markets. Changes in market interest rates or economic conditions may affect the value and/or liquidity of such investments. Interest rate risk is the
risk that prices of bonds and other fixed-income securities will decrease as interest rates rise and increase as interest rates fall. The Funds may be subject to a greater risk of rising interest rates due to the period of historically low interest
rates that ended in March 2022. The Federal Reserve has recently been raising the federal funds rate as part of its efforts to address inflation. There is a risk that interest rates will continue to rise, which will likely drive down the prices of
bonds and other fixed-income securities, and could negatively impact the Funds’ performance.
The Funds invest a significant portion of their
assets in securities of issuers located in the United States. A decrease in imports or exports, changes in trade regulations, inflation and/or an economic recession in the United States may have a material adverse effect on the U.S. economy and the
securities listed on U.S. exchanges. Proposed and adopted policy and legislative changes in the United States may also have a significant effect on U.S. markets generally, as well as on the value of certain securities. Governmental agencies project
that the United States will continue to maintain elevated public debt levels for the foreseeable future which may constrain future economic growth. Circumstances could arise that could prevent the timely payment of interest or principal on U.S.
government debt, such as reaching the legislative “debt ceiling.” Such non-payment would result in substantial negative consequences for the U.S. economy and the global financial system. If U.S. relations with certain countries
deteriorate, it could adversely affect issuers that rely on the United States for trade. The United States has also experienced increased internal unrest and discord. If these trends were to continue, they may have an adverse impact on the U.S.
economy and the issuers in which the Funds invest.
| 10. |
CAPITAL SHARE TRANSACTIONS |
MPA and BNY are authorized to issue an unlimited number of shares, all of which were initially classified as Common Shares. MUJ, MIY, MYN and MYI are
authorized to issue 200 million shares, all of which were initially classified as Common Shares. The par value for each Fund’s Common Shares is $0.10, except for BNY for which it is $0.001. The par value for MUJ’s, MIY’s,
MYN’s and MYI’s Preferred Shares outstanding is $0.10. The par value for MPA’s Preferred Shares outstanding is $0.05. The par value for BNY’s Preferred Shares outstanding is $0.001. The Board is authorized, however, to reclassify
any unissued Common Shares to Preferred Shares without the approval of Common Shareholders. MPA is authorized to issue 1 million Preferred Shares.
Common Shares
For the periods shown, shares
issued and outstanding increased by the following amounts as a result of dividend reinvestment:
|
|
|
|
|
|
|
|
|
| |
|
| |
|
Year Ended |
|
| Fund Name |
|
07/31/23 |
|
|
07/31/22 |
|
| |
|
| MUJ |
|
|
19,764 |
|
|
|
28,923 |
|
| MIY |
|
|
19,146 |
|
|
|
6,385 |
|
| MPA |
|
|
834 |
|
|
|
8,523 |
|
| BNY |
|
|
— |
|
|
|
23,267 |
|
| |
|
For the year ended July 31, 2022, shares issued and outstanding remained constant for MYN and MYI.
For the year ended July 31, 2022, Common Shares of MUJ issued and outstanding increased by 24,386,597 as a result of the reorganization of MYJ with
and into MUJ.
For the year ended July 31, 2022, Common Shares of MUJ issued and outstanding decreased by 41 as a result of a redemption of
fractional shares from the reorganization of MYJ with and into MUJ.
The Funds participate in an open market share repurchase program (the
“Repurchase Program”). From December 1, 2021 through November 30, 2022, each Fund may repurchase up to 5% of its outstanding common shares under the Repurchase Program, based on common shares outstanding as of the close of
business on November 30, 2021, subject to certain conditions. From December 1, 2022 through November 30, 2023, each Fund may repurchase up to 5% of its outstanding common shares under the Repurchase Program, based on common shares
outstanding as of the close of business on November 30, 2022, subject to certain conditions. The Repurchase Program has an accretive effect as shares are purchased at a discount to the Fund’s NAV. There is no assurance that the Funds will
purchase shares in any particular amounts.
|
|
|
| N O T E S T O F I
N A N C I A L S T A T E M E N
T S |
|
81 |
Notes to Financial Statements (continued)
The total cost of the shares
repurchased is reflected in Funds’ Statements of Changes in Net Assets. For the periods shown, shares repurchased and cost, including transaction costs, were as follows:
|
|
|
|
|
|
|
|
|
| |
|
| |
|
MUJ |
|
| |
|
Shares |
|
|
Amounts |
|
| |
|
| Year Ended July 31, 2023 |
|
|
830,265 |
|
|
$ |
9,439,913 |
|
| |
|
|
|
|
|
|
|
|
|
|
| |
|
| |
|
MIY |
|
| |
|
Shares |
|
|
Amounts |
|
| |
|
| Year Ended July 31, 2023 |
|
|
302,870 |
|
|
$ |
3,374,623 |
|
| |
|
|
|
|
|
|
|
|
|
|
| |
|
| |
|
MYN |
|
| |
|
Shares |
|
|
Amounts |
|
| |
|
| Year Ended July 31, 2023 |
|
|
864,838 |
|
|
$ |
8,585,038 |
|
| |
|
|
|
|
|
|
|
|
|
|
| |
|
| |
|
MPA |
|
| |
|
Shares |
|
|
Amounts |
|
| |
|
| Year Ended July 31, 2023 |
|
|
291,383 |
|
|
$ |
3,289,985 |
|
| |
|
|
|
|
|
|
|
|
|
|
| |
|
| |
|
MYI |
|
| |
|
Shares |
|
|
Amounts |
|
| |
|
| Year Ended July 31, 2023 |
|
|
644,921 |
|
|
$ |
7,043,454 |
|
| |
|
|
|
|
|
|
|
|
|
|
| |
|
| |
|
BNY |
|
| |
|
Shares |
|
|
Amounts |
|
| |
|
| Year Ended July 31, 2023 |
|
|
319,475 |
|
|
$ |
3,263,323 |
|
| |
|
Preferred Shares
A Fund’s Preferred Shares rank prior to its Common Shares as to the payment of dividends by the Fund and distribution of assets upon dissolution or
liquidation of the Fund. The 1940 Act prohibits the declaration of any dividend on Common Shares or the repurchase of Common Shares if the Fund fails to maintain asset coverage of at least 200% of the liquidation preference of the Fund’s
outstanding Preferred Shares. In addition, pursuant to the Preferred Shares’ governing instruments, a Fund is restricted from declaring and paying dividends on classes of shares ranking junior to or on parity with its Preferred Shares or
repurchasing such shares if the Fund fails to declare and pay dividends on the Preferred Shares, redeem any Preferred Shares required to be redeemed under the Preferred Shares’ governing instruments or comply with the basic maintenance amount
requirement of the ratings agencies rating the Preferred Shares.
Holders of Preferred Shares have voting rights equal to the voting rights of holders
of Common Shares (one vote per share) and vote together with holders of Common Shares (one vote per share) as a single class on certain matters. Holders of Preferred Shares, voting as a separate class, are also entitled to (i) elect two members
of the Board, (ii) elect the full Board if dividends on the Preferred Shares are not paid for a period of two years and (iii) a separate class vote to amend the Preferred Share governing documents. In addition, the 1940 Act requires the
approval of the holders of a majority of any outstanding Preferred Shares, voting as a separate class, to (a) adopt any plan of reorganization that would adversely affect the Preferred Shares, (b) change a Fund’s sub-classification as
a closed-end investment company or change its fundamental investment restrictions or (c) change its business so as to cease to be an investment company.
VRDP Shares
Each Fund (for purposes of this
section, each a “VRDP Fund”) have issued Series W-7 VRDP Shares, $100,000 liquidation preference per share, in one or more privately negotiated offerings to qualified institutional buyers as defined pursuant to Rule 144A under the
Securities Act of 1933, as amended (the “Securities Act”). The VRDP Shares include a liquidity feature and may be subject to a special rate period. As of period end, the VRDP Shares outstanding were as follows:
|
|
|
|
|
|
|
|
|
|
|
|
|
|
|
| |
|
|
|
|
| Fund Name |
|
Issue
Date |
|
|
Shares
Issued |
|
|
Aggregate
Principal |
|
|
Maturity
Date |
| MUJ |
|
|
06/30/11 |
|
|
|
1,727 |
|
|
$ |
172,700,000 |
|
|
07/01/41 |
|
|
|
04/13/15 |
|
|
|
644 |
|
|
|
64,400,000 |
|
|
07/01/41 |
|
|
|
04/11/22 |
|
|
|
1,800 |
|
|
|
180,000,000 |
|
|
07/01/41 |
| MIY |
|
|
04/21/11 |
|
|
|
1,446 |
|
|
|
144,600,000 |
|
|
05/01/41 |
|
|
|
09/14/15 |
|
|
|
873 |
|
|
|
87,300,000 |
|
|
05/01/41 |
| MYN |
|
|
04/21/11 |
|
|
|
2,477 |
|
|
|
247,700,000 |
|
|
05/01/41 |
| MPA |
|
|
05/19/11 |
|
|
|
663 |
|
|
|
66,300,000 |
|
|
06/01/41 |
|
|
|
04/13/15 |
|
|
|
163 |
|
|
|
16,300,000 |
|
|
06/01/41 |
| MYI |
|
|
05/19/11 |
|
|
|
3,564 |
|
|
|
356,400,000 |
|
|
06/01/41 |
| BNY |
|
|
03/31/21 |
|
|
|
945 |
|
|
|
94,500,000 |
|
|
03/31/51 |
| |
|
|
04/12/21 |
|
|
|
849 |
|
|
|
84,900,000 |
|
|
03/31/51 |
|
|
|
| 82 |
|
2 0 2 3 B L A C
K R O C K A N N U A L R E P O R
T T O S H A R E H O L D E R
S |
Notes to Financial Statements (continued)
Redemption Terms: A
VRDP Fund is required to redeem its VRDP Shares on the maturity date, unless earlier redeemed or repurchased. Six months prior to the maturity date, a VRDP Fund is required to begin to segregate liquid assets with the Fund’s custodian to fund
the redemption. In addition, a VRDP Fund is required to redeem certain of its outstanding VRDP Shares if it fails to comply with certain asset coverage, basic maintenance amount or leverage requirements.
Subject to certain conditions, the VRDP Shares may also be redeemed, in whole or in part, at any time at the option of a VRDP Fund. The redemption price
per VRDP Share is equal to the liquidation preference per share plus any outstanding unpaid dividends.
Liquidity Feature: VRDP Shares are
subject to a fee agreement between the VRDP Fund and the liquidity provider that requires a per annum liquidity fee and, in some cases, an upfront or initial commitment fee, payable to the liquidity provider. These fees, if applicable, are shown as
liquidity fees in the Statements of Operations. As of period end, the fee agreement is set to expire, unless renewed or terminated in advance, as follows:
|
|
|
|
|
|
|
|
|
|
|
|
|
|
|
|
|
|
|
|
|
|
|
| |
|
MUJ |
|
|
MIY |
|
|
MYN |
|
|
MPA |
|
|
MYI |
|
|
BNY |
| Expiration date |
|
|
11/30/24 |
|
|
|
07/07/24 |
|
|
|
07/07/24 |
|
|
|
07/07/24 |
|
|
|
07/07/24 |
|
|
11/30/24 |
The VRDP Shares are also subject to a purchase agreement in connection with the liquidity feature. In the event a purchase
agreement is not renewed or is terminated in advance, and the VRDP Shares do not become subject to a purchase agreement with an alternate liquidity provider, the VRDP Shares will be subject to mandatory purchase by the liquidity provider prior to
the termination of the purchase agreement. In the event of such mandatory purchase, a VRDP Fund is required to redeem the VRDP Shares six months after the purchase date. Immediately after such mandatory purchase, the VRDP Fund is required to begin
to segregate liquid assets with its custodian to fund the redemption. There is no assurance that a VRDP Fund will replace such redeemed VRDP Shares with any other preferred shares or other form of leverage.
Remarketing: A VRDP Fund may incur remarketing fees on the aggregate principal amount of all its VRDP Shares, which, if any, are included in
remarketing fees on Preferred Shares in the Statements of Operations. During any special rate period (as described below), a VRDP Fund may incur nominal or no remarketing fees.
Ratings: As of period end, the VRDP Shares were assigned the following ratings:
|
|
|
|
|
|
|
| Fund Name |
|
Moody’s Investors
Service, Inc.
Long-Term
Ratings |
|
|
Fitch Ratings, Inc.
Long-Term
Ratings |
| MUJ |
|
|
Aa2 |
|
|
AA |
| MIY |
|
|
Aa2 |
|
|
AA |
| MYN |
|
|
Aa2 |
|
|
AA |
| MPA |
|
|
Aa2 |
|
|
AA |
| MYI |
|
|
Aa1 |
|
|
AA |
| BNY |
|
|
Aa2 |
|
|
AA |
Special Rate Period: A VRDP Fund has commenced a “special rate period” with respect to its VRDP Shares,
during which the VRDP Shares will not be subject to any remarketing and the dividend rate will be based on a predetermined methodology. During a special rate period, short-term ratings on VRDP Shares are withdrawn. As of period end, the following
VRDP Funds have commenced/are set to commence a special rate period:
|
|
|
|
|
|
|
| Fund Name |
|
Commencement
Date |
|
|
Expiration Date as
of Period Ended
07/31/23 |
| MUJ |
|
|
04/17/14 |
|
|
11/15/24 |
| MIY |
|
|
06/25/20 |
|
|
06/19/24 |
| MYN |
|
|
06/22/22 |
|
|
06/19/24 |
| MPA |
|
|
06/22/22 |
|
|
06/19/24 |
| MYI |
|
|
06/22/22 |
|
|
06/19/24 |
| BNY |
|
|
03/31/21 |
|
|
11/15/24 |
Prior to the expiration date, the VRDP Fund and the VRDP Shares holder may mutually agree to extend the special rate
period. If a special rate period is not extended, the VRDP Shares will revert to remarketable securities upon the termination of the special rate period and will be remarketed and available for purchase by qualified institutional investors.
During the special rate period: (i) the liquidity and fee agreements remain in effect, (ii) VRDP Shares remain subject to mandatory redemption
by the VRDP Fund on the maturity date, (iii) VRDP Shares will not be remarketed or subject to optional or mandatory tender events, (iv) the VRDP Fund is required to comply with the same asset coverage, basic maintenance amount and leverage
requirements for the VRDP Shares as is required when the VRDP Shares are not in a special rate period, (v) the VRDP Fund will pay dividends monthly based on the sum of an agreed upon reference rate and a percentage per annum based on the
long-term ratings assigned to the VRDP Shares and (vi) the VRDP Fund will pay nominal or no fees to the liquidity provider and remarketing agent.
Dividends: Except during the Special Rate Period as described above, dividends on the VRDP Shares are payable monthly at a variable rate set weekly
by the remarketing agent. Such dividend rates are generally based upon a spread over a base rate and cannot exceed a maximum rate. A change in the short-term credit rating of the liquidity provider or the VRDP Shares may adversely affect the
dividend rate paid on such shares, although the dividend rate paid on the VRDP Shares is not directly based upon either short-term rating. In the event of a failed remarketing, the dividend rate of the VRDP Shares will be reset to a maximum rate.
The maximum rate is determined based on, among other things, the long-term preferred share rating assigned to the VRDP Shares and the length of time that the VRDP Shares fail to be remarketed.
|
|
|
| N O T E S T O F I
N A N C I A L S T A T E M E N
T S |
|
83 |
Notes to Financial Statements (continued)
For the year ended July 31, 2023, the
annualized dividend rate for the VRDP Shares were as follows:
|
|
|
|
|
|
|
|
|
|
|
|
|
|
|
|
|
|
|
|
|
|
|
|
|
| |
|
| |
|
MUJ |
|
|
MIY |
|
|
MYN |
|
|
MPA |
|
|
MYI |
|
|
BNY |
|
| |
|
| Dividend rates |
|
|
3.56 |
% |
|
|
3.61 |
% |
|
|
3.61 |
% |
|
|
3.61 |
% |
|
|
3.61 |
% |
|
|
3.56% |
|
| |
|
For the year ended July 31, 2023, VRDP Shares issued and outstanding of each VRDP Trust remained constant.
During the year ended July 31, 2022, issued and outstanding VRDP Shares for MUJ increased by 1,800 due to the reorganization of MYJ with and into
MUJ.
Offering Costs: The Funds incurred costs in connection with the issuance of VRDP Shares, which were recorded as a direct deduction from
the carrying value of the related debt liability and will be amortized over the life of the VRDP Shares with the exception of any upfront fees paid by a VRDP Fund to the liquidity provider which, if any, were amortized over the life of the liquidity
agreement. Amortization of these costs is included in interest expense, fees and amortization of offering costs in the Statements of Operations.
Financial Reporting: The VRDP Shares are considered debt of the issuer; therefore, the liquidation preference, which approximates fair value of the
VRDP Shares, is recorded as a liability in the Statements of Assets and Liabilities net of deferred offering costs. Unpaid dividends are included in interest expense and fees payable in the Statements of Assets and Liabilities, and the dividends
accrued and paid on the VRDP Shares are included as a component of interest expense, fees and amortization of offering costs in the Statements of Operations. The VRDP Shares are treated as equity for tax purposes. Dividends paid to holders of the
VRDP Shares are generally classified as tax-exempt income for tax-reporting purposes. Dividends and amortization of deferred offering costs on VRDP Shares are included in interest expense, fees and amortization of offering costs in the Statements of
Operations:
|
|
|
|
|
|
|
|
|
| |
|
| Fund Name |
|
Dividends Accrued |
|
|
Deferred Offering
Costs Amortization |
|
| |
|
| MUJ |
|
$ |
14,853,217 |
|
|
$ |
45,446 |
|
| MIY |
|
|
8,366,443 |
|
|
|
11,351 |
|
| MYN |
|
|
8,936,473 |
|
|
|
21,848 |
|
| MPA |
|
|
2,980,027 |
|
|
|
18,543 |
|
| MYI |
|
|
12,858,970 |
|
|
|
29,463 |
|
| BNY |
|
|
6,388,557 |
|
|
|
19,208 |
|
| |
|
Management’s evaluation of the impact of all subsequent events on the Funds’ financial statements was completed through the date the financial
statements were issued and the following items were noted:
The Funds declared and paid or will pay distributions to Common Shareholders as follows:
|
|
|
|
|
|
|
|
|
|
|
|
|
|
|
|
|
|
|
|
|
| |
|
| Fund Name |
|
Declaration
Date |
|
|
Record
Date |
|
|
Payable/
Paid Date |
|
|
|
|
|
Dividend Per
Common Share |
|
| |
|
| MUJ |
|
|
08/01/23 |
|
|
|
08/15/23 |
|
|
|
09/01/23 |
|
|
|
|
|
|
$ |
0.037500 |
|
|
|
|
09/01/23 |
|
|
|
09/15/23 |
|
|
|
10/02/23 |
|
|
|
|
|
|
|
0.037500 |
|
| MIY |
|
|
08/01/23 |
|
|
|
08/15/23 |
|
|
|
09/01/23 |
|
|
|
|
|
|
|
0.034500 |
|
|
|
|
09/01/23 |
|
|
|
09/15/23 |
|
|
|
10/02/23 |
|
|
|
|
|
|
|
0.034500 |
|
| MYN |
|
|
08/01/23 |
|
|
|
08/15/23 |
|
|
|
09/01/23 |
|
|
|
|
|
|
|
0.031500 |
|
|
|
|
09/01/23 |
|
|
|
09/15/23 |
|
|
|
10/02/23 |
|
|
|
|
|
|
|
0.031500 |
|
| MPA |
|
|
08/01/23 |
|
|
|
08/15/23 |
|
|
|
09/01/23 |
|
|
|
|
|
|
|
0.034000 |
|
|
|
|
09/01/23 |
|
|
|
09/15/23 |
|
|
|
10/02/23 |
|
|
|
|
|
|
|
0.034000 |
|
| MYI |
|
|
08/01/23 |
|
|
|
08/15/23 |
|
|
|
09/01/23 |
|
|
|
|
|
|
|
0.040500 |
|
|
|
|
09/01/23 |
|
|
|
09/15/23 |
|
|
|
10/02/23 |
|
|
|
|
|
|
|
0.040500 |
|
| BNY |
|
|
08/01/23 |
|
|
|
08/15/23 |
|
|
|
09/01/23 |
|
|
|
|
|
|
|
0.030500 |
|
|
|
|
09/01/23 |
|
|
|
09/15/23 |
|
|
|
10/02/23 |
|
|
|
|
|
|
|
0.030500 |
|
| |
|
The Funds declared and paid or will pay distributions to Preferred Shareholders as follows:
|
|
|
|
|
|
|
|
|
|
|
|
|
| |
|
| |
|
Preferred Shares(a) |
|
|
|
|
|
|
| Fund Name |
|
|
Shares |
|
|
|
Series |
|
|
|
Declared |
|
| |
|
| MUJ |
|
|
VRDP |
|
|
|
W-7 |
|
|
$ |
1,579,152 |
|
| MIY |
|
|
VRDP |
|
|
|
W-7 |
|
|
|
881,919 |
|
| MYN |
|
|
VRDP |
|
|
|
W-7 |
|
|
|
942,006 |
|
| MPA |
|
|
VRDP |
|
|
|
W-7 |
|
|
|
314,129 |
|
| MYI |
|
|
VRDP |
|
|
|
W-7 |
|
|
|
1,355,394 |
|
| BNY |
|
|
VRDP |
|
|
|
W-7 |
|
|
|
679,213 |
|
| |
|
| |
(a) |
Dividends declared for period August 1, 2023 to August 31, 2023. |
|
|
|
|
| 84 |
|
2 0 2 3 B L A C
K R O C K A N N U A L R E P O R
T T O S H A R E H O L D E R
S |
Notes to Financial Statements (continued)
On September 8, 2023,
the Board of Directors/Trustees of each of MIY, MPA, BlackRock Virginia Municipal Bond Trust and BlackRock Investment Quality Municipal Trust, Inc.(collectively, the “Target Funds”) and the Board of Directors of MYI approved the merger of
the respective Target Fund into MYI. Subject to the approvals by each Fund’s shareholders, the potential refinancing of preferred shares and the satisfaction of customary closing conditions, the mergers are expected to be completed in the first
half of 2024.
|
|
|
| N O T E S T O F I
N A N C I A L S T A T E M E N
T S |
|
85 |
Report of Independent Registered Public Accounting Firm
To the Shareholders and the Board of Trustees/Directors of BlackRock MuniHoldings New Jersey Quality Fund, Inc., BlackRock MuniYield Michigan Quality
Fund, Inc., BlackRock MuniYield New York Quality Fund, Inc., BlackRock MuniYield Pennsylvania Quality Fund, BlackRock MuniYield Quality Fund III, Inc., and BlackRock New York Municipal Income Trust:
Opinion on the Financial Statements and Financial Highlights
We have audited the accompanying statements of assets and liabilities of BlackRock MuniHoldings New Jersey Quality Fund, Inc., BlackRock MuniYield
Michigan Quality Fund, Inc., BlackRock MuniYield New York Quality Fund, Inc., BlackRock MuniYield Pennsylvania Quality Fund, BlackRock MuniYield Quality Fund III, Inc., and BlackRock New York Municipal Income Trust (the “Funds”), including
the schedules of investments, as of July 31, 2023, the related statements of operations and cash flows for the year then ended, the statements of changes in net assets for each of the two years in the period then ended, the financial highlights
for each of the five years in the period then ended, and the related notes. In our opinion, the financial statements and financial highlights present fairly, in all material respects, the financial position of the Funds as of July 31, 2023, and
the results of their operations and their cash flows for the year then ended, the changes in their net assets for each of the two years in the period then ended, and the financial highlights for each of the five years in the period then ended, in
conformity with accounting principles generally accepted in the United States of America.
Basis for Opinion
These financial statements and financial highlights are the responsibility of the Funds’ management. Our responsibility is to express an opinion on
the Funds’ financial statements and financial highlights based on our audits. We are a public accounting firm registered with the Public Company Accounting Oversight Board (United States) (PCAOB) and are required to be independent with respect
to the Funds in accordance with the U.S. federal securities laws and the applicable rules and regulations of the Securities and Exchange Commission and the PCAOB.
We conducted our audits in accordance with the standards of the PCAOB. Those standards require that we plan and perform the audit to obtain reasonable
assurance about whether the financial statements and financial highlights are free of material misstatement, whether due to error or fraud. The Funds are not required to have, nor were we engaged to perform, an audit of their internal control over
financial reporting. As part of our audits we are required to obtain an understanding of internal control over financial reporting but not for the purpose of expressing an opinion on the effectiveness of the Funds’ internal control over
financial reporting. Accordingly, we express no such opinion.
Our audits included performing procedures to assess the risks of material misstatement
of the financial statements and financial highlights, whether due to error or fraud, and performing procedures that respond to those risks. Such procedures included examining, on a test basis, evidence regarding the amounts and disclosures in the
financial statements and financial highlights. Our audits also included evaluating the accounting principles used and significant estimates made by management, as well as evaluating the overall presentation of the financial statements and financial
highlights. Our procedures included confirmation of securities owned as of July 31, 2023, by correspondence with custodians or counterparties; when replies were not received, we performed other auditing procedures. We believe that our audits
provide a reasonable basis for our opinion.
Deloitte & Touche LLP
Boston, Massachusetts
September 22, 2023
We have served as the auditor of one or more BlackRock investment companies since 1992.
|
|
|
| 86 |
|
2 0 2 3 B L A C
K R O C K A N N U A L R E P O R
T T O S H A R E H O L D E R
S |
Important Tax Information (unaudited)
The following amounts, or maximum amounts allowable by law, are hereby designated as tax-exempt interest dividends for the fiscal year ended July 31,
2023:
|
|
|
| Fund Name |
|
Exempt-Interest
Dividends |
| MUJ |
|
$ 40,476,480 |
| MIY |
|
20,785,753 |
| MYN |
|
24,091,720 |
| MPA |
|
8,333,062 |
| MYI |
|
44,591,165 |
| BNY |
|
16,032,899 |
The Fund hereby designates the following amount, or maximum amount allowable by law, as interest income eligible to be
treated as a Section 163(j) interest dividend for the fiscal year ended July 31, 2023:
|
|
|
| Fund Name |
|
Interest
Dividends |
| MUJ |
|
$ 42,265 |
| MIY |
|
9,307 |
| MYN |
|
40,714 |
| MPA |
|
8,660 |
| MYI |
|
59,118 |
| BNY |
|
36,190 |
The Fund hereby designates the following amount, or maximum amount allowable by law, as interest-related dividends
eligible for exemption from U.S. withholding tax for nonresident aliens and foreign corporations for the fiscal year ended July 31, 2023:
|
|
|
| Fund Name |
|
Interest
Related
Dividends |
| MUJ |
|
$ 42,265 |
| MIY |
|
9,307 |
| MYN |
|
40,714 |
| MPA |
|
8,660 |
| MYI |
|
59,118 |
| BNY |
|
36,190 |
|
|
|
| I M P O R T
A N T T A X I N F O
R M A T I O N |
|
87 |
Disclosure of Investment Advisory Agreements
The Boards of Directors/Trustees, as applicable (collectively, the “Board,” the members of which are referred to as “Board Members”)
of BlackRock New York Municipal Income Trust (“BNY”), BlackRock MuniYield New York Quality Fund, Inc. (“MYN”), BlackRock MuniYield Quality Fund III, Inc. (“MYI”), BlackRock MuniHoldings New Jersey Quality Fund, Inc.
(“MUJ”), BlackRock MuniYield Pennsylvania Quality Fund (“MPA”) and BlackRock MuniYield Michigan Quality Fund, Inc. (“MIY”) (collectively, the “Funds” and each, a “Fund”) met on May 4, 2023 (the
“May Meeting”) and June 1-2, 2023 (the “June Meeting”) to consider the approval to continue the investment advisory agreements (the “Advisory Agreements”) or (the “Agreements”) between each Fund and
BlackRock Advisors, LLC (the “Manager” or “BlackRock”), each Fund’s investment adviser.
The Approval Process
Consistent with the requirements of the Investment Company Act of 1940 (the “1940 Act”), the Board considers the approval of the continuation of
the Agreements for each Fund on an annual basis. The Board members who are not “interested persons” of each Fund, as defined in the 1940 Act, are considered independent Board members (the “Independent Board Members”). The
Board’s consideration entailed a year-long deliberative process during which the Board and its committees assessed BlackRock’s various services to each Fund, including through the review of written materials and oral presentations, and the
review of additional information provided in response to requests from the Independent Board Members. The Board had four quarterly meetings per year, each of which extended over a two-day period, as well as additional ad hoc meetings and executive
sessions throughout the year, as needed. The committees of the Board similarly met throughout the year. The Board also had an additional one-day meeting to consider specific information regarding the renewal of the Agreements. In considering the
renewal of the Agreements, the Board assessed, among other things, the nature, extent and quality of the services provided to each Fund by BlackRock, BlackRock’s personnel and affiliates, including (as applicable): investment management
services; accounting oversight; administrative and shareholder services; oversight of each Fund’s service providers; risk management and oversight; and legal, regulatory and compliance services. Throughout the year, including during the
contract renewal process, the Independent Board Members were advised by independent legal counsel, and met with independent legal counsel in various executive sessions outside of the presence of BlackRock’s management.
During the year, the Board, acting directly and through its committees, considered information that was relevant to its annual consideration of the
renewal of the Agreements, including the services and support provided by BlackRock to each Fund and its shareholders. BlackRock also furnished additional information to the Board in response to specific questions from the Board. Among the matters
the Board considered were: (a) investment performance for one-year, three-year, five-year, and/or since inception periods, as applicable, against peer funds, relevant benchmarks, and other performance metrics, as applicable, as well as
BlackRock senior management’s and portfolio managers’ analyses of the reasons for any outperformance or underperformance relative to its peers, benchmarks, and other performance metrics, as applicable; (b) leverage management, as
applicable; (c) fees, including advisory, administration, if applicable, and other amounts paid to BlackRock and its affiliates by each Fund for services; (d) Fund operating expenses and how BlackRock allocates expenses to each Fund;
(e) the resources devoted to risk oversight of, and compliance reports relating to, implementation of each Fund’s investment objective, policies and restrictions, and meeting regulatory requirements; (f) BlackRock’s and each
Fund’s adherence to applicable compliance policies and procedures; (g) the nature, character and scope of non-investment management services provided by BlackRock and its affiliates and the estimated cost of such services, as available;
(h) BlackRock’s and other service providers’ internal controls and risk and compliance oversight mechanisms; (i) BlackRock’s implementation of the proxy voting policies approved by the Board; (j) execution quality of
portfolio transactions; (k) BlackRock’s implementation of each Fund’s valuation and liquidity procedures; (l) an analysis of management fees paid to BlackRock for products with similar investment mandates across the open-end
fund, closed-end fund, sub-advised mutual fund, collective investment trust and institutional separate account product channels, as applicable, and the similarities and differences between these products and the services provided as compared to each
Fund; (m) BlackRock’s compensation methodology for its investment professionals and the incentives and accountability it creates, along with investment professionals’ investments in the fund(s) they manage; (n) periodic updates
on BlackRock’s business; and (o) each Fund’s market discount/premium compared to peer funds.
Prior to and in preparation for the May
Meeting, the Board received and reviewed materials specifically relating to the renewal of the Agreements. The Independent Board Members are continuously engaged in a process with their independent legal counsel and BlackRock to review the nature
and scope of the information provided to the Board to better assist its deliberations. The materials provided in connection with the May Meeting included, among other things: (a) information independently compiled and prepared by Broadridge
Financial Solutions, Inc. (“Broadridge”), based on either a Lipper classification or Morningstar category, regarding each Fund’s fees and expenses as compared with a peer group of funds as determined by Broadridge (“Expense
Peers”) and the investment performance of each Fund as compared with a peer group of funds (“Performance Peers”); (b) information on the composition of the Expense Peers and Performance Peers and a description of
Broadridge’s methodology; (c) information on the estimated profits realized by BlackRock and its affiliates pursuant to the Agreements and a discussion of fall-out benefits to BlackRock and its affiliates; (d) a general analysis
provided by BlackRock concerning investment management fees received in connection with other types of investment products, such as institutional accounts, sub-advised mutual funds, closed-end funds, and open-end funds, under similar investment
mandates, as applicable; (e) a review of non-management fees; (f) the existence, impact and sharing of potential economies of scale, if any, with each Fund; (g) a summary of aggregate amounts paid by each Fund to BlackRock; and
(h) various additional information requested by the Board as appropriate regarding BlackRock’s and each Fund’s operations.
At the May
Meeting, the Board reviewed materials relating to its consideration of the Agreements and the Independent Board Members presented BlackRock with questions and requests for additional information. BlackRock responded to these questions and requests
with additional written information in advance of the June Meeting.
At the June Meeting, the Board concluded its assessment of, among other things:
(a) the nature, extent and quality of the services provided by BlackRock; (b) the investment performance of each Fund as compared to its Performance Peers and to other metrics, as applicable; (c) the advisory fee and the estimated
cost of the services and estimated profits realized by BlackRock and its affiliates from their relationship with each Fund; (d) each Fund’s fees and expenses compared to its Expense Peers; (e) the existence and sharing of potential
economies of scale; (f) any fall-out benefits to BlackRock and its affiliates as a result of BlackRock’s relationship with each Fund; and (g) other factors deemed relevant by the Board Members.
The Board also considered other matters it deemed important to the approval process, such as other payments made to BlackRock or its affiliates relating
to securities lending and cash management, and BlackRock’s services related to the valuation and pricing of Fund portfolio holdings. The Board noted the willingness of BlackRock’s personnel to engage in open, candid discussions with the
Board. The Board Members evaluated the information available to them on a fund-by-fund basis. The following paragraphs provide more information about some of the primary factors that were relevant to the Board’s decision. The Board Members did
not identify any particular information, or any single factor as determinative, and each Board Member may have attributed different weights to the various items and factors considered.
|
|
|
| 88 |
|
2 0 2 3 B L A C
K R O C K A N N U A L R E P O R
T T O S H A R E H O L D E R
S |
Disclosure of Investment Advisory Agreements (continued)
A. Nature, Extent and Quality of the Services Provided by BlackRock
The Board, including the Independent Board Members, reviewed the nature, extent and quality of services provided by BlackRock, including the investment
advisory services, and the resulting performance of each Fund. Throughout the year, the Board compared Fund performance to the performance of a comparable group of closed-end funds, relevant benchmarks, and performance metrics, as applicable. The
Board met with BlackRock’s senior management personnel responsible for investment activities, including the senior investment officers. The Board also reviewed the materials provided by each Fund’s portfolio management team discussing each
Fund’s performance, investment strategies and outlook.
The Board considered, among other factors, with respect to BlackRock: the experience of
investment personnel generally and each Fund’s portfolio management team; research capabilities; investments by portfolio managers in the funds they manage; portfolio trading capabilities; use of technology; commitment to compliance; credit
analysis capabilities; risk analysis and oversight capabilities; and the approach to training and retaining portfolio managers and other research, advisory and management personnel. The Board also considered BlackRock’s overall risk management
program, including the continued efforts of BlackRock and its affiliates to address cybersecurity risks and the role of BlackRock’s Risk & Quantitative Analysis Group. The Board engaged in a review of BlackRock’s compensation
structure with respect to each Fund’s portfolio management team and BlackRock’s ability to attract and retain high-quality talent and create performance incentives.
In addition to investment advisory services, the Board considered the nature and quality of the administrative and other non-investment advisory services
provided to each Fund. BlackRock and its affiliates provide each Fund with certain administrative, shareholder and other services (in addition to any such services provided to each Fund by third parties) and officers and other personnel as are
necessary for the operations of each Fund. In particular, BlackRock and its affiliates provide each Fund with administrative services including, among others: (i) responsibility for disclosure documents and periodic shareholder reports;
(ii) preparing communications with analysts to support secondary market trading of each Fund; (iii) oversight of daily accounting and pricing; (iv) responsibility for periodic filings with regulators and stock exchanges;
(v) overseeing and coordinating the activities of third-party service providers including, among others, each Fund’s custodian, fund accountant, transfer agent, and auditor; (vi) organizing Board meetings and preparing the materials
for such Board meetings; (vii) providing legal and compliance support; (viii) furnishing analytical and other support to assist the Board in its consideration of strategic issues such as the merger, consolidation or repurposing of certain
closed-end funds; and (ix) performing or managing administrative functions necessary for the operation of each Fund, such as tax reporting, expense management, fulfilling regulatory filing requirements, and shareholder call center and other
services. The Board reviewed the structure and duties of BlackRock’s fund administration, shareholder services, and legal and compliance departments and considered BlackRock’s policies and procedures for assuring compliance with applicable
laws and regulations. The Board considered the operation of BlackRock’s business continuity plans.
B. The Investment Performance of each
Fund and BlackRock
The Board, including the Independent Board Members, reviewed and considered the performance history of each Fund
throughout the year and at the May Meeting. In preparation for the May Meeting, the Board was provided with reports independently prepared by Broadridge, which included an analysis of each Fund’s performance as of December 31, 2022, as
compared to its Performance Peers. The performance information is based on net asset value (NAV), and utilizes Lipper data. Lipper’s methodology calculates a fund’s total return assuming distributions are reinvested on the ex-date at a
fund’s ex-date NAV. Broadridge ranks funds in quartiles, ranging from first to fourth, where first is the most desirable quartile position and fourth is the least desirable. In connection with its review, the Board received and reviewed
information regarding the investment performance of each Fund as compared to its Performance Peers and certain performance metrics (“Performance Metrics”). The Board and its Performance Oversight Committee regularly review and meet with
Fund management to discuss the performance of each Fund throughout the year.
In evaluating performance, the Board focused particular attention on
funds with less favorable performance records. The Board also noted that while it found the data provided by Broadridge generally useful, it recognized the limitations of such data, including in particular, that notable differences may exist between
a fund and its Performance Peers (for example, the investment objectives and strategies). Further, the Board recognized that the performance data reflects a snapshot of a period as of a particular date and that selecting a different performance
period could produce significantly different results. The Board also acknowledged that long-term performance could be impacted by even one period of significant outperformance or underperformance, and that a single investment theme could have the
ability to disproportionately affect long-term performance.
The Board reviewed and considered BNY’s performance relative to BNY’s
Performance Metrics. Based on an overall rating relative to the Performance Metrics, BNY generally performed in line with expectations. The Board noted that BlackRock believes that the Performance Metrics are an appropriate performance comparison
for BNY, and that BlackRock has explained its rationale for this belief to the Board.
The Board reviewed and considered MYN’s performance
relative to MYN’s Performance Metrics. Based on an overall rating relative to the Performance Metrics, MYN generally performed in line with expectations. The Board noted that BlackRock believes that the Performance Metrics are an appropriate
performance comparison for MYN, and that BlackRock has explained its rationale for this belief to the Board.
The Board reviewed and considered
MYI’s performance relative to MYI’s Performance Metrics. Based on an overall rating relative to the Performance Metrics, MYI generally performed in line with expectations. The Board noted that BlackRock believes that the Performance
Metrics are an appropriate performance comparison for MYI, and that BlackRock has explained its rationale for this belief to the Board.
The Board
reviewed and considered MUJ’s performance relative to MUJ’s Performance Metrics. Based on an overall rating relative to the Performance Metrics, MUJ generally performed in line with expectations. The Board noted that BlackRock believes
that the Performance Metrics are an appropriate performance comparison for MUJ, and that BlackRock has explained its rationale for this belief to the Board.
The Board reviewed and considered MPA’s performance relative to MPA’s Performance Metrics. Based on an overall rating relative to the
Performance Metrics, MPA generally performed in line with expectations. The Board noted that BlackRock believes that the Performance Metrics are an appropriate performance comparison for MPA, and that BlackRock has explained its rationale for this
belief to the Board.
|
|
|
| D I S C L O S U R
E O F I N V E S T M E N T A D
V I S O R Y A G R E E M E N T
S |
|
89 |
Disclosure of Investment Advisory Agreements (continued)
The Board reviewed and considered MIY’s performance relative to MIY’s Performance Metrics. Based on an overall rating relative to the
Performance Metrics, MIY generally performed in line with expectations. The Board noted that BlackRock believes that the Performance Metrics are an appropriate performance comparison for MIY, and that BlackRock has explained its rationale for this
belief to the Board.
C. Consideration of the Advisory/Management Fees and the Estimated Cost of the Services and Estimated Profits Realized by
BlackRock and its Affiliates from their Relationship with each Fund
The Board, including the Independent Board Members, reviewed each
Fund’s contractual management fee rate compared with those of its Expense Peers. The contractual management fee rate represents a combination of the advisory fee and any administrative fees, before taking into account any reimbursements or fee
waivers. The Board also compared each Fund’s total expense ratio, as well as its actual management fee rate as a percentage of managed assets, which is the total assets of each Fund (including any assets attributable to money borrowed for
investment purposes) minus the sum of each Fund’s accrued liabilities (other than money borrowed for investment purposes) to those of its Expense Peers. The total expense ratio represents a fund’s total net operating expenses, excluding
any investment related expenses. The total expense ratio gives effect to any expense reimbursements or fee waivers, and the actual management fee rate gives effect to any management fee reimbursements or waivers. The Board considered that the fee
and expense information in the Broadridge report for each Fund reflected information for a specific period and that historical asset levels and expenses may differ from current levels, particularly in a period of market volatility. The Board
considered the services provided and the fees charged by BlackRock and its affiliates to other types of clients with similar investment mandates, as applicable, including institutional accounts and sub-advised mutual funds (including mutual funds
sponsored by third parties).
The Board received and reviewed statements relating to BlackRock’s financial condition. The Board reviewed
BlackRock’s profitability methodology and was also provided with an estimated profitability analysis that detailed the revenues earned and the expenses incurred by BlackRock for services provided to each Fund. The Board reviewed
BlackRock’s estimated profitability with respect to each Fund and other funds the Board currently oversees for the year ended December 31, 2022 compared to available aggregate estimated profitability data provided for the prior two years.
The Board reviewed BlackRock’s estimated profitability with respect to certain other U.S. fund complexes managed by the Manager and/or its affiliates. The Board reviewed BlackRock’s assumptions and methodology of allocating expenses in the
estimated profitability analysis, noting the inherent limitations in allocating costs among various advisory products. The Board recognized that profitability may be affected by numerous factors including, among other things, fee waivers and expense
reimbursements by the Manager, the types of funds managed, precision of expense allocations and business mix. The Board thus recognized that calculating and comparing profitability at the individual fund level is difficult.
The Board noted that, in general, individual fund or product line profitability of other advisors is not publicly available. The Board reviewed
BlackRock’s overall operating margin, in general, compared to that of certain other publicly traded asset management firms. The Board considered the differences between BlackRock and these other firms, including the contribution of technology
at BlackRock, BlackRock’s expense management, and the relative product mix.
The Board considered whether BlackRock has the financial resources
necessary to attract and retain high quality investment management personnel to perform its obligations under the Agreements and to continue to provide the high quality of services that is expected by the Board. The Board further considered factors
including but not limited to BlackRock’s commitment of time and resources, assumption of risk, and liability profile in servicing each Fund, including in contrast to what is required of BlackRock with respect to other products with similar
investment mandates across the open-end fund, closed-end fund, sub-advised mutual fund, collective investment trust, and institutional separate account product channels, as applicable.
The Board noted that BNY’s contractual management fee rate ranked in the first quartile, and that the actual management fee rate and total expense
ratio ranked in the first and second quartiles, respectively relative to the Expense Peers.
The Board noted that MYN’s contractual management
fee rate ranked in the first quartile, and that the actual management fee rate and total expense ratio each ranked in the first quartile relative to the Expense Peers.
The Board noted that MYI’s contractual management fee rate ranked in the first quartile, and that the actual management fee rate and total expense
ratio each ranked in the first quartile relative to the Expense Peers.
The Board noted that MUJ’s contractual management fee rate ranked in the
first quartile, and that the actual management fee rate and total expense ratio each ranked in the first quartile relative to the Expense Peers.
The
Board noted that MPA’s contractual management fee rate ranked in the first quartile, and that the actual management fee rate and total expense ratio each ranked in the first quartile relative to the Expense Peers.
The Board noted that MIY’s contractual management fee rate ranked in the first quartile, and that the actual management fee rate and total expense
ratio each ranked in the first quartile relative to the Expense Peers.
D. Economies of Scale
Board, including the Independent Board Members, considered the extent to which economies of scale might be realized as the assets of each Fund increase.
The Board also considered the extent to which each Fund benefits from such economies of scale in a variety of ways, and whether there should be changes in the advisory fee rate or breakpoint structure in order to enable each Fund to more fully
participate in these economies of scale. The Board considered each Fund’s asset levels and whether the current fee was appropriate.
Based on the
Board’s review and consideration of the issue, the Board concluded that most closed-end funds do not have fund level breakpoints because closed-end funds generally do not experience substantial growth after the initial public offering.
Closed-end funds are typically priced at scale at a fund’s inception.
|
|
|
| 90 |
|
2 0 2 3 B L A C
K R O C K A N N U A L R E P O R
T T O S H A R E H O L D E R
S |
Disclosure of Investment Advisory Agreements (continued)
E. Other Factors Deemed Relevant by the Board Members
The Board, including the Independent Board Members, also took into account other ancillary or “fall-out” benefits that BlackRock or its
affiliates may derive from BlackRock’s respective relationships with each Fund, both tangible and intangible, such as BlackRock’s ability to leverage its investment professionals who manage other portfolios and its risk management
personnel, an increase in BlackRock’s profile in the investment advisory community, and the engagement of BlackRock’s affiliates as service providers to each Fund, including for administrative, securities lending and cash management
services. With respect to securities lending, during the year the Board also considered information provided by independent third-party consultants related to the performance of each BlackRock affiliate as securities lending agent. The Board also
considered BlackRock’s overall operations and its efforts to expand the scale of, and improve the quality of, its operations. The Board also noted that, subject to applicable law, BlackRock may use and benefit from third-party research obtained
by soft dollars generated by certain registered fund transactions to assist in managing all or a number of its other client accounts.
In connection
with its consideration of the Agreements, the Board also received information regarding BlackRock’s brokerage and soft dollar practices. The Board received reports from BlackRock which included information on brokerage commissions and trade
execution practices throughout the year.
The Board noted the competitive nature of the closed-end fund marketplace, and that shareholders are able to
sell their Fund shares in the secondary market if they believe that each Fund’s fees and expenses are too high or if they are dissatisfied with the performance of each Fund.
The Board also considered the various notable initiatives and projects BlackRock performed in connection with its closed-end fund product line. These
initiatives included developing equity shelf programs; efforts to eliminate product overlap with fund mergers; ongoing services to manage leverage that has become increasingly complex; periodic evaluation of share repurchases and other support
initiatives for certain BlackRock funds; and continued communication efforts with shareholders, fund analysts and financial advisers. With respect to the latter, the Independent Board Members noted BlackRock’s continued commitment to supporting
the secondary market for the common shares of its closed-end funds through a comprehensive secondary market communication program designed to raise investor and analyst awareness and understanding of closed-end funds. BlackRock’s support
services included, among other things: sponsoring and participating in conferences; communicating with closed-end fund analysts covering the BlackRock funds throughout the year; providing marketing and product updates for the closed-end funds; and
maintaining and enhancing its closed-end fund website.
Conclusion
At the June Meeting, in a continuation of the discussions that occurred during the May Meeting, and as a culmination of the Board’s year-long
deliberative process, the Board, including the Independent Board Members, unanimously approved the continuation of the Advisory Agreements between the Manager and each Fund for a one-year term ending June 30, 2024. Based upon its evaluation of
all of the aforementioned factors in their totality, as well as other information, the Board, including the Independent Board Members, was satisfied that the terms of the Agreements were fair and reasonable and in the best interest of each Fund and
its shareholders. In arriving at its decision to approve the Agreements, the Board did not identify any single factor or group of factors as all-important or controlling, but considered all factors together, and different Board Members may have
attributed different weights to the various factors considered. The Independent Board Members were advised by independent legal counsel throughout the deliberative process.
|
|
|
| D I S C L O S U R
E O F I N V E S T M E N T A
D V I S O R Y A G R E E M E
N T S |
|
91 |
Investment Objectives, Policies and Risks
Recent Changes
The following information is a summary of
certain changes since July 31, 2022. This information may not reflect all of the changes that have occurred since you purchased the relevant Fund.
During each Fund’s most recent fiscal year, there were no material changes in the Fund’s investment objectives or policies that have not been
approved by shareholders or in the principal risk factors associated with investment in the Fund.
Investment Objectives and Policies
BlackRock MuniHoldings New Jersey Quality Fund, Inc. (MUJ)
The Fund’s investment objective is to provide shareholders with current income exempt from federal income tax and New Jersey personal income taxes.
The investment objective of the Fund is a fundamental policy that may not be changed without a vote of a majority of the Fund’s outstanding voting securities.
The Fund seeks to achieve its investment objective by investing primarily in a portfolio of municipal obligations, the interest on which, in the opinion
of bond counsel to the issuer, is exempt from federal income tax and New Jersey personal income taxes (“New Jersey Municipal Bonds”). The Fund invests substantially all (at least 80%) of its assets in New Jersey Municipal Bonds, except at
times when BlackRock Advisors, LLC (the “Manager”) considers that New Jersey Municipal Bonds of sufficient quantity and quality are unavailable at suitable prices. To the extent that the Manager considers that suitable New Jersey Municipal
Bonds are not available for investment, the Fund may purchase municipal obligations exempt from federal income taxes but not New Jersey personal income taxes (“Municipal Bonds”). The Fund may invest directly in securities or synthetically
through the use of derivatives. The Fund will maintain at least 80% of its assets in New Jersey Municipal Bonds, except during interim periods pending investment of the net proceeds of public offerings of its securities and during temporary
defensive periods. Under normal circumstances, at least 80% of the Fund’s assets will be invested in municipal obligations with remaining maturities of one year or more. There can be no assurance that the Fund’s investment objective will
be realized.
Ordinarily, the Fund does not intend to realize significant investment income subject to federal income tax and New Jersey personal
income taxes. The Fund may invest all or a portion of its assets in certain tax-exempt securities classified as “private activity bonds” (in general, bonds that benefit non-governmental entities) that may subject certain investors in the
Fund to a federal alternative minimum tax.
The Fund may also invest in securities not issued by or on behalf of a state or territory or by an agency
or instrumentality thereof, if the Fund nevertheless believes such securities pay interest or distributions that are exempt from federal income taxation (“Non-Municipal Tax-Exempt Securities”). Non-Municipal Tax-Exempt Securities may
include securities issued by other investment companies that invest in New Jersey Municipal Bonds and Municipal Bonds, to the extent such investments are permitted by the Investment Company Act of 1940, as amended (the “1940 Act”). Other
Non-Municipal Tax-Exempt Securities could include trust certificates or other instruments evidencing interests in one or more long-term New Jersey Municipal Bonds or Municipal Bonds. Certain Non-Municipal Tax-Exempt Securities may be characterized
as derivative instruments. For purposes of the Fund’s investment objective and policies, Non-Municipal Tax-Exempt Securities that pay interest that is exempt from federal income taxes and New Jersey personal income taxes will be considered
“New Jersey Municipal Bonds” and Non-Municipal Tax-Exempt Securities that pay interest that is exempt from federal income taxes will be considered “Municipal Bonds.”
The Fund invests in investment grade New Jersey Municipal Bonds and Municipal Bonds that are rated at the date of purchase in the four highest rating
categories of Moody’s Investors Service, Inc. (“Moody’s”) (currently Aaa, Aa, A and Baa), S&P Global Ratings (“S&P”) (currently AAA, AA, A and BBB) or Fitch Ratings, Inc. (“Fitch”) (currently AAA, AA,
A and BBB) or, if unrated, are considered to be of comparable quality by the Manager. In the case of long-term debt, the investment grade rating categories are AAA through BBB for S&P and Fitch and Aaa through Baa for Moody’s. In the case
of short-term notes, the investment grade rating categories are SP-1+ through SP-2 for S&P, MIG 1 through MIG 3 for Moody’s and F-1+ through F-3 for Fitch. In the case of tax-exempt commercial paper, the investment grade rating
categories are A-1+ through A-3 for S&P, P-1 through P-3 for Moody’s and F-1+ through F-3 for Fitch. Obligations ranked in the lowest investment grade rating category (BBB, SP-2 and A-3 for S&P; Baa, MIG 3 and P-3 for
Moody’s; and BBB and F-3 for Fitch), while considered “investment grade,” may have certain speculative characteristics. There may be sub-categories or gradations indicating relative standing within the rating categories set forth
above. In assessing the quality of New Jersey Municipal Bonds and Municipal Bonds with respect to the foregoing requirements, the Manager takes into account the portfolio insurance as well as the nature of any letters of credit or similar credit
enhancement to which particular New Jersey Municipal Bonds and Municipal Bonds are entitled and the creditworthiness of the insurance company or financial institution that provided such insurance or credit enhancements. Insurance is expected to
protect the Fund against losses caused by a bond issuer’s failure to make interest or principal payments. However, insurance does not protect the Fund or its shareholders against losses caused by declines in a bond’s market value. Also,
the Fund cannot be certain that any insurance company does not make these payments. If a bond’s insurer fails to fulfill its obligations or loses its credit rating, the value of the bond could drop.
The Fund may invest up to 20% of its managed assets in securities that are rated below investment grade, which are securities rated Ba or below by
Moody’s, BB or below by S&P or Fitch or are considered by the Manager to be of comparable quality, at the time of purchase, subject to the Fund’s other investment policies. Below investment grade quality is regarded as predominantly
speculative with respect to the issuer’s capacity to pay interest and repay principal. Such securities commonly are referred to as “high yield” or “junk” bonds.
The Fund may invest in variable rate demand obligations (“VRDOs”) and VRDOs in the form of participation interests (“Participating
VRDOs”) in variable rate tax-exempt obligations held by a financial institution, typically a commercial bank. The VRDOs in which the Fund may invest are tax-exempt obligations, in the opinion of counsel to the issuer, that contain a floating or
variable interest rate adjustment formula and a right of demand on the part of the holder thereof to receive payment of the unpaid principal balance plus accrued interest on a short notice period not to exceed seven days. There is, however, the
possibility that because of default or insolvency the demand feature of VRDOs may not be honored. The interest rates are adjustable at intervals (ranging from daily to up to one year) to some prevailing market rate for similar investments, such
adjustment formula being calculated to maintain the market value of the VRDOs, at approximately the par value of the VRDOs on the adjustment date. The adjustments typically are based upon SIFMA or some other appropriate interest rate adjustment
index. VRDOs that contain an unconditional right of demand to receive payment of the unpaid principal balance plus accrued interest on a notice period exceeding seven days may be deemed to be illiquid securities. Participating VRDOs provide the Fund
with a specified undivided interest (up to 100%) in the underlying obligation and the right to demand payment of the unpaid principal balance plus accrued interest on the Participating VRDOs from the financial institution on a specified number of
days’ notice, not to exceed seven days.
|
|
|
| 92 |
|
2 0 2 3 B L A C
K R O C K A N N U A L R E P O R
T T O S H A R E H O L D E R
S |
Investment Objectives, Policies and Risks (continued)
The average maturity of the Fund’s portfolio securities varies based upon the Manager’s assessment of economic and market conditions. The net
asset value of the shares of common stock of a closed-end investment company such as the Fund, which invests primarily in fixed-income securities, changes as the general levels of interest rates fluctuate. When interest rates decline, the value of a
fixed income portfolio can be expected to rise. Conversely, when interest rates rise, the value of a fixed income portfolio can be expected to decline. Prices of longer-term securities generally fluctuate more in response to interest rate changes
than do short-term or medium-term securities. These changes in net asset value are likely to be greater in the case of a fund having a leveraged capital structure, such as that used by the Fund.
The Fund invests primarily in long-term New Jersey Municipal Bonds and Municipal Bonds with a maturity of more than ten years. However, the Fund may also
invest in intermediate-term New Jersey Municipal Bonds and Municipal Bonds with a maturity of between three years and ten years. The Fund may also invest in short-term tax-exempt securities, short-term U.S. Government securities, repurchase
agreements or cash. Investments in such short-term securities or cash will not exceed 20% of the Fund’s total assets, except during interim periods pending investment of the net proceeds from public offerings of the Fund’s securities or in
anticipation of the repurchase or redemption of the Fund’s securities and temporary periods when, in the opinion of the Manager, prevailing market or economic conditions warrant. The Fund does not ordinarily intend to realize significant
interest income that is subject to federal income tax and New Jersey personal income taxes.
Leverage: The Fund may utilize leverage to seek to
enhance the yield and net asset value of its common shares. However, this objective cannot be achieved in all interest rate environments. The Fund currently leverages its assets through the use of variable rate demand preferred shares (“VRDP
Shares”) and residual interest municipal tender option bonds (“TOB Residuals”), which are derivative interests in municipal bonds. The TOB Residuals in which the Fund will invest pay interest or income that, in the opinion of counsel
to the issuer of such TOB Residuals, is exempt from regular U.S. federal income tax.
The Fund may enter into reverse repurchase agreements with
respect to its portfolio investments subject to the Fund’s investment restrictions.
The Fund is authorized to borrow money in amounts of up to
5% of the value of its total assets at the time of such borrowings; provided, however, that the Fund is authorized to borrow moneys in amounts of up to 33 1/3% of the value of its total assets at the time of such borrowings to finance the repurchase
of its own common shares pursuant to tender offers or otherwise to redeem or repurchase preferred shares.
BlackRock MuniYield Michigan Quality
Fund (MIY)
The Fund’s investment objective is to provide shareholders with as high a level of current income exempt from federal and
Michigan income taxes as is consistent with its investment policies and prudent investment management. The Fund seeks to achieve its investment objective by investing at least 80% of an aggregate of the Fund’s net assets (including proceeds
from the issuance of any preferred stock) and the proceeds of any borrowings for investment purposes, in a portfolio of municipal obligations issued by or on behalf of the State of Michigan, its political subdivisions, agencies and instrumentalities
and by other qualifying issuers, each of which pays interest that, in the opinion of bond counsel to the issuer, is excludable from gross income for federal income tax purposes (except that the interest may be includable in taxable income for
purposes of the federal alternative minimum tax) and exempt from Michigan income taxes (“Michigan Municipal Bonds”). The Fund also may invest in municipal obligations issued by or on behalf of states, territories and possessions of the
United States and their political subdivisions, agencies or instrumentalities, each of which pays interest that is excludable from gross income for federal income tax purposes, in the opinion of bond counsel to the issuer, but is not excludable from
gross income for Michigan income tax purposes (“Municipal Bonds”). Unless otherwise noted, the term “Municipal Bonds” also includes Michigan Municipal Bonds. The Fund may invest directly in securities or synthetically through the
use of derivatives. In general, the Fund does not intend for its investments to earn a large amount of interest income that is (i) includable in gross income for federal income tax purposes or (ii) not exempt from Michigan income taxes.
From time to time, the Fund may realize taxable capital gains. The Fund’s investment objective and its policy of investing at least 80% of an aggregate of the Fund’s net assets (including proceeds from the issuance of any preferred stock)
and the proceeds of any borrowings for investment purposes, in Municipal Bonds are fundamental policies that may not be changed without the approval of a majority of the outstanding voting securities of the Fund (as defined in the Investment Company
Act of 1940, as amended (the “1940 Act”)). There can be no assurance that the Fund’s investment objective will be realized.
The Fund
may invest in certain tax-exempt securities classified as “private activity bonds” (or industrial development bonds, under pre-1986 law) (“PABs”) (in general, bonds that benefit non-governmental entities) that may subject certain
investors in the Fund to an alternative minimum tax. The percentage of the Fund’s total assets invested in PABs will vary from time to time.
Under normal market conditions, the Fund expects to invest primarily in a portfolio of long-term Municipal Bonds that are commonly referred to as
“investment grade” securities, which are obligations rated at the time of purchase within the four highest-quality ratings as determined by either Moody’s Investors Service, Inc. (“Moody’s”) (currently Aaa, Aa, A and
Baa), S&P Global Ratings (“S&P”) (currently AAA, AA, A and BBB) or Fitch Ratings, Inc. (“Fitch”) (currently AAA, AA, A and BBB) or are considered by BlackRock Advisors, LLC (the “Manager”) to be of comparable
quality. In the case of short-term notes, the investment grade rating categories are SP-1+ through SP-2 for S&P, MIG 1 through MIG 3 for Moody’s and F1+ through F3 for Fitch. In the case of tax-exempt commercial paper, the
investment grade rating categories are A-1+ through A-3 for S&P, Prime-1 through Prime-3 for Moody’s and F1+ through F3 for Fitch. Obligations ranked in the lowest investment grade rating category (BBB, SP-2 and A-3 for S&P;
Baa, MIG 3 and Prime-3 for Moody’s; and BBB and F3 for Fitch), while considered “investment grade,” may have certain speculative characteristics. There may be sub-categories or gradations indicating relative standing within the rating
categories set forth above. In assessing the quality of Municipal Bonds with respect to the foregoing requirements, the Manager takes into account the nature of any letters of credit or similar credit enhancement to which particular Municipal Bonds
are entitled and the creditworthiness of the financial institution that provided such credit enhancement. Insurance is expected to protect the Fund against losses caused by a bond issuer’s failure to make interest or principal payments.
However, insurance does not protect the Fund or its shareholders against losses caused by declines in a bond’s market value. If a bond’s insurer fails to fulfill its obligations or loses its credit rating, the value of the bond could drop.
If unrated, such securities will possess creditworthiness comparable, in the opinion of the Manager, to other obligations in which the Fund may invest.
|
|
|
| I N V E S T M E N
T O B J E C T I V E S , P O L I
C I E S A N D R I S K S |
|
93 |
Investment Objectives, Policies and Risks (continued)
The Fund may invest up to 20% of its managed assets in securities that are rated below investment grade, which are securities rated Ba or below by
Moody’s, BB or below by S&P or Fitch or are considered by the Manager to be of comparable quality, at the time of purchase, subject to the Fund’s other investment policies. Below investment grade quality is regarded as predominantly
speculative with respect to the issuer’s capacity to pay interest and repay principal. Such securities commonly are referred to as “high yield” or “junk” bonds.
All percentage and ratings limitations on securities in which the Fund may invest apply at the time of making an investment and shall not be considered
violated as a result of subsequent market movements or if an investment rating is subsequently downgraded to a rating that would have precluded the Fund’s initial investment in such security. In the event that the Fund disposes of a portfolio
security subsequent to its being downgraded, the Fund may experience a greater risk of loss than if such security had been sold prior to such downgrade.
The average maturity of the Fund’s portfolio securities varies from time to time based upon an assessment of economic and market conditions by the
Manager. The Fund’s portfolio at any given time may include both long-term and intermediate-term municipal bonds.
The net asset value of the
shares of common stock of a closed-end investment company, such as the Fund, which invests primarily in fixed income securities, changes as the general levels of interest rates fluctuate. When interest rates decline, the value of a fixed income
portfolio can be expected to rise. Conversely, when interest rates rise, the value of a fixed income portfolio can be expected to decline. Prices of longer term securities generally fluctuate more in response to interest rate changes than do shorter
term securities. These changes in net asset value are likely to be greater in the case of a fund having a leveraged capital structure, such as the Fund.
For temporary periods or to provide liquidity, the Fund has the authority to invest as much as 20% of its total assets in tax-exempt and taxable money
market obligations with a maturity of one year or less (such short-term obligations being referred to herein as “Temporary Investments”). In addition, the Fund reserves the right as a defensive measure to invest temporarily a greater
portion of its assets in Temporary Investments, when, in the opinion of the Manager, prevailing market or financial conditions warrant. Taxable money market obligations will yield taxable income. The Fund also may invest in variable rate demand
obligations (“VRDOs”) and VRDOs in the form of participation interests (“Participating VRDOs”) in variable rate tax-exempt obligations held by a financial institution. The Fund’s hedging strategies are not fundamental
policies and may be modified by the Board of Directors of the Fund without the approval of the Fund’s stockholders. The Fund is also authorized to invest in indexed and inverse floating rate obligations for hedging purposes and to seek to
enhance return.
The Fund may invest in securities not issued by or on behalf of a state or territory or by an agency or instrumentality thereof, if
the Fund receives an opinion of counsel to the issuer that such securities pay interest that is excludable from gross income for federal income tax purposes and, if applicable, exempt from Michigan income taxes (“Non-Municipal Tax-Exempt
Securities”). Non-Municipal Tax-Exempt Securities could include trust certificates, partnership interests or other instruments evidencing interest in one or more long-term Municipal Bonds. Non-Municipal Tax-Exempt Securities also may include
securities issued by other investment companies that invest in Municipal Bonds, to the extent such investments are permitted by the Fund’s investment restrictions and applicable law. Non-Municipal Tax-Exempt Securities are subject to the same
risks associated with an investment in Municipal Bonds as well as many of the risks associated with investments in derivatives. If the Internal Revenue Service were to issue any adverse ruling or take an adverse position with respect to the taxation
on these types of securities, there is a risk that the interest paid on such securities would be deemed taxable at the federal level.
The Fund
ordinarily does not intend to realize significant investment income not exempt from federal income tax. From time to time, the Fund may realize taxable capital gains.
Federal tax legislation may limit the types and volume of bonds the interest on which qualifies for a federal income tax-exemption. As a result, current
legislation and legislation that may be enacted in the future may affect the availability of Municipal Bonds for investment by the Fund.
Leverage:
The Fund may utilize leverage to seek to enhance the yield and net asset value of its common shares. However, this objective cannot be achieved in all interest rate environments. The Fund currently leverages its assets through the use of
variable rate demand preferred shares (“VRDP Shares”) and residual interest municipal tender option bonds (“TOB Residuals”), which are derivative interests in municipal bonds. The TOB Residuals in which the Fund will invest pay
interest or income that, in the opinion of counsel to the issuer of such TOB Residuals, is exempt from regular U.S. federal income tax.
The Fund may
enter into reverse repurchase agreements with respect to its portfolio investments subject to the Fund’s investment restrictions. The Fund may enter into “dollar roll” transactions.
The Fund may leverage its portfolio by entering into one or more credit facilities.
The Fund may enter into derivative transactions that have economic leverage embedded in them.
The Fund may also borrow money as a temporary measure for extraordinary or emergency purposes, including the payment of dividends and the settlement of
securities transactions which otherwise might require untimely dispositions of Fund securities. Certain short-term borrowings (such as for cash management purposes) are not subject to the 1940 Act’s limitations on leverage if (i) repaid
within 60 days, and (ii) not in excess of 5% of the Fund’s total assets.
BlackRock MuniYield New York Quality Fund, Inc. (MYN)
The Fund’s investment objective is to provide stockholders with as high a level of current income exempt from federal income taxes and New York State
and New York City personal income taxes as is consistent with its investment policies and prudent investment management. The Fund seeks to achieve its investment objective by investing, as a fundamental policy, at least 80% of an aggregate of the
Fund’s net assets (including proceeds from the issuance of any preferred stock) and the proceeds of any borrowings for investment purposes, in a portfolio of municipal obligations issued by or on behalf of the State of New York, its political
subdivisions, agencies and instrumentalities and by other qualifying instrumentalities, each of which pays interest that, in the opinion of bond counsel to the issuer, is excludable from gross income for federal income tax purposes (except that the
interest may be includable in taxable income for purposes of the federal alternative minimum tax) and exempt from New York State and New York City personal income taxes (“New York Municipal Bonds”). The Fund also may invest in municipal
obligations issued by or on behalf of states, territories and possessions of the United States and their political subdivisions, agencies or instrumentalities, which pay interest that is excludable from gross income for federal income tax purposes,
in the opinion of bond
|
|
|
| 94 |
|
2 0 2 3 B L A C
K R O C K A N N U A L R E P O R
T T O S H A R E H O L D E R
S |
Investment Objectives, Policies and Risks (continued)
counsel to the issuer, but is not exempt from New York State and New York City personal income taxes (“Municipal Bonds”). Unless otherwise
noted, the term “Municipal Bonds” also includes New York Municipal Bonds. The Fund may invest directly in securities or synthetically through the use of derivatives. In general, the Fund does not intend for its investments to earn a large
amount of interest income that is (i) includable in gross income for federal income tax purposes or (ii) not exempt from New York State and New York City personal income taxes. The Fund’s investment objective and its policy of
investing at least 80% of an aggregate of the Fund’s net assets (including proceeds from the issuance of any preferred stock) and the proceeds of any borrowings for investment purposes, in New York Municipal Bonds are fundamental policies that
may not be changed without the approval of a majority of the outstanding voting securities of the Fund (as defined in the Investment Company Act of 1940, as amended (the “1940 Act”)). There can be no assurance that the Fund’s
investment objective will be realized.
The Fund may invest in certain tax-exempt securities classified as “private activity bonds” (or
industrial development bonds, under pre-1986 law) (“PABs”) (in general, bonds that benefit non-governmental entities) that may subject certain investors in the Fund to an alternative minimum tax. The percentage of the Fund’s total
assets invested in PABs will vary from time to time.
Under normal market conditions, the Fund expects to invest primarily in a portfolio of long-term
Municipal Bonds that are commonly referred to as “investment grade” securities, which are obligations rated at the time of purchase within the four highest-quality ratings as determined by either Moody’s Investors Service, Inc.
(“Moody’s”) (currently Aaa, Aa, A and Baa), S&P Global Ratings (“S&P”) (currently AAA, AA, A and BBB) or Fitch Ratings, Inc. (“Fitch”) (currently AAA, AA, A and BBB) or are considered by BlackRock Advisors,
LLC (the “Manager”) to be of comparable quality. In the case of short-term notes, the investment grade rating categories are SP-1+ through SP-2 for S&P, MIG 1 through MIG 3 for Moody’s and F1+ through F3 for Fitch. In
the case of tax-exempt commercial paper, the investment grade rating categories are A-1+ through A-3 for S&P, Prime-1 through Prime-3 for Moody’s and F1+ through F3 for Fitch. Obligations ranked in the lowest investment grade
rating category (BBB, SP-2 and A-3 for S&P; Baa, MIG 3 and Prime-3 for Moody’s; and BBB and F3 for Fitch), while considered “investment grade,” may have certain speculative characteristics. There may be sub-categories or
gradations indicating relative standing within the rating categories set forth above. In assessing the quality of Municipal Bonds with respect to the foregoing requirements, the Manager takes into account the nature of any letters of credit or
similar credit enhancement to which particular Municipal Bonds are entitled and the creditworthiness of the financial institution that provided such credit enhancement. Insurance is expected to protect the Fund against losses caused by a bond
issuer’s failure to make interest or principal payments. However, insurance does not protect the Fund or its stockholders against losses caused by declines in a bond’s market value. If a bond’s insurer fails to fulfill its obligations
or loses its credit rating, the value of the bond could drop. If unrated, such securities will possess creditworthiness comparable, in the opinion of the Manager, to other obligations in which the Fund may invest.
The Fund may invest up to 20% of its managed assets in securities that are rated below investment grade, which are securities rated at the time of
purchase Ba or below by Moody’s, BB or below by S&P or Fitch, or securities determined by the Manager to be of comparable quality. Below investment grade quality is regarded as predominantly speculative with respect to the issuer’s
capacity to pay interest and repay principal. Such securities commonly are referred to as “high yield” or “junk” bonds.
All
percentage and ratings limitations on securities in which the Fund may invest apply at the time of making an investment and shall not be considered violated as a result of subsequent market movements or if an investment rating is subsequently
downgraded to a rating that would have precluded the Fund’s initial investment in such security. In the event that the Fund disposes of a portfolio security subsequent to its being downgraded, the Fund may experience a greater risk of loss than
if such security had been sold prior to such downgrade.
The average maturity of the Fund’s portfolio securities varies from time to time based
upon an assessment of economic and market conditions by the Manager. The Fund’s portfolio at any given time may include both long-term and intermediate-term municipal bonds.
The net asset value of the shares of common stock of a closed-end investment company, such as the Fund, which invests primarily in fixed income
securities, changes as the general levels of interest rates fluctuate. When interest rates decline, the value of a fixed income portfolio can be expected to rise. Conversely, when interest rates rise, the value of a fixed income portfolio can be
expected to decline. Prices of longer term securities generally fluctuate more in response to interest rate changes than do shorter term securities. These changes in net asset value are likely to be greater in the case of a fund having a leveraged
capital structure, such as the Fund.
For temporary periods or to provide liquidity, the Fund has the authority to invest as much as 20% of its total
assets in tax-exempt and taxable money market obligations with a maturity of one year or less (such short-term obligations being referred to herein as “Temporary Investments”). In addition, the Fund reserves the right as a defensive
measure to invest temporarily a greater portion of its assets in Temporary Investments, when, in the opinion of the Manager, prevailing market or financial conditions warrant. Taxable money market obligations will yield taxable income. The Fund also
may invest in variable rate demand obligations (“VRDOs”) and VRDOs in the form of participation interests (“Participating VRDOs”) in variable rate tax-exempt obligations held by a financial institution. The Fund’s hedging
strategies are not fundamental policies and may be modified by the Board of Directors of the Fund without the approval of the Fund’s stockholders. The Fund is also authorized to invest in indexed and inverse floating rate obligations for
hedging purposes and to seek to enhance return.
The Fund may invest in securities not issued by or on behalf of a state or territory or by an agency
or instrumentality thereof, if the Fund receives an opinion of counsel to the issuer that such securities pay interest that is excludable from gross income for federal income tax purposes and, if applicable, exempt from New York State and New York
City personal income taxes (“Non-Municipal Tax-Exempt Securities”). Non-Municipal Tax-Exempt Securities could include trust certificates, partnership interests or other instruments evidencing interest in one or more long-term Municipal
Bonds. Non-Municipal Tax-Exempt Securities also may include securities issued by other investment companies that invest in Municipal Bonds, to the extent such investments are permitted by the Fund’s investment restrictions and applicable law.
Non-Municipal Tax-Exempt Securities are subject to the same risks associated with an investment in Municipal Bonds as well as many of the risks associated with investments in derivatives. If the Internal Revenue Service were to issue any adverse
ruling or take an adverse position with respect to the taxation on these types of securities, there is a risk that the interest paid on such securities would be deemed taxable at the federal level.
The Fund ordinarily does not intend to realize significant investment income not exempt from federal income tax. From time to time, the Fund may realize
taxable capital gains.
Federal tax legislation may limit the types and volume of bonds the interest on which qualifies for a federal income
tax-exemption. As a result, current legislation and legislation that may be enacted in the future may affect the availability of Municipal Bonds for investment by the Fund.
|
|
|
| I N V E S T M E N
T O B J E C T I V E S , P O L I
C I E S A N D R I S K S |
|
95 |
Investment Objectives, Policies and Risks (continued)
Leverage: The Fund may utilize leverage to seek to enhance the yield and net asset value of its common shares. However, this objective cannot be
achieved in all interest rate environments. The Fund currently leverages its assets through the use of variable rate demand preferred shares (“VRDP Shares”) and residual interest municipal tender option bonds (“TOB Residuals”),
which are derivative interests in municipal bonds. The TOB Residuals in which the Fund will invest pay interest or income that, in the opinion of counsel to the issuer of such TOB Residuals, is exempt from regular U.S. federal income tax.
The Fund may enter into reverse repurchase agreements with respect to its portfolio investments subject to the Fund’s investment restrictions. The
Fund may enter into “dollar roll” transactions.
The Fund may enter into derivative transactions that have economic leverage embedded in them.
The Fund may leverage its portfolio by entering into one or more credit facilities.
The Fund may also borrow money as a temporary measure for extraordinary or emergency purposes, including the payment of dividends and the settlement of
securities transactions which otherwise might require untimely dispositions of Fund securities. Certain short-term borrowings (such as for cash management purposes) are not subject to the 1940 Act’s limitations on leverage if (i) repaid
within 60 days, and (ii) not in excess of 5% of the Fund’s total assets.
BlackRock MuniYield Pennsylvania Quality Fund (MPA)
The Fund’s investment objective is to provide shareholders with as high a level of current income exempt from U.S. federal and Pennsylvania income
taxes as is consistent with its investment policies and prudent investment management. The Fund seeks to achieve its investment objective by investing, as a fundamental policy, at least 80% of an aggregate of the Fund’s net assets (including
proceeds from the issuance of any preferred shares) and the proceeds of any borrowings for investment purposes, in a portfolio of municipal obligations issued by or on behalf of the State of Pennsylvania, its political subdivisions, agencies and
instrumentalities and by other qualifying issuers, each of which pays interest that, in the opinion of bond counsel to the issuer, is excludable from gross income for federal income tax purposes (except that the interest may be includable in taxable
income for purposes of the federal alternative minimum tax) and exempt from Pennsylvania income taxes (“Pennsylvania Municipal Bonds”). The Fund also may invest in municipal obligations issued by or on behalf of states, territories and
possessions of the United States and their political subdivisions, agencies or instrumentalities, each of which pays interest that is excludable from gross income for federal income tax purposes, in the opinion of bond counsel to the issuer, but is
not excludable from gross income for Pennsylvania income tax purposes (“Municipal Bonds”). Unless otherwise noted, the term “Municipal Bonds” also includes Pennsylvania Municipal Bonds. The Fund may invest directly in securities
or synthetically through the use of derivatives. In general, the Fund does not intend for its investments to earn a large amount of interest income that is (i) includable in gross income for federal income tax purposes or (ii) not exempt
from Pennsylvania income taxes. From time to time, the Fund may realize taxable capital gains.
The Fund’s investment objective and its policy of
investing at least 80% of an aggregate of the Fund’s net assets (including proceeds from the issuance of any preferred shares) and the proceeds of any borrowings for investment purposes, in Pennsylvania Municipal Bonds are fundamental policies
that may not be changed without the approval of a majority of the outstanding voting securities of the Fund (as defined in the Investment Company Act of 1940, as amended (the “1940 Act”)). There can be no assurance that the Fund’s
investment objective will be realized.
The Fund may invest in certain tax-exempt securities classified as “private activity bonds” (or
industrial development bonds, under pre-1986 law) (“PABs”) (in general, bonds that benefit non-governmental entities) that may subject certain investors in the Fund to an alternative minimum tax. The percentage of the Fund’s total
assets invested in PABs will vary from time to time.
Under normal market conditions, the Fund expects to invest primarily in a portfolio of long-term
Municipal Bonds that are commonly referred to as “investment grade” securities, which are obligations rated at the time of purchase within the four highest-quality ratings as determined by either Moody’s Investors Service, Inc.
(“Moody’s”) (currently Aaa, Aa, A and Baa), S&P currently AAA, AA, A and BBB) or Fitch Ratings (“Fitch”) (currently AAA, AA, A and BBB). In the case of short-term notes, the investment grade rating categories are
SP-1+ through SP-2 for S&P, MIG 1 through MIG 3 for Moody’s and F1+ through F3 for Fitch. In the case of tax-exempt commercial paper, the investment grade rating categories are A-1+ through A-3 for S&P, Prime-1 through
Prime-3 for Moody’s and F1+ through F3 for Fitch. Obligations ranked in the lowest investment grade rating category (BBB, SP-2 and A-3 for S&P; Baa, MIG 3 and Prime-3 for Moody’s; and BBB and F3 for Fitch), while considered
“investment grade,” may have certain speculative characteristics. There may be sub-categories or gradations indicating relative standing within the rating categories set forth above. In assessing the quality of Municipal Bonds with respect
to the foregoing requirements, BlackRock Advisors, LLC (the “Manager”) takes into account the nature of any letters of credit or similar credit enhancement to which particular Municipal Bonds are entitled and the creditworthiness of the
financial institution that provided such credit enhancement. If unrated, such securities will possess creditworthiness comparable, in the opinion of the Manager, to other obligations in which the Fund may invest. Insurance is expected to protect the
Fund against losses caused by a bond issuer’s failure to make interest or principal payments. However, insurance does not protect the Fund or its shareholders against losses caused by declines in a bond’s market value. If a bond’s
insurer fails to fulfill its obligations or loses its credit rating, the value of the bond could drop. If unrated, such securities will possess creditworthiness comparable, in the opinion of the Manager, to other obligations in which the Fund may
invest.
The Fund may invest up to 20% of its managed assets in securities that are rated below investment grade, which are securities rated Ba or
below by Moody’s, BB or below by S&P or Fitch or are considered by the Manager to be of comparable quality, at the time of purchase, subject to the Fund’s other investment policies. Below investment grade quality is regarded as
predominantly speculative with respect to the issuer’s capacity to pay interest and repay principal. Such securities commonly are referred to as “high yield” or “junk” bonds.
All percentage and ratings limitations on securities in which the Fund may invest apply at the time of making an investment and shall not be considered
violated as a result of subsequent market movements or if an investment rating is subsequently downgraded to a rating that would have precluded the Fund’s initial investment in such security. In the event that the Fund disposes of a portfolio
security subsequent to its being downgraded, the Fund may experience a greater risk of loss than if such security had been sold prior to such downgrade.
|
|
|
| 96 |
|
2 0 2 3 B L A C
K R O C K A N N U A L R E P O R
T T O S H A R E H O L D E R
S |
Investment Objectives, Policies and Risks (continued)
The average maturity of the Fund’s portfolio securities varies from time to time based upon an assessment of economic and market conditions by the
Manager. The Fund’s portfolio at any given time may include long-term, intermediate-term and short-term Municipal Bonds.
The net asset value of
the shares of common stock of a closed-end investment company, such as the Fund, which invests primarily in fixed income securities, changes as the general levels of interest rates fluctuate. When interest rates decline, the value of a fixed income
portfolio can be expected to rise. Conversely, when interest rates rise, the value of a fixed income portfolio can be expected to decline. Prices of longer term securities generally fluctuate more in. response to interest rate changes than do
shorter term securities. These changes in net asset value are likely to be greater in the case of a fund having a leveraged capital structure, such as the Fund.
For temporary periods or to provide liquidity, the Fund has the authority to invest as much as 20% of its total assets in tax-exempt and taxable money
market obligations with a maturity of one year or less (such short-term obligations being referred to herein as “Temporary Investments”). In addition, the Fund reserves the right as a defensive measure to invest temporarily a greater
portion of its assets in Temporary Investments, when, in the opinion of the Manager, prevailing market or financial conditions warrant. Taxable money market obligations will yield taxable income. The Fund also may invest in variable rate demand
obligations (“VRDOs”) and VRDOs in the form of participation interests (“Participating VRDOs”) in variable rate tax-exempt obligations held by a financial institution. The Fund’s hedging strategies are not fundamental
policies and may be modified by the Board of Trustees of the Fund without the approval of the Fund’s shareholders. The Fund is also authorized to invest in indexed and inverse floating rate obligations for hedging purposes and to seek to
enhance return.
The Fund may invest in securities not issued by or on behalf of a state or territory or by an agency or instrumentality thereof, if
the Fund receives an opinion of counsel to the issuer that such securities pay interest that is excludable from gross income for federal income tax purposes and, if applicable, exempt from Pennsylvania income taxes (“Non-Municipal Tax-Exempt
Securities”). Non-Municipal Tax-Exempt Securities could include trust certificates, partnership interests or other instruments evidencing interest in one or more long-term Municipal Bonds. Non-Municipal Tax-Exempt Securities also may include
securities issued by other investment companies that invest in Municipal Bonds, to the extent such investments are permitted by the Fund’s investment restrictions and applicable law. Non-Municipal Tax-Exempt Securities are subject to the same
risks associated with an investment in Municipal Bonds as well as many of the risks associated with investments in derivatives. If the Internal Revenue Service were to issue any adverse ruling or take an adverse position with respect to the taxation
on these types of securities, there is a risk that the interest paid on such securities would be deemed taxable at the federal level.
The Fund
ordinarily does not intend to realize significant investment income not exempt from federal and Pennsylvania income taxes. From time to time, the Fund may realize taxable capital gains.
Federal tax legislation may limit the types and volume of bonds the interest on which qualifies for a federal income tax-exemption. As a result, current
legislation and legislation that may be enacted in the future may affect the availability of Municipal Bonds for investment by the Fund.
Leverage:
The Fund may utilize leverage to seek to enhance the yield and net asset value of its common shares. However, this objective cannot be achieved in all interest rate environments. The Fund currently leverages its assets through the use of
variable rate demand preferred shares (“VRDP Shares”) and residual interest municipal tender option bonds (“TOB Residuals”), which are derivative interests in municipal bonds. The TOB Residuals in which the Fund will invest pay
interest or income that, in the opinion of counsel to the issuer of such TOB Residuals, is exempt from regular U.S. federal income tax.
The Fund may
enter into reverse repurchase agreements with respect to its portfolio investments subject to the Fund’s investment restrictions.
The Fund may enter into
derivative transactions that have economic leverage embedded in them.
The Fund may also borrow money as a temporary measure for extraordinary or
emergency purposes, including the payment of dividends and the settlement of securities transactions which otherwise might require untimely dispositions of Fund securities. Certain short-term borrowings (such as for cash management purposes) are not
subject to the 1940 Act’s limitations on leverage if (i) repaid within 60 days, and (ii) not in excess of 5% of the Fund’s total assets.
BlackRock MuniYield Quality Fund III, Inc. (MYI)
The Fund’s investment objective is to provide stockholders with as high a level of current income exempt from federal income taxes as is consistent
with its investment policies and prudent investment management. The Fund seeks to achieve its investment objective by investing at least 80% of an aggregate of the Fund’s net assets (including proceeds from the issuance of any preferred stock)
and the proceeds of any borrowings for investment purposes, in a portfolio of municipal obligations issued by or on behalf of states, territories and possessions of the United States and their political subdivisions, agencies or instrumentalities,
each of which pays interest that, in the opinion of bond counsel to the issuer, is excludable from gross income for federal income tax purposes (except that the interest may be includable in taxable income for purposes of the federal alternative
minimum tax) (“Municipal Bonds”). The Fund may invest directly in securities or synthetically through the use of derivatives. The Fund’s investment objective and its policy of investing at least 80% of an aggregate of the Fund’s
net assets (including proceeds from the issuance of any preferred stock) and the proceeds of any borrowings for investment purposes, in Municipal Bonds are fundamental policies that may not be changed without the approval of a majority of the
outstanding voting securities of the Fund (as defined in the Investment Company Act of 1940, as amended (the “1940 Act”)). There can be no assurance that the Fund’s investment objective will be realized.
The Fund may invest in certain tax-exempt securities classified as “private activity bonds” (or industrial development bonds, under pre-1986
law) (“PABs”) (in general, bonds that benefit non-governmental entities) that may subject certain investors in the Fund to an alternative minimum tax. The percentage of the Fund’s total assets invested in PABs will vary from time to
time. The Fund also will not invest more than 25% of its total assets (taken at market value at the time of each investment) in Municipal Bonds whose issuers are located in the same state.
Under normal market conditions, the Fund expects to invest primarily in a portfolio of long-term Municipal Bonds that are commonly referred to as
“investment grade” securities, which are obligations rated at the time of purchase within the four highest-quality ratings as determined by either Moody’s Investors Service, Inc. (“Moody’s”) (currently Aaa, Aa, A and
Baa), S&P Global Ratings (“S&P”) (currently AAA, AA, A and BBB) or Fitch Ratings, Inc. (“Fitch”) (currently AAA, AA, A and BBB) or are considered by BlackRock Advisors, LLC (the “Manager”) to be of comparable
quality. In the case of short-term notes, the investment grade rating categories are SP-1+ through SP-2 for S&P, MIG
|
|
|
| I N V E S T M E N
T O B J E C T I V E S , P O L I
C I E S A N D R I S K S |
|
97 |
Investment Objectives, Policies and Risks (continued)
1 through MIG 3 for Moody’s and F1+ through F3 for Fitch. In the case of tax-exempt commercial paper, the investment grade rating categories are
A-1+ through A-3 for S&P, Prime-1 through Prime-3 for Moody’s and F1+ through F3 for Fitch. Obligations ranked in the lowest investment grade rating category (BBB, SP-2 and A-3 for S&P; Baa, MIG 3 and Prime-3 for Moody’s;
and BBB and F3 for Fitch), while considered “investment grade,” may have certain speculative characteristics. There may be sub-categories or gradations indicating relative standing within the rating categories set forth above. In assessing
the quality of Municipal Bonds with respect to the foregoing requirements, the Manager takes into account the nature of any letters of credit or similar credit enhancement to which particular Municipal Bonds are entitled and the creditworthiness of
the financial institution that provided such credit enhancement. Insurance is expected to protect the Fund against losses caused by a bond issuer’s failure to make interest or principal payments. However, insurance does not protect the Fund or
its stockholders against losses caused by declines in a bond’s market value. If a bond’s insurer fails to fulfill its obligations or loses its credit rating, the value of the bond could drop. If unrated, such securities will possess
creditworthiness comparable, in the opinion of the Manager, to other obligations in which the Fund may invest.
The Fund may invest up to 20% of its
managed assets in securities that are rated below investment grade, which are securities rated at the time of purchase Ba or below by Moody’s, BB or below by S&P or Fitch, or securities determined by the Manager to be of comparable quality.
Below investment grade quality is regarded as predominantly speculative with respect to the issuer’s capacity to pay interest and repay principal. Such securities commonly are referred to as “high yield” or “junk” bonds.
All percentage and ratings limitations on securities in which the Fund may invest apply at the time of making an investment and shall not be
considered violated as a result of subsequent market movements or if an investment rating is subsequently downgraded to a rating that would have precluded the Fund’s initial investment in such security. In the event that the Fund disposes of a
portfolio security subsequent to its being downgraded, the Fund may experience a greater risk of loss than if such security had been sold prior to such downgrade.
The average maturity of the Fund’s portfolio securities varies from time to time based upon an assessment of economic and market conditions by the
Manager. The Fund’s portfolio at any given time may include both long-term and intermediate-term municipal bonds.
The net asset value of the
shares of common stock of a closed-end investment company, such as the Fund, which invests primarily in fixed income securities, changes as the general levels of interest rates fluctuate. When interest rates decline, the value of a fixed income
portfolio can be expected to rise. Conversely, when interest rates rise, the value of a fixed income portfolio can be expected to decline. Prices of longer term securities generally fluctuate more in response to interest rate changes than do shorter
term securities. These changes in net asset value are likely to be greater in the case of a fund having a leveraged capital structure, such as the Fund.
For temporary periods or to provide liquidity, the Fund has the authority to invest as much as 20% of its total assets in tax-exempt and taxable money
market obligations with a maturity of one year or less (such short-term obligations being referred to herein as “Temporary Investments”). In addition, the Fund reserves the right as a defensive measure to invest temporarily a greater
portion of its assets in Temporary Investments, when, in the opinion of the Manager, prevailing market or financial conditions warrant. Taxable money market obligations will yield taxable income. The Fund also may invest in variable rate demand
obligations (“VRDOs”) and VRDOs in the form of participation interests (“Participating VRDOs”) in variable rate tax-exempt obligations held by a financial institution. The Fund’s hedging strategies are not fundamental
policies and may be modified by the Board of Directors of the Fund without the approval of the Fund’s stockholders. The Fund is also authorized to invest in indexed and inverse floating rate obligations for hedging purposes and to seek to
enhance return.
The Fund may invest in securities not issued by or on behalf of a state or territory or by an agency or instrumentality thereof, if
the Fund receives an opinion of counsel to the issuer that such securities pay interest that is excludable from gross income for federal income tax purposes (“Non-Municipal Tax-Exempt Securities”). Non-Municipal Tax-Exempt Securities could
include trust certificates, partnership interests or other instruments evidencing interest in one or more long-term Municipal Bonds. Non-Municipal Tax-Exempt Securities also may include securities issued by other investment companies that invest in
Municipal Bonds, to the extent such investments are permitted by the Fund’s investment restrictions and applicable law. Non-Municipal Tax-Exempt Securities are subject to the same risks associated with an investment in Municipal Bonds as well
as many of the risks associated with investments in derivatives. If the Internal Revenue Service were to issue any adverse ruling or take an adverse position with respect to the taxation on these types of securities, there is a risk that the
interest paid on such securities would be deemed taxable at the federal level.
The Fund ordinarily does not intend to realize significant investment
income not exempt from federal income tax. From time to time, the Fund may realize taxable capital gains.
Federal tax legislation may limit the types
and volume of bonds the interest on which qualifies for a federal income tax-exemption. As a result, current legislation and legislation that may be enacted in the future may affect the availability of Municipal Bonds for investment by the Fund.
The Fund may purchase and sell futures contracts, enter into various interest rate transactions and swap contracts (including, but not limited to,
credit default swaps) and may purchase and sell exchange-listed and OTC put and call options on securities and swap contracts, financial indices and futures contracts and use other derivative instruments or management techniques. These derivative
transactions may be used for duration management and other risk management purposes, subject to the Fund’s investment restrictions.
Leverage:
The Fund may utilize leverage to seek to enhance the yield and net asset value of its common shares. However, this objective cannot be achieved in all interest rate environments. The Fund currently leverages its assets through the use of
variable rate demand preferred shares (“VRDP Shares”) and residual interest municipal tender option bonds (“TOB Residuals”), which are derivative interests in municipal bonds. The TOB Residuals in which the Fund will invest pay
interest or income that, in the opinion of counsel to the issuer of such TOB Residuals, is exempt from regular U.S. federal income tax.
The Fund may
enter into reverse repurchase agreements with respect to its portfolio investments subject to the Fund’s investment restrictions. The Fund may enter into “dollar roll” transactions.
The Fund may enter into derivative transactions that have economic leverage embedded in them.
The Fund may leverage its portfolio by entering into one or more credit facilities.
|
|
|
| 98 |
|
2 0 2 3 B L A C
K R O C K A N N U A L R E P O R
T T O S H A R E H O L D E R
S |
Investment Objectives, Policies and Risks (continued)
The Fund may also borrow money as a temporary measure for extraordinary or emergency purposes, including the payment of dividends and the settlement of
securities transactions which otherwise might require untimely dispositions of Fund securities. Certain short-term borrowings (such as for cash management purposes) are not subject to the 1940 Act’s limitations on leverage if (i) repaid
within 60 days, and (ii) not in excess of 5% of the Fund’s total assets.
BlackRock New York Municipal Income Trust (BNY)
The Fund’s investment objective is to provide current income exempt from federal income taxes. The Fund’s investment policies provide that, as a
matter of fundamental policy, under normal market conditions, the Fund will invest at least 80% of its managed assets in investments the income from which is exempt from federal income tax and New York State and New York City personal income taxes
(except that interest may be subject to the alternative minimum tax). For the purposes of the foregoing policy “managed assets” are the Fund’s net assets plus borrowings for investment purposes. The Fund may invest directly in
securities or synthetically through the use of derivatives. The Fund may not change its investment objective or the foregoing fundamental policy without the approval of the holders of a majority of the Fund’s outstanding common shares and
outstanding preferred shares voting together as a single class, and of the holders of a majority of the outstanding preferred shares voting as a separate class. A majority of the outstanding means (1) 67% or more of the shares present at a
meeting, if the holders of more than 50% of the outstanding shares are present or represented by proxy, or (2) more than 50% of the outstanding shares, whichever is less.
The Fund’s investment policies provide that, under normal market conditions, the Fund will invest at least 80% of its total assets in investment
grade quality municipal bonds. Investment grade quality means that such bonds are rated, at the time of investment, within the four highest rating categories of Moody’s Investors Service, Inc. (“Moody’s”) (currently Aaa, Aa, A
and Baa), S&P Global Ratings (“S&P”) (currently AAA, AA, A and BBB) or Fitch Ratings, Inc. (“Fitch”) (currently AAA, AA, A and BBB) or are unrated but judged to be of comparable quality by BlackRock Advisors, LLC (the
“Manager”). Municipal bonds rated Baa by Moody’s are investment grade, but Moody’s considers municipal bonds rated Baa to have speculative characteristics. Changes in economic conditions or other circumstances are more likely to
lead to a weakened capacity for issuers of municipal bonds that are rated BBB or Baa (or that have equivalent ratings) to make principal and interest payments than is the case for issuers of higher grade municipal bonds. In the case of short term
notes, the investment grade rating categories are SP-1+ through SP-2 for S&P, MIG-1 through MIG-3 for Moody’s and F-1+ through F-3 for Fitch. In the case of tax exempt commercial paper, the investment grade rating categories are
A-1+ through A-3 for S&P, Prime-1 through Prime-3 for Moody’s and F-1+ through F-3 for Fitch. Obligations ranked in the lowest investment grade rating category (BBB, SP-2 and A-3 for S&P; Baa, MIG-3 and Prime-3 for
Moody’s and BBB and F-3 for Fitch), while considered “investment grade,” may have certain speculative characteristics. There may be sub-categories or gradations indicating relative standing within the rating categories set forth
above. In assessing the quality of municipal bonds with respect to the foregoing requirements, the Manager takes into account the nature of any letters of credit or similar credit enhancement to which particular municipal bonds are entitled and the
creditworthiness of the financial institution that provided such credit enhancement.
The Fund may invest up to 20% of its total assets in municipal
bonds that are rated, at the time of investment, Ba/BB or B by Moody’s, S&P or Fitch or that are unrated but judged to be of comparable quality by the Manager. Such securities, sometimes referred to as “high yield” or
“junk” bonds, are predominantly speculative with respect to the capacity to pay interest and repay principal in accordance with the terms of the security and generally involve a greater volatility of price than securities in higher rating
categories.
The foregoing credit quality policies apply only at the time a security is purchased, and the Fund is not required to dispose of a
security if a rating agency downgrades its assessment of the credit characteristics of a particular issue. In determining whether to retain or sell a security that a rating agency has downgraded, the Manager may consider such factors as the
Manager’s assessment of the credit quality of the issuer of the security, the price at which the security could be sold and the rating, if any, assigned to the security by other rating agencies. In the event that the Fund disposes of a
portfolio security subsequent to its being downgraded, the Fund may experience a greater risk of loss than if such security had been sold prior to such downgrade.
Subject to the Fund’s policy of investing, under normal market conditions, at least 80% of its managed assets (as defined for this policy) in
investments the income from which is exempt from federal income tax and New York City and New York State personal income taxes, the Fund may invest in securities that pay interest that is not exempt from New York City and New York State personal
income taxes when, in the judgment of the Manager, the return to the shareholders after payment of applicable New York City and New York State personal income taxes would be higher than the return available from comparable securities that pay
interest that is, or make other distributions that are, exempt from New York City and New York State personal income taxes.
The Fund may also invest
in securities of other open- or closed-end investment companies that invest primarily in municipal bonds of the types in which the Fund may invest directly and in tax-exempt preferred shares that pay dividends that are exempt from regular federal
income tax. In addition, the Fund may purchase municipal bonds that are additionally secured by insurance, bank credit agreements or escrow accounts. The credit quality of companies which provide these credit enhancements will affect the value of
those securities. Although the insurance feature reduces certain financial risks, the premiums for insurance and the higher market price paid for insured obligations may reduce the Fund’s income. The insurance feature does not guarantee the
market value of the insured obligations or the net asset value of the common shares.
The Fund may invest in certain tax exempt securities classified
as “private activity bonds” (or industrial development bonds, under pre-1986 law) (in general, bonds that benefit non-governmental entities) that may subject certain investors in the Fund to an alternative minimum tax. The percentage of
the Fund’s total assets invested in private activity bonds will vary from time to time. The Fund has not established any limit on the percentage of its portfolio that may be invested in municipal bonds subject to the alternative minimum tax
provisions of federal tax law, and the Fund expects that a portion of the income it produces will be includable in alternative minimum taxable income.
The average maturity of the Fund’s portfolio securities varies from time to time based upon an assessment of economic and market conditions by the
Manager. The Fund’s portfolio at any given time may include both long-term and intermediate-term municipal bonds.
The Fund’s stated
expectation is that it will invest in municipal bonds that, in the Manager’s opinion, are underrated or undervalued. Underrated municipal bonds are those whose ratings do not, in the opinion of the Manager, reflect their true higher
creditworthiness. Undervalued municipal bonds are bonds that, in the opinion of the Manager, are worth more than the value assigned to them in the marketplace. The Manager may at times believe that bonds associated with a particular municipal market
sector (for example, but not limited to electric utilities), or issued by a particular municipal issuer, are undervalued. The Manager may purchase those bonds for the Fund’s portfolio
|
|
|
| I N V E S T M E N
T O B J E C T I V E S , P O L I
C I E S A N D R I S K S |
|
99 |
Investment Objectives, Policies and Risks (continued)
because they represent a market sector or issuer that the Manager considers undervalued, even if the value of those particular bonds appears to be
consistent with the value of similar bonds. Municipal bonds of particular types (for example, but not limited to hospital bonds, industrial revenue bonds or bonds issued by a particular municipal issuer) may be undervalued because there is a
temporary excess of supply in that market sector, or because of a general decline in the market price of municipal bonds of the market sector for reasons that do not apply to the particular municipal bonds that are considered undervalued. The
Fund’s investment in underrated or undervalued municipal bonds will be based on the Manager’s belief that their yield is higher than that available on bonds bearing equivalent levels of interest rate risk, credit risk and other forms of
risk, and that their prices will ultimately rise, relative to the market, to reflect their true value. Any capital appreciation realized by the Fund will generally result in capital gain distributions subject to federal capital gains taxation. The
Fund ordinarily does not intend to realize significant investment income not exempt from federal income tax. From time to time, the Fund may realize taxable capital gains.
Leverage: The Fund may utilize leverage to seek to enhance the yield and net asset value of its common shares. However, this objective cannot be
achieved in all interest rate environments. The Fund currently leverages its assets through the use of variable rate demand preferred shares (“VRDP Shares”) and residual interest municipal tender option bonds (“TOB Residuals”),
which are derivative interests in municipal bonds. The TOB Residuals in which the Fund will invest pay interest or income that, in the opinion of counsel to the issuer of such TOB Residuals, is exempt from regular U.S. federal income tax.
The Fund may enter into reverse repurchase agreements with respect to its portfolio investments subject to the Fund’s investment restrictions.
The Fund reserves the right to borrow funds, subject to the Fund’s investment restrictions. The proceeds of borrowings may be used for any valid
purpose including, without limitation, liquidity, investments and repurchases of shares of the Fund.
Risk Factors
This section contains a discussion of the general risks of investing in each Fund. The net asset value and market price of, and dividends paid on, the
common shares will fluctuate with and be affected by, among other things, the risks more fully described below. As with any fund, there can be no guarantee that the Fund will meet its investment objective or that the Fund’s performance will be
positive for any period of time. Each risk noted below is applicable to each Fund unless the specific Fund or Funds are noted in a parenthetical. The order of the below risk factors does not indicate the significance of any particular risk factor.
Non-Diversification Risk (MUJ, MIY, MYN and MPA): The Fund is a non-diversified fund. Because the Fund may invest in securities of a smaller
number of issuers, it may be more exposed to the risks associated with and developments affecting an individual issuer than a fund that invests more widely.
Investment and Market Discount Risk: An investment in the Fund’s common shares is subject to investment risk, including the possible loss of
the entire amount that you invest. As with any stock, the price of the Fund’s common shares will fluctuate with market conditions and other factors. If shares are sold, the price received may be more or less than the original investment. Common
shares are designed for long-term investors and the Fund should not be treated as a trading vehicle. Shares of closed-end management investment companies frequently trade at a discount from their net asset value. This risk is separate and distinct
from the risk that the Fund’s net asset value could decrease as a result of its investment activities. At any point in time an investment in the Fund’s common shares may be worth less than the original amount invested, even after taking
into account distributions paid by the Fund. During periods in which the Fund may use leverage, the Fund’s investment, market discount and certain other risks will be magnified.
Debt Securities Risk: Debt securities, such as bonds, involve interest rate risk, credit risk, extension risk, and prepayment risk, among other
things.
| |
• |
|
Interest Rate Risk — The market value of bonds and other fixed-income securities changes in response to interest
rate changes and other factors. Interest rate risk is the risk that prices of bonds and other fixed-income securities will increase as interest rates fall and decrease as interest rates rise. |
The Fund may be subject to a greater risk of rising interest rates due to the recent period of historically low interest rates. For
example, if interest rates increase by 1%, assuming a current portfolio duration of ten years, and all other factors being equal, the value of the Fund’s investments would be expected to decrease by 10%. (Duration is a measure of the price
sensitivity of a debt security or portfolio of debt securities to relative changes in interest rates.) The magnitude of these fluctuations in the market price of bonds and other fixed-income securities is generally greater for those securities with
longer maturities. Fluctuations in the market price of the Fund’s investments will not affect interest income derived from instruments already owned by the Fund, but will be reflected in the Fund’s net asset value. The Fund may lose money
if short-term or long-term interest rates rise sharply in a manner not anticipated by Fund management.
To the extent the Fund invests
in debt securities that may be prepaid at the option of the obligor (such as mortgage-backed securities), the sensitivity of such securities to changes in interest rates may increase (to the detriment of the Fund) when interest rates rise. Moreover,
because rates on certain floating rate debt securities typically reset only periodically, changes in prevailing interest rates (and particularly sudden and significant changes) can be expected to cause some fluctuations in the net asset value of the
Fund to the extent that it invests in floating rate debt securities.
These basic principles of bond prices also apply to U.S.
Government securities. A security backed by the “full faith and credit” of the U.S. Government is guaranteed only as to its stated interest rate and face value at maturity, not its current market price. Just like other fixed-income
securities, government-guaranteed securities will fluctuate in value when interest rates change.
|
|
|
| 100 |
|
2 0 2 3 B L A C
K R O C K A N N U A L R E P O R
T T O S H A R E H O L D E R
S |
Investment Objectives, Policies and Risks (continued)
A general rise in interest rates has the potential to cause investors to move out of fixed-income securities on a large scale, which may
increase redemptions from funds that hold large amounts of fixed-income securities. Heavy redemptions could cause the Fund to sell assets at inopportune times or at a loss or depressed value and could hurt the Fund’s performance.
| |
• |
|
Credit Risk — Credit risk refers to the possibility that the issuer of a debt security (i.e., the borrower) will not
be able to make payments of interest and principal when due. Changes in an issuer’s credit rating or the market’s perception of an issuer’s creditworthiness may also affect the value of the Fund’s investment in that issuer. The
degree of credit risk depends on both the financial condition of the issuer and the terms of the obligation. |
| |
• |
|
Extension Risk — When interest rates rise, certain obligations will be paid off by the obligor more slowly than
anticipated, causing the value of these obligations to fall. |
| |
• |
|
Prepayment Risk — When interest rates fall, certain obligations will be paid off by the obligor more quickly than
originally anticipated, and the Fund may have to invest the proceeds in securities with lower yields. |
Municipal Securities
Risks: Municipal securities risks include the ability of the issuer to repay the obligation, the relative lack of information about certain issuers of municipal securities, and the possibility of future legislative changes which could affect the
market for and value of municipal securities. Budgetary constraints of local, state, and federal governments upon which the issuers may be relying for funding may also impact municipal securities. These risks include:
| |
• |
|
General Obligation Bonds Risks — Timely payments depend on the issuer’s credit quality, ability to raise tax
revenues and ability to maintain an adequate tax base. |
| |
• |
|
Revenue Bonds Risks — These payments depend on the money earned by the particular facility or class of facilities,
or the amount of revenues derived from another source. |
| |
• |
|
Private Activity Bonds Risks — Municipalities and other public authorities issue private activity bonds to finance
development of industrial facilities for use by a private enterprise. The private enterprise pays the principal and interest on the bond, and the issuer does not pledge its full faith, credit and taxing power for repayment. The Fund’s
investments may consist of private activity bonds that may subject certain shareholders to an alternative minimum tax. |
| |
• |
|
Moral Obligation Bonds Risks — Moral obligation bonds are generally issued by special purpose public authorities of
a state or municipality. If the issuer is unable to meet its obligations, repayment of these bonds becomes a moral commitment, but not a legal obligation, of the state or municipality. |
| |
• |
|
Municipal Notes Risks — Municipal notes are shorter term municipal debt obligations. If there is a shortfall in the
anticipated proceeds, the notes may not be fully repaid and the Fund may lose money. |
| |
• |
|
Municipal Lease Obligations Risks — In a municipal lease obligation, the issuer agrees to make payments when due on
the lease obligation. Although the issuer does not pledge its unlimited taxing power for payment of the lease obligation, the lease obligation is secured by the leased property. |
| |
• |
|
Tax-Exempt Status Risk — The Fund and its investment manager will rely on the opinion of issuers’ bond counsel
and, in the case of derivative securities, sponsors’ counsel, on the tax-exempt status of interest on municipal bonds and payments under derivative securities. Neither the Fund nor its investment manager will independently review the bases for
those tax opinions, which may ultimately be determined to be incorrect and subject the Fund and its shareholders to substantial tax liabilities. |
State Specific Risk (MUJ, MIY, MYN, MPA and BNY): The Fund invests primarily in municipal bonds issued by or on behalf of its designated state. As
a result, the Fund is more exposed to risks affecting issuers of its designated state’s municipal securities than is a fund that invests more widely. Fund management does not believe that the current economic conditions will adversely affect
the Fund’s ability to invest in high quality state municipal securities in its designated state.
Taxability Risk: The Fund intends to
minimize the payment of taxable income to shareholders by investing in tax-exempt or municipal securities in reliance at the time of purchase on an opinion of bond counsel to the issuer that the interest paid on those securities will be excludable
from gross income for U.S. federal income tax purposes. Such securities, however, may be determined to pay, or have paid, taxable income subsequent to the Fund’s acquisition of the securities. In that event, the treatment of dividends
previously paid or to be paid by the Fund as “exempt interest dividends” could be adversely affected, subjecting the Fund’s shareholders to increased U.S. federal income tax liabilities. Alternatively, the Fund might enter into an
agreement with the IRS to pay an agreed upon amount in lieu of the IRS adjusting individual shareholders’ income tax liabilities. If the Fund agrees to enter into such an agreement, the Fund’s yield could be adversely affected. Further,
shareholders at the time the Fund enters into such an agreement that were not shareholders when the dividends in question were paid would bear some cost for a benefit they did not receive. Federal tax legislation may limit the types and volume of
bonds the interest on which qualifies for a federal income tax-exemption. As a result, current legislation and legislation that may be enacted in the future may affect the availability of municipal securities for investment by the Fund. In addition,
future laws, regulations, rulings or court decisions may cause interest on municipal securities to be subject, directly or indirectly, to U.S. federal income taxation or interest on state municipal securities to be subject to state or local income
taxation, or the value of state municipal securities to be subject to state or local intangible personal property tax, or may otherwise prevent the Fund from realizing the full current benefit of the tax-exempt status of such securities. Any such
change could also affect the market price of such securities, and thus the value of an investment in the Fund.
Insurance Risk: Insurance
guarantees that interest payments on a municipal security will be made on time and that the principal will be repaid when the security matures. However, insurance does not protect against losses caused by declines in a municipal security’s
value. The Fund cannot be certain that any insurance company will make the payments it guarantees. If a municipal security’s insurer fails to fulfill its obligations or loses its credit rating, the value of the security could drop.
Junk Bonds Risk: Although junk bonds generally pay higher rates of interest than investment grade bonds, junk bonds are high risk investments that
are considered speculative and may cause income and principal losses for the Fund.
|
|
|
| I N V E S T M E N
T O B J E C T I V E S , P O L I
C I E S A N D R I S K S |
|
101 |
Investment Objectives, Policies and Risks (continued)
Indexed and Inverse Securities Risk (MIY, MYN, MPA and MYI): Indexed and inverse securities provide a potential return based on a particular index
of value or interest rates. The Fund’s return on these securities will be subject to risk with respect to the value of the particular index. These securities are subject to leverage risk and correlation risk. Certain indexed and inverse
securities have greater sensitivity to changes in interest rates or index levels than other securities, and the Fund’s investment in such instruments may decline significantly in value if interest rates or index levels move in a way Fund
management does not anticipate.
U.S. Government Obligations Risk: Certain securities in which the Fund may invest, including securities issued
by certain U.S. Government agencies and U.S. Government sponsored enterprises, are not guaranteed by the U.S. Government or supported by the full faith and credit of the United States. In addition, circumstances could arise that could prevent the
timely payment of interest or principal on U.S. Government obligations, such as reaching the legislative “debt ceiling.” Such non-payment could result in losses to the Fund and substantial negative consequences for the U.S. economy and the
global financial system.
Variable Rate Demand Obligations Risks (MUJ, MIY, MYN, MPA and MYI): Variable rate demand obligations are floating
rate securities that combine an interest in a long term municipal bond with a right to demand payment before maturity from a bank or other financial institution. If the bank or financial institution is unable to pay, the Fund may lose money.
Repurchase Agreements and Purchase and Sale Contracts Risk (MUJ): If the other party to a repurchase agreement or purchase and sale contract
defaults on its obligation under the agreement, the Fund may suffer delays and incur costs or lose money in exercising its rights under the agreement. If the seller fails to repurchase the security in either situation and the market value of the
security declines, the Fund may lose money.
Leverage Risk: The Fund’s use of leverage may increase or decrease from time to time in its
discretion and the Fund may, in the future, determine not to use leverage.
The use of leverage creates an opportunity for increased common share net
investment income dividends, but also creates risks for the holders of common shares. The Fund cannot assure you that the use of leverage will result in a higher yield on the common shares. Any leveraging strategy the Fund employs may not be
successful.
Leverage involves risks and special considerations for common shareholders, including:
| |
• |
|
the likelihood of greater volatility of net asset value, market price and dividend rate of the common shares than a
comparable portfolio without leverage; |
| |
• |
|
the risk that fluctuations in interest rates or dividend rates on any leverage that the Fund must pay will reduce the
return to the common shareholders; |
| |
• |
|
the effect of leverage in a declining market, which is likely to cause a greater decline in the net asset value of the
common shares than if the Fund were not leveraged, which may result in a greater decline in the market price of the common shares; |
| |
• |
|
leverage may increase operating costs, which may reduce total return. |
Any decline in the net asset value of the Fund’s investments will be borne entirely by the holders of common shares. Therefore, if the market value
of the Fund’s portfolio declines, leverage will result in a greater decrease in net asset value to the holders of common shares than if the Fund were not leveraged. This greater net asset value decrease will also tend to cause a greater decline
in the market price for the common shares.
Tender Option Bonds Risk: The Fund’s participation in tender option bond transactions may
reduce the Fund’s returns and/or increase volatility. Investments in tender option bond transactions expose the Fund to counterparty risk and leverage risk. An investment in a tender option bond transaction typically will involve greater risk
than an investment in a municipal fixed rate security, including the risk of loss of principal. Distributions on TOB Residuals will bear an inverse relationship to short-term municipal security interest rates. Distributions on TOB Residuals paid to
the Fund will be reduced or, in the extreme, eliminated as short-term municipal interest rates rise and will increase when short-term municipal interest rates fall. TOB Residuals generally will underperform the market for fixed rate municipal
securities in a rising interest rate environment. The Fund may invest special purpose trusts formed for the purpose of holding municipal bonds contributed by one or more funds (“TOB Trusts”) on either a non-recourse or recourse basis. If
the Fund invests in a TOB Trust on a recourse basis, it could suffer losses in excess of the value of its TOB Residuals.
Reverse Repurchase
Agreements Risk: Reverse repurchase agreements involve the sale of securities held by the Fund with an agreement to repurchase the securities at an agreed-upon price, date and interest payment. Reverse repurchase agreements involve the risk that
the other party may fail to return the securities in a timely manner or at all. The Fund could lose money if it is unable to recover the securities and the value of the collateral held by the Fund, including the value of the investments made with
cash collateral, is less than the value of the securities. These events could also trigger adverse tax consequences for the Fund. In addition, reverse repurchase agreements involve the risk that the interest income earned in the investment of the
proceeds will be less than the interest expense.
Dollar Rolls Risk (MIY, MYN and MYI): Dollar rolls involve the risk that the market value of
the securities that the Fund is committed to buy may decline below the price of the securities the Fund has sold. These transactions may involve leverage.
Illiquid Investments Risk: The Fund may invest without limitation in illiquid or less liquid investments or investments in which no secondary
market is readily available or which are otherwise illiquid, including private placement securities. The Fund may not be able to readily dispose of such investments at prices that approximate those at which the Fund could sell such investments if
they were more widely traded and, as a result of such illiquidity, the Fund may have to sell other investments or engage in borrowing transactions if necessary to raise cash to meet its obligations. Limited liquidity can also affect the market price
of investments, thereby adversely affecting the Fund’s net asset value and ability to make dividend distributions. The financial markets in general, and certain segments of the mortgage-related securities markets in particular, have in recent
years experienced periods of extreme secondary market supply and demand imbalance, resulting in a loss of liquidity during which market prices were suddenly and substantially below traditional measures of intrinsic value. During such periods, some
investments could be sold only at arbitrary prices and with substantial losses. Periods of such market dislocation may occur again at any time. Privately issued debt securities are often of below investment grade quality, frequently are unrated and
present many of the same risks as investing in below investment grade public debt securities.
|
|
|
| 102 |
|
2 0 2 3 B L A C
K R O C K A N N U A L R E P O R
T T O S H A R E H O L D E R
S |
Investment Objectives, Policies and Risks (continued)
Investment Companies and ETFs Risk (MUJ, MIY and BNY): Subject to the limitations set forth in the Investment Company Act of 1940, as amended, and
the rules thereunder, the Fund may acquire shares in other investment companies and in exchange-traded funds (“ETFs”), some of which may be affiliated investment companies. The market value of the shares of other investment companies and
ETFs may differ from their net asset value. As an investor in investment companies and ETFs, the Fund would bear its ratable share of that entity’s expenses, including its investment advisory and administration fees, while continuing to pay its
own advisory and administration fees and other expenses (to the extent not offset by the Manager through waivers). As a result, shareholders will be absorbing duplicate levels of fees with respect to investments in other investment companies and
ETFs (to the extent not offset by the Manager through waivers).
The securities of other investment companies and ETFs in which the Fund may invest
may be leveraged. As a result, the Fund may be indirectly exposed to leverage through an investment in such securities. An investment in securities of other investment companies and ETFs that use leverage may expose the Fund to higher volatility in
the market value of such securities and the possibility that the Fund’s long-term returns on such securities (and, indirectly, the long-term returns of shares of the Fund) will be diminished.
As with other investments, investments in other investment companies, including ETFs, are subject to market and selection risk. To the extent the Fund is
held by an affiliated fund, the ability of the Fund itself to hold other investment companies may be limited.
Derivatives Risk: The
Fund’s use of derivatives may increase its costs, reduce the Fund’s returns and/or increase volatility. Derivatives involve significant risks, including:
| |
• |
|
Leverage Risk — The Fund’s use of derivatives can magnify the Fund’s gains and losses. Relatively small
market movements may result in large changes in the value of a derivatives position and can result in losses that greatly exceed the amount originally invested. |
| |
• |
|
Market Risk — Some derivatives are more sensitive to interest rate changes and market price fluctuations than other
securities. The Fund could also suffer losses related to its derivatives positions as a result of unanticipated market movements, which losses are potentially unlimited. Finally, the Manager may not be able to predict correctly the direction of
securities prices, interest rates and other economic factors, which could cause the Fund’s derivatives positions to lose value. |
| |
• |
|
Counterparty Risk — Derivatives are also subject to counterparty risk, which is the risk that the other party in the
transaction will be unable or unwilling to fulfill its contractual obligation, and the related risks of having concentrated exposure to such a counterparty. |
| |
• |
|
Illiquidity Risk — The possible lack of a liquid secondary market for derivatives and the resulting inability of the
Fund to sell or otherwise close a derivatives position could expose the Fund to losses and could make derivatives more difficult for the Fund to value accurately. |
| |
• |
|
Operational Risk — The use of derivatives includes the risk of potential operational issues, including documentation
issues, settlement issues, systems failures, inadequate controls and human error. |
| |
• |
|
Legal Risk — The risk of insufficient documentation, insufficient capacity or authority of counterparty, or legality
or enforceability of a contract. |
| |
• |
|
Volatility and Correlation Risk — Volatility is defined as the characteristic of a security, an index or a market to
fluctuate significantly in price within a short time period. A risk of the Fund’s use of derivatives is that the fluctuations in their values may not correlate with the overall securities markets. |
| |
• |
|
Valuation Risk — Valuation for derivatives may not be readily available in the market. Valuation may be more
difficult in times of market turmoil since many investors and market makers may be reluctant to purchase complex instruments or quote prices for them. |
| |
• |
|
Hedging Risk — Hedges are sometimes subject to imperfect matching between the derivative and the underlying
security, and there can be no assurance that the Fund’s hedging transactions will be effective. The use of hedging may result in certain adverse tax consequences. |
| |
• |
|
Tax Risk — Certain aspects of the tax treatment of derivative instruments, including swap agreements and
commodity-linked derivative instruments, are currently unclear and may be affected by changes in legislation, regulations or other legally binding authority. Such treatment may be less favorable than that given to a direct investment in an
underlying asset and may adversely affect the timing, character and amount of income the Fund realizes from its investments. |
Risk of Investing in the United States: Certain changes in the U.S. economy, such as when the U.S. economy weakens or when its financial markets
decline, may have an adverse effect on the securities to which the Fund has exposure.
Market Risk and Selection Risk: Market risk is the risk
that one or more markets in which the Fund invests will go down in value, including the possibility that the markets will go down sharply and unpredictably. The value of a security or other asset may decline due to changes in general market
conditions, economic trends or events that are not specifically related to the issuer of the security or other asset, or factors that affect a particular issuer or issuers, exchange, country, group of countries, region, market, industry, group of
industries, sector or asset class. Local, regional or global events such as war, acts of terrorism, the spread of infectious illness or other public health issues like pandemics or epidemics, recessions, or other events could have a significant
impact on the Fund and its investments. Selection risk is the risk that the securities selected by Fund management will underperform the markets, the relevant indices or the securities selected by other funds with similar investment objectives and
investment strategies. This means you may lose money.
An outbreak of an infectious coronavirus (COVID-19) that was first detected in December 2019
developed into a global pandemic that has resulted in numerous disruptions in the market and has had significant economic impact leaving general concern and uncertainty. Although vaccines have been developed and approved for use by various
governments, the duration of the pandemic and its effects cannot be predicted with certainty. The impact of this coronavirus, and other epidemics and pandemics that may arise in the future, could affect the economies of many nations, individual
companies and the market in general ways that cannot necessarily be foreseen at the present time.
|
|
|
| I N V E S T M E N
T O B J E C T I V E S , P O L I
C I E S A N D R I S K S |
|
103 |
Automatic Dividend Reinvestment Plan
Pursuant to MUJ, MIY, MYN, MPA, MYI and BNY’s Dividend Reinvestment Plan (the “Reinvestment Plan”), Common Shareholders are automatically
enrolled to have all distributions of dividends and capital gains and other distributions reinvested by Computershare Trust Company, N.A. (the “Reinvestment Plan Agent”) in the respective Fund’s Common Shares pursuant to the
Reinvestment Plan. Shareholders who do not participate in the Reinvestment Plan will receive all distributions in cash paid by check and mailed directly to the shareholders of record (or if the shares are held in street name or other nominee name,
then to the nominee) by the Reinvestment Plan Agent, which serves as agent for the shareholders in administering the Reinvestment Plan.
After MUJ,
MIY, MYN, MPA, MYI and BNY declare a dividend or determine to make a capital gain or other distribution, the Reinvestment Plan Agent will acquire shares for the participants’ accounts, depending upon the following circumstances, either
(i) through receipt of unissued but authorized shares from the Funds (“newly issued shares”) or (ii) by purchase of outstanding shares on the open market or on the Fund’s primary exchange (“open-market purchases”).
If, on the dividend payment date, the net asset value (“NAV”) per share is equal to or less than the market price per share plus estimated brokerage commissions (such condition often referred to as a “market premium”), the
Reinvestment Plan Agent will invest the dividend amount in newly issued shares acquired on behalf of the participants. The number of newly issued shares to be credited to each participant’s account will be determined by dividing the dollar
amount of the dividend by the NAV on the date the shares are issued. However, if the NAV is less than 95% of the market price on the dividend payment date, the dollar amount of the dividend will be divided by 95% of the market price on the dividend
payment date. If, on the dividend payment date, the NAV is greater than the market price per share plus estimated brokerage commissions (such condition often referred to as a “market discount”), the Reinvestment Plan Agent will invest the
dividend amount in shares acquired on behalf of the participants in open-market purchases. If the Reinvestment Plan Agent is unable to invest the full dividend amount in open-market purchases, or if the market discount shifts to a market premium
during the purchase period, the Reinvestment Plan Agent will invest any un-invested portion in newly issued shares. Investments in newly issued shares made in this manner would be made pursuant to the same process described above and the date of
issue for such newly issued shares will substitute for the dividend payment date.
You may elect not to participate in the Reinvestment Plan and to
receive all dividends in cash by contacting the Reinvestment Plan Agent, at the address set forth below.
Participation in the Reinvestment Plan is
completely voluntary and may be terminated or resumed at any time without penalty by notice if received and processed by the Reinvestment Plan Agent prior to the dividend record date. Additionally, the Reinvestment Plan Agent seeks to process
notices received after the record date but prior to the payable date and such notices often will become effective by the payable date. Where late notices are not processed by the applicable payable date, such termination or resumption will be
effective with respect to any subsequently declared dividend or other distribution.
The Reinvestment Plan Agent’s fees for the handling of the
reinvestment of distributions will be paid by each Fund. However, each participant will pay a pro rata share of brokerage commissions incurred with respect to the Reinvestment Plan Agent’s open-market purchases in connection with the
reinvestment of all distributions. The automatic reinvestment of all distributions will not relieve participants of any U.S. federal, state or local income tax that may be payable on such dividends or distributions.
Each Fund reserves the right to amend or terminate the Reinvestment Plan. There is no direct service charge to participants in the Reinvestment Plan;
however, each Fund reserves the right to amend the Reinvestment Plan to include a service charge payable by the participants. Participants in MPA, MYI and BNY that request a sale of shares are subject to a $2.50 sales fee and a $0.15 per share sold
fee. Per share fees include any applicable brokerage commissions the Reinvestment Plan Agent is required to pay. Participants in MUJ, MIY and MYN that request a sale of shares are subject to a $0.02 per share sold brokerage commission. All
correspondence concerning the Reinvestment Plan should be directed to Computershare Trust Company, N.A. through the internet at computershare.com/blackrock, or in writing to Computershare, P.O. Box 43006, Providence, RI 02940-3078, Telephone:
(800) 699-1236. Overnight correspondence should be directed to the Reinvestment Plan Agent at Computershare, 150 Royall Street, Suite 101, Canton, MA 02021.
|
|
|
| 104 |
|
2 0 2 3 B L A C
K R O C K A N N U A L R E P O R
T T O S H A R E H O L D E R
S |
Director and Officer Information
|
|
|
|
|
|
|
|
|
| Independent Directors(a) |
| |
|
|
|
|
| Name
Year of Birth(b) |
|
Position(s) Held
(Length of Service)(c) |
|
Principal Occupation(s) During Past 5 Years |
|
Number of BlackRock-Advised
Registered Investment Companies
(“RICs”) Consisting of Investment
Portfolios (“Portfolios”)
Overseen |
|
Public Company
and Other
Investment
Company
Directorships Held
During
Past 5 Years |
|
|
|
|
|
| R. Glenn Hubbard
1958 |
|
Chair of the Board (Since 2022)
Director (Since 2007) |
|
Dean, Columbia Business School from 2004 to 2019; Faculty member, Columbia Business School since 1988. |
|
70 RICs consisting of 104 Portfolios |
|
ADP (data and information services) from 2004 to 2020; Metropolitan Life Insurance Company (insurance); TotalEnergies SE (multi-energy) |
|
|
|
|
|
| W. Carl Kester(d)
1951 |
|
Vice Chair of the Board (Since 2022) Director
(Since 2007) |
|
Baker Foundation Professor and George Fisher Baker Jr. Professor of Business Administration, Emeritus, Harvard Business School since 2022; George Fisher Baker Jr. Professor of Business
Administration, Harvard Business School from 2008 to 2022; Deputy Dean for Academic Affairs from 2006 to 2010; Chairman of the Finance Unit, from 2005 to 2006; Senior Associate Dean and Chairman of the MBA Program from 1999 to 2005; Member of the
faculty of Harvard Business School since 1981. |
|
72 RICs consisting of 106 Portfolios |
|
None |
|
|
|
|
|
| Cynthia L. Egan
1955 |
|
Director
(Since 2016) |
|
Advisor, U.S. Department of the Treasury from 2014 to 2015; President, Retirement Plan Services, for T. Rowe Price Group, Inc. from 2007 to 2012; executive positions within Fidelity
Investments from 1989 to 2007. |
|
70 RICs consisting of 104 Portfolios |
|
Unum (insurance); The Hanover Insurance Group (Board Chair); Huntsman Corporation (Lead Independent Director and non-Executive Vice Chair of the Board) (chemical products) |
|
|
|
|
|
| Frank J. Fabozzi(d)
1948 |
|
Director
(Since 2007) |
|
Editor of The Journal of Portfolio Management since 1986; Professor of Finance, EDHEC Business School (France) from 2011 to 2022; Professor of Practice, Johns Hopkins University since 2021;
Professor in the Practice of Finance, Yale University School of Management from 1994 to 2011 and currently a Teaching Fellow in Yale’s Executive Programs; Visiting Professor, Rutgers University for the Spring 2019 semester; Visiting Professor,
New York University for the 2019 academic year; Adjunct Professor of Finance, Carnegie Mellon University in fall 2020 semester. |
|
72 RICs consisting of 106 Portfolios |
|
None |
|
|
|
|
|
| Lorenzo A. Flores
1964 |
|
Director
(Since
2021) |
|
Vice Chairman, Kioxia, Inc. since 2019; Chief Financial Officer, Xilinx, Inc. from 2016 to 2019; Corporate Controller, Xilinx, Inc. from 2008 to 2016. |
|
70 RICs consisting of 104 Portfolios |
|
None |
|
|
|
|
|
| Stayce D. Harris
1959 |
|
Director
(Since 2021) |
|
Lieutenant General, Inspector General of the United States Air Force from 2017 to 2019; Lieutenant General, Assistant Vice Chief of Staff and Director, Air Staff, United States Air Force from
2016 to 2017; Major General, Commander, 22nd Air Force, AFRC, Dobbins Air Reserve Base, Georgia from 2014 to 2016; Pilot, United Airlines from 1990 to 2020. |
|
70 RICs consisting of 104 Portfolios |
|
KULR Technology Group, Inc. in 2021; The Boeing Company (airplane manufacturer) |
|
|
|
| D I R E C T O R
A N D O F F I C E R I N F O R
M A T I O N |
|
105 |
Director and Officer Information (continued)
|
|
|
|
|
|
|
|
|
| Independent Directors(a) (continued) |
| |
|
|
|
|
Name
Year of Birth(b) |
|
Position(s) Held
(Length of Service)(c) |
|
Principal Occupation(s) During Past 5 Years |
|
Number of BlackRock-Advised
Registered Investment Companies
(“RICs”) Consisting of Investment
Portfolios (“Portfolios”)
Overseen |
|
Public Company
and Other
Investment
Company
Directorships Held
During
Past 5 Years |
|
|
|
|
|
| J. Phillip Holloman
1955 |
|
Director
(Since 2021) |
|
President and Chief Operating Officer, Cintas Corporation from 2008 to 2018. |
|
70 RICs consisting of 104 Portfolios |
|
PulteGroup, Inc. (home construction); Rockwell Automation Inc. (industrial automation) |
|
|
|
|
|
| Catherine A. Lynch(d)
1961 |
|
Director
(Since 2016) |
|
Chief Executive Officer, Chief Investment Officer and various other positions, National Railroad Retirement Investment Trust from 2003 to 2016; Associate Vice President for Treasury
Management, The George Washington University from 1999 to 2003; Assistant Treasurer, Episcopal Church of America from 1995 to 1999. |
|
72 RICs consisting of 106 Portfolios |
|
PennyMac Mortgage Investment Trust |
|
| Interested Directors(a)(e) |
| |
|
|
|
|
| Name
Year of Birth(b) |
|
Position(s) Held
(Length of Service)(c) |
|
Principal Occupation(s) During Past 5 Years |
|
Number of BlackRock-Advised
Registered Investment Companies
(“RICs”) Consisting of Investment
Portfolios (“Portfolios”)
Overseen |
|
Public Company
and Other
Investment
Company
Directorships
Held During
Past 5 Years |
|
|
|
|
|
| Robert Fairbairn
1965 |
|
Director (Since
2018) |
|
Vice Chairman of BlackRock, Inc. since 2019; Member of BlackRock’s Global Executive and Global Operating Committees; Co-Chair of BlackRock’s Human Capital Committee; Senior Managing
Director of BlackRock, Inc.from 2010 to 2019; oversaw BlackRock’s Strategic Partner Program and Strategic Product Management Group from 2012 to 2019; Member of the Board of Managers of BlackRock Investments, LLC from 2011 to 2018; Global Head
of BlackRock’s Retail and iShares® businesses from 2012 to 2016. |
|
98 RICs consisting of 273 Portfolios |
|
None |
|
|
|
|
|
| John M. Perlowski(d)
1964 |
|
Director (Since 2015)
President and Chief Executive Officer (Since 2010) |
|
Managing Director of BlackRock, Inc. since 2009; Head of BlackRock Global Accounting and Product Services since 2009; Advisory Director of Family Resource Network (charitable foundation) since
2009. |
|
100 RICs consisting of 275 Portfolios |
|
None |
| (a) |
|
The address of each Director is c/o BlackRock, Inc., 50 Hudson Yards, New York, New York 10001. |
| (b) |
|
Each Independent Director holds office until his or her successor is duly elected and qualifies or until his or her
earlier death, resignation, retirement or removal as provided by the Fund’s by-laws or charter or statute, or until December 31 of the year in which he or she turns 75. Directors who are “interested persons,” as defined in the
Investment Company Act serve until their successor is duly elected and qualifies or until their earlier death, resignation, retirement or removal as provided by the Fund’s by-laws or statute, or until December 31 of the year in which they
turn 72. The Board may determine to extend the terms of Independent Directors on a case-by-case basis, as appropriate. |
| (c) |
|
Following the combination of Merrill Lynch Investment Managers, L.P. (“MLIM”) and BlackRock, Inc. in September
2006, the various legacy MLIM and legacy BlackRock fund boards were realigned and consolidated into three new fund boards in 2007. Certain Independent Directors first became members of the boards of other legacy MLIM or legacy BlackRock funds as
follows: Frank J. Fabozzi, 1988; R. Glenn Hubbard, 2004; and W. Carl Kester, 1995. |
| (d) |
|
Dr. Fabozzi, Dr. Kester, Ms. Lynch and Mr. Perlowski are also trustees of the BlackRock Credit
Strategies Fund and BlackRock Private Investments Fund. |
| (e) |
|
Mr. Fairbairn and Mr. Perlowski are both “interested persons,” as defined in the 1940 Act, of the
Fund based on their positions with BlackRock, Inc. and its affiliates. Mr. Fairbairn and Mr. Perlowski are also board members of the BlackRock Multi-Asset Complex. |
|
|
|
| 106 |
|
2 0 2 3 B L A C
K R O C K A N N U A L R E P O R
T T O S H A R E H O L D E R
S |
Director and Officer Information (continued)
|
|
|
|
|
| Officers Who Are Not Directors(a) |
| |
|
|
| Name
Year of Birth(b) |
|
Position(s) Held
(Length of Service) |
|
Principal Occupation(s) During Past 5 Years |
|
|
|
| Jonathan Diorio
1980 |
|
Vice President
(Since 2015) |
|
Managing Director of BlackRock, Inc. since 2015; Director of BlackRock, Inc. from 2011 to 2015. |
|
|
|
| Trent Walker
1974 |
|
Chief Financial Officer
(Since 2021) |
|
Managing Director of BlackRock, Inc. since September 2019; Executive Vice President of PIMCO from 2016 to 2019; Senior Vice President of PIMCO from 2008 to 2015; Treasurer from 2013 to 2019
and Assistant Treasurer from 2007 to 2017 of PIMCO Funds, PIMCO Variable Insurance Trust, PIMCO ETF Trust, PIMCO Equity Series, PIMCO Equity Series VIT, PIMCO Managed Accounts Trust, 2 PIMCO-sponsored interval funds and 21 PIMCO-sponsored closed-end
funds. |
|
|
|
| Jay M. Fife
1970 |
|
Treasurer (Since
2007) |
|
Managing Director of BlackRock, Inc. since 2007. |
|
|
|
| Aaron Wasserman
1974 |
|
Chief Compliance Officer
(Since 2023) |
|
Managing Director of BlackRock, Inc. since 2018; Chief Compliance Officer of the BlackRock-advised funds in the BlackRock Multi-Asset Complex, the BlackRock Fixed-Income Complex and the
iShares Complex since 2023; Deputy Chief Compliance Officer for the BlackRock-advised funds in the BlackRock Multi-Asset Complex, the BlackRock Fixed- Income Complex and the iShares Complex from 2014 to 2023. |
|
|
|
| Janey Ahn
1975 |
|
Secretary (Since
2012) |
|
Managing Director of BlackRock, Inc. since 2018; Director of BlackRock, Inc. from 2009 to 2017. |
| (a) |
The address of each Officer is c/o BlackRock, Inc., 50 Hudson Yards, New York, New York 10001. |
| (b) |
Officers of the Fund serve at the pleasure of the Board. |
Effective July 1, 2023, Aaron Wasserman replaced Charles Park as Chief Compliance Officer of the Funds.
Effective September 9, 2023, Arthur P. Steinmetz was appointed as a Director of the Funds.
Effective September 29, 2022, Michael Kalinoski became a portfolio manager of MUJ. Mr. Kalinoski has been employed by BlackRock
since 2006. Effective March 1, 2023, Walter O’Connor, Kevin Maloney and Kristi Manidis became portfolio managers of MUJ. Messrs. O’Connor and Maloney and Ms. Manidis have been employed by BlackRock since 2006, 2011, and 2003
respectively. Effective March 1, 2023, Ted Jaeckel is no longer a portfolio manager of MUJ.
Effective March 1, 2023,
Phillip Soccio, Kevin Maloney, Christian Romaglino and Kristi Manidis became portfolio managers of MIY. Messrs. Soccio, Maloney and Romaglino and Ms. Manidis have been employed by BlackRock since 1998, 2011, 2017, and 2003 respectively.
Effective March 1, 2023, Michael Perilli is no longer a portfolio manager of MIY.
Effective September 29, 2022, Michael
Perilli became a portfolio manager of MYN. Mr. Perilli was employed by BlackRock from 2008 to 2023. Effective March 1, 2023, Phillip Soccio, Michael Kalinoski, Kevin Maloney and Kristi Manidis became portfolio managers of MYN. Messrs.
Soccio, Kalinoski and Maloney and Ms. Manidis have been employed by BlackRock since 1998, 2006, 2011, and 2003 respectively. Effective March 1, 2023, Michael Perilli is no longer a portfolio manager of MYN.
Effective September 29, 2022, Christian Romaglino became a portfolio manager of MPA. Mr. Romaglino has been employed by
BlackRock since 2017. Effective March 1, 2023, Michael Kalinoski, Walter O’Connor, Kevin Maloney and Kristi Manidis became portfolio managers of MPA. Messrs. Kalinoski, O’Connor and Maloney and Ms. Manidis have been employed by
BlackRock since 2006, 2006, 2011, and 2003 respectively. Effective March 1, 2023, Michael Perilli and Ted Jaeckel are no longer portfolio managers of MPA.
Effective March 1, 2023, Phillip Soccio, Kevin Maloney and Kristi Manidis became portfolio managers of MYI. Messrs. Soccio and
Maloney and Ms. Manidis have been employed by BlackRock since 1998, 2011, and 2003 respectively.
Effective
September 29, 2022, Christian Romaglino became a portfolio manager of BNY. Mr. Romaglino has been employed by BlackRock since 2017. Effective March 1, 2023, Phillip Soccio, Michael Kalinoski, Kevin Maloney and Kristi Manidis became
portfolio managers of BNY. Messrs. Soccio, Kalinoski and Maloney and Ms. Manidis have been employed by BlackRock since 1998, 2006, 2011, and 2003 respectively. Effective March 1, 2023, Michael Perilli is no longer a portfolio manager of
BNY.
|
|
|
| D I R E C T O R
A N D O F F I C E R I N F O R
M A T I O N |
|
107 |
Additional Information
Proxy Results
The Annual Meeting of Shareholders was held on
July 12, 2023, for shareholders of record on May 15, 2023, to elect director nominees for each Fund. There were no broker non-votes with regard to any of the Funds.
Shareholders elected the Class I Directors as follows:
|
|
|
|
|
|
|
|
|
|
|
|
|
|
|
|
|
|
|
|
|
|
|
|
|
|
|
|
|
|
|
|
|
| |
|
Lorenzo A. Flores |
|
|
R. Glenn Hubbard |
|
|
John M. Perlowski |
|
|
W. Carl Kester(a) |
|
|
|
|
|
|
|
|
|
|
| Fund Name |
|
Votes For |
|
|
Votes Withheld |
|
|
Votes For |
|
|
Votes Withheld |
|
|
Votes For |
|
|
Votes Withheld |
|
|
Votes For |
|
|
Votes Withheld |
|
| BNY |
|
|
16,817,524 |
|
|
|
1,715,171 |
|
|
|
16,750,046 |
|
|
|
1,782,649 |
|
|
|
16,845,179 |
|
|
|
1,687,516 |
|
|
|
1,794 |
|
|
|
0 |
|
| MYI |
|
|
49,643,998 |
|
|
|
10,209,934 |
|
|
|
32,885,027 |
|
|
|
26,968,905 |
|
|
|
53,407,443 |
|
|
|
6,446,489 |
|
|
|
3,564 |
|
|
|
0 |
|
| MUJ |
|
|
42,025,900 |
|
|
|
3,715,293 |
|
|
|
29,477,595 |
|
|
|
16,263,598 |
|
|
|
42,132,646 |
|
|
|
3,608,547 |
|
|
|
4,171 |
|
|
|
0 |
|
| MIY |
|
|
22,443,900 |
|
|
|
2,177,156 |
|
|
|
16,595,411 |
|
|
|
8,025,645 |
|
|
|
22,455,423 |
|
|
|
2,165,633 |
|
|
|
2,319 |
|
|
|
0 |
|
| |
(a) |
Voted on by holders of Preferred Shares only. |
|
For the Funds listed above, Directors whose term of office continued after the Annual Meeting of Shareholders
because they were not up for election are Cynthia L. Egan, Robert Fairbairn, Stayce D. Harris, J. Phillip Holloman, Catherine A. Lynch, and Frank J. Fabozzi.
The Annual Meeting of Shareholders was held on July 12, 2023 and adjourned to July 31, 2023, for shareholders of record on May 15, 2023, to
elect director nominees for BlackRock MuniYield New York Quality Fund, Inc. There were no broker non-votes with regard to the Fund.
Shareholders elected the Class I
Directors as follows:
|
|
|
|
|
|
|
|
|
|
|
|
|
|
|
|
|
|
|
|
|
|
|
|
|
|
|
|
|
|
|
|
|
| |
|
Lorenzo A. Flores |
|
|
R. Glenn Hubbard |
|
|
John M. Perlowski |
|
|
W. Carl Kester(a) |
|
|
|
|
|
|
|
|
|
|
| Fund Name |
|
Votes For |
|
|
Votes Withheld |
|
|
Votes For |
|
|
Votes Withheld |
|
|
Votes For |
|
|
Votes Withheld |
|
|
Votes For |
|
|
Votes Withheld |
|
| MYN |
|
|
29,144,441 |
|
|
|
4,668,312 |
|
|
|
19,457,256 |
|
|
|
14,355,497 |
|
|
|
29,204,755 |
|
|
|
4,607,998 |
|
|
|
2,477 |
|
|
|
0 |
|
| |
(a) |
Voted on by holders of Preferred Shares only. |
For the Fund listed above, Directors whose term of office continued after the Annual Meeting of Shareholders because they were not up for election are
Cynthia L. Egan, Robert Fairbairn, Stayce D. Harris, J. Phillip Holloman, Catherine A. Lynch, and Frank J. Fabozzi.
The Annual Meeting of
Shareholders was held on July 12, 2023, for shareholders of record on May 15, 2023, to elect director nominees for BlackRock MuniYield Pennsylvania Quality Fund. There were no broker non-votes with regard to the Fund.
Shareholders elected the Directors as follows:
|
|
|
|
|
|
|
|
|
|
|
|
|
|
|
|
|
|
|
|
|
|
|
|
|
|
|
|
|
|
|
|
|
|
|
|
|
| |
|
Cynthia L. Egan |
|
|
Robert Fairbairn |
|
|
Lorenzo A. Flores |
|
|
|
|
|
|
|
|
|
|
|
| Fund Name |
|
Votes For |
|
|
Votes Against |
|
|
Abstain |
|
|
Votes For |
|
|
Votes Against |
|
|
Abstain |
|
|
Votes For |
|
|
Votes Against |
|
|
Abstain |
|
| MPA |
|
|
9,657,083 |
|
|
|
1,179,483 |
|
|
|
156,007 |
|
|
|
9,754,205 |
|
|
|
1,082,575 |
|
|
|
155,793 |
|
|
|
9,767,766 |
|
|
|
1,064,101 |
|
|
|
160,706 |
|
| |
|
|
|
|
|
|
|
|
|
|
|
|
|
|
|
|
|
|
|
|
|
|
|
|
|
|
|
|
|
|
|
|
|
|
|
|
| |
|
Stayce D. Harris |
|
|
J. Phillip Holloman |
|
|
R. Glenn Hubbard |
|
|
|
|
|
|
|
|
|
|
|
| Fund Name |
|
Votes For |
|
|
Votes Against |
|
|
Abstain |
|
|
Votes For |
|
|
Votes Against |
|
|
Abstain |
|
|
Votes For |
|
|
Votes Against |
|
|
Abstain |
|
| MPA |
|
|
9,802,345 |
|
|
|
1,055,403 |
|
|
|
134,825 |
|
|
|
9,632,262 |
|
|
|
1,199,605 |
|
|
|
160,706 |
|
|
|
9,723,572 |
|
|
|
1,134,177 |
|
|
|
134,824 |
|
| |
|
|
|
|
|
|
|
|
|
|
|
|
|
|
|
|
|
|
|
|
|
|
|
|
|
|
|
|
|
|
|
|
|
|
|
|
| |
|
Catherine A. Lynch |
|
|
John M. Perlowski |
|
|
Frank J. Fabozzi(a) |
|
|
|
|
|
|
|
|
|
|
|
| Fund Name |
|
Votes For |
|
|
Votes Against |
|
|
Abstain |
|
|
Votes For |
|
|
Votes Against |
|
|
Abstain |
|
|
Votes For |
|
|
Votes Against |
|
|
Abstain |
|
| MPA |
|
|
9,803,633 |
|
|
|
1,039,544 |
|
|
|
149,396 |
|
|
|
9,762,716 |
|
|
|
1,083,579 |
|
|
|
146,278 |
|
|
|
826 |
|
|
|
0 |
|
|
|
0 |
|
| |
|
|
|
|
|
|
|
|
|
|
|
|
|
|
|
|
|
|
|
|
|
|
|
|
|
|
|
|
|
|
|
|
|
|
|
|
| |
|
W. Carl Kester(a) |
|
|
|
|
|
|
|
|
|
|
|
|
|
|
|
|
|
|
|
|
|
|
|
|
|
|
|
|
|
| Fund Name |
|
Votes For |
|
|
Votes Against |
|
|
Abstain |
|
|
|
|
|
|
|
|
|
|
|
|
|
|
|
|
|
|
|
| MPA |
|
|
826 |
|
|
|
0 |
|
|
|
0 |
|
|
|
|
|
|
|
|
|
|
|
|
|
|
|
|
|
|
|
|
|
|
|
|
|
| |
(a) |
Voted on by holders of Preferred Shares only. |
|
|
|
|
| 108 |
|
2 0 2 3 B L A C
K R O C K A N N U A L R E P O R
T T O S H A R E H O L D E R
S |
Additional Information (continued)
Fund Certification
The Funds are listed for trading on the
NYSE and have filed with the NYSE their annual chief executive officer certification regarding compliance with the NYSE’s listing standards. The Funds filed with the SEC the certification of its chief executive officer and chief financial
officer required by Section 302 of the Sarbanes-Oxley Act.
Environmental, Social and Governance (“ESG”) Integration
Although the Funds do not seek to implement a specific sustainability objective, strategy or process unless otherwise disclosed, Fund management will
consider ESG factors as part of the investment process for the Funds. Fund management views ESG integration as the practice of incorporating financially material ESG data or information into investment processes with the objective of enhancing
risk-adjusted returns. These ESG considerations will vary depending on the Funds’ particular investment strategies and may include consideration of third-party research as well as consideration of proprietary BlackRock research across the ESG
risks and opportunities regarding an issuer. The ESG characteristics utilized in the Funds’ investment process are anticipated to evolve over time and one or more characteristics may not be relevant with respect to all issuers that are eligible
for investment. Certain of these considerations may affect the Funds’ exposure to certain companies or industries. While Fund management views ESG considerations as having the potential to contribute to the Funds’ long-term performance,
there is no guarantee that such results will be achieved.
Dividend Policy
Each Fund’s dividend policy is to distribute all or a portion of its net investment income to its shareholders on a monthly basis. In order to
provide shareholders with a more stable level of distributions, the Funds may at times pay out less than the entire amount of net investment income earned in any particular month and may at times in any particular month pay out such accumulated but
undistributed income in addition to net investment income earned in that month. As a result, the distributions paid by the Funds for any particular month may be more or less than the amount of net investment income earned by the Funds during such
month. The Funds’ current accumulated but undistributed net investment income, if any, is disclosed as accumulated earnings (loss) in the Statements of Assets and Liabilities, which comprises part of the financial information included in this
report.
General Information
The Funds do not make
available copies of their Statements of Additional Information because the Funds’ shares are not continuously offered, which means that the Statement of Additional Information of each Fund has not been updated after completion of the respective
Fund’s offerings and the information contained in each Fund’s Statement of Additional Information may have become outdated.
The following
information is a summary of certain changes since July 31, 2022. This information may not reflect all of the changes that have occurred since you purchased the relevant Fund.
Except if noted otherwise herein, there were no changes to the Funds’ charters or by-laws that would delay or prevent a change of control of the
Funds that were not approved by the shareholders. Except if noted otherwise herein, there have been no changes in the persons who are primarily responsible for the day-to-day management of the Funds’ portfolios.
In accordance with Section 23(c) of the Investment Company Act of 1940, each Fund may from time to time purchase shares of its common stock in the
open market or in private transactions.
Quarterly performance, semi-annual and annual reports, current net asset value and other information
regarding the Funds may be found on BlackRock’s website, which can be accessed at blackrock.com. Any reference to BlackRock’s website in this report is intended to allow investors public access to information regarding the Funds and
does not, and is not intended to, incorporate BlackRock’s website in this report.
Electronic Delivery
Shareholders can sign up for e-mail notifications of quarterly statements, annual and semi-annual shareholder reports by enrolling in the electronic
delivery program. Electronic copies of shareholder reports are available on BlackRock’s website.
To enroll in electronic delivery:
Shareholders Who Hold Accounts with Investment Advisers, Banks or Brokerages:
Please contact your financial adviser. Please note that not all investment advisers, banks or brokerages may offer this service.
Householding
The Funds will mail only one copy of
shareholder documents, annual and semi-annual reports, Rule 30e-3 notices and proxy statements, to shareholders with multiple accounts at the same address. This practice is commonly called “householding” and is intended to reduce expenses
and eliminate duplicate mailings of shareholder documents. Mailings of your shareholder documents may be householded indefinitely unless you instruct us otherwise. If you do not want the mailing of these documents to be combined with those for other
members of your household, please call the Funds at (800) 882-0052.
|
|
|
| A D D I T I O N A
L I N F O R M A T I O N |
|
109 |
Additional Information (continued)
Availability of Quarterly Schedule of Investments
The Funds
file their complete schedules of portfolio holdings with the SEC for the first and third quarters of each fiscal year as an exhibit to their reports on Form N-PORT. The Funds’ Forms N-PORT are available on the SEC’s website at
sec.gov. Additionally, each Fund makes its portfolio holdings for the first and third quarters of each fiscal year available at blackrock.com/fundreports.
Availability of Proxy Voting Policies, Procedures and Voting Records
A description of the policies and procedures that the Funds use to determine how to vote proxies relating to portfolio securities and information about
how the Funds voted proxies relating to securities held in the Funds’ portfolios during the most recent 12-month period ended June 30 is available without charge, upon request (1) by calling (800) 882-0052; (2) on the
BlackRock website at blackrock.com; and (3) on the SEC’s website at sec.gov.
Availability of Fund Updates
BlackRock will update performance and certain other data for the Funds on a monthly basis on its website in the “Closed-end Funds” section of
blackrock.com as well as certain other material information as necessary from time to time. Investors and others are advised to check the website for updated performance information and the release of other material information about the
Funds. This reference to BlackRock’s website is intended to allow investors public access to information regarding the Funds and does not, and is not intended to, incorporate BlackRock’s website in this report.
BlackRock Privacy Principles
BlackRock is committed to
maintaining the privacy of its current and former fund investors and individual clients (collectively, “Clients”) and to safeguarding their non-public personal information. The following information is provided to help you understand what
personal information BlackRock collects, how we protect that information and why in certain cases we share such information with select parties.
If
you are located in a jurisdiction where specific laws, rules or regulations require BlackRock to provide you with additional or different privacy-related rights beyond what is set forth below, then BlackRock will comply with those specific laws,
rules or regulations.
BlackRock obtains or verifies personal non-public information from and about you from different sources, including the
following: (i) information we receive from you or, if applicable, your financial intermediary, on applications, forms or other documents; (ii) information about your transactions with us, our affiliates, or others; (iii) information
we receive from a consumer reporting agency; and (iv) from visits to our websites.
BlackRock does not sell or disclose to non-affiliated third
parties any non-public personal information about its Clients, except as permitted by law or as is necessary to respond to regulatory requests or to service Client accounts. These non-affiliated third parties are required to protect the
confidentiality and security of this information and to use it only for its intended purpose.
We may share information with our affiliates to service
your account or to provide you with information about other BlackRock products or services that may be of interest to you. In addition, BlackRock restricts access to non-public personal information about its Clients to those BlackRock employees with
a legitimate business need for the information. BlackRock maintains physical, electronic and procedural safeguards that are designed to protect the non-public personal information of its Clients, including procedures relating to the proper storage
and disposal of such information.
Fund and Service Providers
Investment Adviser
BlackRock
Advisors, LLC
Wilmington, DE 19809
Accounting Agent and Custodian
State Street Bank and Trust Company
Boston, MA 02114
Transfer Agent
Computershare Trust Company, N.A.
Canton, MA 02021
VRDP Liquidity Provider
Bank of America, N.A.(a)
New
York, NY 10036
The Toronto-Dominion Bank(b)
New York, NY 10019
(a) For MUJ
and BNY.
(b) For MIY, MYN, MPA and MYI.
VRDP Remarketing Agent
BofA
Securities, Inc.(a)
New York, NY 10036
TD Securities (USA) LLC(b)
New
York, NY 10019
VRDP Tender and Paying Agent
The Bank of New York Mellon
New York, NY 10286
Independent Registered Public Accounting Firm
Deloitte & Touche LLP
Boston, MA 02116
Legal Counsel
Willkie Farr & Gallagher LLP
New York, NY 10019
Address of the Funds
100 Bellevue Parkway
Wilmington, DE 19809
|
|
|
| 110 |
|
2 0 2 3 B L A C
K R O C K A N N U A L R E P O R
T T O S H A R E H O L D E R
S |
Glossary of Terms Used in this Report
Portfolio Abbreviation
|
|
|
| AGC |
|
Assured Guaranty Corp. |
|
|
| AGC-ICC |
|
Assured Guaranty Corp. – Insured Custody Certificate |
|
|
| AGM |
|
Assured Guaranty Municipal Corp. |
|
|
| AGM-CR |
|
AGM Insured Custodial Receipt |
|
|
| AMBAC |
|
AMBAC Assurance Corp. |
|
|
| AMT |
|
Alternative Minimum Tax |
|
|
| ARB |
|
Airport Revenue Bonds |
|
|
| BAB |
|
Build America Bond |
|
|
| BAM |
|
Build America Mutual Assurance Co. |
|
|
| BAM-TCRS |
|
Build America Mutual Assurance Co.- Transferable Custodial Receipts |
|
|
| BHAC-CR |
|
Berkshire Hathaway Assurance Corp. - Custodian Receipt |
|
|
| CAB |
|
Capital Appreciation Bonds |
|
|
| COP |
|
Certificates of Participation |
|
|
| CR |
|
Custodian Receipt |
|
|
| FHLMC |
|
Federal Home Loan Mortgage Corp. |
|
|
| FNMA |
|
Federal National Mortgage Association |
|
|
| GNMA |
|
Government National Mortgage Association |
|
|
| GO |
|
General Obligation Bonds |
|
|
| GTD |
|
GTD Guaranteed |
|
|
| HUD SECT 8 |
|
U.S. Department of Housing and Urban Development Section 8 |
|
|
| M/F |
|
Multi-Family |
|
|
| MTA |
|
Month Treasury Average |
|
|
| NPFGC |
|
National Public Finance Guarantee Corp. |
|
|
| NPFGC-IBC |
|
National Public Finance Guarantee Corp. — Insured Bond Certificate |
|
|
| PSF |
|
Permanent School Fund |
|
|
| Q-SBLF |
|
Qualified School Bond Loan Fund |
|
|
| RB |
|
Revenue Bond |
|
|
| S/F |
|
Single-Family |
|
|
| SAB |
|
Special Assessment Bonds |
|
|
| SAN |
|
State Aid Notes |
|
|
| SAW |
|
State Aid Withholding |
|
|
| SCH BD RES FD |
|
School Board Resolution Fund |
|
|
| SONYMA |
|
State of New York Mortgage Agency |
|
|
| ST |
|
Special Tax |
|
|
| TA |
|
Tax Allocation |
|
|
|
| G L O S S A R Y
O F T E R M S U S E D I N T H
I S R E P O R T |
|
111 |
Want to know more?
blackrock.com | 800-882-0052
This report is intended for current holders. It is not a prospectus. Past performance results shown in this report should not be considered a
representation of future performance. The Funds have leveraged their Common Shares, which creates risks for Common Shareholders, including the likelihood of greater volatility of NAV and market price of the Common Shares, and the risk that
fluctuations in short-term interest rates may reduce the Common Shares’ yield. Statements and other information herein are as dated and are subject to change.
MY6-07/23-AR
(b) Not Applicable
| Item 2 – |
Code of Ethics – The registrant (or the “Fund”) has adopted a code of ethics, as of the end of
the period covered by this report, applicable to the registrant’s principal executive officer, principal financial officer, principal accounting officer or controller, or persons performing similar functions. During the period covered by this
report, the code of ethics was amended to update certain information and to make other non-material changes. During the period covered by this report, there have been no waivers granted under the code of
ethics. The registrant undertakes to provide a copy of the code of ethics to any person upon request, without charge, who calls
1-800-882-0052, option 4. |
| Item 3 – |
Audit Committee Financial Expert – The registrant’s board of directors (the “board of
directors”), has determined that (i) the registrant has the following audit committee financial experts serving on its audit committee and (ii) each audit committee financial expert is independent: |
Frank J. Fabozzi
Lorenzo A.
Flores
Catherine A. Lynch
Under applicable securities laws, a person determined to be an audit committee financial expert will not be deemed an “expert” for
any purpose, including without limitation for the purposes of Section 11 of the Securities Act of 1933, as a result of being designated or identified as an audit committee financial expert. The designation or identification of a person as an
audit committee financial expert does not impose on such person any duties, obligations, or liabilities greater than the duties, obligations, and liabilities imposed on such person as a member of the audit committee and board of directors in the
absence of such designation or identification. The designation or identification of a person as an audit committee financial expert does not affect the duties, obligations, or liability of any other member of the audit committee or board of
directors.
| Item 4 – |
Principal Accountant Fees and Services |
The following table presents fees billed by Deloitte & Touche LLP (“D&T”) in each of the last two fiscal years for the
services rendered to the Fund:
|
|
|
|
|
|
|
|
|
|
|
|
|
|
|
|
|
| |
|
(a) Audit Fees |
|
(b) Audit-Related Fees1 |
|
(c) Tax Fees2 |
|
(d) All Other Fees |
| Entity Name |
|
Current
Fiscal
Year
End |
|
Previous
Fiscal
Year
End |
|
Current
Fiscal
Year
End |
|
Previous
Fiscal
Year
End |
|
Current
Fiscal
Year
End |
|
Previous
Fiscal
Year
End |
|
Current
Fiscal
Year
End |
|
Previous
Fiscal
Year
End |
| BlackRock MuniYield Quality Fund III, Inc. |
|
$32,538 |
|
$36,006 |
|
$0 |
|
$0 |
|
$30,000 |
|
$28,800 |
|
$407 |
|
$431 |
The following table presents fees billed by D&T that were required to be approved by the registrant’s
audit committee (the “Committee”) for services that relate directly to the operations or financial reporting of the Fund and that are rendered on behalf of BlackRock Advisors, LLC (“Investment Adviser” or “BlackRock”)
and entities controlling, controlled by, or under common control with BlackRock (not including any sub-adviser whose role is primarily portfolio management and is subcontracted with or overseen by another
investment adviser) that provide ongoing services to the Fund (“Affiliated Service Providers”):
2
|
|
|
|
|
| |
|
Current Fiscal Year End |
|
Previous Fiscal Year End |
| (b) Audit-Related Fees1 |
|
$0 |
|
$0 |
| (c) Tax Fees2 |
|
$0 |
|
$0 |
| (d) All Other Fees3 |
|
$2,154,000 |
|
$2098,000 |
1 The nature of the services includes assurance and
related services reasonably related to the performance of the audit or review of financial statements not included in Audit Fees, including accounting consultations, agreed-upon procedure reports, attestation reports, comfort letters, out-of-pocket expenses and internal control reviews not required by regulators.
2 The nature of the services includes tax compliance and/or tax preparation, including
services relating to the filing or amendment of federal, state or local income tax returns, regulated investment company qualification reviews, taxable income and tax distribution calculations.
3 Non-audit fees of $2,154,000 and $2,098,000 for
the current fiscal year and previous fiscal year, respectively, were paid to the Fund’s principal accountant in their entirety by BlackRock, in connection with services provided to the Affiliated Service Providers of the Fund and of certain
other funds sponsored and advised by BlackRock or its affiliates for a service organization review and an accounting research tool subscription. These amounts represent aggregate fees paid by BlackRock and were not allocated on a per fund basis.
(e)(1) Audit Committee Pre-Approval Policies and Procedures:
The Committee has adopted policies and procedures with regard to the pre-approval of
services. Audit, audit-related and tax compliance services provided to the registrant on an annual basis require specific pre-approval by the Committee. The Committee also must approve other non-audit services provided to the registrant and those non-audit services provided to the Investment Adviser and Affiliated Service Providers that relate directly to the
operations and the financial reporting of the registrant. Certain of these non-audit services that the Committee believes are (a) consistent with the SEC’s auditor independence rules and
(b) routine and recurring services that will not impair the independence of the independent accountants may be approved by the Committee without consideration on a specific
case-by-case basis (“general pre-approval”). The term of any general
pre-approval is 12 months from the date of the pre-approval, unless the Committee provides for a different period. Tax or other
non-audit services provided to the registrant which have a direct impact on the operations or financial reporting of the registrant will only be deemed pre-approved
provided that any individual project does not exceed $10,000 attributable to the registrant or $50,000 per project. For this purpose, multiple projects will be aggregated to determine if they exceed the previously mentioned cost levels.
Any proposed services exceeding the pre-approved cost levels will require specific pre-approval by the Committee, as will any other services not subject to general pre-approval (e.g., unanticipated but permissible services). The Committee is informed of each
service approved subject to general pre-approval at the next regularly scheduled in-person board meeting. At this meeting, an analysis of such services is presented to
the Committee for ratification. The Committee may delegate to the Committee Chairman the authority to approve the provision of and fees for any specific engagement of permitted non-audit services, including
services exceeding pre-approved cost levels.
(e)(2) None of the services described in each of
Items 4(b) through (d) were approved by the Committee pursuant to the de minimis exception in paragraph (c)(7)(i)(C) of Rule 2-01 of Regulation S-X.
(f) Not Applicable
(g) The aggregate non-audit fees, defined as the sum of the fees shown under “Audit-Related
Fees,”
3
“Tax Fees” and “All Other Fees,” paid to the accountant for services rendered by the accountant to the registrant, the Investment Adviser and the Affiliated Service Providers
were:
|
|
|
|
|
| Entity Name |
|
Current Fiscal Year
End |
|
Previous Fiscal
Year End |
| BlackRock MuniYield Quality Fund III, Inc. |
|
$30,407 |
|
$29,231 |
Additionally, the amounts billed by D&T in connection with services provided to the Affiliated Service
Providers of the Fund and of other funds sponsored or advised by BlackRock or its affiliates during the current and previous fiscal years for a service organization review and an accounting research tool subscription were:
|
|
|
| Current Fiscal Year
End |
|
Previous Fiscal Year
End |
|
$2,154,000 |
|
$2098,000 |
These amounts represent aggregate fees paid by BlackRock and were not allocated on a per fund basis.
(h) The Committee has considered and determined that the provision of non-audit services that were
rendered to the Investment Adviser, and the Affiliated Service Providers that were not pre-approved pursuant to paragraph (c)(7)(ii) of Rule 2-01 of Regulation S-X is compatible with maintaining the principal accountant’s independence.
(i) – Not
Applicable
(j) – Not Applicable
| Item 5 – |
Audit Committee of Listed Registrant |
(a) The following individuals are members of the registrant’s separately designated standing audit committee established in
accordance with Section 3(a)(58)(A) of the Securities Exchange Act of 1934 (15 U.S.C. 78c(a)(58)(A)):
Frank J. Fabozzi
Lorenzo A. Flores
J. Phillip
Holloman
Catherine A. Lynch
(b) Not Applicable
(a) The registrant’s Schedule of Investments is included as part of the Report to Stockholders filed under Item 1(a) of this Form.
4
(b) Not Applicable due to no such divestments during the semi-annual period covered since the
previous Form N-CSR filing.
| Item 7 – |
Disclosure of Proxy Voting Policies and Procedures for Closed-End
Management Investment Companies – The board of directors has delegated the voting of proxies for the Fund’s portfolio securities to the Investment Adviser pursuant to the Investment Adviser’s proxy voting guidelines. Under these
guidelines, the Investment Adviser will vote proxies related to Fund securities in the best interests of the Fund and its stockholders. From time to time, a vote may present a conflict between the interests of the Fund’s stockholders, on the
one hand, and those of the Investment Adviser, or any affiliated person of the Fund or the Investment Adviser, on the other. In such event, provided that the Investment Adviser’s Equity Investment Policy Oversight Committee, or a sub-committee thereof (the “Oversight Committee”) is aware of the real or potential conflict or material non-routine matter and if the Oversight Committee does not
reasonably believe it is able to follow its general voting guidelines (or if the particular proxy matter is not addressed in the guidelines) and vote impartially, the Oversight Committee may retain an independent fiduciary to advise the Oversight
Committee on how to vote or to cast votes on behalf of the Investment Adviser’s clients. If the Investment Adviser determines not to retain an independent fiduciary, or does not desire to follow the advice of such independent fiduciary, the
Oversight Committee shall determine how to vote the proxy after consulting with the Investment Adviser’s Portfolio Management Group and/or the Investment Adviser’s Legal and Compliance Department and concluding that the vote cast is in its
client’s best interest notwithstanding the conflict. A copy of the Fund’s Proxy Voting Policy and Procedures are attached as Exhibit 99.PROXYPOL, a copy of the Fund’s Global Corporate
Governance
& Engagement Principles are attached as Exhibit 99.GLOBAL.CORP.GOV and a copy of the Fund’s Corporate Governance and Proxy Voting Guidelines for U.S. Securities are attached as Exhibit
99.US.CORP.GOV. Information on how the Fund voted proxies relating to portfolio securities during the most recent 12-month period ended June 30 is available without charge, (i) at
www.blackrock.com and (ii) on the SEC’s website at http://www.sec.gov. |
| Item 8 – |
Portfolio Managers of Closed-End Management Investment Companies
|
(a)(1) As of the date of filing this Report:
The registrant is managed by a team of investment professionals comprised of Walter O’Connor, CFA, Managing Director at BlackRock,
Michael Kalinoski, CFA, Director at BlackRock, Christian Romaglino, CFA, Director at BlackRock, Kevin Maloney, CFA, Director at BlackRock, Phillip Soccio, CFA, Director at BlackRock and Kristi Manidis, Director at BlackRock. Each is a member of
BlackRock’s municipal tax-exempt management group. Each is jointly responsible for the day-to-day management of the
registrant’s portfolio, which includes setting the registrant’s overall investment strategy, overseeing the management of the registrant and/or selection of its investments. Messrs. O’Connor, Kalinoski and Romaglino have been members
of the registrant’s portfolio management team since 2006, 2011 and 2017 respectively. Messrs. Maloney and Soccio and Ms. Manidis have been members of the registrant’s portfolio management team since 2023.
5
|
|
|
|
|
|
| |
|
| Portfolio Manager |
|
Biography |
|
|
| Walter O’Connor, CFA |
|
Managing Director of BlackRock since 2006; Managing Director of Merrill Lynch Investment Managers, L.P. (“MLIM”) from 2003 to 2006; Director of MLIM from 1998 to 2003. |
|
|
| Michael Kalinoski, CFA |
|
Director of BlackRock since 2006; Director of Merrill Lynch Investment Managers, L.P. (“MLIM”) from 1999 to 2006. |
|
|
| Christian Romaglino, CFA |
|
Director of BlackRock since 2017, Portfolio Manager for the Municipal Mutual Fund Desk within BlackRock’s Global Fixed Income Group since 2017; Portfolio Manager of Brown Brothers
Harriman from 2007 to 2017. |
|
|
| Kevin Maloney, CFA |
|
Director of BlackRock since 2021; Vice President of BlackRock from 2018 to 2020; Associate of BlackRock from 2014 to 2017; Analyst of BlackRock from 2011 to 2013. |
|
|
| Phillip Soccio, CFA |
|
Director of BlackRock since 2009; Vice President of BlackRock from 2005 to 2008. |
|
|
| Kristi Manidis |
|
Director of BlackRock, Inc. since 2016; Vice President of BlackRock, Inc. from 2011 to 2015; Associate of BlackRock, Inc. from 2009 to 2011; Analyst of BlackRock, Inc. from 2006 to
2008. |
(a)(2) As of July 31, 2023:
|
|
|
|
|
|
|
|
|
|
|
|
|
| |
|
(ii) Number of Other
Accounts Managed and Assets by Account Type |
|
(iii) Number of Other Accounts and
Assets for Which Advisory Fee is
Performance-Based |
| (i) Name
of Portfolio Manager |
|
Other
Registered
Investment
Companies |
|
Other Pooled
Investment
Vehicles |
|
Other
Accounts |
|
Other
Registered
Investment
Companies |
|
Other Pooled
Investment
Vehicles |
|
Other
Accounts |
| |
|
|
|
|
|
|
|
Walter O’Connor, CFA |
|
33 |
|
0 |
|
0 |
|
0 |
|
0 |
|
0 |
| |
|
$32.29 Billion |
|
$0 |
|
$0 |
|
$0 |
|
$0 |
|
$0 |
| |
|
|
|
|
|
|
|
Michael Kalinoski, CFA |
|
34 |
|
0 |
|
0 |
|
0 |
|
0 |
|
0 |
| |
|
$36.13 Billion |
|
$0 |
|
$0 |
|
$0 |
|
$0 |
|
$0 |
| |
|
|
|
|
|
|
|
Christian Romaglino. CFA |
|
34 |
|
0 |
|
0 |
|
0 |
|
0 |
|
0 |
| |
|
$16.76 Billion |
|
$0 |
|
$0 |
|
$0 |
|
$0 |
|
$0 |
| |
|
|
|
|
|
|
|
Kevin Maloney, CFA |
|
36 |
|
0 |
|
0 |
|
0 |
|
0 |
|
0 |
| |
|
$38.35 Billion |
|
$0 |
|
$0 |
|
$0 |
|
$0 |
|
$0 |
| |
|
|
|
|
|
|
|
Philip Soccio, CFA |
|
34 |
|
0 |
|
0 |
|
0 |
|
0 |
|
0 |
| |
|
$ 31.42 Billion |
|
$0 |
|
$0 |
|
$0 |
|
$0 |
|
$0 |
| |
|
|
|
|
|
|
|
Kristi Manidis |
|
38 |
|
0 |
|
2 |
|
0 |
|
0 |
|
0 |
| |
|
$ 23.55 Billion |
|
$0 |
|
$1.03
Billion |
|
$0 |
|
$0 |
|
$0 |
(iv) Portfolio Manager Potential Material Conflicts of Interest
6
BlackRock has built a professional working environment, firm-wide compliance
culture and compliance procedures and systems designed to protect against potential incentives that may favor one account over another. BlackRock has adopted policies and procedures that address the allocation of investment opportunities, execution
of portfolio transactions, personal trading by employees and other potential conflicts of interest that are designed to ensure that all client accounts are treated equitably over time. Nevertheless, BlackRock furnishes investment management and
advisory services to numerous clients in addition to the Fund, and BlackRock may, consistent with applicable law, make investment recommendations to other clients or accounts (including accounts which are hedge funds or have performance or higher
fees paid to BlackRock, or in which portfolio managers have a personal interest in the receipt of such fees), which may be the same as or different from those made to the Fund. In addition, BlackRock, Inc., its affiliates and significant
shareholders and any officer, director, shareholder or employee may or may not have an interest in the securities whose purchase and sale BlackRock recommends to the Fund. BlackRock, Inc., or any of its affiliates or significant shareholders, or any
officer, director, shareholder, employee or any member of their families may take different actions than those recommended to the Fund by BlackRock with respect to the same securities. Moreover, BlackRock may refrain from rendering any advice or
services concerning securities of companies of which any of BlackRock, Inc.’s (or its affiliates’ or significant shareholders’) officers, directors or employees are directors or officers, or companies as to which BlackRock, Inc. or
any of its affiliates or significant shareholders or the officers, directors and employees of any of them has any substantial economic interest or possesses material non-public information. Certain portfolio
managers also may manage accounts whose investment strategies may at times be opposed to the strategy utilized for a fund. It should also be noted that a portfolio manager may be managing hedge fund and/or long only accounts, or may be part of a
team managing hedge fund and/or long only accounts, subject to incentive fees. Such portfolio managers may therefore be entitled to receive a portion of any incentive fees earned on such accounts. Currently, the portfolio managers of this Fund are
not entitled to receive a portion of incentive fees of other accounts.
As a fiduciary, BlackRock owes a duty of loyalty
to its clients and must treat each client fairly. When BlackRock purchases or sells securities for more than one account, the trades must be allocated in a manner consistent with its fiduciary duties. BlackRock attempts to allocate investments in a
fair and equitable manner among client accounts, with no account receiving preferential treatment. To this end, BlackRock, Inc. has adopted policies that are intended to ensure reasonable efficiency in client transactions and provide BlackRock with
sufficient flexibility to allocate investments in a manner that is consistent with the particular investment discipline and client base, as appropriate.
(a)(3) As of July 31, 2023:
Portfolio Manager Compensation Overview
The discussion below describes the portfolio managers’ compensation as of July 31, 2023.
BlackRock’s financial arrangements with its portfolio managers, its competitive compensation and its career path emphasis
at all levels reflect the value senior management places on key resources. Compensation may include a variety of components and may vary from year to year based on a number of factors. The principal components of compensation include a base salary,
7
a performance-based discretionary bonus, participation in various benefits programs and one or more of the incentive compensation programs established by BlackRock.
Base Compensation. Generally, portfolio managers receive base compensation based on their position with the firm.
Discretionary Incentive Compensation. Discretionary incentive compensation is a function of several components: the
performance of BlackRock, Inc., the performance of the portfolio manager’s group within BlackRock, the investment performance, including risk-adjusted returns, of the firm’s assets under management or supervision by that portfolio manager
relative to predetermined benchmarks, and the individual’s performance and contribution to the overall performance of these portfolios and BlackRock. In most cases, these benchmarks are the same as the benchmark or benchmarks against which the
performance of the Funds or other accounts managed by the portfolio managers are measured. Among other things, BlackRock’s Chief Investment Officers make a subjective determination with respect to each portfolio manager’s compensation
based on the performance of the Funds and other accounts managed by each portfolio manager relative to the various benchmarks. Performance of fixed income funds is measured on a pre-tax and/or after-tax basis over various time periods including 1-, 3- and 5- year periods, as applicable.
With respect to these portfolio managers, such benchmarks for the Fund and other accounts are: A combination of market-based indices (e.g., Bloomberg Municipal Bond Index), certain customized indices and certain fund industry peer groups.
Distribution of Discretionary Incentive Compensation. Discretionary incentive compensation is distributed to portfolio
managers in a combination of cash, deferred BlackRock, Inc. stock awards, and/or deferred cash awards that notionally track the return of certain BlackRock investment products.
Portfolio managers receive their annual discretionary incentive compensation in the form of cash. Portfolio managers whose
total compensation is above a specified threshold also receive deferred BlackRock, Inc. stock awards annually as part of their discretionary incentive compensation. Paying a portion of discretionary incentive compensation in the form of deferred
BlackRock, Inc. stock puts compensation earned by a portfolio manager for a given year “at risk” based on BlackRock’s ability to sustain and improve its performance over future periods. In some cases, additional deferred BlackRock,
Inc. stock may be granted to certain key employees as part of a long-term incentive award to aid in retention, align interests with long-term shareholders and motivate performance. Deferred BlackRock, Inc. stock awards are generally granted in the
form of BlackRock, Inc. restricted stock units that vest pursuant to the terms of the applicable plan and, once vested, settle in BlackRock, Inc. common stock. The portfolio managers of this Fund have deferred BlackRock, Inc. stock awards.
For certain portfolio managers, a portion of the discretionary incentive compensation is also distributed in the form of
deferred cash awards that notionally track the returns of select BlackRock investment products they manage, which provides direct alignment of portfolio manager discretionary incentive compensation with investment product results. Deferred cash
awards vest ratably over a number of years and, once vested, settle in the form of cash. Only portfolio managers who manage specified products and whose total compensation is above a specified threshold are eligible to participate in the deferred
cash award program.
8
Other Compensation Benefits. In addition to base salary and discretionary
incentive compensation, portfolio managers may be eligible to receive or participate in one or more of the following:
Incentive Savings Plans — BlackRock, Inc. has created a variety of incentive savings plans in which BlackRock,
Inc. employees are eligible to participate, including a 401(k) plan, the BlackRock Retirement Savings Plan (RSP), and the BlackRock Employee Stock Purchase Plan (ESPP). The employer contribution components of the RSP include a company match equal to
50% of the first 8% of eligible pay contributed to the plan capped at $5,000 per year, and a company retirement contribution equal to 3-5% of eligible compensation up to the Internal Revenue Service limit
($330,000 for 2023). The RSP offers a range of investment options, including registered investment companies and collective investment funds managed by the firm. BlackRock, Inc. contributions follow the investment direction set by participants for
their own contributions or, absent participant investment direction, are invested into a target date fund that corresponds to, or is closest to, the year in which the participant attains age 65. The ESPP allows for investment in BlackRock, Inc.
common stock at a 5% discount on the fair market value of the stock on the purchase date. Annual participation in the ESPP is limited to the purchase of 1,000 shares of common stock or a dollar value of $25,000 based on its fair market value on the
purchase date. All of the eligible portfolio managers are eligible to participate in these plans.
(a)(4) Beneficial Ownership of
Securities – As of July 31, 2023:
|
|
|
| Portfolio Manager |
|
Dollar Range of
Equity Securities of the Fund Beneficially Owned |
| Walter
O’Connor, CFA |
|
$1 - $10,000 |
| Michael
Kalinoski, CFA |
|
$1 - $10,000 |
| Christian
Romaglino, CFA |
|
$1 - $10,000 |
| Kevin
Maloney, CFA |
|
None |
| Phillip
Soccio, CFA |
|
None |
| Kristi
Manidis |
|
None |
(b) Not Applicable
| Item 9 – |
Purchases of Equity Securities by Closed-End Management Investment
Company and Affiliated Purchasers |
|
|
|
|
|
|
|
|
|
| Period |
|
(a)
Total
Number of
Shares
Purchased |
|
(b) Average
Price Paid per
Share |
|
(c) Total Number of
Shares Purchased as Part
of Publicly
Announced
Plans or Programs |
|
(d) Maximum Number of
Shares that May Yet Be
Purchased Under
the
Plans or Programs1 |
| February 1-28, 2023 |
|
0 |
|
$- |
|
0 |
|
3,407,534 |
| March 1-31, 2023 |
|
87,215 |
|
$ 11.1104 |
|
87,215 |
|
3,320,319 |
| April 1-30, 2023 |
|
0 |
|
$- |
|
0 |
|
3,320,319 |
| May 1-31, 2023 |
|
195,353 |
|
$10.7646 |
|
195,353 |
|
3,124,966 |
| June 1-30, 2023 |
|
182,557 |
|
$10.8639 |
|
182,557 |
|
2,942,409 |
| July 1-31, 2023 |
|
179,796 |
|
$11.0047 |
|
179,796 |
|
2,762,613 |
|
Total: |
|
644,921 |
|
10.9064214 |
|
644,921 |
|
2,762,613 |
9
1 On September 8, 2022, the Fund
announced a continuation of its open market share repurchase program. Commencing on December 1, 2022, the Fund may repurchase through November 30, 2023, up to 5% of its common shares outstanding as of the close of business on
November 30, 2022, subject to certain conditions.
| Item 10 – |
Submission of Matters to a Vote of Security Holders – There have been no material changes to these
procedures. |
| Item 11 – |
Controls and Procedures |
(a) The registrant’s principal executive and principal financial officers, or persons performing similar functions, have concluded that
the registrant’s disclosure controls and procedures (as defined in Rule 30a-3(c) under the Investment Company Act of 1940, as amended (the “1940 Act”)) are effective as of a date within 90 days
of the filing of this report based on the evaluation of these controls and procedures required by Rule 30a-3(b) under the 1940 Act and Rule 13a-15(b) under the Securities Exchange Act of 1934, as amended.
(b) There were no changes in the registrant’s internal control over financial reporting (as defined in Rule 30a-3(d) under the 1940 Act) that occurred during the period covered by this report that have materially affected, or are reasonably likely to materially affect, the registrant’s internal control over financial
reporting.
| Item 12 – |
Disclosure of Securities Lending Activities for Closed-End Management
Investment Companies –Not Applicable |
| Item 13 – |
Exhibits attached hereto |
(a)(1) Code of Ethics – See Item 2
(a)(2) Section 302 Certifications are attached
(a)(3) Any written solicitation to purchase securities under Rule 23c-1 – Not Applicable
(a)(4) Change in Registrant’s independent public accountant – Not Applicable
(b) Section 906 Certifications are attached
10
Pursuant to the requirements of the Securities Exchange Act of 1934 and the Investment Company
Act of 1940, the registrant has duly caused this report to be signed on its behalf by the undersigned, thereunto duly authorized.
BlackRock MuniYield Quality Fund III, Inc.
|
|
|
|
|
|
|
By: |
|
/s/ John M.
Perlowski |
|
|
|
|
John M. Perlowski |
|
|
|
|
Chief Executive Officer (principal executive officer) of |
|
|
|
|
BlackRock MuniYield Quality Fund III, Inc. |
Date: September 22, 2023
Pursuant to the requirements of the Securities Exchange Act of 1934 and the Investment Company Act of 1940, this report has been signed below
by the following persons on behalf of the
registrant and in the capacities and on the dates indicated.
|
|
|
|
|
|
|
By: |
|
/s/ John M.
Perlowski |
|
|
|
|
John M. Perlowski |
|
|
|
|
Chief Executive Officer (principal executive officer) of |
|
|
|
|
BlackRock MuniYield Quality Fund III, Inc. |
Date: September 22, 2023
|
|
|
|
|
|
|
By: |
|
/s/ Trent
Walker |
|
|
|
|
Trent Walker |
|
|
|
|
Chief Financial Officer (principal financial officer) of |
|
|
|
|
BlackRock MuniYield Quality Fund III, Inc. |
Date: September 22, 2023
11
EX-99. CERT
CERTIFICATION PURSUANT TO RULE 30a-2(a) UNDER THE 1940 ACT AND SECTION 302 OF THE
SARBANES-OXLEY ACT OF 2002
I, John M. Perlowski, Chief Executive
Officer (principal executive officer) of BlackRock MuniYield Quality Fund III, Inc., certify that:
1. I have reviewed
this report on Form N-CSR of BlackRock MuniYield Quality Fund III, Inc.;
2. Based on my knowledge, this report does not contain any untrue statement of a material fact or omit to state a material
fact necessary to make the statements made, in light of the circumstances under which such statements were made, not misleading with respect to the period covered by this report;
3. Based on my knowledge, the financial statements, and other financial information included in this report, fairly
present in all material respects the financial condition, results of operations, changes in net assets, and cash flows (if the financial statements are required to include a statement of cash flows) of the registrant as of, and for, the periods
presented in this report;
4. The registrant’s other certifying officer(s) and I are responsible for establishing
and maintaining disclosure controls and procedures (as defined in Rule 30a-3(c) under the Investment Company Act of 1940) and internal control over financial reporting (as defined in Rule 30a-3(d) under the Investment Company Act of 1940) for the registrant and have:
a) designed such disclosure controls and procedures, or caused such disclosure controls and procedures to be designed
under our supervision, to ensure that material information relating to the registrant, including its consolidated subsidiaries, is made known to us by others within those entities, particularly during the period in which this report is being
prepared;
b) designed such internal control over financial reporting, or caused such internal control over financial
reporting to be designed under our supervision, to provide reasonable assurance regarding the reliability of financial reporting and the preparation of financial statements for external purposes in accordance with generally accepted accounting
principles;
c) evaluated the effectiveness of the registrant’s disclosure controls and procedures and presented
in this report our conclusions about the effectiveness of the disclosure controls and procedures, as of a date within 90 days prior to the filing date of this report based on such evaluation; and
d) disclosed in this report any change in the registrant’s internal control over financial reporting that occurred
during the period covered by this report that has materially affected, or is reasonably likely to materially affect, the registrant’s internal control over financial reporting; and
5. The registrant’s other certifying officer(s) and I have disclosed to the registrant’s auditors and the audit
committee of the registrant’s board of directors (or persons performing the equivalent functions):
a) all
significant deficiencies and material weaknesses in the design or operation of internal control over financial reporting which are reasonably likely to adversely affect the registrant’s ability to record, process, summarize, and report
financial information; and
b) any fraud, whether or not material, that involves management or other employees who
have a significant role in the registrant’s internal control over financial reporting.
Date: September 22, 2023
/s/ John M. Perlowski
John M. Perlowski
Chief
Executive Officer (principal executive officer) of
BlackRock MuniYield Quality Fund III, Inc.
EX-99. CERT
CERTIFICATION PURSUANT TO RULE 30a-2(a) UNDER THE 1940 ACT AND SECTION 302 OF THE
SARBANES-OXLEY ACT OF 2002
I, Trent Walker, Chief Financial
Officer (principal financial officer) of BlackRock MuniYield Quality Fund III, Inc., certify that:
1. I have reviewed
this report on Form N-CSR of BlackRock MuniYield Quality Fund III, Inc.;
2. Based on my knowledge, this report does not contain any untrue statement of a material fact or omit to state a material
fact necessary to make the statements made, in light of the circumstances under which such statements were made, not misleading with respect to the period covered by this report;
3. Based on my knowledge, the financial statements, and other financial information included in this report, fairly
present in all material respects the financial condition, results of operations, changes in net assets, and cash flows (if the financial statements are required to include a statement of cash flows) of the registrant as of, and for, the periods
presented in this report;
4. The registrant’s other certifying officer(s) and I are responsible for establishing
and maintaining disclosure controls and procedures (as defined in Rule 30a-3(c) under the Investment Company Act of 1940) and internal control over financial reporting (as defined in Rule 30a-3(d) under the Investment Company Act of 1940) for the registrant and have:
a)
designed such disclosure controls and procedures, or caused such disclosure controls and procedures to be designed under our supervision, to ensure that material information relating to the registrant, including its consolidated subsidiaries, is
made known to us by others within those entities, particularly during the period in which this report is being prepared;
b) designed such internal control over financial reporting, or caused such internal control over financial reporting to
be designed under our supervision, to provide reasonable assurance regarding the reliability of financial reporting and the preparation of financial statements for external purposes in accordance with generally accepted accounting principles;
c) evaluated the effectiveness of the registrant’s disclosure controls and procedures and presented in this report
our conclusions about the effectiveness of the disclosure controls and procedures, as of a date within 90 days prior to the filing date of this report based on such evaluation; and
d) disclosed in this report any change in the registrant’s internal control over financial reporting that occurred
during the period covered by this report that has materially affected, or is reasonably likely to materially affect, the registrant’s internal control over financial reporting; and
5. The registrant’s other certifying officer(s) and I have disclosed to the registrant’s auditors and the audit
committee of the registrant’s board of directors (or persons performing the equivalent functions):
a) all
significant deficiencies and material weaknesses in the design or operation of internal control over financial reporting which are reasonably likely to adversely affect the registrant’s ability to record, process, summarize, and report
financial information; and
b) any fraud, whether or not material, that involves management or other employees who
have a significant role in the registrant’s internal control over financial reporting.
Date: September 22, 2023
/s/ Trent Walker
Trent Walker
Chief Financial
Officer (principal financial officer) of
BlackRock MuniYield Quality Fund III, Inc.
Exhibit 99.906CERT
Certification Pursuant to Rule 30a-2(b) under the 1940 Act and
Section 906 of the Sarbanes-Oxley Act of 2002
Pursuant to 18 U.S.C. § 1350, the undersigned officer of BlackRock MuniYield Quality Fund III, Inc. (the “Registrant”), hereby
certifies, to the best of his knowledge, that the Registrant’s Report on Form N-CSR for the period ended July 31, 2023 (the “Report”) fully complies with the requirements of
Section 13(a) of the Securities Exchange Act of 1934, as amended, and that the information contained in the Report fairly presents, in all material respects, the financial condition and results of operations of the Registrant.
Date: September 22, 2023
/s/ John M. Perlowski
John M. Perlowski
Chief
Executive Officer (principal executive officer) of
BlackRock MuniYield Quality Fund III, Inc.
Pursuant to 18 U.S.C. § 1350, the undersigned officer of BlackRock MuniYield Quality Fund III, Inc. (the “Registrant”), hereby
certifies, to the best of his knowledge, that the Registrant’s Report on Form N-CSR for the period ended July 31, 2023 (the “Report”) fully complies with the requirements of
Section 13(a) of the Securities Exchange Act of 1934, as amended, and that the information contained in the Report fairly presents, in all material respects, the financial condition and results of operations of the Registrant.
Date: September 22, 2023
/s/ Trent Walker
Trent Walker
Chief Financial
Officer (principal financial officer) of
BlackRock MuniYield Quality Fund III, Inc.
This certification is being furnished pursuant to Rule 30a-2(b) under the Investment Company Act of
1940, as amended, and 18 U.S.C. § 1350 and is not being filed as part of the Form N-CSR with the Securities and Exchange Commission.
Closed-End Fund Proxy Voting Policy
August 1, 2021

|
| Closed-End Fund
Proxy Voting Policy |
| |
| Procedures Governing Delegation of Proxy Voting to Fund
Adviser |
| |
|
Effective Date: August 1, 2021 Last Review Date: August 25,
2023 |
|
| Applies
to the following types of Funds registered under the 1940 Act: ☐ Open-End Mutual Funds (including money
market funds) ☐ Money Market Funds
☐ Exchange-Traded Funds ☒ Closed-End Funds ☐ Other |
Objective and Scope
Set forth below is the
Closed-End Fund Proxy Voting Policy.
Policy / Document Requirements and Statements
The Boards of Trustees/Directors (the “Directors”) of the closed-end funds advised by BlackRock Advisors, LLC
(“BlackRock”), (the “Funds”) have the responsibility for the oversight of voting proxies relating to portfolio securities of the Funds, and have determined that it is in the best interests of the Funds and their shareholders to
delegate that responsibility to BlackRock as part of BlackRock’s authority to manage, acquire and dispose of account assets, all as contemplated by the Funds’ respective investment management agreements.
BlackRock has adopted guidelines and procedures (together and as from time to time amended, the “BlackRock proxy voting guidelines”) governing proxy voting by
accounts managed by BlackRock. BlackRock will cast votes on behalf of each of the Funds on specific proxy issues in respect of securities held by each such Fund in accordance with the BlackRock Proxy voting guidelines; provided, however, that in the
case of underlying closed-end funds (including business development companies and other similarly-situated asset pools) held by the Funds that have, or are proposing to adopt, a classified board structure,
BlackRock will typically (a) vote in favor of proposals to adopt classification and against proposals to eliminate classification, and (b) not vote against directors as a result of their adoption of a classified board structure.
BlackRock will report on an annual basis to the Directors on (1) a summary of the proxy voting process as applicable to the Funds in the preceding year together
with a representation that all votes were in accordance with the BlackRock proxy voting guidelines (as modified pursuant to the immediately preceding paragraph), and (2) any changes to the BlackRock proxy voting guidelines that have not
previously been reported.


Contents
The purpose of this document is to provide an overarching explanation of BlackRock’s approach globally to our responsibilities
as a shareholder on behalf of our clients, our expectations of companies, and our commitments to clients in terms of our own governance and transparency.
|
|
|
| BlackRock Investment Stewardship |
|
Global Principles | 2 |
Introduction to BlackRock
BlackRock’s purpose is to help more and more people experience financial well-being. We manage assets on behalf of institutional and individual clients, across a
full spectrum of investment strategies, asset classes, and regions. Our client base includes pension plans, endowments, foundations, charities, official institutions, insurers, and other financial institutions, as well as individuals around the
world. As part of our fiduciary duty to our clients, we consider it one of our responsibilities to promote sound corporate governance, as an informed, engaged shareholder on their behalf. At BlackRock, this is the responsibility of the Investment
Stewardship team.
Philosophy on investment stewardship
Companies are responsible for ensuring they have appropriate governance structures to serve the interests of shareholders and other key stakeholders. We believe that
there are certain fundamental rights attached to shareholding. Companies and their boards should be accountable to shareholders and structured with appropriate checks and balances to ensure that they operate in shareholders’ best interests to
create sustainable value. Shareholders should have the right to vote to elect, remove, and nominate directors, approve the appointment of the auditor, and amend the corporate charter or by-laws. Shareholders
should be able to vote on key board decisions that are material to the protection of their investment, including but not limited to, changes to the purpose of the business, dilution levels and pre-emptive rights, and the distribution of income and
capital structure. In order to make informed decisions, shareholders need sufficient and timely information. In addition, shareholder voting rights should be proportionate to their economic ownership—the principle of “one share, one
vote” helps achieve this balance.
Consistent with these shareholder rights, BlackRock has a responsibility to monitor and provide feedback to companies in
our role as stewards of our clients’ investments. Investment stewardship is how we use our voice as an investor to promote sound corporate governance and business practices to help maximize long-term shareholder value for our clients, the vast
majority of whom are investing for long-term goals such as retirement. BlackRock Investment Stewardship (BIS) does this through engagement with management teams and/or board members on material business issues and, for those clients who have given
us authority, through voting proxies in their best long-term financial interests.1 We also contribute to consultations on public policy and private sector initiatives on industry standards,
consistent with our clients’ interests as long-term shareholders.
BlackRock looks to companies to provide timely, accurate, and comprehensive disclosure on
all material governance and business matters. This transparency allows shareholders to appropriately understand and assess how relevant risks and opportunities are being effectively identified and managed. Where company reporting and disclosure is
inadequate or where the governance approach taken may be inconsistent with durable, long-term value creation for shareholders, we will engage with a company and/or vote in a manner that advances long-term shareholders’ interests.
BlackRock views engagement as an important activity; engagement provides us with the opportunity to improve our understanding of the business and of the risks and
opportunities that are material to the
1 Through BlackRock Voting Choice we have, since January 2022, made proxy voting easier and
more accessible for investors in separate accounts and certain pooled vehicles. As a result, the shares attributed to BlackRock in company share registers may be voted differently depending on whether our clients have authorized BIS to vote on their
behalf, have authorized BIS to vote in accordance with a third party policy, or have elected to vote shares in accordance with their own policy. We are not able to disclose which clients have opted to exercise greater control over their voting, nor
are we able to disclose which proxy voting policies they have selected.
|
|
|
| BlackRock Investment Stewardship |
|
Global Principles | 3 |
companies in which our clients invest. Engagement may also inform our voting decisions. As long-term investors on behalf
of clients, we seek to have regular and continuing dialogue with executives and board directors to advance sound governance and durable business practices aligned with long-term value creation, as well as to understand the effectiveness of the
company’s management and oversight of material issues. Engagement is an important mechanism for providing feedback on company practices and disclosures, particularly where we believe they could be enhanced to support a company’s ability to
deliver financial performance. Similarly, it provides us with an opportunity to hear directly from company boards and management on how they believe their actions are aligned with durable, long-term value creation.
We generally vote in support of management and boards that exhibit an approach to decision-making that is consistent with creating durable, long-term value for
shareholders. If we have concerns about a company’s approach, we may choose to explain our expectations to the company’s board and management. Following that engagement, we may signal through our voting that we have outstanding concerns,
generally by voting against the re-election of directors we view as having responsibility for an issue. We apply our regional proxy voting guidelines to achieve the outcome that is most aligned with our
clients’ long-term financial interests.
|
|
|
| BlackRock Investment Stewardship |
|
Global Principles | 4 |
Key themes
We recognize that accepted standards and norms of corporate governance can differ between markets. However, in our experience, there are certain fundamental elements
of governance practice that are intrinsic globally to a company’s ability to create long-term value for shareholders. These global themes are set out in this overarching set of principles (the Principles), which are anchored in transparency and
accountability. At a minimum, it is our view that companies should observe the accepted corporate governance standards in their domestic market and ask that, if they do not, they explain how their approach better supports durable, long-term value
creation.
These Principles cover seven key themes:
| ● |
|
Auditors and audit-related issues |
| ● |
|
Capital structure, mergers, asset sales, and other special transactions |
| ● |
|
Compensation and benefits |
| ● |
|
Material sustainability-related risks and opportunities |
| ● |
|
Other corporate governance matters and shareholder protections |
Our regional and market-specific voting guidelines explain how these Principles inform our voting decisions in relation to specific ballot items for
shareholder meetings.
|
|
|
| BlackRock Investment Stewardship |
|
Global Principles | 5 |
Boards and directors
Our primary focus is on the performance of the board of directors to promote sound corporate governance. The performance of the board is critical to the economic
success of the company and the protection of shareholders’ interests. As part of their responsibilities, board members owe fiduciary duties to shareholders in overseeing the strategic direction and operation of the company. For this reason, BIS
sees engaging with and the election of directors as one of our most important and impactful responsibilities.
We support boards whose approach is consistent with
creating durable, long-term value. This includes the effective corporate governance and management of material sustainability-related risks and opportunities,2 as well as the consideration of the
company’s key constituents including their employees, clients, suppliers, and the communities within which they operate. The board should establish and maintain a framework of robust and effective governance mechanisms to support its oversight
of the company’s strategic aims. We look to the board to articulate the effectiveness of these mechanisms in overseeing the management of business risks and opportunities and the fulfillment of the company’s purpose. Disclosure of all
material issues that affect the company’s long-term strategy and ability to create value is essential for shareholders to be able to appropriately understand and assess how risks are effectively identified, managed and mitigated.
Where a company has not adequately disclosed and demonstrated that they have fulfilled these responsibilities, we will consider voting against the re-election of directors whom we consider to have particular responsibility for the issue. We assess director performance on a
case-by-case basis and in light of each company’s circumstances, taking into consideration our assessment of their governance, business practices that support
durable, long-term value creation, and performance. In serving the interests of shareholders, the responsibility of the board of directors includes, but is not limited to, the following:
| ● |
|
Establishing an appropriate corporate governance structure |
| ● |
|
Supporting and overseeing management in setting long-term strategic goals and applicable measures of value-creation and
milestones that will demonstrate progress, and taking steps to address anticipated or actual obstacles to success |
| ● |
|
Providing oversight on the identification and management of material governance and sustainability-related risks
|
| ● |
|
Overseeing the financial resilience of the company, the integrity of financial statements, and the robustness of a
company’s Enterprise Risk Management3 framework |
2 By material sustainability-related risks and opportunities, we mean the drivers of risk and value creation in a company’s business model that have an environmental or social dependency or
impact. Examples of environmental issues include, but are not limited to, water use, land use, waste management and climate risk. Examples of social issues include, but are not limited to, human capital management, impacts on the communities in
which a company operates, customer loyalty and relationships with regulators. It is our view that well-managed companies will effectively evaluate and manage material sustainability-related risks and opportunities relevant to their businesses.
Governance is the core means by which boards can oversee the creation of durable, long-term value. Appropriate risk oversight of business-relevant and material sustainability-related considerations is a component of a sound governance framework.
3 Enterprise risk management is a process, effected by the entity’s board of directors, management, and
other personnel, applied in strategy setting and across the enterprise, designed to identify potential events that may affect the entity, and manage risk to be within the risk appetite, to provide reasonable assurance regarding the achievement of
objectives. (Committee of Sponsoring
|
|
|
| BlackRock Investment Stewardship |
|
Global Principles | 6 |
| ● |
|
Making decisions on matters that require independent evaluation, which may include mergers, acquisitions and
dispositions, activist situations or other similar cases |
| ● |
|
Establishing appropriate executive compensation structures |
| ● |
|
Monitoring business issues including material sustainability-related risks and opportunities, that have the potential to
significantly impact the company’s long-term value |
There should be clear descriptions of the role of the board and the committees of the
board and how they engage with and oversee management. Set out below are ways in which boards and directors can demonstrate a commitment to acting in the best long-term economic interests of all shareholders.
We will seek to engage with the appropriate directors where we have concerns about the performance of the company, board, or individual directors and may signal
outstanding concerns in our voting. While we consider these principles to be globally relevant, when assessing a board’s composition and governance processes, we consider local market norms and regulations.
Regular accountability
It is our view that directors should stand for re-election on a regular basis, ideally annually. In our experience, annual re-elections allow shareholders to reaffirm their support for board members or hold them
accountable for their decisions in a timely manner. When board members are not re-elected annually, in our experience, it is good practice for boards to have a rotation policy to ensure that, through a board
cycle, all directors have had their appointment re-confirmed, with a proportion of directors being put forward for re-election at each annual general meeting.
Effective board composition
Regular director elections also give boards
the opportunity to adjust their composition in an orderly way to reflect the evolution of the company’s strategy and the market environment. In our view, it is beneficial for new directors to be brought onto the board periodically to refresh
the group’s thinking and in a manner that supports both continuity and appropriate succession planning. We consider the average overall tenure of the board, where we are seeking a balance between the knowledge and experience of longer-serving
members and the fresh perspectives of newer members. We encourage companies to keep under regular review the effectiveness of their board (including its size), and assess directors nominated for election or
re-election in the context of the composition of the board as a whole. This assessment should consider a number of factors, including the potential need to address gaps in skills, experience, independence, and
diversity.
In our view, there should be a sufficient number of independent directors, free from conflicts of interest or undue influence from connected parties,
to ensure objectivity in the decision-making of the board and its ability to oversee management. Common impediments to independence may include but are not limited to:
| ● |
|
Current or recent employment at the company or a subsidiary |
| ● |
|
Being, or representing, a shareholder with a substantial shareholding in the company |
Organizations of the Treadway Commission (COSO), Enterprise Risk Management — Integrated Framework, September 2004, New York, NY).
|
|
|
| BlackRock Investment Stewardship |
|
Global Principles | 7 |
| ● |
|
Interlocking directorships |
| ● |
|
Having any other interest, business, or other relationship which could, or could reasonably be perceived to, materially
interfere with a director’s ability to act in the best interests of the company and their shareholders |
In our experience, boards are most
effective at overseeing and advising management when there is a senior independent board leader. This director may chair the board, or, where the chair is also the CEO (or is otherwise not independent), be designated as a lead independent director.
The role of this director is to enhance the effectiveness of the independent members of the board through shaping the agenda, ensuring adequate information is provided to the board, and encouraging independent director participation in board
deliberations. The lead independent director or another appropriate director should be available to shareholders in those situations where an independent director is best placed to explain and contextualize a company’s approach.
When nominating new directors to the board, we look to companies to provide sufficient information on the individual candidates so that shareholders can assess the
suitability of each individual nominee and the overall board composition. These disclosures should give an understanding of how the collective experience and expertise of the board aligns with the company’s long-term strategy and business
model. Highly qualified, engaged directors with professional characteristics relevant to a company’s business enhance the ability of the board to add value and be the voice of shareholders in board discussions. In our view, a strong board
provides a competitive advantage to a company, providing valuable oversight and contributing to the most important management decisions that support long-term financial performance.
It is in this context that we are interested in diversity in the board room. We see it as a means to promoting diversity of thought and avoiding “group
think” in the board’s exercise of its responsibilities to advise and oversee management. It allows boards to have deeper discussions and make more resilient decisions. We ask boards to disclose how diversity is considered in board
composition, including professional characteristics, such as a director’s industry experience, specialist areas of expertise and geographic location; as well as demographic characteristics such as gender, race/ethnicity and age.
We look to understand a board’s diversity in the context of a company’s domicile, market capitalization, business model and strategy. Increasingly, we see
leading boards adding members whose experience deepens the board’s understanding of the company’s customers, employees and communities. Self-identified board demographic diversity can usefully be disclosed in aggregate, consistent with
local law. We believe boards should aspire to meaningful diversity of membership, at least consistent with local regulatory requirements and best practices, while recognizing that building a strong, diverse board can take time.
This position is based on our view that diversity of perspective and thought – in the board room, in the management team and throughout the company – leads
to better long term economic outcomes for companies. Academic research already reveals correlations between specific dimensions of diversity and effects on decision-making processes and outcomes.4
In our experience, greater diversity in the board room contributes to more robust discussions and more innovative and resilient decisions. Over time, greater diversity in the board room can also promote greater diversity and resilience in the
leadership
4 For a discussion on the different impacts of diversity see: McKinsey, “Diversity Wins:
How Inclusion Matters”, May 2022; Harvard Business Review, Diverse Teams Feel Less Comfortable – and That’s Why They Perform Better, September 2016; “Do Diverse Directors Influence DEI Outcomes”, September 2022
McKinsey, “Diversity Wins: How Inclusion Matters”, May 2022; Harvard Business Review, Diverse Teams Feel Less Comfortable
– and That’s Why They Perform Better, September 2016; “Do Diverse Directors Influence DEI Outcomes”, September 2022
|
|
|
| BlackRock Investment Stewardship |
|
Global Principles | 8 |
team, and the workforce more broadly. That diversity can enable companies to develop businesses that more
closely reflect and resonate with the customers and communities they serve.
There are matters for which the board has responsibility that may involve a conflict
of interest for executives or for affiliated directors. It is our view that objective oversight of such matters is best achieved when the board forms committees comprised entirely of independent directors. In many markets, these committees of the
board specialize in audit, director nominations, and compensation matters. An ad hoc committee might also be formed to decide on a special transaction, particularly one involving a related party, or to investigate a significant adverse event.
Sufficient capacity
As the role and expectations of a director are
increasingly demanding, directors must be able to commit an appropriate amount of time to board and committee matters. It is important that directors have the capacity to meet all of their responsibilities - including when there are unforeseen
events – and therefore, they should not take on an excessive number of roles that would impair their ability to fulfill their duties.
Auditors and audit-related issues
BlackRock recognizes the critical importance of financial statements, which should provide a true and fair picture of a
company’s financial condition. Accordingly, the assumptions made by management and reviewed by the auditor in preparing the financial statements should be reasonable and justified.
The accuracy of financial statements, inclusive of financial and non-financial information as required or permitted under
market-specific accounting rules, is of paramount importance to BlackRock. Investors increasingly recognize that a broader range of risks and opportunities have the potential to materially impact financial performance. Over time, we anticipate
investors and other users of company reporting will increasingly seek to understand and scrutinize the assumptions underlying financial statements, particularly those that pertain to the impact of the transition to a low carbon economy on a
company’s business model and asset mix. We recognize that this is an area of evolving practice and we look to international standards setters, the International Accounting Standards Board (IASB) and the International Auditing and Assurance
Standards Board (IAASB) to provide additional guidance to companies.
In this context, audit committees, or equivalent, play a vital role in a company’s
financial reporting system by providing independent oversight of the accounts, material financial and, where appropriate to the jurisdiction, non-financial information, internal control frameworks, and in the
absence of a dedicated risk committee, Enterprise Risk Management systems. In our view, effective audit committee oversight strengthens the quality and reliability of a company’s financial statements and provides an important level of
reassurance to shareholders.
We hold members of the audit committee or equivalent responsible for overseeing the management of the audit function. Audit
committees or equivalent should have clearly articulated charters that set out their responsibilities and have a rotation plan in place that allows for a periodic refreshment of the committee membership to introduce fresh perspectives to audit
oversight. We recognize that audit committees will rely on management, internal audit and the independent auditor in fulfilling their responsibilities but look to committee members to demonstrate they have relevant expertise to monitor and oversee
those functions.
We take particular note of unexplained changes in reporting methodology, cases involving significant financial restatements, or ad hoc
notifications of material financial weakness. In this respect, audit
|
|
|
| BlackRock Investment Stewardship |
|
Global Principles | 9 |
committees should provide timely disclosure on the remediation of Key and Critical Audit Matters identified either by the external auditor or internal audit function.
The integrity of financial statements depends on the auditor being free of any impediments to being an effective check on management. To that end, it is important
that auditors are, and are seen to be, independent. Where an audit firm provides services to the company in addition to the audit, the fees earned should be disclosed and explained. Audit committees should have in place a procedure for assessing
annually the independence of the auditor and the quality of the external audit process.
Comprehensive disclosure provides investors with a sense of the
company’s long-term operational risk management practices and, more broadly, the quality of the board’s oversight. The audit committee or equivalent, or a dedicated risk committee, should periodically review the company’s risk
assessment and risk management policies and the significant risks and exposures identified by management, the internal auditors or the independent accountants, and management’s steps to address them. In the absence of robust disclosures, we may
reasonably conclude that companies are not adequately managing risk.
Capital structure, mergers, asset sales, and other
special transactions
The capital structure of a company is critical to shareholders as it impacts the value of their investment and the priority of their
interest in the company relative to that of other equity or debt investors. Pre-emptive rights are a key protection for shareholders against the dilution of their interests.
Effective voting rights are basic rights of share ownership. It is our view that one vote for one share as a guiding principle supports effective corporate
governance. Shareholders, as the residual claimants, have the strongest interest in protecting company value, and voting rights should match economic exposure.
In principle, we disagree with the creation of a share class with equivalent economic exposure and preferential, differentiated voting rights. In our view, this
structure violates the fundamental corporate governance principle of proportionality and results in a concentration of power in the hands of a few shareholders, thus disenfranchising other shareholders and amplifying any potential conflicts of
interest. However, we recognize that in certain markets, at least for a period of time, companies may have a valid argument for listing dual classes of shares with differentiated voting rights. In our view, such companies should review these share
class structures on a regular basis or as company circumstances change. Additionally, they should seek shareholder approval of their capital structure on a periodic basis via a management proposal at the company’s shareholder meeting. The
proposal should give unaffiliated shareholders the opportunity to affirm the current structure or establish mechanisms to end or phase out controlling structures at the appropriate time, while minimizing costs to shareholders.
In assessing mergers, asset sales, or other special transactions, BlackRock’s primary consideration is the long-term economic interests of our clients as
shareholders. Boards proposing a transaction need to clearly explain the economic and strategic rationale behind it. We will review a proposed transaction to determine the degree to which it can enhance long-term shareholder value. We would prefer
that proposed transactions have the unanimous support of the board and have been negotiated at arm’s length. We may seek reassurance from the board that executives’ and/or board members’ financial interests in a given transaction have
not adversely affected their ability to place shareholders’ interests before their own. Where the transaction involves related parties, the recommendation to support should come from the independent directors, a best practice in most markets,
and ideally, the terms should have
|
|
|
| BlackRock Investment Stewardship |
|
Global Principles | 10 |
been assessed through an independent appraisal process. In addition, it is good practice that it be approved by a separate vote of the non-conflicted
parties.
As a matter of sound governance practice, shareholders should have a right to dispose of company shares in the open market without unnecessary
restriction. In our view, corporate mechanisms designed to limit shareholders’ ability to sell their shares are contrary to basic property rights. Such mechanisms can serve to protect and entrench interests other than those of the shareholders.
In our experience, shareholders are broadly capable of making decisions in their own best interests. We encourage any so-called “shareholder rights plans” proposed by a board to be subject to
shareholder approval upon introduction and periodically thereafter.
Compensation and benefits
In most markets, one of the most important roles for a company’s board of directors is to put in place a compensation structure that incentivizes and rewards
executives appropriately. There should be a clear link between variable pay and operational and financial performance. Performance metrics should be stretching and aligned with a company’s strategy and business model. BIS does not have a
position on the use of sustainability-related criteria, but in our view, where companies choose to include them, they should be as rigorous as other financial or operational targets. Long-term incentive plans should vest over timeframes aligned with
the delivery of long-term shareholder value. Compensation committees should guard against contractual arrangements that would entitle executives to material compensation for early termination of their employment. Finally, pension contributions and
other deferred compensation arrangements should be reasonable in light of market practice.
We are not supportive of
one-off or special bonuses unrelated to company or individual performance. Where discretion has been used by the compensation committee or its equivalent, we expect disclosure relating to how and why the
discretion was used, and how the adjusted outcome is aligned with the interests of shareholders. We acknowledge that the use of peer group evaluation by compensation committees can help ensure competitive pay; however, we are concerned when the
rationale for increases in total compensation at a company is solely based on peer benchmarking rather than a rigorous measure of outperformance. We encourage companies to clearly explain how compensation outcomes have rewarded outperformance
against peer firms.
We believe consideration should be given to building claw back provisions into incentive plans such that executives would be required to
forgo rewards when they are not justified by actual performance and/or when compensation was based on faulty financial reporting or deceptive business practices. We also favor recoupment from any senior executive whose behavior caused material
financial harm to shareholders, material reputational risk to the company, or resulted in a criminal investigation, even if such actions did not ultimately result in a material restatement of past results.
Non-executive directors should be compensated in a manner that is commensurate with the time and effort expended in fulfilling
their professional responsibilities. Additionally, these compensation arrangements should not risk compromising directors’ independence or aligning their interests too closely with those of the management, whom they are charged with overseeing.
We use third party research, in addition to our own analysis, to evaluate existing and proposed compensation structures. We may vote against members of the
compensation committee or equivalent board members for poor compensation practices or structures.
|
|
|
| BlackRock Investment Stewardship |
|
Global Principles | 11 |
Material sustainability-related risks and opportunities
It is our view that well-managed companies will effectively evaluate and manage material sustainability-related risks and opportunities relevant to their businesses.
Appropriate oversight of sustainability considerations is a core component of having an effective governance framework, which supports durable, long-term value creation.
Robust disclosure is essential for investors to effectively evaluate companies’ strategy and business practices related to material sustainability-related risks
and opportunities. Given the increased understanding of material sustainability-related risks and opportunities and the need for better information to assess them, BlackRock advocates for continued improvement in companies’ reporting, where
necessary, and will express any concerns through our voting where a company’s actions or disclosures are inadequate.
BlackRock encourages companies to use
the framework developed by the Task Force on Climate-related Financial Disclosures (TCFD) to disclose their approach to ensuring they have a sustainable business model and to supplement that disclosure with industry-specific metrics such as those
identified by the Sustainability Accounting Standards Board (SASB), now part of the International Sustainability Standards Board (ISSB) under the International Financial Reporting Standards (IFRS) Foundation.5 While the TCFD framework was developed to support climate-related risk disclosure, the four pillars of the TCFD – governance, strategy, risk management, and metrics and targets – are a
useful way for companies to disclose how they identify, assess, manage, and oversee a variety of sustainability-related risks and opportunities. SASB’s industry-specific guidance (as identified in its materiality map) is beneficial in helping
companies identify key performance indicators (KPIs) across various dimensions of sustainability that are considered to be financially material and decision-useful within their industry. In particular, we encourage companies to consider reporting on
nature-related factors, given the growing materiality of these issues for many businesses.6 We recognize that some companies may report using different standards, which may be required by
regulation, or one of a number of voluntary standards. In such cases, we ask that companies highlight the metrics that are industry- or company-specific.
Climate
and other sustainability-related disclosures often require companies to collect and aggregate data from various internal and external sources. We recognize that the practical realities of data-collection and reporting may not line up with financial
reporting cycles and companies may require additional time after their fiscal year-end to accurately collect, analyze and report this data to investors. To give investors time to assess the data, we encourage
companies to produce climate and other sustainability-related disclosures sufficiently in advance of their annual meeting.
Companies may also adopt or refer to
guidance on sustainable and responsible business conduct issued by supranational organizations such as the United Nations or the Organization for Economic Cooperation and Development. Further, industry initiatives on managing specific operational
risks may provide useful guidance to companies on best practices and disclosures. Companies should disclose any relevant global climate and other sustainability-related standards adopted, the industry initiatives in which they
5 The International Financial Reporting Standards (IFRS) Foundation announced in November
2021 the formation of an International Sustainability Standards Board (ISSB) to develop a comprehensive global baseline of high-quality sustainability disclosure standards to meet investors’ information needs. SASB standards will over
time be adapted to ISSB standards but are the reference reporting tool in the meantime.
6 While
guidance is still under development for a unified disclosure framework related to natural capital, the emerging recommendations of the Taskforce on Nature-related Financial Disclosures (TNFD), may prove useful to some companies.
|
|
|
| BlackRock Investment Stewardship |
|
Global Principles | 12 |
participate, any peer group benchmarking undertaken, and any assurance processes to help investors understand their
approach to sustainable and responsible business practices.
Climate risk
It is our view that climate change has become a key factor in many companies’ long-term prospects. As such, as long-term investors we are interested in
understanding how companies may be impacted by material climate-related risks and opportunities - just as we seek to understand other business-relevant risks and opportunities - and how these factors are considered within strategy in a manner
consistent with the company’s business model and sector. Specifically, we look for companies to disclose strategies they have in place that mitigate and are resilient to any material risks to their long-term business model associated with a
range of climate-related scenarios, including a scenario in which global warming is limited to well below 2°C, considering global ambitions to achieve a limit of 1.5°C.7 It is, of course,
up to each company to define their own strategy: that is not the role of BlackRock or other investors.
BIS recognizes that climate change can be challenging for
many companies, as they seek to drive long-term value by mitigating risks and capturing opportunities. A growing number of companies, financial institutions, as well as governments, have committed to advancing decarbonization in line with the Paris
Agreement. There is growing consensus that companies can benefit from the more favorable macroeconomic environment under an orderly, timely and equitable global energy transition.8 Yet the path
ahead is deeply uncertain and uneven, with different parts of the economy moving at different speeds.9 Many companies are asking what their role should be in contributing to an orderly and
equitable transition – in ensuring a reliable energy supply and energy security, and in protecting the most vulnerable from energy price shocks and economic dislocation. In this context, we encourage companies to include in their disclosure a
business plan for how they intend to deliver long-term financial performance through a transition to global net zero carbon emissions, consistent with their business model and sector.
We look to companies to disclose short-, medium- and long-term targets, ideally science-based targets where these are available for their sector, for Scope 1 and 2
greenhouse gas emissions (GHG) reductions and to demonstrate how their targets are consistent with the long-term economic interests of their shareholders. Many companies have an opportunity to use and contribute to the development of low carbon
energy sources and technologies that will be essential to decarbonizing the global economy over time. We also recognize that continued investment in traditional energy sources, including oil and gas, is required to maintain an orderly and equitable
transition — and that divestiture of carbon-intensive assets is unlikely to contribute to global emissions reductions. We encourage companies to disclose how their capital allocation to various energy sources is consistent with their strategy.
At this stage, we view Scope 3 emissions differently from Scopes 1 and 2, given methodological complexity, regulatory uncertainty, concerns about
double-counting, and lack of direct control by companies. While we welcome any disclosures and commitments companies choose to make regarding
7 The global aspiration to achieve a net-zero global economy by 2050 is reflective of aggregated efforts; governments representing over 90% of GDP have
committed to move to net-zero over the coming decades. In determining how to vote on behalf of clients who have authorized us to do so, we look to companies only to address issues within their control and do
not anticipate that they will address matters that are the domain of public policy.
8 For
example, BlackRock’s Capital Markets Assumptions anticipate 25 points of cumulative economic gains over a 20-year period in an orderly transition as compared to the alternative. This better macro
environment will support better economic growth, financial stability, job growth, productivity, as well as ecosystem stability and health outcomes.
9 BlackRock, “Managing the net-zero transition”, February 2022.
|
|
|
| BlackRock Investment Stewardship |
|
Global Principles | 13 |
Scope 3 emissions, we recognize these are provided on a good-faith basis as methodology develops. Our
publicly available commentary provides more information on our approach to climate risk.
Key stakeholder interests
In order to advance long-term shareholders’ interests, companies should consider the interests of the various parties on whom they depend for their success over
time. It is for each company to determine their key stakeholders based on what is material to their business and long-term financial performance. Most commonly, key stakeholders include employees, business partners (such as suppliers and
distributors), clients and consumers, regulators, and the communities in which they operate.
Considering the interests of key stakeholders recognizes the
collective nature of long-term value creation and the extent to which each company’s prospects for growth are tied to its ability to foster strong sustainable relationships with and support from those stakeholders. Companies should articulate
how they address adverse impacts that could arise from their business practices and affect critical business relationships with their stakeholders. We encourage companies to implement, to the extent appropriate, monitoring processes (often referred
to as due diligence) to identify and mitigate potential adverse impacts and grievance mechanisms to remediate any actual adverse material impacts. In our view, maintaining trust within these relationships can contribute to a company’s long-term
success.
As a long-term shareholder on behalf of our clients, we find it helpful when companies disclose how they have identified their key stakeholders and
considered their interests in business decision-making. We are also interested to understand the role of the board, which is well positioned to ensure that the approach taken is informed by and aligns with the company’s strategy and purpose.
Other corporate governance matters and shareholder protections
It is our view that shareholders have a right to material and timely information on the financial performance and viability of the companies in which they invest. In
addition, companies should publish information on the governance structures in place and the rights of shareholders to influence these structures. The reporting and disclosure provided by companies help shareholders assess whether their economic
interests have been protected and the quality of the board’s oversight of management. We believe shareholders should have the right to vote on key corporate governance matters, including changes to governance mechanisms, to submit proposals to
the shareholders’ meeting, and to call special meetings of shareholders.
Corporate Form
In our view, it is the responsibility of the board to determine the corporate form that is most appropriate given the company’s purpose and business model.10 Companies proposing to change their corporate form to a public benefit corporation or similar entity should put it to a shareholder vote if not already required to do so under applicable law.
Supporting documentation from companies or shareholder proponents proposing to alter the corporate form should clearly articulate how the interests of shareholders and different stakeholders would be impacted as well as the accountability and voting
mechanisms that would be available to shareholders. As a fiduciary on behalf of clients, we generally
10 Corporate form refers to the legal structure by which a business is organized.
|
|
|
| BlackRock Investment Stewardship |
|
Global Principles | 14 |
support management proposals if our analysis indicates that shareholders’ interests are adequately protected.
Relevant shareholder proposals are evaluated on a case-by-case basis.
Shareholder proposals
In most markets in which BlackRock invests on behalf of clients, shareholders have the right to submit proposals to be voted on by
shareholders at a company’s annual or extraordinary meeting, as long as eligibility and procedural requirements are met. The matters that we see put forward by shareholders address a wide range of topics, including governance reforms, capital
management, and improvements in the management or disclosure of sustainability-related risks.
BlackRock is subject to certain requirements under antitrust law in
the United States that place restrictions and limitations on how BlackRock can interact with the companies in which we invest on behalf of our clients, including our ability to submit shareholder proposals. As noted above, we can vote, on behalf of
clients who authorize us to do so, on proposals put forth by others.
When assessing shareholder proposals, we evaluate each proposal on its merit, with a
singular focus on its implications for long-term value creation. We consider the business and economic relevance of the issue raised, as well as its materiality and the urgency with which we believe it should be addressed. We take into consideration
the legal effect of the proposal, as shareholder proposals may be advisory or legally binding depending on the jurisdiction. We would not support proposals that we believe would result in over-reaching into the basic business decisions of the
company.
Where a proposal is focused on a material governance or sustainability-related risk that we agree needs to be addressed and the intended outcome is
consistent with long-term value creation, we will look to the board and management to demonstrate that the company has met the intent of the request made in the shareholder proposal. Where our analysis and/or engagement indicate an opportunity for
improvement in the company’s approach to the issue, we may support shareholder proposals that are reasonable and not unduly prescriptive or constraining on management. Alternatively, or in addition, we may vote against the re-election of one or more directors if, in our assessment, the board has not responded sufficiently or with an appropriate sense of urgency. While we may not agree with all aspects of a shareholder proponent’s
views or all facets of the proponent’s supporting statement, we may still support proposals that address material governance or sustainability-related risks where we believe it would be helpful for shareholders to have more detailed information
on how those risks are identified, monitored, and managed to support a company’s ability to deliver long-term financial returns. We may also support a proposal if management is on track, but we believe that voting in favor might accelerate
progress.
BlackRock’s oversight of its investment stewardship activities
Oversight
BlackRock maintains three regional advisory committees
(Stewardship Advisory Committees) for a) the Americas; b) Europe, the Middle East and Africa (EMEA); and c) Asia-Pacific, generally consisting of senior BlackRock investment professionals and/or senior employees with practical boardroom experience.
The regional Stewardship Advisory Committees review and advise on amendments to BIS proxy voting guidelines covering markets within each respective region (Guidelines). The advisory committees do not determine voting decisions, which are the
responsibility of BIS.
|
|
|
| BlackRock Investment Stewardship |
|
Global Principles | 15 |
In addition to the regional Stewardship Advisory Committees, the Investment Stewardship Global Oversight Committee
(Global Committee) is a risk-focused committee, comprised of senior representatives from various BlackRock investment teams, a senior legal representative, the Global Head of Investment Stewardship (Global Head), and other senior executives with
relevant experience and team oversight. The Global Oversight Committee does not determine voting decisions, which are the responsibility of BIS.
The
Global Head has primary oversight of the activities of BIS, including voting in accordance with the Guidelines, which require the application of professional judgment and consideration of each company’s unique circumstances. The Global
Committee reviews and approves amendments to these Principles. The Global Committee also reviews and approves amendments to the regional Guidelines, as proposed by the regional Stewardship Advisory Committees.
In addition, the Global Committee receives and reviews periodic reports regarding the votes cast by BIS, as well as updates on material process issues, procedural
changes, and other risk oversight considerations. The Global Committee reviews these reports in an oversight capacity as informed by the BIS corporate governance engagement program and the Guidelines.
BIS carries out engagement with companies, monitors and executes proxy votes, and conducts vote operations (including maintaining records of votes cast) in a manner
consistent with the relevant Guidelines. BIS also conducts research on corporate governance issues and participates in industry discussions to contribute to and keep abreast of important developments in the corporate governance field. BIS may
utilize third parties for certain of the foregoing activities and performs oversight of those third parties. BIS may raise complicated or particularly controversial matters for internal discussion with the relevant investment teams and governance
specialists for discussion and guidance prior to making a voting decision.
Vote execution
BlackRock votes on proxy issues when our clients authorize us to do so. We offer certain clients who prefer their holdings to be voted consistent with specific values
or views Voting Choice.11 When BlackRock votes on behalf of our clients, we carefully consider proxies submitted to funds and other fiduciary account(s) (Fund or Funds) for which we have voting
authority. BlackRock votes (or refrains from voting) proxies for each Fund for which we have voting authority based on our evaluation of the best long-term economic interests of our clients as shareholders, in the exercise of our independent
business judgment, and without regard to the relationship of the issuer of the proxy (or any shareholder proponent or dissident shareholder) to the Fund, the Fund’s affiliates (if any), BlackRock or BlackRock’s affiliates, or BlackRock
employees (see “Conflicts management policies and procedures”, below).
When exercising voting rights, BlackRock will normally vote on specific proxy
issues in accordance with the Guidelines for the relevant market. The Guidelines are reviewed annually and are amended consistent with changes in the local market practice, as developments in corporate governance occur, or as otherwise deemed
advisable by the applicable Stewardship Advisory Committees. BIS analysts may, in the exercise of their professional judgment, conclude that the Guidelines do not cover the specific matter upon which a proxy vote is required or that an exception to
the Guidelines would be in the best long-term economic interests of BlackRock’s clients.
11 To learn more visit
https://www.blackrock.com/corporate/about-us/investment-stewardship/blackrock-voting-choice
|
|
|
| BlackRock Investment Stewardship |
|
Global Principles | 16 |
In the uncommon circumstance of there being a vote with respect to fixed income securities or the securities of privately
held issuers, the decision generally will be made by a Fund’s portfolio managers and/or BIS based on their assessment of the particular transactions or other matters at issue.
In certain markets, proxy voting involves logistical issues which can affect BlackRock’s ability to vote such proxies, as well as the desirability of voting such
proxies. These issues include, but are not limited to: i) untimely notice of shareholder meetings; ii) restrictions on a foreigner’s ability to exercise votes; iii) requirements to vote proxies in person; iv) “share-blocking”
(requirements that investors who exercise their voting rights surrender the right to dispose of their holdings for some specified period in proximity to the shareholder meeting); v) potential difficulties in translating the proxy; vi) regulatory
constraints; and vii) requirements to provide local agents with unrestricted powers of attorney to facilitate voting instructions. We are not supportive of impediments to the exercise of voting rights such as share-blocking or overly burdensome
administrative requirements.
As a consequence, BlackRock votes proxies in these situations on a “best-efforts” basis. In addition, BIS may determine
that it is generally in the best interests of BlackRock’s clients not to vote proxies (or not to vote our full allocation) if the costs (including but not limited to opportunity costs associated with share-blocking constraints) associated with
exercising a vote are expected to outweigh the benefit the client would derive by voting on the proposal.
Portfolio managers have full discretion to vote the
shares in the Funds they manage based on their analysis of the economic impact of a particular ballot item on their investors. Portfolio managers may, from time to time, reach differing views on how best to maximize economic value with respect to a
particular investment. Therefore, portfolio managers may, and sometimes do, vote shares in the Funds under their management differently from BIS or from one another. However, because BlackRock’s clients are mostly long-term investors with
long-term economic goals, ballots are frequently cast in a uniform manner.
Conflicts management policies and
procedures
BIS maintains policies and procedures that seek to prevent undue influence on BlackRock’s proxy voting activity. Such influence might stem from
any relationship between the investee company (or any shareholder proponent or dissident shareholder) and BlackRock, BlackRock’s affiliates, a Fund or a Fund’s affiliates, or BlackRock employees. The following are examples of sources of
perceived or potential conflicts of interest:
| ● |
|
BlackRock clients who may be issuers of securities or proponents of shareholder resolutions |
| ● |
|
BlackRock business partners or third parties who may be issuers of securities or proponents of shareholder resolutions
|
| ● |
|
BlackRock employees who may sit on the boards of public companies held in Funds managed by BlackRock |
| ● |
|
Significant BlackRock, Inc. investors who may be issuers of securities held in Funds managed by BlackRock
|
| ● |
|
Securities of BlackRock, Inc. or BlackRock investment funds held in Funds managed by BlackRock |
| ● |
|
BlackRock, Inc. board members who serve as senior executives or directors of public companies held in Funds managed by
BlackRock |
|
|
|
| BlackRock Investment Stewardship |
|
Global Principles | 17 |
BlackRock has taken certain steps to mitigate perceived or potential conflicts including, but not limited to, the
following:
| ● |
|
Adopted the Guidelines which are designed to advance our clients’ interests in the companies in which BlackRock
invests on their behalf |
| ● |
|
Established a reporting structure that separates BIS from employees with sales, vendor management, or business partnership
roles. In addition, BlackRock seeks to ensure that all engagements with corporate issuers, dissident shareholders or shareholder proponents are managed consistently and without regard to BlackRock’s relationship with such parties. Clients or
business partners are not given special treatment or differentiated access to BIS. BIS prioritizes engagements based on factors including, but not limited to, our need for additional information to make a voting decision or our view on the
likelihood that an engagement could lead to positive outcome(s) over time for the economic value of the company. Within the normal course of business, BIS may engage directly with BlackRock clients, business partners and/or third parties, and/or
with employees with sales, vendor management, or business partnership roles, in discussions regarding our approach to stewardship, general corporate governance matters, client reporting needs, and/or to otherwise ensure that proxy-related client
service levels are met |
| ● |
|
Determined to engage, in certain instances, an independent third party voting service provider to make proxy voting
recommendations as a further safeguard to avoid potential conflicts of interest, to satisfy regulatory compliance requirements, or as may be otherwise required by applicable law. In such circumstances, the voting service provider provides BlackRock
with recommendations, in accordance with the Guidelines, as to how to vote such proxies. BlackRock uses an independent voting service provider to make proxy voting recommendations for shares of BlackRock, Inc. and companies affiliated with
BlackRock, Inc. BlackRock may also use an independent voting service provider to make proxy voting recommendations for: |
| |
o |
public companies that include BlackRock employees on their boards of directors |
| |
o |
public companies of which a BlackRock, Inc. board member serves as a senior executive or a member of the board of
directors |
| |
o |
public companies that are the subject of certain transactions involving BlackRock Funds |
| |
o |
public companies that are joint venture partners with BlackRock, and |
| |
o |
public companies when legal or regulatory requirements compel BlackRock to use an independent voting service provider
|
In selecting a voting service provider, we assess several characteristics, including but not limited to: independence, an ability to analyze
proxy issues and make recommendations in the best economic interest of our clients in accordance with the Guidelines, reputation for reliability and integrity, and operational capacity to accurately deliver the assigned recommendations in a timely
manner. We may engage more than one voting service provider, in part to mitigate potential or perceived conflicts of interest at a single voting service provider. The Global Committee appoints and reviews the performance of the voting service
providers, generally on an annual basis.
|
|
|
| BlackRock Investment Stewardship |
|
Global Principles | 18 |
Securities lending
When so authorized, BlackRock acts as a securities lending agent on behalf of Funds. Securities lending is a well-regulated practice that contributes to capital market
efficiency. It also enables funds to generate additional returns for a fund, while allowing fund providers to keep fund expenses lower.
With regard to the
relationship between securities lending and proxy voting, BlackRock’s approach is informed by our fiduciary responsibility to act in our clients’ best interests. In most cases, BlackRock anticipates that the potential long-term value to
the Fund of voting shares would be less than the potential revenue the loan may provide the Fund. However, in certain instances, BlackRock may determine, in its independent business judgment as a fiduciary, that the value of voting outweighs the
securities lending revenue loss to clients and would therefore recall shares to be voted in those instances.
The decision to recall securities on loan as part of
BlackRock’s securities lending program in order to vote is based on an evaluation of various factors that include, but are not limited to, assessing potential securities lending revenue alongside the potential long-term value to clients of
voting those securities (based on the information available at the time of recall consideration).12 BIS works with colleagues in the Securities Lending and Risk and Quantitative Analysis teams to
evaluate the costs and benefits to clients of recalling shares on loan.
Periodically, BlackRock reviews our process for determining whether to recall securities
on loan in order to vote and may modify it as necessary.
Voting guidelines
The issue-specific Guidelines published for each region/country in which we vote are intended to summarize BlackRock’s general philosophy and approach to issues
that may commonly arise in the proxy voting context in each market where we invest. The Guidelines are not intended to be exhaustive. BIS applies the Guidelines on a
case-by-case basis, in the context of the individual circumstances of each company and the specific issue under review. As such, the Guidelines do not indicate how BIS
will vote in every instance. Rather, they reflect our view about corporate governance issues generally, and provide insight into how we typically approach issues that commonly arise on corporate ballots.
Reporting and vote transparency
We are
committed to transparency in the stewardship work we do on behalf of clients. We inform clients about our engagement and voting policies and activities through direct communication and through disclosure on our website. Each year we publish
an annual report that provides a global overview of our investment stewardship engagement and voting activities and a voting spotlight that summarizes our voting over a proxy year.13 Additionally,
we make public our market-specific voting guidelines for the benefit of clients and companies with whom we engage. We also publish commentaries to share our perspective on market developments and emerging key themes.
12 Recalling securities on loan can be impacted by the timing of record dates. In the United States,
for example, the record date of a shareholder meeting typically falls before the proxy statements are released. Accordingly, it is not practicable to evaluate a proxy statement, determine that a vote has a material impact on a fund and recall any
shares on loan in advance of the record date for the annual meeting. As a result, managers must weigh independent business judgement as a fiduciary, the benefit to a fund’s shareholders of recalling loaned shares in advance of an estimated
record date without knowing whether there will be a vote on matters which have a material impact on the fund (thereby forgoing potential securities lending revenue for the fund’s shareholders) or leaving shares on loan to potentially earn
revenue for the fund (thereby forgoing the opportunity to vote).
13 The proxy year runs from
July 1 to June 30 of the proceeding calendar year.
|
|
|
| BlackRock Investment Stewardship |
|
Global Principles | 19 |
At a more granular level, we publish quarterly our vote record for each company that held a shareholder meeting during
the period, showing how we voted on each proposal and explaining any votes against management proposals or on shareholder proposals. For shareholder meetings where a vote might be high profile or of significant interest to clients, we may publish a
vote bulletin after the meeting, disclosing and explaining our vote on key proposals. We also publish a quarterly list of all companies with which we engaged and the key topics addressed in the engagement meeting.
In this way, we help inform our clients about the work we do on their behalf in promoting the governance and business models that support durable, long-term value
creation.
|
|
|
| BlackRock Investment Stewardship |
|
Global Principles | 20 |
Want to know more?
blackrock.com/stewardship | contactstewardship@blackrock.com
This document is provided for information and educational purposes only. Investing involves risk, including the loss of principal.
Prepared by BlackRock, Inc.
©2023 BlackRock, Inc. All rights reserved. BLACKROCK is a trademark of BlackRock, Inc., or its
subsidiaries in the United States and elsewhere. All other trademarks are those of their respective owners.

Contents
|
|
|
| BlackRock Investment Stewardship |
|
Proxy voting guidelines for U.S. securities | 2 |
These guidelines should be read in conjunction with the BlackRock Investment Stewardship Global Principles.
Introduction
As stewards of our clients’ investments, BlackRock believes it has a responsibility to engage with management teams and/or board members on material business
issues and, for those clients who have given us authority, to vote proxies in the best long-term economic interests of their assets.
The following issue-specific
proxy voting guidelines (the “Guidelines”) summarize BlackRock Investment Stewardship’s (“BIS”) philosophy and approach to engagement and voting, as well as our view of governance best practices and the roles and
responsibilities of boards and directors for publicly listed U.S. companies. These Guidelines are not intended to limit the analysis of individual issues at specific companies or provide a guide to how BIS will engage and/or vote in every instance.
They are to be applied with discretion, taking into consideration the range of issues and facts specific to the company, as well as individual ballot items at shareholder meetings.
Voting guidelines
These guidelines are divided into eight key themes, which group together the issues that frequently appear on the agenda of shareholder meetings:
| ● |
|
Auditors and audit-related issues |
| ● |
|
Mergers, acquisitions, asset sales, and other special transactions |
| ● |
|
Material sustainability-related risks and opportunities |
| ● |
|
General corporate governance matters |
| ● |
|
Shareholder protections |
Boards and directors
An effective and well-functioning board is critical to the economic success of the company and the protection of shareholders’ interests, including the
establishment of appropriate governance structures that facilitate oversight of management and the company’s strategic initiatives. As part of their responsibilities, board members owe fiduciary duties to shareholders in overseeing the
strategic direction, operations, and risk management of the company. For this reason, BIS sees engagement with and the election of directors as one of our most critical responsibilities.
Disclosure of material issues that affect the company’s long-term strategy and value creation, including, when relevant, material sustainability-related factors,
is essential for shareholders to appropriately understand and assess how effectively the board is identifying, managing, and mitigating risks.
|
|
|
| BlackRock Investment Stewardship |
|
Proxy voting guidelines for U.S. securities | 3 |
Where a company has not adequately demonstrated, through actions and/or disclosures, how material issues are
appropriately identified, managed, and overseen, we will consider voting against the re-election of those directors responsible for the oversight of such issues, as indicated below.
Independence
It is our view that a majority of the directors on the board
should be independent to ensure objectivity in the decision-making of the board and its ability to oversee management. In addition, all members of audit, compensation, and nominating/governance committees should be independent. Our view of
independence may vary from listing standards.
Common impediments to independence may include:
| ● |
|
Employment as a senior executive by the company or a subsidiary within the past five years |
| ● |
|
An equity ownership in the company in excess of 20% |
| ● |
|
Having any other interest, business, or relationship (professional or personal) which could, or could reasonably be
perceived to, materially interfere with the director’s ability to act in the best interests of the company and its shareholders |
We may
vote against directors who we do not consider to be independent, including at controlled companies, when we believe oversight could be enhanced with greater independent director representation. To signal our concerns, we may also vote against the
chair of the nominating/governance committee, or where no chair exists, the nominating/governance committee member with the longest tenure.
Oversight role of
the board
The board should exercise appropriate oversight of management and the business activities of the company. Where we determine that a board has failed
to do so in a way that may impede a company’s long-term value, we may vote against the responsible committees and/or individual directors.
Common
circumstances are illustrated below:
| ● |
|
Where the board has failed to facilitate quality, independent auditing or accounting practices, we may vote against members
of the audit committee |
| ● |
|
Where the company has failed to provide shareholders with adequate disclosure to conclude that appropriate strategic
consideration is given to material risk factors (including, where relevant, sustainability factors), we may vote against members of the responsible committee, or the most relevant director |
| ● |
|
Where it appears that a director has acted (at the company or at other companies) in a manner that compromises their
ability to represent the best long-term economic interests of shareholders, we may vote against that individual |
| ● |
|
Where a director has a multi-year pattern of poor attendance at combined board and applicable committee meetings, or a
director has poor attendance in a single year with no disclosed rationale, we may vote against that individual. Excluding exigent circumstances, BIS generally considers attendance at less than 75% of the combined board and applicable committee
meetings to be poor attendance |
|
|
|
| BlackRock Investment Stewardship |
|
Proxy voting guidelines for U.S. securities | 4 |
| ● |
|
Where a director serves on an excessive number of boards, which may limit their capacity to focus on each board’s
needs, we may vote against that individual. The following identifies the maximum number of boards on which a director may serve, before BIS considers them to be over-committed: |
|
|
|
|
|
|
|
| |
|
Public Company Executive1
|
|
# Outside Public Boards2
|
|
Total # of Public Boards
|
|
|
|
|
| Director A |
|
✓ |
|
1 |
|
2 |
|
|
|
|
| Director B |
|
|
|
3 |
|
4 |
In addition, we recognize that board leadership roles may vary in responsibility and time requirements in different markets
around the world. In particular, where a director maintains a Chair role of a publicly listed company in European markets, we may consider that responsibility as equal to two board commitments, consistent with our EMEA Proxy Voting
Guidelines. We will take the total number of board commitments across our global policies into account for director elections.
Risk oversight
Companies should have an established process for identifying, monitoring, and managing business and material risks. Independent directors should have access to
relevant management information and outside advice, as appropriate, to ensure they can properly oversee risk. We encourage companies to provide transparency around risk management, mitigation, and reporting to the board. We are particularly
interested in understanding how risk oversight processes evolve in response to changes in corporate strategy and/or shifts in the business and related risk environment. Comprehensive disclosures provide investors with a sense of the company’s
long-term risk management practices and, more broadly, the quality of the board’s oversight. In the absence of robust disclosures, we may reasonably conclude that companies are not adequately managing risk.
Board Structure
Classified board of
directors/staggered terms
Directors should be re-elected annually; classification of the board generally limits
shareholders’ rights to regularly evaluate a board’s performance and select directors. While we will typically support proposals requesting board de-classification, we may make exceptions, should the
board articulate an appropriate strategic rationale for a classified board structure. This may include when a company needs consistency and stability during a time of transition, e.g., newly public companies or companies undergoing a strategic
restructuring. A classified board structure may also be justified at non-operating companies, e.g., closed-end funds or business development companies (“BDC”),3 in certain circumstances. However,
1 A public company executive is defined as a Named Executive Officer (NEO) or Executive Chair.
2 In addition to the company under review.
3 A BDC is a special investment vehicle under the Investment Company Act of 1940 that is designed to facilitate
capital formation for small and middle-market companies.
|
|
|
| BlackRock Investment Stewardship |
|
Proxy voting guidelines for U.S. securities | 5 |
in these instances, boards should periodically review the rationale for a classified structure and consider when annual
elections might be more appropriate.
Without a voting mechanism to immediately address concerns about a specific director, we may choose to vote against the
directors up for election at the time (see “Shareholder rights” for additional detail).
Independent leadership
There are two commonly accepted structures for independent leadership to balance the CEO role in the boardroom: 1) an independent Chair; or 2) a Lead Independent
director when the roles of Chair and CEO are combined, or when the Chair is otherwise not independent.
In the absence of a significant governance concern,
we defer to boards to designate the most appropriate leadership structure to ensure adequate balance and independence.4 However, BIS may vote against the most senior
non-executive member of the board when appropriate independence is lacking in designated leadership roles.
In the event
that the board chooses to have a combined Chair/CEO or a non-independent Chair, we support the designation of a Lead Independent director, with the ability to: 1) provide formal input into board meeting
agendas; 2) call meetings of the independent directors; and 3) preside at meetings of independent directors. These roles and responsibilities should be disclosed and easily accessible.
The following table illustrates examples5 of responsibilities under each board leadership model:
|
|
|
|
|
|
|
| |
|
Combined Chair/CEO or CEO +
Non-independent Chair |
|
Separate Independent Chair
|
|
|
|
|
| |
|
Chair/CEO or Non-
independent Chair |
|
Lead Independent Director
|
|
Independent Chair
|
|
|
|
|
|
|
Authority to call full meetings of the board of directors
|
|
Attends full meetings of the board of directors
|
|
Authority to call full meetings of the board of directors
|
|
|
|
|
| Board Meetings |
|
|
|
Authority to call meetings of independent directors
|
|
|
|
|
|
|
|
|
|
|
Briefs CEO on issues arising from executive sessions |
|
|
| |
|
|
|
| Agenda |
|
Primary responsibility for shaping board agendas, consulting with the lead independent director
|
|
Collaborates with chair/CEO to set board agenda and board information
|
|
Primary responsibility for shaping board agendas, in conjunction with CEO
|
4 To this end, we do not view shareholder
proposals asking for the separation of Chair and CEO to be a proxy for other concerns we may have at the company for which a vote against directors would be more appropriate. Rather, support for such a proposal might arise in the case of overarching
and sustained governance concerns such as lack of independence or failure to oversee a material risk over consecutive years.
5 This table is for illustrative purposes only. The roles and responsibilities cited here are not all-encompassing and are noted for reference as to how these
leadership positions may be defined.
|
|
|
| BlackRock Investment Stewardship |
|
Proxy voting guidelines for U.S. securities | 6 |
|
|
|
|
|
|
|
| |
|
Combined Chair/CEO or CEO +
Non-independent Chair |
|
Separate Independent Chair
|
|
|
|
|
| |
|
Chair/CEO or Non-
independent Chair |
|
Lead Independent Director
|
|
Independent Chair
|
| |
|
|
|
| Board Communications |
|
Communicates with all directors on key issues and concerns outside of full board meetings
|
|
Facilitates discussion among independent directors on key issues and concerns outside of full board meetings,
including contributing to the oversight of CEO and management succession planning |
|
Facilitates discussion among independent directors on key issues and concerns outside of full board meetings,
including contributing to the oversight of CEO and management succession planning |
CEO and management succession planning
Companies should have a robust CEO and senior management succession plan in place at the board level that is reviewed and updated on a regular basis. Succession
planning should cover scenarios over both the long-term, consistent with the strategic direction of the company and identified leadership needs over time, as well as the short-term, in the event of an unanticipated executive departure. We encourage
the company to explain their executive succession planning process, including where accountability lies within the boardroom for this task, without prematurely divulging sensitive information commonly associated with this exercise.
During a CEO transition, companies may elect for the departing CEO to maintain a role in the boardroom. We ask for disclosures to understand the timeframe and
responsibilities of this role. In such instances, we typically look for the board to have appropriate independent leadership structures in place. (See chart above.)
Director compensation and equity programs
Compensation for directors
should generally be structured to attract and retain directors, while also aligning their interests with those of shareholders. In our view, director compensation packages that are based on the company’s long-term value creation and include
some form of long-term equity compensation are more likely to meet this goal.
Board composition and effectiveness
Director qualifications and skills
We encourage boards to periodically
review director qualifications and skills to ensure relevant experience and diverse perspectives are represented in the boardroom. To this end, performance reviews and skills assessments should be conducted by the nominating/governance committee or
the Lead Independent Director. This process may include internal board evaluations; however, boards may also find it useful to periodically conduct an assessment with a third party. We encourage boards to disclose their approach to evaluations,
including objectives of the evaluation; if an external party conducts the evaluation; the frequency of the evaluations; and, whether that evaluation occurs on an individual director basis.
Board term limits and director tenure
Where boards find that age limits or
term limits are the most efficient and objective mechanism for ensuring periodic board refreshment, we generally defer to the board’s determination in setting such
|
|
|
| BlackRock Investment Stewardship |
|
Proxy voting guidelines for U.S. securities | 7 |
limits. BIS will also consider the average board tenure to evaluate processes for board renewal. We may oppose boards
that appear to have an insufficient mix of short-, medium-, and long-tenured directors.
Board diversity
As noted above, highly qualified, engaged directors with professional characteristics relevant to a company’s business enhance the ability of the board to add
value and be the voice of shareholders in board discussions. In our view, a strong board provides a competitive advantage to a company, providing valuable oversight and contributing to the most important management decisions that support long-term
financial performance.
It is in this context that we are interested in diversity in the boardroom. We see it as a means to promoting diversity of thought and
avoiding ‘group think’ in the board’s exercise of its responsibilities to advise and oversee management. It allows boards to have deeper discussions and make more resilient decisions. We ask boards to disclose how diversity is
considered in board composition, including professional characteristics, such as a director’s industry experience, specialist areas of expertise and geographic location; as well as demographic characteristics such as gender, race/ethnicity, and
age.
We look to understand a board’s diversity in the context of a company’s domicile, market capitalization, business model, and strategy.
Increasingly, we see leading boards adding members whose experience deepens the board’s understanding of the company’s customers, employees, and communities. Self- identified board demographic diversity can usefully be disclosed in
aggregate, consistent with local law. We believe boards should aspire to meaningful diversity of membership, at least consistent with local regulatory requirements and best practices, while recognizing that building a strong, diverse board can take
time.
This position is based on our view that diversity of perspective and thought—in the boardroom, in the management team and throughout the
company—leads to better long-term economic outcomes for companies. Academic and other research reveals correlations between specific dimensions of diversity and effects on decision-making processes and outcomes.6 In our experience, greater diversity in the boardroom contributes to more robust discussions and more innovative and resilient decisions. Over time, greater diversity in the boardroom can also
promote greater diversity and resilience in the leadership team, and the workforce more broadly. That diversity can enable companies to develop businesses that more closely reflect and resonate with the customers and communities they serve.
In the U.S., we believe that boards should aspire to at least 30% diversity of membership,7 and we encourage
large companies, such as those in the S&P 500, to lead in achieving this standard. In our view, an informative indicator of diversity for such companies is having at least two women and a director who
6 For a discussion on the different impacts of
diversity see: McKinsey, “Diversity Wins: How Inclusion Matters”, May 2022; Harvard Business Review, Diverse Teams Feel Less Comfortable – and That’s Why They Perform Better, September 2016; “Do Diverse
Directors Influence DEI Outcomes”, September 2022
7 We take a case-by-case approach and consider the size of the board in our evaluation of overall composition and diversity. Business model, strategy, location, and company size may also impact our analysis of board
diversity. We acknowledge that these factors may also play into the various elements of diversity that a board may attract. We look for disclosures from companies to help us understand their approach and do not prescribe any particular board
composition.
|
|
|
| BlackRock Investment Stewardship |
|
Proxy voting guidelines for U.S. securities | 8 |
identifies as a member of an underrepresented group.8 We recognize
that it may take time and that companies with smaller market capitalizations and in certain sectors may face more challenges in pursuing diversity. Among these smaller companies, we look for the presence of diversity and take into consideration the
progress that companies are making.
In order to help investors understand overall diversity, we look to boards to disclose:
| |
● |
|
How diversity, including demographic factors and professional characteristics, is considered in board composition, given
the company’s long-term strategy and business model |
| |
● |
|
How directors’ professional characteristics, which may include domain expertise such as finance or technology, and
sector- or market-specific experience, are complementary and link to the company’s long-term strategy |
| |
● |
|
The process by which candidates for board positions are identified, including whether professional firms or other
resources outside of incumbent directors’ networks are engaged to identify and/or assess candidates, and whether a diverse slate of nominees is considered for all available board nominations |
To the extent that, based on our assessment of corporate disclosures, a company has not adequately explained their approach to diversity in their board composition,
we may vote against members of the nominating/governance committee. Our publicly available commentary provides more information on our approach to board diversity.
Board size
We typically defer to the board in setting the appropriate
size and believe that directors are generally in the best position to assess the optimal board size to ensure effectiveness. However, we may vote against the appropriate committees and/or individual directors if, in our view, the board is
ineffective in its oversight, either because it is too small to allow for the necessary range of skills and experience or too large to function efficiently.
Board responsiveness and shareholder rights
Shareholder rights
Where we determine that a board has not acted in the best interests of the company’s shareholders, or takes action to unreasonably limit shareholder rights, we
may vote against the appropriate committees and/or individual directors. Common circumstances are illustrated below:
8 Including, but not limited to, individuals who identify as Black or African American, Hispanic or Latinx, Asian,
Native American or Alaska Native, or Native Hawaiian or Pacific Islander; individuals who identify as LGBTQ+; individuals who identify as underrepresented based on national, Indigenous, religious, or cultural identity; individuals with disabilities;
and veterans.
|
|
|
| BlackRock Investment Stewardship |
|
Proxy voting guidelines for U.S. securities | 9 |
| ● |
|
The Independent Chair or Lead Independent Director and members of the nominating/governance committee, where a board
implements or renews a poison pill without shareholder approval |
| ● |
|
The Independent Chair or Lead Independent Director and members of the nominating/governance committee, where a board
amends the charter/articles/bylaws and where the effect may be to entrench directors or to unreasonably reduce shareholder rights |
| ● |
|
Members of the compensation committee where the company has repriced options without shareholder approval
|
If a board maintains a classified structure, it is possible that the director(s) or committee members with whom we have a particular concern
may not be subject to election in the year that the concern arises. In such situations, we may register our concern by voting against the most relevant director(s) up for election.
Responsiveness to shareholders
A board should be engaged and responsive
to the company’s shareholders, including acknowledging voting outcomes for director elections, compensation, shareholder proposals, and other ballot items. Where we determine that a board has not substantially addressed shareholder concerns
that we deem material to the business, we may vote against the responsible committees and/or individual directors. Common circumstances are illustrated below:
| ● |
|
The Independent Chair or Lead Independent Director, members of the nominating/governance committee, and/or the longest
tenured director(s), where we observe a lack of board responsiveness to shareholders, evidence of board entrenchment, and/or failure to plan for adequate board member succession |
| ● |
|
The chair of the nominating/governance committee, or where no chair exists, the nominating/governance committee member
with the longest tenure, where board member(s) at the most recent election of directors have received against votes from more than 25% of shares voted, and the board has not taken appropriate action to respond to shareholder concerns. This may not
apply in cases where BIS did not support the initial vote against such board member(s) |
| ● |
|
The Independent Chair or Lead Independent Director and/or members of the nominating/governance committee, where a board
fails to consider shareholder proposals that (1) receive substantial support, and (2) in our view, have a material impact on the business, shareholder rights, or the potential for long-term value creation |
Majority vote requirements
Directors should generally be elected by a
majority of the shares voted. We will normally support proposals seeking to introduce bylaws requiring a majority vote standard for director elections. Majority vote standards generally assist in ensuring that directors who are not broadly supported
by shareholders are not elected to serve as their representatives. As a best practice, companies with either a majority vote standard or a plurality vote standard should adopt a resignation policy for directors who do not receive support from at
least a majority of votes cast. Where the company already has a sufficiently robust majority voting process in place, we may not support a shareholder proposal seeking an alternative mechanism.
|
|
|
| BlackRock Investment Stewardship |
|
Proxy voting guidelines for U.S. securities | 10 |
We note that majority voting may not be appropriate in all circumstances, for example, in the context of a contested
election, or for majority-controlled companies or those with concentrated ownership structures.
Cumulative voting
As stated above, a majority vote standard is generally in the best long-term interests of shareholders, as it ensures director accountability through the requirement to
be elected by more than half of the votes cast. As such, we will generally oppose proposals requesting the adoption of cumulative voting, which may disproportionately aggregate votes on certain issues or director candidates.
Auditors and audit-related issues
BIS recognizes the critical importance of financial statements to provide a complete and accurate portrayal of a company’s financial condition. Consistent with our
approach to voting on directors, we seek to hold the audit committee of the board responsible for overseeing the management of the independent auditor and the internal audit function at a company.
We may vote against the audit committee members where the board has failed to facilitate quality, independent auditing. We look to public disclosures for insight into
the scope of the audit committee responsibilities, including an overview of audit committee processes, issues on the audit committee agenda, and key decisions taken by the audit committee. We take particular note of cases involving significant
financial restatements or material weakness disclosures, and we look for timely disclosure and remediation of accounting irregularities.
The integrity of financial
statements depends on the auditor effectively fulfilling its role. To that end, we favor an independent auditor. In addition, to the extent that an auditor fails to reasonably identify and address issues that eventually lead to a significant
financial restatement, or the audit firm has violated standards of practice, we may also vote against ratification.
From time to time, shareholder proposals may be
presented to promote auditor independence or the rotation of audit firms. We may support these proposals when they are consistent with our views as described above.
Capital structure proposals
Equal voting rights
In our view, shareholders should be entitled to voting
rights in proportion to their economic interests. In addition, companies that have implemented dual or multiple class share structures should review these structures on a regular basis, or as company circumstances change. Companies with multiple
share classes should receive shareholder approval of their capital structure on a periodic basis via a management proposal on the company’s proxy. The proposal should give unaffiliated shareholders the opportunity to affirm the current
structure or establish mechanisms to end or phase out controlling structures at the appropriate time, while minimizing costs to shareholders. Where companies are unwilling to voluntarily implement “one share, one vote” within a specified
timeframe, or are unresponsive to shareholder feedback for change over time, we generally support shareholder proposals to recapitalize stock into a single voting class.
|
|
|
| BlackRock Investment Stewardship |
|
Proxy voting guidelines for U.S. securities | 11 |
Blank check preferred stock
We frequently oppose proposals requesting authorization of a class of preferred stock with unspecified voting, conversion, dividend distribution, and other rights
(“blank check” preferred stock) because they may serve as a transfer of authority from shareholders to the board and as a possible entrenchment device. We generally view the board’s discretion to establish voting rights on a
when-issued basis as a potential anti-takeover device, as it affords the board the ability to place a block of stock with an investor sympathetic to management, thereby foiling a takeover bid without a shareholder vote.
Nonetheless, we may support the proposal where the company:
| ● |
|
Appears to have a legitimate financing motive for requesting blank check authority |
| ● |
|
Has committed publicly that blank check preferred shares will not be used for anti-takeover purposes
|
| ● |
|
Has a history of using blank check preferred stock for financings |
| ● |
|
Has blank check preferred stock previously outstanding such that an increase would not necessarily provide further
anti-takeover protection but may provide greater financing flexibility |
Increase in authorized common shares
BIS will evaluate requests to increase authorized shares on a case-by-case basis, in
conjunction with industry-specific norms and potential dilution, as well as a company’s history with respect to the use of its common shares.
Increase or
issuance of preferred stock
We generally support proposals to increase or issue preferred stock in cases where the company specifies the voting, dividend,
conversion, and other rights of such stock and where the terms of the preferred stock appear reasonable.
Stock splits
We generally support stock splits that are not likely to negatively affect the ability to trade shares or the economic value of a share. We generally support reverse
stock splits that are designed to avoid delisting or to facilitate trading in the stock, where the reverse split will not have a negative impact on share value (e.g., one class is reduced while others remain at
pre-split levels). In the event of a proposal for a reverse split that would not proportionately reduce the company’s authorized stock, we apply the same analysis we would use for a proposal to increase
authorized stock.
Mergers, acquisitions, transactions, and other special situations
Mergers, acquisitions, and transactions
In assessing mergers,
acquisitions, or other transactions – including business combinations involving Special Purpose Acquisition Companies (“SPACs”) – BIS’ primary consideration is the long-term economic interests of our clients as shareholders.
Boards should clearly explain the economic and strategic rationale for any proposed transactions or material changes to the business. We will review a proposed transaction to determine the degree to which it has the potential to enhance long-term
|
|
|
| BlackRock Investment Stewardship |
|
Proxy voting guidelines for U.S. securities | 12 |
shareholder value. While mergers, acquisitions, asset sales, business combinations, and other special transaction proposals
vary widely in scope and substance, we closely examine certain salient features in our analyses, such as:
| ● |
|
The degree to which the proposed transaction represents a premium to the company’s trading price. We consider the
share price over multiple time periods prior to the date of the merger announcement. We may consider comparable transaction analyses provided by the parties’ financial advisors and our own valuation assessments. For companies facing insolvency
or bankruptcy, a premium may not apply |
| ● |
|
There should be clear strategic, operational, and/or financial rationale for the combination |
| ● |
|
Unanimous board approval and arm’s-length negotiations are preferred. We
will consider whether the transaction involves a dissenting board or does not appear to be the result of an arm’s-length bidding process. We may also consider whether executive and/or board members’
financial interests appear likely to affect their ability to place shareholders’ interests before their own, as well as measures taken to address conflicts of interest |
| ● |
|
We prefer transaction proposals that include the fairness opinion of a reputable financial advisor assessing the value of
the transaction to shareholders in comparison to recent similar transactions |
Contested director elections and special situations
Contested elections and other special situations9 are assessed on a case-by-case basis. We evaluate a number of factors, which may include: the qualifications and past performance of the dissident and management candidates; the validity of the concerns identified by the
dissident; the viability of both the dissident’s and management’s plans; the ownership stake and holding period of the dissident; the likelihood that the dissident’s strategy will produce the desired change; and whether the dissident
represents the best option for enhancing long-term shareholder value.
We will evaluate the actions that the company has taken to limit shareholders’ ability
to exercise the right to nominate dissident director candidates, including those actions taken absent the immediate threat of a contested situation. BIS may take voting action against directors (up to and including the full board) where those
actions are viewed as egregiously infringing on shareholder rights.
We will consider a variety of possible voting outcomes in contested situations, including the
ability to support a mix of management and dissident nominees.
Poison pill plans
Where a poison pill is put to a shareholder vote by management, our policy is to examine these plans individually. Although we have historically opposed most plans, we
may support plans that include a reasonable “qualifying offer clause.” Such clauses typically require shareholder ratification of the pill and
9
Special situations are broadly defined as events that are non-routine and differ from the normal course of business for a company’s shareholder meeting, involving a solicitation other than by management
with respect to the exercise of voting rights in a manner inconsistent with management’s recommendation. These may include instances where shareholders nominate director candidates, oppose the view of management and/or the board on mergers,
acquisitions, or other transactions, etc.
|
|
|
| BlackRock Investment Stewardship |
|
Proxy voting guidelines for U.S. securities | 13 |
stipulate a sunset provision whereby the pill expires unless it is renewed. These clauses also tend to specify that an all-cash bid for all shares that includes a fairness opinion and evidence of financing does not trigger the pill, but forces either a special meeting at which the offer is put to a shareholder vote or requires the
board to seek the written consent of shareholders, where shareholders could rescind the pill at their discretion. We may also support a pill where it is the only effective method for protecting tax or other economic benefits that may be associated
with limiting the ownership changes of individual shareholders. Lastly, we look for shareholder approval of poison pill plans within one year of adoption of implementation.
Reimbursement of expense for successful shareholder campaigns
We generally
do not support shareholder proposals seeking the reimbursement of proxy contest expenses, even in situations where we support the shareholder campaign. Introducing the possibility of such reimbursement may incentivize disruptive and unnecessary
shareholder campaigns.
Executive compensation
A company’s board of directors should put in place a compensation structure that balances incentivizing, rewarding, and retaining executives appropriately across a
wide range of business outcomes. This structure should be aligned with shareholder interests, particularly the generation of sustainable, long-term value.
The
compensation committee should carefully consider the specific circumstances of the company and the key individuals the board is focused on incentivizing. We encourage companies to ensure that their compensation plans incorporate appropriate and
rigorous performance metrics, consistent with corporate strategy and market practice. Performance-based compensation should include metrics that are relevant to the business and stated strategy and/or risk mitigation efforts. Goals, and the
processes used to set these goals, should be clearly articulated and appropriately rigorous. We use third party research, in addition to our own analysis, to evaluate existing and proposed compensation structures. We hold members of the compensation
committee, or equivalent board members, accountable for poor compensation practices and/or structures.
There should be a clear link between variable pay and
company performance that drives sustained value creation for our clients as shareholders. Where compensation structures provide for a front-loaded10 award, we look for appropriate structures
(including vesting and/or holding periods) that motivate sustained performance for shareholders over a number of years. We generally do not favor programs focused on awards that require performance levels to be met and maintained for a relatively
short time period for payouts to be earned, unless there are extended vesting and/or holding requirements.
Compensation structures should generally drive outcomes
that align the pay of the executives with performance of the company and the value received by shareholders. When evaluating performance, we examine both executive teams’ efforts, as well as outcomes realized by shareholders. Payouts to
executives should reflect both the executive’s contributions to the company’s ongoing success, as well as exogenous factors that impacted shareholder value. Where discretion has been used by the
10 Front-loaded awards are generally those that accelerate the grant of multiple years’ worth of compensation
in a single year.
|
|
|
| BlackRock Investment Stewardship |
|
Proxy voting guidelines for U.S. securities | 14 |
compensation committee, we look for disclosures relating to how and why the discretion was used and how the adjusted
outcome is aligned with the interests of shareholders. While we believe special awards11 should be used sparingly, we acknowledge that there may be instances when such awards are appropriate. When
evaluating these awards, we consider a variety of factors, including the magnitude and structure of the award, the scope of award recipients, the alignment of the grant with shareholder value, and the company’s historical use of such awards, in
addition to other company-specific circumstances.
We acknowledge that the use of peer group evaluation by compensation committees can help calibrate competitive
pay; however, we are concerned when the rationale for increases in total compensation is solely based on peer benchmarking.
We support incentive plans that foster
the sustainable achievement of results – both financial and non-financial – consistent with the company’s strategic initiatives. Compensation committees should guard against contractual
arrangements that would entitle executives to material compensation for early termination of their contract. Finally, pension contributions and other deferred compensation arrangements should be reasonable in light of market practices. Our publicly
available commentary provides more information on our approach to executive compensation.
Where executive compensation appears excessive relative to the
performance of the company and/or compensation paid by peers, or where an equity compensation plan is not aligned with shareholders’ interests, we may vote against members of the compensation committee.
“Say on Pay” advisory resolutions
In cases where there is a
“Say on Pay” vote, BIS will respond to the proposal as informed by our evaluation of compensation practices at that particular company and in a manner that appropriately addresses the specific question posed to shareholders. Where we
conclude that a company has failed to align pay with performance, we will vote against the management compensation proposal and relevant compensation committee members.
Frequency of “Say on Pay” advisory resolutions
BIS will
generally support annual advisory votes on executive compensation. It is our view that shareholders should have the opportunity to express feedback on annual incentive programs and changes to long-term compensation before multiple cycles are issued.
Where a company has failed to implement a “Say on Pay” advisory vote within the frequency period that received the most support from shareholders or a “Say on Pay” resolution is omitted without explanation, BIS may vote against
members of the compensation committee.
Clawback proposals
We
generally favor prompt recoupment from any senior executive whose compensation was based on faulty financial reporting or deceptive business practices. We also favor prompt recoupment from any senior executive whose behavior caused material
financial harm to shareholders, material reputational risk to the company, or resulted in a criminal proceeding, even if such actions did not ultimately result in a
11 “Special awards” refers to awards granted outside the company’s typical compensation program.
|
|
|
| BlackRock Investment Stewardship |
|
Proxy voting guidelines for U.S. securities | 15 |
material restatement of past results. This includes, but is not limited to, settlement agreements arising from such
behavior and paid for directly by the company. We typically support shareholder proposals on these matters unless the company already has a robust clawback policy that sufficiently addresses our concerns.
Employee stock purchase plans
Employee stock purchase plans
(“ESPP”) are an important part of a company’s overall human capital management strategy and can provide performance incentives to help align employees’ interests with those of shareholders. The most common form of ESPP qualifies
for favorable tax treatment under Section 423 of the Internal Revenue Code. We will typically support qualified ESPP proposals.
Equity compensation plans
BIS supports equity plans that align the economic interests of directors, managers, and other employees with those of shareholders. Boards should establish
policies prohibiting the use of equity awards in a manner that could disrupt the intended alignment with shareholder interests, such as the excessive pledging or hedging of stock. We may support shareholder proposals requesting the establishment of
such policies.
Our evaluation of equity compensation plans is based on a company’s executive pay and performance relative to peers and whether the plan plays
a significant role in a pay-for-performance disconnect. We generally oppose plans that contain “evergreen” provisions, which allow for automatic annual
increases of shares available for grant without requiring further shareholder approval; we note that the aggregate impacts of such increases are difficult to predict and may lead to significant dilution. We also generally oppose plans that allow for
repricing without shareholder approval. We may oppose plans that provide for the acceleration of vesting of equity awards even in situations where an actual change of control may not occur. We encourage companies to structure their change of control
provisions to require the termination of the covered employee before acceleration or special payments are triggered (commonly referred to as “double trigger” change of control provisions).
Golden parachutes
We generally view golden parachutes as encouragement to
management to consider transactions that might be beneficial to shareholders. However, a large potential payout under a golden parachute arrangement also presents the risk of motivating a management team to support a
sub-optimal sale price for a company.
When determining whether to support or oppose an advisory vote on a golden parachute
plan, BIS may consider several factors, including:
| ● |
|
Whether we determine that the triggering event is in the best interests of shareholders |
| ● |
|
Whether management attempted to maximize shareholder value in the triggering event |
| ● |
|
The percentage of total premium or transaction value that will be transferred to the management team, rather than
shareholders, as a result of the golden parachute payment |
| ● |
|
Whether excessively large excise tax gross-up payments are part of the pay-out |
| ● |
|
Whether the pay package that serves as the basis for calculating the golden parachute payment was reasonable in light of
performance and peers |
|
|
|
| BlackRock Investment Stewardship |
|
Proxy voting guidelines for U.S. securities | 16 |
| ● |
|
Whether the golden parachute payment will have the effect of rewarding a management team that has failed to effectively
manage the company |
It may be difficult to anticipate the results of a plan until after it has been triggered; as a result, BIS may vote against a
golden parachute proposal even if the golden parachute plan under review was approved by shareholders when it was implemented.
We may support shareholder proposals
requesting that implementation of such arrangements require shareholder approval.
Option exchanges
There may be legitimate instances where underwater options create an overhang on a company’s capital structure and a repricing or option exchange may be warranted.
We will evaluate these instances on a case-by-case basis. BIS may support a request to reprice or exchange underwater options under the following circumstances:
| ● |
|
The company has experienced significant stock price decline as a result of macroeconomic trends, not individual company
performance |
| ● |
|
Directors and executive officers are excluded; the exchange is value neutral or value creative to shareholders; tax,
accounting, and other technical considerations have been fully contemplated |
| ● |
|
There is clear evidence that absent repricing, employee incentives, retention, and/or recruiting may be impacted
|
BIS may also support a request to exchange underwater options in other circumstances, if we determine that the exchange is in the best interests
of shareholders.
Supplemental executive retirement plans
BIS may
support shareholder proposals requesting to put extraordinary benefits contained in supplemental executive retirement plans (“SERP”) to a shareholder vote unless the company’s executive pension plans do not contain excessive benefits
beyond what is offered under employee-wide plans.
Material sustainability-related risks and opportunities
It is our view that well-run companies, where appropriate, effectively evaluate and manage material
sustainability-related risks and opportunities12 as a core component of their long-term value creation for shareholder and business strategy. At the board level, appropriate governance structures
and
12 By material sustainability-related risks and opportunities, we mean the drivers of risk and long-term financial
value creation in a company’s business model that have an environmental or social dependency or impact. Examples of environmental issues include, but are not limited to, water use, land use, waste management, and climate risk. Examples of
social issues include, but are not limited to, human capital management, impacts on the communities in which a company operates, customer loyalty, and relationships with regulators. It is our view that
well-run companies will effectively evaluate and manage material sustainability-related risks and opportunities relevant to their businesses. Governance is the core means by which boards can oversee the
creation of durable, long-term financial value. Appropriate risk oversight of business-relevant and material sustainability-related considerations is a component of a sound governance framework.
|
|
|
| BlackRock Investment Stewardship |
|
Proxy voting guidelines for U.S. securities | 17 |
responsibilities allow for effective oversight of the strategic implementation of material sustainability issues.
When assessing how to vote – including on the election of directors and relevant shareholder proposals – robust disclosures are essential for investors to
understand, where appropriate, how companies are integrating material sustainability risks and opportunities across their business and strategic, long-term planning. Where a company has failed to appropriately provide robust disclosures and evidence
of effective business practices, BIS may express concerns through our engagement and voting. As part of this consideration, we encourage companies to produce sustainability-related disclosures sufficiently in advance of their annual meeting so that
the disclosures can be considered in relevant vote decisions.
We encourage disclosures aligned with the reporting framework developed by the Task Force on
Climate-related Financial Disclosures (TCFD), supported by industry-specific metrics, such as those identified by the Sustainability Accounting Standards Board (SASB), now part of the International Sustainability Standards Board (ISSB) under the
International Financial Reporting Standards (IFRS) Foundation.13 While the TCFD framework was developed to support climate-related risk disclosures, the four pillars of the TCFD – governance,
strategy, risk management, and metrics and targets – are a useful way for companies to disclose how they identify, assess, manage, and oversee a variety of sustainability-related risks and opportunities. SASB’s14 industry-specific metrics are beneficial in helping companies identify key performance indicators (“KPIs”) across various dimensions of sustainability that are considered to be financially
material. We recognize that some companies may report using different standards, which may be required by regulation, or one of a number of private standards. In such cases, we ask that companies highlight the metrics that are industry- or
company-specific.
We look to companies to:
| |
● |
|
Disclose the identification, assessment, management, and oversight of material sustainability-related risks and
opportunities in accordance with the four pillars of TCFD |
| |
● |
|
Publish material, investor-relevant, industry-specific metrics and rigorous targets, aligned with SASB (ISSB) or
comparable sustainability reporting standards |
Companies should also disclose any material supranational standards adopted, the industry
initiatives in which they participate, any peer group benchmarking undertaken, and any assurance processes to help investors understand their approach to sustainable and responsible business conduct.
13 The International Financial Reporting Standards (IFRS) Foundation announced in November 2021 the formation
of an International Sustainability Standards Board (ISSB) to develop a comprehensive global baseline of high-quality sustainability disclosure standards to meet investors’ information needs. SASB standards will over time be adapted to
ISSB standards but are the reference reporting tool in the meantime.
14 The ISSB has committed to build
upon the SASB standards, which identify material, sustainability-related disclosures across sectors. SASB Standards can be used to provide a baseline of investor-focused sustainability disclosure and to implement the principles-based framework
recommended by the TCFD, which is also incorporated into the ISSB’s Climate Exposure Draft. Similarly, SASB Standards enable robust implementation of the Integrated Reporting Framework, providing the comparability sought by investors.
|
|
|
| BlackRock Investment Stewardship |
|
Proxy voting guidelines for U.S. securities | 18 |
Climate risk
It is our view
that climate change has become a key factor in many companies’ long-term prospects. As such, as long-term investors, we are interested in understanding how companies may be impacted by material climate-related risks and opportunities—just
as we seek to understand other business-relevant risks and opportunities—and how these factors are considered within their strategy in a manner that is consistent with the company’s business model and sector. Specifically, we look for
companies to disclose strategies that they have in place that mitigate and are resilient to any material risks to their long-term business model associated with a range of climate-related scenarios, including a scenario in which global warming is
limited to well below 2°C, and considering global ambitions to achieve a limit of 1.5°C.15 It is, of course, up to each company to define their own strategy: that is not the role of
BlackRock or other investors.
BIS recognizes that climate change can be challenging for many companies, as they seek to drive long-term value by mitigating risks
and capturing opportunities. A growing number of companies, financial institutions, as well as governments, have committed to advancing decarbonization in line with the Paris Agreement. There is growing consensus that companies can benefit from the
more favorable macroeconomic environment under an orderly, timely, and equitable global energy transition.16 Yet, the path ahead is deeply uncertain and uneven, with different parts of the economy
moving at different speeds.17 Many companies are asking what their role should be in contributing to an orderly and equitable transition—in ensuring a reliable energy supply and energy
security and in protecting the most vulnerable from energy price shocks and economic dislocation. In this context, we encourage companies to include in their disclosures a business plan for how they intend to deliver long-term financial performance
through a transition to global net zero carbon emissions, consistent with their business model and sector.
We look to companies to disclose short-, medium-, and
long-term targets, ideally science-based targets where these are available for their sector, for Scope 1 and 2 greenhouse gas emissions (GHG) reductions and to demonstrate how their targets are consistent with the long-term economic interests of
their shareholders. Many companies have an opportunity to use and contribute to the development of low carbon energy sources and technologies that will be essential to decarbonizing the global economy over time. We also recognize that continued
investment in traditional energy sources, including oil and gas, is required to maintain an orderly and equitable transition—and that divestiture of carbon-intensive assets is unlikely to contribute to global emissions reductions. We encourage
companies to disclose how their capital allocation to various energy sources is consistent with their strategy.
At this stage, we view Scope 3 emissions
differently from Scopes 1 and 2, given methodological complexity, regulatory uncertainty, concerns about double-counting, and lack of direct control by companies. While we welcome any disclosures and commitments companies choose to make regarding
15 The global aspiration to achieve a net-zero global economy by 2050 is
reflective of aggregated efforts; governments representing over 90% of GDP have committed to move to net-zero over the coming decades. In determining how to vote on behalf of clients who have authorized
us to do so, we look to companies only to address issues within their control and do not anticipate that they will address matters that are the domain of public policy.
16 For example, BlackRock’s Capital Markets Assumptions anticipate 25 points of cumulative economic gains
over a 20-year period in an orderly transition as compared to the alternative. This better macro environment will support better economic growth, financial stability, job growth, productivity, as well as
ecosystem stability and health outcomes.
17
https://www.blackrock.com/corporate/literature/whitepaper/bii-managing-the-net-zero-transition-february-2022.pdf
|
|
|
| BlackRock Investment Stewardship |
|
Proxy voting guidelines for U.S. securities | 19 |
Scope 3 emissions, we recognize that these are provided on a good-faith basis as methodology develops. Our publicly
available commentary provides more information on our approach to climate risk and the global energy transition.
Natural capital
The management of nature-related factors is increasingly a core component of some companies’ ability to generate sustainable, long-term financial returns for
shareholders, particularly where a company’s strategy is heavily reliant on the availability of natural capital, or whose supply chains are exposed to locations with nature-related risks. We look for such companies to disclose18 how they consider their reliance on and use of natural capital, including appropriate risk oversight and relevant metrics and targets, to understand how these factors are integrated into strategy.
We will evaluate these disclosures to inform our view of how a company is managing material nature-related risks and opportunities, as well as in our assessment of relevant shareholder proposals. Our publicly available commentary provides
more information on our approach to natural capital.
Key stakeholder interests
In order to deliver long-term value for shareholders, companies should also consider the interests of their key stakeholders. While stakeholder groups may vary across
industries, they are likely to include employees; business partners (such as suppliers and distributors); clients and consumers; government and regulators; and the constituents of the communities in which a company operates. Companies that build
strong relationships with their key stakeholders are more likely to meet their own strategic objectives, while poor relationships may create adverse impacts that expose a company to legal, regulatory, operational, and reputational risks.
Companies should effectively oversee and mitigate material risks related to stakeholders with appropriate due diligence processes and board oversight. Where we
determine that company is not appropriately considering their key stakeholder interests in a way that poses material financial risk to the company and its shareholders, we may vote against relevant directors or support shareholder proposals related
to these topics. Our publicly available commentary provides more information on our approach.
Conversely, we note that some shareholder proposals seek to
address topics that are clearly within the purview of certain stakeholders. For example, we recognize that topics around taxation and tax reporting are within the domain of local, state, and federal authorities. BIS will generally not support these
proposals.
Human capital management
A company’s approach to
human capital management (“HCM”) is a critical factor in fostering an inclusive, diverse, and engaged workforce, which contributes to business continuity, innovation, and long-term value creation. Consequently, we ask companies to
demonstrate a robust approach to HCM and provide
18 While guidance is still under development for a unified disclosure framework related to natural capital, the
emerging recommendations of the Taskforce on Nature-related Financial Disclosures (TNFD), may prove useful to some companies.
|
|
|
| BlackRock Investment Stewardship |
|
Proxy voting guidelines for U.S. securities | 20 |
shareholders with disclosures to understand how their approach aligns with their stated strategy and business model.
Clear and consistent disclosures on these matters are critical for investors to make an informed assessment of a company’s HCM practices. Companies should disclose
the steps they are taking to advance diversity, equity, and inclusion; job categories and workforce demographics; and their responses to the U.S. Equal Employment Opportunity Commission’s EEO-1 Survey.
Where we believe a company’s disclosures or practices fall short relative to the market or peers, or we are unable to ascertain the board and management’s effectiveness in overseeing related risks and opportunities, we may vote against
members of the appropriate committee or support relevant shareholder proposals. Our publicly available commentary provides more information on our approach to HCM.
Corporate political activities
Companies may engage in certain political
activities, within legal and regulatory limits, in order to support public policy matters material to the companies’ long-term strategies. These activities can also create risks, including: the potential for allegations of corruption; certain
reputational risks; and risks that arise from the complex legal, regulatory, and compliance considerations associated with corporate political spending and lobbying activity. Companies that engage in political activities should develop and maintain
robust processes to guide these activities and mitigate risks, including board oversight.
We depend on companies to provide accessible and clear disclosures so
that investors can easily understand how their political activities support their long-term strategy, including on stated public policy priorities. When presented with shareholder proposals requesting increased disclosure on corporate political
activities, BIS will evaluate publicly available information to consider how a company’s lobbying and political activities may impact the company. We will also evaluate whether there is general consistency between a company’s stated
positions on policy matters material to their strategy and the material positions taken by significant industry groups of which they are a member. We may decide to support a shareholder proposal requesting additional disclosures if we identify a
material inconsistency or feel that further transparency may clarify how the company’s political activities support its long-term strategy. Our publicly available commentary provides more information on our approach to corporate
political activities.
General corporate governance matters
IPO governance
Boards should disclose how the corporate governance
structures adopted upon a company’s initial public offering (“IPO”) are in shareholders’ best long-term interests. We also ask boards to conduct a regular review of corporate governance and control structures, such that boards
might evolve foundational corporate governance structures as company circumstances change, without undue costs and disruption to shareholders. In our view, a “one vote for one share” structure is preferred for publicly-traded companies. We
also recognize the potential benefits of dual class shares to newly public companies as they establish themselves; however, these structures should have a specific and limited duration. We will generally engage new companies on topics such as
classified boards and supermajority vote provisions to amend bylaws, as we think that such arrangements may not be in the best interests of shareholders over the long-term.
We may apply a one-year grace period for the application of certain director-related guidelines (including, but not limited to,
responsibilities on other public company boards and board composition concerns),
|
|
|
| BlackRock Investment Stewardship |
|
Proxy voting guidelines for U.S. securities | 21 |
during which we ask boards to take steps to bring corporate governance standards in line with our policies.
Further, if a company qualifies as an emerging growth company (an “EGC”) under the Jumpstart Our Business Startups Act of 2012 (the “JOBS Act”), we
will give consideration to the NYSE and NASDAQ governance exemptions granted under the JOBS Act for the duration such a company is categorized as an EGC. An EGC should have an independent audit committee by the first anniversary of its IPO, with our
standard approach to voting on auditors and audit-related issues applicable in full for an EGC on the first anniversary of its IPO.
Corporate form
Proposals to change a corporation’s form, including those to convert to a public benefit corporation (“PBC”) structure, should clearly articulate the
stakeholder groups the company seeks to benefit and provide detail on how the interests of shareholders would be augmented or adversely affected with the change to a PBC. These disclosures should also include the accountability and voting mechanisms
that would be available to shareholders. We generally support management proposals to convert to a PBC if our analysis indicates that shareholders’ interests are adequately protected. Corporate form shareholder proposals are evaluated on a case-by-case basis.
Exclusive forum provisions
BIS generally supports proposals to seek exclusive forum for certain shareholder litigation. In cases where a board unilaterally adopts exclusive forum provisions that
we consider unfavorable to the interests of shareholders, we will vote against the Independent Chair or Lead Independent director and members of the nominating/governance committee.
Reincorporation
We will evaluate the economic and strategic rationale
behind the company’s proposal to reincorporate on a case-by-case basis. In all instances, we will evaluate the changes to shareholder protections under the new
charter/articles/bylaws to assess whether the move increases or decreases shareholder protections. Where we find that shareholder protections are diminished, we may support reincorporation if we determine that the overall benefits outweigh the
diminished rights.
Multi-jurisdictional companies
Where a company is
listed on multiple exchanges or incorporated in a country different from their primary listing, we will seek to apply the most relevant market guideline(s) to our analysis of the company’s governance structure and specific proposals on the
shareholder meeting agenda. In doing so, we typically consider the governance standards of the company’s primary listing, the market standards by which the company governs themselves, and the market context of each specific proposal on the
agenda. If the relevant standards are silent on the issue under consideration, we will use our professional judgment as to what voting outcome would best protect the long-term economic interests of investors. Companies should disclose the rationale
for their selection of primary listing, country of incorporation, and choice of governance structures, particularly where there is conflict between relevant market governance practices.
Adjourn meeting to solicit additional votes
We generally support such
proposals unless the agenda contains items that we judge to be detrimental to shareholders’ best long-term economic interests.
|
|
|
| BlackRock Investment Stewardship |
|
Proxy voting guidelines for U.S. securities | 22 |
Bundled proposals
Shareholders should have the opportunity to review substantial governance changes individually without having to accept bundled proposals. Where several measures are
grouped into one proposal, BIS may reject certain positive changes when linked with proposals that generally contradict or impede the rights and economic interests of shareholders.
Other business
We oppose voting on matters where we are not given the
opportunity to review and understand those measures and carry out an appropriate level of shareholder oversight.
Shareholder protections
Amendment to charter/articles/bylaws
Shareholders should have the right to vote on key corporate governance matters, including changes to governance mechanisms and amendments to the charter/articles/bylaws.
We may vote against certain directors where changes to governing documents are not put to a shareholder vote within a reasonable period of time, particularly if those changes have the potential to impact shareholder rights (see “Director
elections”). In cases where a board’s unilateral adoption of changes to the charter/articles/bylaws promotes cost and operational efficiency benefits for the company and its shareholders, we may support such action if it does not have a
negative effect on shareholder rights or the company’s corporate governance structure.
When voting on a management or shareholder proposal to make changes to
the charter/articles/bylaws, we will consider in part the company’s and/or proponent’s publicly stated rationale for the changes; the company’s governance profile and history; relevant jurisdictional laws; and situational or
contextual circumstances which may have motivated the proposed changes, among other factors. We will typically support amendments to the charter/articles/bylaws where the benefits to shareholders outweigh the costs of failing to make such changes.
Proxy access
It is our view that long-term shareholders should have
the opportunity, when necessary and under reasonable conditions, to nominate directors on the company’s proxy card.19
Securing the right of shareholders to nominate directors without engaging in a control contest can enhance shareholders’ ability to meaningfully participate in the
director election process, encourage board attention to shareholder interests, and provide shareholders an effective means of directing that attention where it is lacking. Proxy access mechanisms should provide shareholders with a reasonable
opportunity to use this right without stipulating overly restrictive or onerous parameters for use, and also
19 BlackRock is subject to certain regulations and laws in the United States that place restrictions and limitations
on how BlackRock can interact with the companies in which we invest on behalf of our clients, including our ability to submit shareholder proposals or elect directors to the board.
|
|
|
| BlackRock Investment Stewardship |
|
Proxy voting guidelines for U.S. securities | 23 |
provide assurances that the mechanism will not be subject to abuse by short-term investors, investors without a substantial
investment in the company, or investors seeking to take control of the board.
In general, we support market-standardized proxy access proposals, which allow
a shareholder (or group of up to 20 shareholders) holding three percent of a company’s outstanding shares for at least three years the right to nominate the greater of up to two directors or 20% of the board. Where a standardized proxy access
provision exists, we will generally oppose shareholder proposals requesting outlier thresholds.
Right to act by written consent
In exceptional circumstances and with sufficiently broad support, shareholders should have the opportunity to raise issues of substantial importance without having to
wait for management to schedule a meeting. Accordingly, shareholders should have the right to solicit votes by written consent provided that: 1) there are reasonable requirements to initiate the consent solicitation process (in order to avoid the
waste of corporate resources in addressing narrowly supported interests); and 2) shareholders receive a minimum of 50% of outstanding shares to effectuate the action by written consent.
We may oppose shareholder proposals requesting the right to act by written consent in cases where the proposal is structured for the benefit of a dominant shareholder
to the exclusion of others, or if the proposal is written to discourage the board from incorporating appropriate mechanisms to avoid the waste of corporate resources when establishing a right to act by written consent. Additionally, we may oppose
shareholder proposals requesting the right to act by written consent if the company already provides a shareholder right to call a special meeting that offers shareholders a reasonable opportunity to raise issues of substantial importance without
having to wait for management to schedule a meeting.
Right to call a special meeting
In exceptional circumstances and with sufficiently broad support, shareholders should have the opportunity to raise issues of substantial importance without having to
wait for management to schedule a meeting. Accordingly, shareholders should have the right to call a special meeting in cases where a reasonably high proportion of shareholders (typically a minimum of 15% but no higher than 25%) are required to
agree to such a meeting before it is called. However, we may oppose this right in cases where the proposal is structured for the benefit of a dominant shareholder, or where a lower threshold may lead to an ineffective use of corporate resources. We
generally think that a right to act via written consent is not a sufficient alternative to the right to call a special meeting.
Consent solicitation
While BlackRock is supportive of the shareholder rights to act by written consent and call a special meeting, BlackRock is subject to certain regulations and laws that
place restrictions and limitations on how BlackRock can interact with the companies in which we invest on behalf of our clients, including our ability to participate in consent solicitations. As a result, BlackRock will generally not participate in
consent solicitations or related processes. However, once an item comes to a shareholder vote, we uphold our fiduciary duty to vote in the best long-term interests of our clients, where we are authorized to do so.
Simple majority voting
We generally favor a simple majority voting
requirement to pass proposals. Therefore, we will generally support the reduction or the elimination of supermajority voting requirements to the extent that we determine shareholders’ ability to protect their economic interests is improved.
Nonetheless, in situations
|
|
|
| BlackRock Investment Stewardship |
|
Proxy voting guidelines for U.S. securities | 24 |
where there is a substantial or dominant shareholder, supermajority voting may be protective of minority shareholder interests, and we may support supermajority voting requirements in those
situations.
Virtual meetings
Shareholders should have the opportunity
to participate in the annual and special meetings for the companies in which they are invested, as these meetings facilitate an opportunity for shareholders to provide feedback and hear from the board and management. While these meetings have
traditionally been conducted in-person, virtual meetings are an increasingly viable way for companies to utilize technology to facilitate shareholder accessibility, inclusiveness, and cost efficiencies.
Shareholders should have a meaningful opportunity to participate in the meeting and interact with the board and management in these virtual settings; companies should facilitate open dialogue and allow shareholders to voice concerns and provide
feedback without undue censorship. Relevant shareholder proposals are assessed on a case-by-case basis.
|
|
|
| BlackRock Investment Stewardship |
|
Proxy voting guidelines for U.S. securities | 25 |
Want to know more?
blackrock.com/stewardship | contactstewardship@blackrock.com
This
document is provided for information and educational purposes only. Investing involves risk, including the loss of principal.
Prepared by BlackRock, Inc.
©2023 BlackRock, Inc. All rights reserved. BLACKROCK is a trademark of BlackRock, Inc., or its subsidiaries in
the United States and elsewhere. All other trademarks are those of their respective owners.

BlackRock MuniYield Qual... (NYSE:MYI)
Gráfica de Acción Histórica
De Abr 2024 a May 2024

BlackRock MuniYield Qual... (NYSE:MYI)
Gráfica de Acción Histórica
De May 2023 a May 2024
