0001295401
false
0001295401
2023-10-26
2023-10-26
iso4217:USD
xbrli:shares
iso4217:USD
xbrli:shares
UNITED STATES
SECURITIES AND EXCHANGE COMMISSION
Washington, D.C. 20549
Form 8-K
Current Report
Pursuant to Section 13 or 15(d) of the Securities
Exchange Act of 1934
Date of Report (Date of earliest event
reported): October 26, 2023
The
Bancorp, Inc.
(Exact name of registrant as specified in its charter)
Commission File Number: 000-51018
| Delaware |
|
23-3016517 |
| (State or other jurisdiction of |
|
(IRS Employer |
| incorporation) |
|
Identification No.) |
409
Silverside Road
Wilmington, DE
19809
(Address of principal executive offices, including
zip code)
302-385-5000
(Registrant’s telephone number, including
area code)
(Former name or former address, if changed since
last report)
Check the appropriate box below if the Form 8-K filing is intended
to simultaneously satisfy the filing obligation of the registrant under any of the following provisions:
[_] Written communications pursuant to Rule 425 under the
Securities Act (17 CFR 230.425)
[_] Soliciting material pursuant to Rule 14a-12 under the Exchange Act (17 CFR 240.14a-12)
[_] Pre-commencement communications pursuant to Rule 14d-2(b) under the Exchange Act (17 CFR 240.14d-2(b))
[_] Pre-commencement communications pursuant to Rule 13e-4(c) under the Exchange Act (17 CFR 240.13e-4(c))
Securities registered pursuant to Section 12(b) of the Act:
| Title of each class |
|
Trading
Symbol(s) |
|
Name of each exchange on which registered |
| Common Stock, par value
$1.00 per share |
|
TBBK |
|
Nasdaq
Global Select |
Indicate by check mark whether the registrant is an emerging growth
company as defined in Rule 405 of the Securities Act of 1933 (§230.405) or Rule 12b-2 of the Securities Exchange Act of 1934 (§240.12b-2).
[_]
Emerging growth company
If an emerging growth company, indicate by check mark if the registrant
has elected not to use the extended transition period for complying with any new or revised financial accounting standards provided pursuant
to Section 13(a) of the Exchange Act. [_]
Item 2.02. Results
of Operations and Financial Condition
On October 26, 2023, The Bancorp, Inc. (the
"Company") issued a press release regarding its earnings for the three and nine months ended September 30, 2023. A
copy of this press release is furnished with this report as Exhibit 99.1.
Item 7.01. Regulation
FD Disclosure.
The Company hereby furnishes the information
set forth in the presentation attached hereto as Exhibit 99.2, which is incorporated herein by reference.
The information in this Current Report,
including the exhibits hereto, are being furnished and shall not be deemed "filed" for purposes of Section 18 of the Securities
Exchange Act of 1934, as amended, or otherwise subject to the liabilities of that section. The information in this Current Report
shall not be incorporated by reference into any registration statement or other document pursuant to the Securities Act of 1933, as
amended.
Item 9.01. Financial Statements and Exhibits
SIGNATURES
Pursuant to the requirements of the Securities Exchange Act of 1934, the
registrant has duly caused this report to be signed on its behalf by the undersigned hereunto duly authorized.
| Date: October 26, 2023 |
The Bancorp, Inc. |
| |
|
|
| |
By: |
/s/ Paul Frenkiel |
| |
Name: |
Paul Frenkiel |
| |
Title: |
Chief Financial Officer and |
| |
|
Secretary |
Exhibit 99.1
The Bancorp, Inc. Reports Third Quarter 2023 Financial
Results
Wilmington, DE – October 26,
2023 – The Bancorp, Inc. ("The Bancorp" or “we”) (NASDAQ: TBBK), a financial holding company, today reported
financial results for the third quarter of 2023.
Highlights
| · | The Bancorp reported net income of $50.1 million, or $0.92 per diluted share, for the quarter ended September 30, 2023, compared
to net income of $30.6 million, or $0.54 per diluted share, for the quarter ended September 30, 2022, or a 70% increase in income
per diluted share. |
| · | Return on assets and equity for the quarter ended September 30, 2023 amounted to 2.7% and 26%, respectively, compared to 1.7% and
18%, respectively, for the quarter ended September 30, 2022 (all percentages “annualized”). |
| · | Net interest income increased 37% to $88.9 million for the quarter ended September 30, 2023, compared to $64.7 million for the quarter
ended September 30, 2022. Net interest income increases reflected the impact of continuing Federal Reserve rate increases on The Bancorp’s
variable rate loans and securities. |
| · | Net interest margin amounted to 5.07% for the quarter ended September 30, 2023, compared to 3.69% for the quarter ended September
30, 2022, and 4.83% for the quarter ended June 30, 2023. |
| · | Loans, net of deferred fees and costs were $5.20 billion at September 30, 2023, compared to $5.49 billion at December 31, 2022
and $5.27 billion at September 30, 2022. Those changes reflected a decrease of 1% quarter over linked quarter and a decrease of 1% year
over year. |
| · | Gross dollar volume (“GDV”), representing the total amounts spent on prepaid and debit cards, increased $4.85 billion,
or 17%, to $32.97 billion for the quarter ended September 30, 2023, compared to the quarter ended September 30, 2022. The increase reflects
continued organic growth with existing partners and the impact of clients added within the past year. Total prepaid, debit card, ACH and
other payment fees increased 12% to $24.1 million for the third quarter of 2023 compared to the third quarter of 2022. |
| · | Small business loans (“SBL”), including those held at fair value, grew 13% year over year to $830.1 million at September
30, 2023, and 3% quarter over linked quarter. That growth excludes Paycheck Protection Program (“PPP”) loan balances which
amounted to $2.3 million and $6.7 million at September 30, 2023 and September 30, 2022, respectively. |
| · | Direct lease financing balances increased 12% year over year to $670.2 million at September 30, 2023, and 2% quarter over linked quarter. |
| · | At September 30, 2023, real estate bridge loans of $1.85 billion had grown 1% compared to the $1.83 billion balance at June 30, 2023,
and 24% compared to the September 30, 2022 balance of $1.49 billion. These real estate bridge loans consist entirely of apartment buildings. |
| · | Security backed lines of credit (“SBLOC”), insurance backed lines of credit (“IBLOC”) and investment advisor
financing loans collectively decreased 24% year over year and decreased 7% quarter over linked quarter to $1.92 billion at September
30, 2023. |
| · | The average interest rate on $6.41 billion of average deposits and interest-bearing liabilities during the third quarter of 2023
was 2.50%. Average deposits of $6.29 billion for the third quarter of 2023 reflected an increase of 3% from the $6.11 billion of
average deposits for the quarter ended September 30, 2022, and a 3% decrease from $6.48 billion of average deposits in the second quarter
of 2023. The decrease reflected the planned exit of $200 million of higher cost funds on July 1, 2023. Not included in deposit totals
are deposits which are sold to other financial institutions totaling $334.7 million at September 30, 2023. |
| · | The Bancorp emphasizes safety and soundness, and liquidity. The vast majority of its funding is comprised of insured and small balance
accounts. The Bancorp also has lines of credit with U.S. government agencies totaling approximately $2.7 billion as of September 30, 2023,
as well as access to other liquidity. |
| · | As of September 30, 2023, tier one capital to assets (leverage), tier one capital to risk-weighted assets, total capital to risk-weighted
assets and common equity-tier 1 to risk-weighted assets ratios were 10.92%, 15.53%, 16.04% and 15.53%, respectively, compared to well-capitalized
minimums of 5%, 8%, 10% and 6.5%, respectively. The Bancorp and its wholly owned subsidiary, The Bancorp Bank, National Association, each
remain well capitalized under banking regulations. |
| · | Book value per common share at September 30, 2023 was $14.36 per share compared to $11.81 per common share
at September 30, 2022, an increase of 22%. |
| · | The Bancorp repurchased 685,478 shares of its common stock at an average cost of $36.47
per share during the quarter ended September 30, 2023. |
CEO and President Damian Kozlowski commented, “The
Bancorp continues to produce record core profitability and exemplar financial performance in a challenging interest rate and macro environment
for most financial institutions. We are initiating 2024 preliminary guidance of $4.25 a share without including the impact of share buybacks.
The 2024 guidance is 18% earnings growth over 2023 guidance. In addition, as a result of our investments in growth and efficiency, the
Bancorp’s increased ROE is driving a continued increase in our regulatory capital ratios. With the reg ii Durbin balance sheet limit
of $10 billion, we are fast approaching the maximum equity capital needed to support our business growth into the future. Therefore, we
are significantly increasing our planned buyback in 2024 by $100 million to $200 million or $50 million a quarter from $25 million a quarter.”
Conference Call Webcast
You may access the LIVE webcast of The Bancorp's Quarterly Earnings Conference
Call at 8:00 AM ET Friday, October 27, 2023 by clicking on the webcast link on The Bancorp's homepage at www.thebancorp.com. Or you may
dial 1.888.259.6580, conference code 63043391. You may listen to the replay of the webcast following the live call on The Bancorp's investor
relations website or telephonically until Friday, November 3, 2023 by dialing 1.877.674.7070, access code 043391#.
About The Bancorp
The Bancorp, Inc. (NASDAQ: TBBK), headquartered in Wilmington, Delaware,
through its subsidiary, The Bancorp Bank, National Association, (or “The Bancorp Bank, N. A.”) provides non-bank financial
companies with the people, processes, and technology to meet their unique banking needs. Through its Fintech Solutions, Institutional
Banking, Commercial Lending, and Real Estate Bridge Lending businesses, The Bancorp provides partner-focused solutions paired with cutting-edge
technology for companies that range from entrepreneurial startups to Fortune 500 companies. With over 20 years of experience, The Bancorp
has become a leader in the financial services industry, earning recognition as the #1 issuer of prepaid cards in the U.S., a nationwide
provider of bridge financing for real estate capital improvement plans, an SBA National Preferred Lender, a leading provider of securities-backed
lines of credit, with one of the few bank-owned commercial vehicle leasing groups. By its company-wide commitment to excellence, The Bancorp
has also been ranked as one of the 100 Fastest-Growing Companies by Fortune, a Top 50 Employer by Equal Opportunity Magazine and was selected
to be included in the S&P Small Cap 600. For more about The Bancorp, visit https://thebancorp.com/.
Forward-Looking Statements
Statements in this earnings release regarding The Bancorp’s business
which are not historical facts are "forward-looking statements." These statements may be identified by the use of forward-looking
terminology, including but not limited to the words “intend,” “may,” “believe,” “will,”
“expect,” “look,” “anticipate,” “plan,” “estimate,” “continue,”
or similar words, and are based on current expectations about important economic, political, and technological factors, among others,
and are subject to risks and uncertainties, which could cause the actual results, events or achievements to differ materially from those
set forth in or implied by the forward-looking statements and related assumptions. For further discussion of the risks and uncertainties
to which these forward-looking statements may be subject, see The Bancorp’s filings with the Securities and Exchange Commission,
including the “Risk Factors” and “Management’s Discussion and Analysis of Financial Condition and Results of Operations”
sections of those filings. The forward-looking statements speak only as of the date of this press release. The Bancorp does not undertake
to publicly revise or update forward-looking statements in this press release to reflect events or circumstances that arise after the
date of this press release, except as may be required under applicable law.
The Bancorp, Inc. Contact
Andres Viroslav
Director, Investor Relations
215-861-7990
andres.viroslav@thebancorp.com
Source: The Bancorp, Inc.
The Bancorp, Inc.
Financial highlights
(unaudited)
| |
|
|
|
|
|
|
|
|
|
|
|
| |
|
Three months ended |
|
Nine months ended |
| |
|
September 30, |
|
September 30, |
| Consolidated condensed income statements |
2023 |
|
2022 |
|
2023 |
|
2022 |
| |
|
(Dollars in thousands, except per share and share data) |
|
|
|
| |
|
|
|
|
|
|
|
|
|
|
|
| Net interest income |
$ |
88,882 |
|
$ |
64,659 |
|
$ |
261,893 |
|
$ |
172,081 |
| Provision for credit losses |
|
1,752 |
|
|
822 |
|
|
4,016 |
|
|
4,331 |
| Non-interest income |
|
|
|
|
|
|
|
|
|
|
|
| ACH, card and other payment processing fees |
|
2,553 |
|
|
2,230 |
|
|
7,153 |
|
|
6,552 |
| Prepaid, debit card and related fees |
|
21,513 |
|
|
19,175 |
|
|
67,013 |
|
|
57,865 |
| Net realized and unrealized gains on commercial loans, at fair value |
|
525 |
|
|
745 |
|
|
4,171 |
|
|
11,262 |
| Leasing related income |
|
1,767 |
|
|
1,048 |
|
|
4,768 |
|
|
3,566 |
| Other non-interest income |
|
422 |
|
|
228 |
|
|
2,000 |
|
|
698 |
| Total non-interest income |
|
26,780 |
|
|
23,426 |
|
|
85,105 |
|
|
79,943 |
| Non-interest expense |
|
|
|
|
|
|
|
|
|
|
|
| Salaries and employee benefits |
|
30,475 |
|
|
28,001 |
|
|
93,427 |
|
|
77,848 |
| Data processing expense |
|
1,404 |
|
|
1,292 |
|
|
4,123 |
|
|
3,727 |
| Legal expense |
|
1,203 |
|
|
907 |
|
|
3,110 |
|
|
3,175 |
| Legal settlement |
|
— |
|
|
— |
|
|
— |
|
|
1,152 |
| Civil money penalty |
|
— |
|
|
1,750 |
|
|
— |
|
|
1,750 |
| FDIC insurance |
|
806 |
|
|
679 |
|
|
2,233 |
|
|
2,326 |
| Software |
|
4,427 |
|
|
4,001 |
|
|
12,981 |
|
|
12,030 |
| Other non-interest expense |
|
9,144 |
|
|
8,200 |
|
|
29,558 |
|
|
24,019 |
| Total non-interest expense |
|
47,459 |
|
|
44,830 |
|
|
145,432 |
|
|
126,027 |
| Income before income taxes |
|
66,451 |
|
|
42,433 |
|
|
197,550 |
|
|
121,666 |
| Income tax expense |
|
16,314 |
|
|
11,829 |
|
|
49,282 |
|
|
31,694 |
| Net income |
|
50,137 |
|
|
30,604 |
|
|
148,268 |
|
|
89,972 |
| |
|
|
|
|
|
|
|
|
|
|
|
| Net income per share - basic |
$ |
0.93 |
|
$ |
0.54 |
|
$ |
2.70 |
|
$ |
1.58 |
| |
|
|
|
|
|
|
|
|
|
|
|
| Net income per share - diluted |
$ |
0.92 |
|
$ |
0.54 |
|
$ |
2.68 |
|
$ |
1.56 |
| Weighted average shares - basic |
|
54,175,184 |
|
|
56,429,425 |
|
|
54,828,547 |
|
|
56,782,524 |
| Weighted average shares - diluted |
|
54,738,610 |
|
|
57,008,224 |
|
|
55,336,354 |
|
|
57,510,986 |
| Condensed consolidated balance sheets |
September 30, |
|
June 30, |
|
December 31, |
|
September 30, |
| |
2023 (unaudited) |
|
2023 (unaudited) |
|
2022 |
|
2022 (unaudited) |
| |
|
(Dollars in thousands, except share data) |
| Assets: |
|
|
|
|
|
|
|
|
|
|
|
| Cash and cash equivalents |
|
|
|
|
|
|
|
|
|
|
|
| Cash and due from banks |
$ |
4,881 |
|
$ |
6,496 |
|
$ |
24,063 |
|
$ |
22,537 |
| Interest earning deposits at Federal Reserve Bank |
|
898,533 |
|
|
874,050 |
|
|
864,126 |
|
|
700,175 |
| Total cash and cash equivalents |
|
903,414 |
|
|
880,546 |
|
|
888,189 |
|
|
722,712 |
| |
|
|
|
|
|
|
|
|
|
|
|
| Investment securities, available-for-sale, at fair value |
|
756,636 |
|
|
776,410 |
|
|
766,016 |
|
|
790,594 |
| Commercial loans, at fair value |
|
379,603 |
|
|
396,581 |
|
|
589,143 |
|
|
818,040 |
| Loans, net of deferred fees and costs |
|
5,198,972 |
|
|
5,267,574 |
|
|
5,486,853 |
|
|
5,267,375 |
| Allowance for credit losses |
|
(24,145) |
|
|
(23,284) |
|
|
(22,374) |
|
|
(19,689) |
| Loans, net |
|
5,174,827 |
|
|
5,244,290 |
|
|
5,464,479 |
|
|
5,247,686 |
| Federal Home Loan Bank, Atlantic Central Bankers Bank, and Federal Reserve Bank stock |
|
20,157 |
|
|
20,157 |
|
|
12,629 |
|
|
12,629 |
| Premises and equipment, net |
|
28,978 |
|
|
26,408 |
|
|
18,401 |
|
|
18,443 |
| Accrued interest receivable |
|
34,159 |
|
|
34,062 |
|
|
32,005 |
|
|
25,506 |
| Intangible assets, net |
|
1,751 |
|
|
1,850 |
|
|
2,049 |
|
|
2,149 |
| Other real estate owned |
|
18,756 |
|
|
20,952 |
|
|
21,210 |
|
|
18,873 |
| Deferred tax asset, net |
|
20,379 |
|
|
19,215 |
|
|
19,703 |
|
|
27,241 |
| Other assets |
|
127,107 |
|
|
122,435 |
|
|
89,176 |
|
|
93,201 |
| Total assets |
$ |
7,465,767 |
|
$ |
7,542,906 |
|
$ |
7,903,000 |
|
$ |
7,777,074 |
| |
|
|
|
|
|
|
|
|
|
|
|
| Liabilities: |
|
|
|
|
|
|
|
|
|
|
|
| Deposits |
|
|
|
|
|
|
|
|
|
|
|
| Demand and interest checking |
$ |
6,455,043 |
|
$ |
6,554,967 |
|
$ |
6,559,617 |
|
$ |
5,934,591 |
| Savings and money market |
|
49,428 |
|
|
68,084 |
|
|
140,496 |
|
|
575,381 |
| Time deposits, $100,000 and over |
|
— |
|
|
— |
|
|
330,000 |
|
|
401,331 |
| Total deposits |
|
6,504,471 |
|
|
6,623,051 |
|
|
7,030,113 |
|
|
6,911,303 |
| |
|
|
|
|
|
|
|
|
|
|
|
| Securities sold under agreements to repurchase |
|
42 |
|
|
42 |
|
|
42 |
|
|
42 |
| Senior debt |
|
95,771 |
|
|
95,682 |
|
|
99,050 |
|
|
98,958 |
| Subordinated debenture |
|
13,401 |
|
|
13,401 |
|
|
13,401 |
|
|
13,401 |
| Other long-term borrowings |
|
9,861 |
|
|
9,917 |
|
|
10,028 |
|
|
38,928 |
| Other liabilities |
|
68,533 |
|
|
51,646 |
|
|
56,335 |
|
|
50,704 |
| Total liabilities |
$ |
6,692,079 |
|
$ |
6,793,739 |
|
$ |
7,208,969 |
|
$ |
7,113,336 |
| |
|
|
|
|
|
|
|
|
|
|
|
| Shareholders' equity: |
|
|
|
|
|
|
|
|
|
|
|
| Common stock - authorized, 75,000,000 shares of $1.00 par value; 53,867,129 and 56,201,560 shares issued and outstanding at September 30, 2023 and 2022, respectively |
|
53,867 |
|
|
54,542 |
|
|
55,690 |
|
|
56,202 |
| Additional paid-in capital |
|
234,320 |
|
|
256,115 |
|
|
299,279 |
|
|
311,569 |
| Retained earnings |
|
517,587 |
|
|
467,450 |
|
|
369,319 |
|
|
329,078 |
| Accumulated other comprehensive loss |
|
(32,086) |
|
|
(28,940) |
|
|
(30,257) |
|
|
(33,111) |
| Total shareholders' equity |
|
773,688 |
|
|
749,167 |
|
|
694,031 |
|
|
663,738 |
| |
|
|
|
|
|
|
|
|
|
|
|
| Total liabilities and shareholders' equity |
$ |
7,465,767 |
|
$ |
7,542,906 |
|
$ |
7,903,000 |
|
$ |
7,777,074 |
| Average balance sheet and net interest income |
Three months ended September 30, 2023 |
|
Three months ended September 30, 2022 |
| |
(Dollars in thousands; unaudited) |
| |
Average |
|
|
|
Average |
|
Average |
|
|
|
Average |
| Assets: |
Balance |
|
Interest(1) |
|
Rate |
|
Balance |
|
Interest(1) |
|
Rate |
| |
|
|
|
|
|
|
|
|
|
|
|
|
|
|
|
|
| Interest earning assets: |
|
|
|
|
|
|
|
|
|
|
|
|
|
|
|
|
| Loans, net of deferred fees and costs(2) |
$ |
5,603,514 |
|
$ |
110,506 |
|
|
7.89% |
|
$ |
5,904,996 |
|
$ |
75,536 |
|
5.12% |
| Leases-bank qualified(3) |
|
4,585 |
|
|
110 |
|
|
9.60% |
|
|
3,299 |
|
|
55 |
|
6.67% |
| Investment securities-taxable |
|
768,364 |
|
|
9,647 |
|
|
5.02% |
|
|
824,178 |
|
|
6,792 |
|
3.30% |
| Investment securities-nontaxable(3) |
|
3,005 |
|
|
50 |
|
|
6.66% |
|
|
3,559 |
|
|
31 |
|
3.48% |
| Interest earning deposits at Federal Reserve Bank |
|
639,946 |
|
|
8,689 |
|
|
5.43% |
|
|
267,424 |
|
|
1,525 |
|
2.28% |
| Net interest earning assets |
|
7,019,414 |
|
|
129,002 |
|
|
7.35% |
|
|
7,003,456 |
|
|
83,939 |
|
4.79% |
| |
|
|
|
|
|
|
|
|
|
|
|
|
|
|
|
|
| Allowance for credit losses |
|
(23,147) |
|
|
|
|
|
|
|
|
(19,111) |
|
|
|
|
|
| Other assets |
|
338,085 |
|
|
|
|
|
|
|
|
212,078 |
|
|
|
|
|
| |
$ |
7,334,352 |
|
|
|
|
|
|
|
$ |
7,196,423 |
|
|
|
|
|
| |
|
|
|
|
|
|
|
|
|
|
|
|
|
|
|
|
| Liabilities and Shareholders' Equity: |
|
|
|
|
|
|
|
|
|
|
|
|
|
|
|
|
| Deposits: |
|
|
|
|
|
|
|
|
|
|
|
|
|
|
|
|
| Demand and interest checking |
$ |
6,229,668 |
|
$ |
37,913 |
|
|
2.43% |
|
$ |
5,545,115 |
|
$ |
12,726 |
|
0.92% |
| Savings and money market |
|
56,538 |
|
|
518 |
|
|
3.66% |
|
|
479,260 |
|
|
2,792 |
|
2.33% |
| Time deposits |
|
— |
|
|
— |
|
|
— |
|
|
87,562 |
|
|
547 |
|
2.50% |
| Total deposits |
|
6,286,206 |
|
|
38,431 |
|
|
2.45% |
|
|
6,111,937 |
|
|
16,065 |
|
1.05% |
| |
|
|
|
|
|
|
|
|
|
|
|
|
|
|
|
|
| Short-term borrowings |
|
— |
|
|
— |
|
|
— |
|
|
200,423 |
|
|
1,235 |
|
2.46% |
| Repurchase agreements |
|
41 |
|
|
— |
|
|
— |
|
|
41 |
|
|
— |
|
— |
| Long-term borrowings |
|
9,889 |
|
|
128 |
|
|
5.18% |
|
|
39,035 |
|
|
506 |
|
5.19% |
| Subordinated debentures |
|
13,401 |
|
|
293 |
|
|
8.75% |
|
|
13,401 |
|
|
177 |
|
5.28% |
| Senior debt |
|
95,714 |
|
|
1,234 |
|
|
5.16% |
|
|
98,910 |
|
|
1,279 |
|
5.17% |
| Total deposits and liabilities |
|
6,405,251 |
|
|
40,086 |
|
|
2.50% |
|
|
6,463,747 |
|
|
19,262 |
|
1.19% |
| |
|
|
|
|
|
|
|
|
|
|
|
|
|
|
|
|
| Other liabilities |
|
167,673 |
|
|
|
|
|
|
|
|
72,539 |
|
|
|
|
|
| Total liabilities |
|
6,572,924 |
|
|
|
|
|
|
|
|
6,536,286 |
|
|
|
|
|
| |
|
|
|
|
|
|
|
|
|
|
|
|
|
|
|
|
| Shareholders' equity |
|
761,428 |
|
|
|
|
|
|
|
|
660,137 |
|
|
|
|
|
| |
$ |
7,334,352 |
|
|
|
|
|
|
|
$ |
7,196,423 |
|
|
|
|
|
| Net interest income on tax equivalent basis(3) |
|
|
|
$ |
88,916 |
|
|
|
|
|
|
|
$ |
64,677 |
|
|
| |
|
|
|
|
|
|
|
|
|
|
|
|
|
|
|
|
| Tax equivalent adjustment |
|
|
|
|
34 |
|
|
|
|
|
|
|
|
18 |
|
|
| |
|
|
|
|
|
|
|
|
|
|
|
|
|
|
|
|
| Net interest income |
|
|
|
$ |
88,882 |
|
|
|
|
|
|
|
$ |
64,659 |
|
|
| Net interest margin(3) |
|
|
|
|
|
|
|
5.07% |
|
|
|
|
|
|
|
3.69% |
| (1)Interest on loans for 2023 and 2022 includes $7,000 and $21,000, respectively, of interest and fees on PPP loans. |
| (2)Includes commercial loans, at fair value. All periods include non-accrual loans. |
| (3)Full taxable equivalent basis, using 21% respective statutory federal tax rates in 2023 and 2022. |
| Average balance sheet and net interest income |
Nine months ended September 30, 2023 |
|
Nine months ended September 30, 2022 |
| |
(Dollars in thousands; unaudited) |
| |
Average |
|
|
|
|
Average |
|
Average |
|
|
|
Average |
| Assets: |
Balance |
|
Interest(1) |
|
|
Rate |
|
Balance |
|
Interest(1) |
|
Rate |
| |
|
|
|
|
|
|
|
|
|
|
|
|
|
|
|
|
| Interest earning assets: |
|
|
|
|
|
|
|
|
|
|
|
|
|
|
|
|
| Loans, net of deferred fees and costs(2) |
$ |
5,772,266 |
|
$ |
324,009 |
|
|
7.48% |
|
$ |
5,531,902 |
|
$ |
181,174 |
|
4.37% |
| Leases-bank qualified(3) |
|
3,920 |
|
|
279 |
|
|
9.49% |
|
|
3,657 |
|
|
185 |
|
6.75% |
| Investment securities-taxable |
|
773,485 |
|
|
28,820 |
|
|
4.97% |
|
|
880,426 |
|
|
17,115 |
|
2.59% |
| Investment securities-nontaxable(3) |
|
3,193 |
|
|
144 |
|
|
6.01% |
|
|
3,559 |
|
|
93 |
|
3.48% |
| Interest earning deposits at Federal Reserve Bank |
|
640,554 |
|
|
24,271 |
|
|
5.05% |
|
|
499,104 |
|
|
2,876 |
|
0.77% |
| Net interest earning assets |
|
7,193,418 |
|
|
377,523 |
|
|
7.00% |
|
|
6,918,648 |
|
|
201,443 |
|
3.88% |
| |
|
|
|
|
|
|
|
|
|
|
|
|
|
|
|
|
| Allowance for credit losses |
|
(23,192) |
|
|
|
|
|
|
|
|
(19,087) |
|
|
|
|
|
| Other assets |
|
269,072 |
|
|
|
|
|
|
|
|
203,143 |
|
|
|
|
|
| |
$ |
7,439,298 |
|
|
|
|
|
|
|
$ |
7,102,704 |
|
|
|
|
|
| |
|
|
|
|
|
|
|
|
|
|
|
|
|
|
|
|
| Liabilities and Shareholders' Equity: |
|
|
|
|
|
|
|
|
|
|
|
|
|
|
|
|
| Deposits: |
|
|
|
|
|
|
|
|
|
|
|
|
|
|
|
|
| Demand and interest checking |
$ |
6,343,711 |
|
$ |
106,984 |
|
|
2.25% |
|
$ |
5,598,028 |
|
$ |
18,522 |
|
0.44% |
| Savings and money market |
|
88,738 |
|
|
2,465 |
|
|
3.70% |
|
|
522,525 |
|
|
4,192 |
|
1.07% |
| Time deposits |
|
27,802 |
|
|
858 |
|
|
4.11% |
|
|
29,508 |
|
|
547 |
|
2.47% |
| Total deposits |
|
6,460,251 |
|
|
110,307 |
|
|
2.28% |
|
|
6,150,061 |
|
|
23,261 |
|
0.50% |
| |
|
|
|
|
|
|
|
|
|
|
|
|
|
|
|
|
| Short-term borrowings |
|
6,758 |
|
|
234 |
|
|
4.62% |
|
|
71,589 |
|
|
1,267 |
|
2.36% |
| Repurchase agreements |
|
41 |
|
|
— |
|
|
— |
|
|
41 |
|
|
— |
|
— |
| Long-term borrowings |
|
9,945 |
|
|
382 |
|
|
5.12% |
|
|
39,286 |
|
|
506 |
|
1.72% |
| Subordinated debentures |
|
13,401 |
|
|
825 |
|
|
8.21% |
|
|
13,401 |
|
|
432 |
|
4.30% |
| Senior debt |
|
97,220 |
|
|
3,793 |
|
|
5.20% |
|
|
98,817 |
|
|
3,838 |
|
5.18% |
| Total deposits and liabilities |
|
6,587,616 |
|
|
115,541 |
|
|
2.34% |
|
|
6,373,195 |
|
|
29,304 |
|
0.61% |
| |
|
|
|
|
|
|
|
|
|
|
|
|
|
|
|
|
| Other liabilities |
|
117,822 |
|
|
|
|
|
|
|
|
71,413 |
|
|
|
|
|
| Total liabilities |
|
6,705,438 |
|
|
|
|
|
|
|
|
6,444,608 |
|
|
|
|
|
| |
|
|
|
|
|
|
|
|
|
|
|
|
|
|
|
|
| Shareholders' equity |
|
733,860 |
|
|
|
|
|
|
|
|
658,096 |
|
|
|
|
|
| |
$ |
7,439,298 |
|
|
|
|
|
|
|
$ |
7,102,704 |
|
|
|
|
|
| Net interest income on tax equivalent basis(3) |
|
|
|
$ |
261,982 |
|
|
|
|
|
|
|
$ |
172,139 |
|
|
| |
|
|
|
|
|
|
|
|
|
|
|
|
|
|
|
|
| Tax equivalent adjustment |
|
|
|
|
89 |
|
|
|
|
|
|
|
|
58 |
|
|
| |
|
|
|
|
|
|
|
|
|
|
|
|
|
|
|
|
| Net interest income |
|
|
|
$ |
261,893 |
|
|
|
|
|
|
|
$ |
172,081 |
|
|
| Net interest margin(3) |
|
|
|
|
|
|
|
4.86% |
|
|
|
|
|
|
|
3.32% |
| (1)Interest on loans for 2023 and 2022 includes $27,000 and $502,000, respectively, of interest and fees on PPP loans. |
| (2)Includes commercial loans, at fair value. All periods include non-accrual loans. |
| (3)Full taxable equivalent basis, using 21% respective statutory federal tax rates in 2023 and 2022. |
| |
|
|
|
|
|
|
|
|
| Allowance for credit losses |
Nine months ended |
|
Year ended |
| |
September 30, |
|
September 30, |
|
December 31, |
| |
2023 (unaudited) |
|
2022 (unaudited) |
|
2022 |
| |
(Dollars in thousands) |
| |
|
|
|
|
|
|
|
|
| Balance in the allowance for credit losses at beginning of period |
$ |
22,374 |
|
$ |
17,806 |
|
$ |
17,806 |
| |
|
|
|
|
|
|
|
|
| Loans charged-off: |
|
|
|
|
|
|
|
|
| SBA non-real estate |
|
871 |
|
|
861 |
|
|
885 |
| Direct lease financing |
|
2,804 |
|
|
312 |
|
|
576 |
| Consumer - other |
|
3 |
|
|
— |
|
|
— |
| Total |
|
3,678 |
|
|
1,173 |
|
|
1,461 |
| |
|
|
|
|
|
|
|
|
| Recoveries: |
|
|
|
|
|
|
|
|
| SBA non-real estate |
|
446 |
|
|
57 |
|
|
140 |
| SBA commercial mortgage |
|
75 |
|
|
— |
|
|
— |
| Direct lease financing |
|
220 |
|
|
108 |
|
|
124 |
| Consumer - home equity |
|
299 |
|
|
— |
|
|
— |
| Other loans |
|
— |
|
|
— |
|
|
24 |
| Total |
|
1,040 |
|
|
165 |
|
|
288 |
| Net charge-offs |
|
2,638 |
|
|
1,008 |
|
|
1,173 |
| Provision for credit losses, excluding commitment provision |
|
4,409 |
|
|
2,891 |
|
|
5,741 |
| |
|
|
|
|
|
|
|
|
| Balance in allowance for credit losses at end of period |
$ |
24,145 |
|
$ |
19,689 |
|
$ |
22,374 |
| Net charge-offs/average loans |
|
0.05% |
|
|
0.02% |
|
|
0.03% |
| Net charge-offs/average assets |
|
0.04% |
|
|
0.01% |
|
|
0.02% |
| Loan portfolio |
September 30, |
|
June 30, |
|
December 31, |
|
September 30, |
| |
2023 (unaudited) |
|
2023 (unaudited) |
|
2022 |
|
2022 (unaudited) |
| |
(Dollars in thousands) |
| |
|
|
|
|
|
|
|
|
|
|
|
| SBL non-real estate |
$ |
130,579 |
|
$ |
117,621 |
|
$ |
108,954 |
|
$ |
116,080 |
| SBL commercial mortgage |
|
547,107 |
|
|
515,008 |
|
|
474,496 |
|
|
429,865 |
| SBL construction |
|
19,204 |
|
|
32,471 |
|
|
30,864 |
|
|
26,841 |
| Small business loans |
|
696,890 |
|
|
665,100 |
|
|
614,314 |
|
|
572,786 |
| Direct lease financing |
|
670,208 |
|
|
657,316 |
|
|
632,160 |
|
|
599,796 |
| SBLOC / IBLOC(1) |
|
1,720,513 |
|
|
1,883,607 |
|
|
2,332,469 |
|
|
2,369,106 |
| Advisor financing(2) |
|
199,442 |
|
|
173,376 |
|
|
172,468 |
|
|
168,559 |
| Real estate bridge loans |
|
1,848,224 |
|
|
1,826,227 |
|
|
1,669,031 |
|
|
1,488,119 |
| Other loans(3) |
|
55,800 |
|
|
55,644 |
|
|
61,679 |
|
|
64,980 |
| |
|
5,191,077 |
|
|
5,261,270 |
|
|
5,482,121 |
|
|
5,263,346 |
| Unamortized loan fees and costs |
|
7,895 |
|
|
6,304 |
|
|
4,732 |
|
|
4,029 |
| Total loans, including unamortized fees and costs |
$ |
5,198,972 |
|
$ |
5,267,574 |
|
$ |
5,486,853 |
|
$ |
5,267,375 |
| Small business portfolio |
September 30, |
|
June 30, |
|
December 31, |
|
September 30, |
| |
2023 (unaudited) |
|
2023 (unaudited) |
|
2022 |
|
2022 (unaudited) |
| |
|
(Dollars in thousands) |
| |
|
|
|
|
|
|
|
|
|
|
|
| SBL, including unamortized fees and costs |
$ |
705,790 |
|
$ |
673,667 |
|
$ |
621,641 |
|
$ |
579,156 |
| SBL, included in loans, at fair value |
|
126,543 |
|
|
134,131 |
|
|
146,717 |
|
|
159,914 |
| Total small business loans(4) |
$ |
832,333 |
|
$ |
807,798 |
|
$ |
768,358 |
|
$ |
739,070 |
(1)SBLOC
are collateralized by marketable securities, while IBLOC are collateralized by the cash surrender value of insurance policies. At September
30, 2023 and December 31, 2022, IBLOC loans amounted to $712.6 million and $1.12 billion, respectively.
(2)In 2020
The Bancorp began originating loans to investment advisors for purposes of debt refinancing, acquisition of another firm or internal succession.
Maximum loan amounts are subject to loan-to-value (“LTV”) ratios of 70% of the business enterprise value based on a third-party
valuation, but may be increased depending upon the debt service coverage ratio. Personal guarantees and blanket business liens are obtained
as appropriate.
(3)Includes
demand deposit overdrafts reclassified as loan balances totaling $215,000 and $2.6 million at September 30, 2023 and December 31, 2022,
respectively. Estimated overdraft charge-offs and recoveries are reflected in the allowance for credit losses and are immaterial.
(4)The
SBLs held at fair value are comprised of the government guaranteed portion of 7(a) Program loans at the dates indicated.
Small business loans as of September 30, 2023
| |
|
|
|
| |
|
Loan principal |
| |
|
(Dollars in millions) |
| U.S. government guaranteed portion of SBA loans(1) |
|
$ |
392 |
| PPP loans(1) |
|
|
2 |
| Commercial mortgage SBA(2) |
|
|
273 |
| Construction SBA(3) |
|
|
11 |
| Non-guaranteed portion of U.S. government guaranteed 7(a) Program loans(4) |
|
|
109 |
| Non-SBA SBLs |
|
|
35 |
| Total principal |
|
$ |
822 |
| Unamortized fees and costs |
|
|
10 |
| Total SBLs |
|
$ |
832 |
(1)Includes
the portion of SBA 7(a) Program loans and PPP loans which have been guaranteed by the U.S. government, and therefore are assumed to have
no credit risk.
(2)Substantially
all these loans are made under the 504 Program, which dictates origination date LTV percentages, generally 50-60%, to which The Bancorp
adheres.
(3)Includes
$4.0 million in 504 Program first mortgages with an origination date LTV of 50-60%, and $7.0 million in SBA interim loans with an approved
SBA post-construction full takeout/payoff.
(4)Includes
the unguaranteed portion of 7(a) Program loans which are 70% or more guaranteed by the U.S. government. SBA 7(a) Program loans are not
made on the basis of real estate LTV; however, they are subject to SBA's "All Available Collateral" rule which mandates that
to the extent a borrower or its 20% or greater principals have available collateral (including personal residences), the collateral must
be pledged to fully collateralize the loan, after applying SBA-determined liquidation rates. In addition, all 7(a) Program loans and 504
Program loans require the personal guaranty of all 20% or greater owners.
Small business loans by type as of September 30, 2023
(Excludes government guaranteed portion of SBA 7(a) Program and PPP loans)
| |
|
SBL commercial mortgage(1) |
|
SBL construction(1) |
|
SBL non-real estate |
|
Total |
|
|
% Total |
| |
|
|
(Dollars in millions) |
| Hotels (except casino hotels) and motels |
|
$ |
74 |
|
$ |
— |
|
$ |
— |
|
$ |
74 |
|
|
17% |
| Full-service restaurants |
|
|
24 |
|
|
6 |
|
|
2 |
|
|
32 |
|
|
7% |
| Funeral homes and funeral services |
|
|
27 |
|
|
— |
|
|
— |
|
|
27 |
|
|
6% |
| Car washes |
|
|
19 |
|
|
— |
|
|
— |
|
|
19 |
|
|
4% |
| Child day care services |
|
|
15 |
|
|
1 |
|
|
1 |
|
|
17 |
|
|
4% |
| Outpatient mental health and substance abuse centers |
|
|
15 |
|
|
— |
|
|
— |
|
|
15 |
|
|
4% |
| Homes for the elderly |
|
|
13 |
|
|
— |
|
|
— |
|
|
13 |
|
|
3% |
| Gasoline stations with convenience stores |
|
|
12 |
|
|
— |
|
|
— |
|
|
12 |
|
|
3% |
| Fitness and recreational sports centers |
|
|
8 |
|
|
— |
|
|
2 |
|
|
10 |
|
|
2% |
| Lessors of other real estate property |
|
|
9 |
|
|
— |
|
|
1 |
|
|
10 |
|
|
2% |
| Offices of lawyers |
|
|
9 |
|
|
— |
|
|
— |
|
|
9 |
|
|
2% |
| General warehousing and storage |
|
|
7 |
|
|
— |
|
|
— |
|
|
7 |
|
|
2% |
| Plumbing, heating, and air-conditioning companies |
|
|
6 |
|
|
— |
|
|
1 |
|
|
7 |
|
|
2% |
| Caterers |
|
|
6 |
|
|
— |
|
|
— |
|
|
6 |
|
|
1% |
| Limited-service restaurants |
|
|
3 |
|
|
1 |
|
|
3 |
|
|
7 |
|
|
2% |
| Specialty trade contractors |
|
|
5 |
|
|
— |
|
|
— |
|
|
5 |
|
|
1% |
| Lessors of residential buildings and dwellings |
|
|
5 |
|
|
— |
|
|
— |
|
|
5 |
|
|
1% |
| Miscellaneous durable goods merchant |
|
|
5 |
|
|
— |
|
|
— |
|
|
5 |
|
|
1% |
| Packaged frozen food merchant wholesalers |
|
|
5 |
|
|
— |
|
|
— |
|
|
5 |
|
|
1% |
| Technical and trade schools |
|
|
5 |
|
|
— |
|
|
— |
|
|
5 |
|
|
1% |
| All other amusement and recreation |
|
|
4 |
|
|
— |
|
|
— |
|
|
4 |
|
|
1% |
| Offices of dentists |
|
|
3 |
|
|
— |
|
|
— |
|
|
3 |
|
|
1% |
| Vocational rehabilitation services |
|
|
— |
|
|
3 |
|
|
— |
|
|
3 |
|
|
1% |
| Other warehousing and storage |
|
|
3 |
|
|
— |
|
|
— |
|
|
3 |
|
|
1% |
| Other(2) |
|
|
96 |
|
|
1 |
|
|
28 |
|
|
125 |
|
|
30% |
| Total |
|
$ |
378 |
|
$ |
12 |
|
$ |
38 |
|
$ |
428 |
|
|
100% |
(1)Of
the SBL commercial mortgage and SBL construction loans, $106.0 million represents the total of the non-guaranteed portion of SBA 7(a)
Program loans and non-SBA loans. The balance of those categories represents SBA 504 Program loans with 50%-60% origination date LTVs.
(2)Loan
types of less than $3.0 million are spread over approximately one hundred different business types.
State diversification as of September 30, 2023
(Excludes government guaranteed portion of SBA 7(a) Program loans and PPP
loans)
| |
|
SBL commercial mortgage(1) |
|
SBL construction(1) |
|
SBL non-real estate |
|
Total |
|
|
% Total |
| |
|
|
(Dollars in millions) |
| California |
|
$ |
78 |
|
$ |
4 |
|
$ |
3 |
|
$ |
85 |
|
|
20% |
| Florida |
|
|
69 |
|
|
1 |
|
|
3 |
|
|
73 |
|
|
17% |
| North Carolina |
|
|
39 |
|
|
1 |
|
|
2 |
|
|
42 |
|
|
10% |
| New York |
|
|
24 |
|
|
1 |
|
|
3 |
|
|
28 |
|
|
7% |
| New Jersey |
|
|
17 |
|
|
3 |
|
|
4 |
|
|
24 |
|
|
6% |
| Texas |
|
|
19 |
|
|
— |
|
|
4 |
|
|
23 |
|
|
5% |
| Pennsylvania |
|
|
21 |
|
|
— |
|
|
1 |
|
|
22 |
|
|
5% |
| Georgia |
|
|
18 |
|
|
1 |
|
|
2 |
|
|
21 |
|
|
5% |
| Other States <$15 million |
|
|
93 |
|
|
1 |
|
|
16 |
|
|
110 |
|
|
25% |
| Total |
|
$ |
378 |
|
$ |
12 |
|
$ |
38 |
|
$ |
428 |
|
|
100% |
(1)Of
the SBL commercial mortgage and SBL construction loans, $106.0 million represents the
total of the non-guaranteed portion of SBA 7(a) Program loans and non-SBA loans. The balance of those categories represents SBA 504 Program
loans with 50%-60% origination date LTVs.
Top 10 loans as of September 30, 2023
| Type(1) |
|
State |
|
SBL commercial mortgage |
|
| |
|
|
(Dollars in millions) |
| Mental health and substance abuse center |
|
|
FL |
|
$ |
10 |
|
| Funeral homes and funeral services |
|
|
ME |
|
|
9 |
|
| Hotel |
|
|
FL |
|
|
8 |
|
| Offices of lawyers |
|
|
CA |
|
|
8 |
|
| Hotel |
|
|
NC |
|
|
7 |
|
| General warehousing and storage |
|
|
PA |
|
|
7 |
|
| Hotel |
|
|
FL |
|
|
6 |
|
| Hotel |
|
|
NY |
|
|
6 |
|
| Hotel |
|
|
NC |
|
|
6 |
|
| Mental health and substance abuse center |
|
|
NJ |
|
|
5 |
|
| Total |
|
|
|
|
$ |
72 |
|
| |
|
|
|
|
|
|
|
| |
(1)The table above does
not include loans to the extent that they are U.S. government guaranteed.
Commercial real estate loans, excluding SBA loans, are as follows including
LTV at origination:
Type as of September 30, 2023
| Type |
|
|
# Loans |
|
|
Balance |
|
Weighted average origination date LTV |
|
Weighted average interest rate |
| |
|
|
(Dollars in millions) |
| Real estate bridge loans (multi-family apartment loans recorded at amortized cost)(1) |
|
|
139 |
|
$ |
1,848 |
|
71% |
|
9.30% |
| |
|
|
|
|
|
|
|
|
|
|
| Non-SBA commercial real estate loans, at fair value: |
|
|
|
|
|
|
|
|
|
|
| Multi-family (apartment bridge loans)(1) |
|
|
11 |
|
$ |
207 |
|
76% |
|
8.80% |
| Hospitality (hotels and lodging) |
|
|
2 |
|
|
27 |
|
65% |
|
9.80% |
| Retail |
|
|
2 |
|
|
12 |
|
72% |
|
7.30% |
| Other |
|
|
2 |
|
|
9 |
|
73% |
|
5.00% |
| |
|
|
17 |
|
|
255 |
|
75% |
|
8.69% |
| Fair value adjustment |
|
|
|
|
|
(2) |
|
|
|
|
| Total non-SBA commercial real estate loans, at fair value |
|
|
|
|
|
253 |
|
|
|
|
| Total commercial real estate loans |
|
|
|
|
$ |
2,101 |
|
72% |
|
9.24% |
(1)In the third quarter
of 2021, we resumed the origination of multi-family apartment loans. These are similar to the multi-family apartment loans carried at
fair value, but at origination are intended to be held on the balance sheet, so they are not accounted for at fair value.
| State diversification as of September 30, 2023 |
|
|
15 largest loans as of September 30, 2023 |
| |
|
|
|
|
|
|
|
|
|
|
|
|
|
| State |
|
Balance |
|
|
Origination date LTV |
|
|
State |
|
|
Balance |
|
Origination date LTV |
| (Dollars in millions) |
|
|
(Dollars in millions) |
| Texas |
|
$ |
780 |
|
|
73% |
|
|
Texas |
|
|
$ |
46 |
|
75% |
| Georgia |
|
|
243 |
|
|
69% |
|
|
Texas |
|
|
|
44 |
|
72% |
| Florida |
|
|
204 |
|
|
70% |
|
|
Tennessee |
|
|
|
40 |
|
72% |
| Tennessee |
|
|
88 |
|
|
70% |
|
|
Texas |
|
|
|
39 |
|
75% |
| Michigan |
|
|
82 |
|
|
71% |
|
|
Texas |
|
|
|
39 |
|
79% |
| Ohio |
|
|
72 |
|
|
67% |
|
|
Texas |
|
|
|
37 |
|
80% |
| Indiana |
|
|
66 |
|
|
72% |
|
|
Michigan |
|
|
|
37 |
|
62% |
| Other States each <$65 million |
|
|
566 |
|
|
73% |
|
|
Florida |
|
|
|
35 |
|
72% |
| Total |
|
$ |
2,101 |
|
|
72% |
|
|
Indiana |
|
|
|
34 |
|
76% |
| |
|
|
|
|
|
|
|
|
Texas |
|
|
|
33 |
|
62% |
| |
|
|
|
|
|
|
|
|
Texas |
|
|
|
33 |
|
67% |
| |
|
|
|
|
|
|
|
|
Michigan |
|
|
|
33 |
|
79% |
| |
|
|
|
|
|
|
|
|
Oklahoma |
|
|
|
31 |
|
78% |
| |
|
|
|
|
|
|
|
|
Tennessee |
|
|
|
30 |
|
71% |
| |
|
|
|
|
|
|
|
|
Georgia |
|
|
|
29 |
|
69% |
| |
|
|
|
|
|
|
|
|
15 largest commercial real estate loans |
|
|
$ |
540 |
|
73% |
Institutional banking loans outstanding at September 30, 2023
| Type |
Principal |
|
% of total |
| |
|
(Dollars in millions) |
|
|
| SBLOC |
$ |
1,008 |
|
53% |
| IBLOC |
|
713 |
|
37% |
| Advisor financing |
|
199 |
|
10% |
| Total |
$ |
1,920 |
|
100% |
For SBLOC, we generally lend up to 50% of the value of equities and 80%
for investment grade securities. While the value of equities has fallen in excess of 30% in recent years, the reduction in collateral
value of brokerage accounts collateralizing SBLOCs generally has been less, for two reasons. First, many collateral accounts are “balanced”
and accordingly have a component of debt securities, which have either not decreased in value as much as equities, or in some cases may
have increased in value. Second, many of these accounts have the benefit of professional investment advisors who provided some protection
against market downturns, through diversification and other means. Additionally, borrowers often utilize only a portion of collateral
value, which lowers the percentage of principal to collateral.
Top 10 SBLOC loans at September 30, 2023
| |
Principal amount |
|
% Principal to collateral |
| |
(Dollars in millions) |
| |
$ |
12 |
|
25% |
| |
|
9 |
|
39% |
| |
|
9 |
|
44% |
| |
|
9 |
|
62% |
| |
|
9 |
|
95% |
| |
|
8 |
|
77% |
| |
|
8 |
|
71% |
| |
|
8 |
|
28% |
| |
|
7 |
|
75% |
| |
|
7 |
|
34% |
| Total and weighted average |
$ |
86 |
|
54% |
Insurance backed lines of credit (IBLOC)
IBLOC loans are backed by the cash value of eligible life insurance policies
which have been assigned to us. We generally lend up to 95% of such cash value. Our underwriting standards require approval of the
insurance companies which carry the policies backing these loans. Currently, fifteen insurance companies have been approved and, as of
September 30, 2023, all were rated A- (Excellent) or better by AM BEST.
Direct lease financing by type as of September 30, 2023
| |
|
Principal balance(1) |
|
% Total |
| |
|
(Dollars in millions) |
|
|
| Construction |
$ |
118 |
|
18% |
| Waste management and remediation services |
|
91 |
|
14% |
| Government agencies and public institutions(2) |
|
89 |
|
13% |
| Real estate and rental and leasing |
|
58 |
|
9% |
| Manufacturing |
|
41 |
|
6% |
| Health care and social assistance |
|
34 |
|
5% |
| Retail trade |
|
34 |
|
5% |
| Finance and insurance |
|
31 |
|
5% |
| Professional, scientific, and technical services |
|
27 |
|
4% |
| Wholesale trade |
|
16 |
|
2% |
| Transportation and warehousing |
|
11 |
|
2% |
| Mining, quarrying, and oil and gas extraction |
|
11 |
|
2% |
| Water supply and irrigation systems |
|
9 |
|
1% |
| Other |
|
100 |
|
14% |
| Total |
$ |
670 |
|
100% |
(1)Of the
total $670.0 million of direct lease financing, $588.0 million consisted of vehicle leases with the remaining balance consisting of equipment
leases.
(2)Includes
public universities and school districts.
Direct lease financing by state as of September 30, 2023
| |
|
|
|
|
| State |
|
Principal balance |
|
% Total |
| |
|
(Dollars in millions) |
|
|
| Florida |
$ |
100 |
|
15% |
| Utah |
|
66 |
|
10% |
| California |
|
60 |
|
9% |
| Pennsylvania |
|
41 |
|
6% |
| New Jersey |
|
38 |
|
6% |
| New York |
|
35 |
|
5% |
| North Carolina |
|
34 |
|
5% |
| Texas |
|
31 |
|
5% |
| Maryland |
|
31 |
|
5% |
| Connecticut |
|
28 |
|
4% |
| Idaho |
|
17 |
|
3% |
| Washington |
|
15 |
|
2% |
| Georgia |
|
14 |
|
2% |
| Ohio |
|
13 |
|
2% |
| Alabama |
|
11 |
|
2% |
| Other States |
|
136 |
|
19% |
| Total |
$ |
670 |
|
100% |
| Capital ratios |
Tier 1 capital |
|
Tier 1 capital |
|
Total capital |
|
Common equity |
| |
to average |
|
to risk-weighted |
|
to risk-weighted |
|
tier 1 to risk |
| |
assets ratio |
|
assets ratio |
|
assets ratio |
|
weighted assets |
| As of September 30, 2023 |
|
|
|
|
|
|
|
| The Bancorp, Inc. |
10.92% |
|
15.53% |
|
16.04% |
|
15.53% |
| The Bancorp Bank, National Association |
12.13% |
|
17.26% |
|
17.77% |
|
17.26% |
| "Well capitalized" institution (under federal regulations-Basel III) |
5.00% |
|
8.00% |
|
10.00% |
|
6.50% |
| |
|
|
|
|
|
|
|
| As of December 31, 2022 |
|
|
|
|
|
|
|
| The Bancorp, Inc. |
9.63% |
|
13.40% |
|
13.87% |
|
13.40% |
| The Bancorp Bank, National Association |
10.73% |
|
14.95% |
|
15.42% |
|
14.95% |
| "Well capitalized" institution (under federal regulations-Basel III) |
5.00% |
|
8.00% |
|
10.00% |
|
6.50% |
| |
Three months ended |
|
Nine months ended |
| |
September 30, |
|
September 30, |
| |
2023 |
|
2022 |
|
2023 |
|
2022 |
| Selected operating ratios |
|
|
|
|
|
|
|
|
|
|
|
| Return on average assets(1) |
|
2.71% |
|
|
1.69% |
|
|
2.66% |
|
|
1.69% |
| Return on average equity(1) |
|
26.12% |
|
|
18.39% |
|
|
27.01% |
|
|
18.28% |
| Net interest margin |
|
5.07% |
|
|
3.69% |
|
|
4.86% |
|
|
3.32% |
(1)Annualized
| Book value per share table |
September 30, |
|
June 30, |
|
|
December 31, |
|
September 30, |
| |
2023 |
|
2023 |
|
2022 |
|
2022 |
| Book value per share |
$ |
14.36 |
|
$ |
13.74 |
|
$ |
12.46 |
|
$ |
11.81 |
| |
|
|
|
|
|
|
|
|
|
|
|
| Loan quality table |
September 30, |
|
June 30, |
|
December 31, |
|
September 30, |
| |
2023 |
|
2022 |
|
2022 |
|
2022 |
| |
(Dollars in thousands) |
| Nonperforming loans to total loans |
|
0.30% |
|
|
0.28% |
|
|
0.33% |
|
|
0.16% |
| Nonperforming assets to total assets |
|
0.46% |
|
|
0.47% |
|
|
0.50% |
|
|
0.35% |
| Allowance for credit losses to total loans |
|
0.46% |
|
|
0.44% |
|
|
0.41% |
|
|
0.37% |
| |
|
|
|
|
|
|
|
|
|
|
|
| Nonaccrual loans |
$ |
15,100 |
|
$ |
14,027 |
|
$ |
10,356 |
|
$ |
3,860 |
| Loans 90 days past due still accruing interest |
|
677 |
|
|
563 |
|
|
7,775 |
|
|
4,415 |
| Other real estate owned |
|
18,756 |
|
|
20,952 |
|
|
21,210 |
|
|
18,873 |
| Total nonperforming assets |
$ |
34,533 |
|
$ |
35,542 |
|
$ |
39,341 |
|
$ |
27,148 |
| Gross dollar volume (GDV) (1) |
Three months ended |
| |
September 30, |
|
June 30, |
|
December 31, |
|
September 30, |
| |
2023 |
|
2023 |
|
2022 |
|
2022 |
| |
(Dollars in thousands) |
| Prepaid and debit card GDV |
$ |
32,972,249 |
|
$ |
32,776,154 |
|
$ |
29,454,074 |
|
$ |
28,119,428 |
(1) Gross dollar volume represents the total dollar amount
spent on prepaid and debit cards issued by The Bancorp Bank, N.A.
| Business line quarterly summary |
|
| Quarter ended September 30, 2023 |
|
| (Dollars in millions) |
|
| |
|
|
|
|
|
|
|
|
|
|
|
|
|
| |
|
|
|
Balances |
|
|
|
|
|
| |
|
|
|
|
|
% Growth |
|
|
|
|
|
| Major business lines |
|
Average approximate rates(1) |
|
Balances(2) |
|
Year over year |
|
Linked quarter annualized |
|
|
|
|
|
| Loans |
|
|
|
|
|
|
|
|
|
|
|
|
|
| Institutional banking(3) |
|
6.7% |
|
$ 1,920 |
|
(24%) |
|
(27%) |
|
|
|
|
|
| Small business lending(4) |
|
7.0% |
|
832 |
|
13% |
|
12% |
|
|
|
|
|
| Leasing |
|
7.1% |
|
670 |
|
12% |
|
8% |
|
|
|
|
|
| Commercial real estate (non-SBA loans, at fair value) |
|
8.7% |
|
253 |
|
nm |
|
nm |
|
|
|
|
|
| Real estate bridge loans (recorded at book value) |
|
9.3% |
|
1,848 |
|
24% |
|
5% |
|
|
|
|
|
| Weighted average yield |
|
7.8% |
|
$ 5,523 |
|
|
|
|
|
Non-interest income |
| |
|
|
|
|
|
|
|
|
|
|
|
% Growth |
| Deposits: Fintech solutions group |
|
|
|
|
|
|
|
|
|
Current quarter |
|
Year over year |
|
| Prepaid and debit card issuance, and other payments |
2.5% |
|
$ 6,007 |
|
11% |
|
nm |
|
$ 24.1 |
|
12% |
|
(1)Average rates are for the three months ended September 30,
2023.
(2)Loan and deposit categories are based on period-end and average
quarterly balances, respectively.
(3)Institutional Banking loans are comprised of security backed
lines of credit (SBLOC), collateralized by marketable securities, insurance backed lines of credit (IBLOC), collateralized by the cash
surrender value of eligible life insurance policies, and investment advisor financing.
(4)Small Business Lending is substantially comprised of SBA
loans. Loan growth percentages exclude short-term PPP loans.
Summary of credit lines available
Notwithstanding that the vast majority of The Bancorp’s funding is
comprised of insured and small balance accounts, The Bancorp maintains lines of credit exceeding potential liquidity requirements as follows.
The Bancorp also has access to other substantial sources of liquidity.
| |
September 30, 2023 |
| |
|
(Dollars in thousands) |
| Federal Reserve Bank |
$ |
1,938,195 |
| Federal Home Loan Bank |
|
731,500 |
| Total lines of credit available |
$ |
2,669,695 |
Estimated insured vs uninsured deposits
The vast majority of The Bancorp’s deposits are insured and low balance
and accordingly do not constitute the liquidity risk experienced by certain institutions. Accordingly the deposit base is comprised as
follows.
| |
September 30, 2023 |
| Insured |
|
91% |
| Low balance accounts |
|
5% |
| Other uninsured |
|
4% |
| Total deposits |
|
100% |
Calculation of efficiency ratio(1)
| |
Three months ended |
| |
September 30, |
|
December 31, |
| |
2023 |
|
2022 |
| |
(Dollars in thousands) |
| Net interest income |
$ |
88,882 |
|
$ |
76,760 |
| Non-interest income |
|
26,780 |
|
|
25,740 |
| Total revenue |
$ |
115,662 |
|
$ |
102,500 |
| Non-interest expense |
$ |
47,459 |
|
$ |
43,475 |
| |
|
|
|
|
|
| Efficiency ratio |
|
41% |
|
|
42% |
(1) The efficiency ratio is calculated by dividing GAAP total
non-interest expense by the total of GAAP net interest income and non-interest income. This ratio compares revenues generated with
the amount of expense required to generate such revenues, and may be used as one measure of overall efficiency.
Exhibit 99.2

O C T O B ER 2023 THE BANCORP INVESTOR PRESENTATION
2 FORWARD LOOKING STATEMENTS & OTHER DISCLOSURES D I S C L O S U R E S Statements in this presentation regarding The Bancorp, Inc.’s (“The Bancorp”) business that are not historical facts or concern our earnings guidance or 2030 plan are “forward - looking statements”. These statements may be identified by the use of forward - looking terminology, including the words “may,” “believe,” “will,” “expect,” “anticipate,” “estimate,” “intend,” “plan," or similar words, and are based on current expectations about important economic, political, and technological factors, among others, and are subject to risks and uncertainties, which could cause the actual results, events or achievements to differ materially from those set forth in or implied by the forward - looking statements and related assumptions. These risks and uncertainties include those relating to the COVID - 19 pandemic, the impact it will have on the company’s business and the industry as a whole, and the resulting governmental and societal responses. 2023 guidance and long - term financial targets in this presentation assume achievement of management’s credit roadmap growth goals as described herein and other growth goals. If such assumptions are not met, guidance and long - term financial targets might not be reached. For further discussion of these risks and uncertainties, see the “risk factors” sections contained, in The Bancorp’s Annual Report on Form 10 - K for the year ended December 31, 2022 and in its other public filings with the SEC. In addition, these forward - looking statements are based upon assumptions with respect to future strategies and decisions that are subject to change. Actual results may differ materially from the anticipated results discussed in these forward - looking statements. The forward - looking statements speak only as of the date of this presentation. The Bancorp does not undertake to publicly revise or update forward - looking statements in this presentation to reflect events or circumstances that arise after the date of this presentation, except as may be required under applicable law. This presentation contains information regarding financial results that is calculated and presented on the basis of methodologies other than in accordance with accounting principles generally accepted in the United States (“GAAP”), such as those identified in the Appendix. As a result, such information may not conform to SEC Regulation S - X and may be adjusted and presented differently in filings with the SEC. Any non - GAAP financial measures used in this presentation are in addition to, and should not be considered superior to, or a substitute for, financial statements prepared in accordance with GAAP. Non - GAAP financial measures are subject to significant inherent limitations. The non - GAAP measures presented herein may not be comparable to similar non - GAAP measures presented by other companies. This information may be presented differently in future filings by The Bancorp with the SEC. This presentation may contain statistics and other data that in some cases has been obtained from or compiled from information made available by third - party service providers. The Bancorp makes no representation or warranty, express or implied, with respect to the accuracy, reasonableness or completeness of such information. Past performance is not indicative nor a guarantee of future results. Copies of the documents filed by The Bancorp with the SEC are available free of charge from the website of the SEC at www.sec.gov as well as on The Bancorp’s website at www.thebancorp.com . This presentation is for information purposes only and shall not constitute an offer to sell or the solicitation of an offer to buy any securities. Neither the SEC nor any other regulatory body has approved or disapproved of the securities of The Bancorp or passed upon the accuracy or adequacy of this presentation. Any representation to the contrary is a criminal offense.
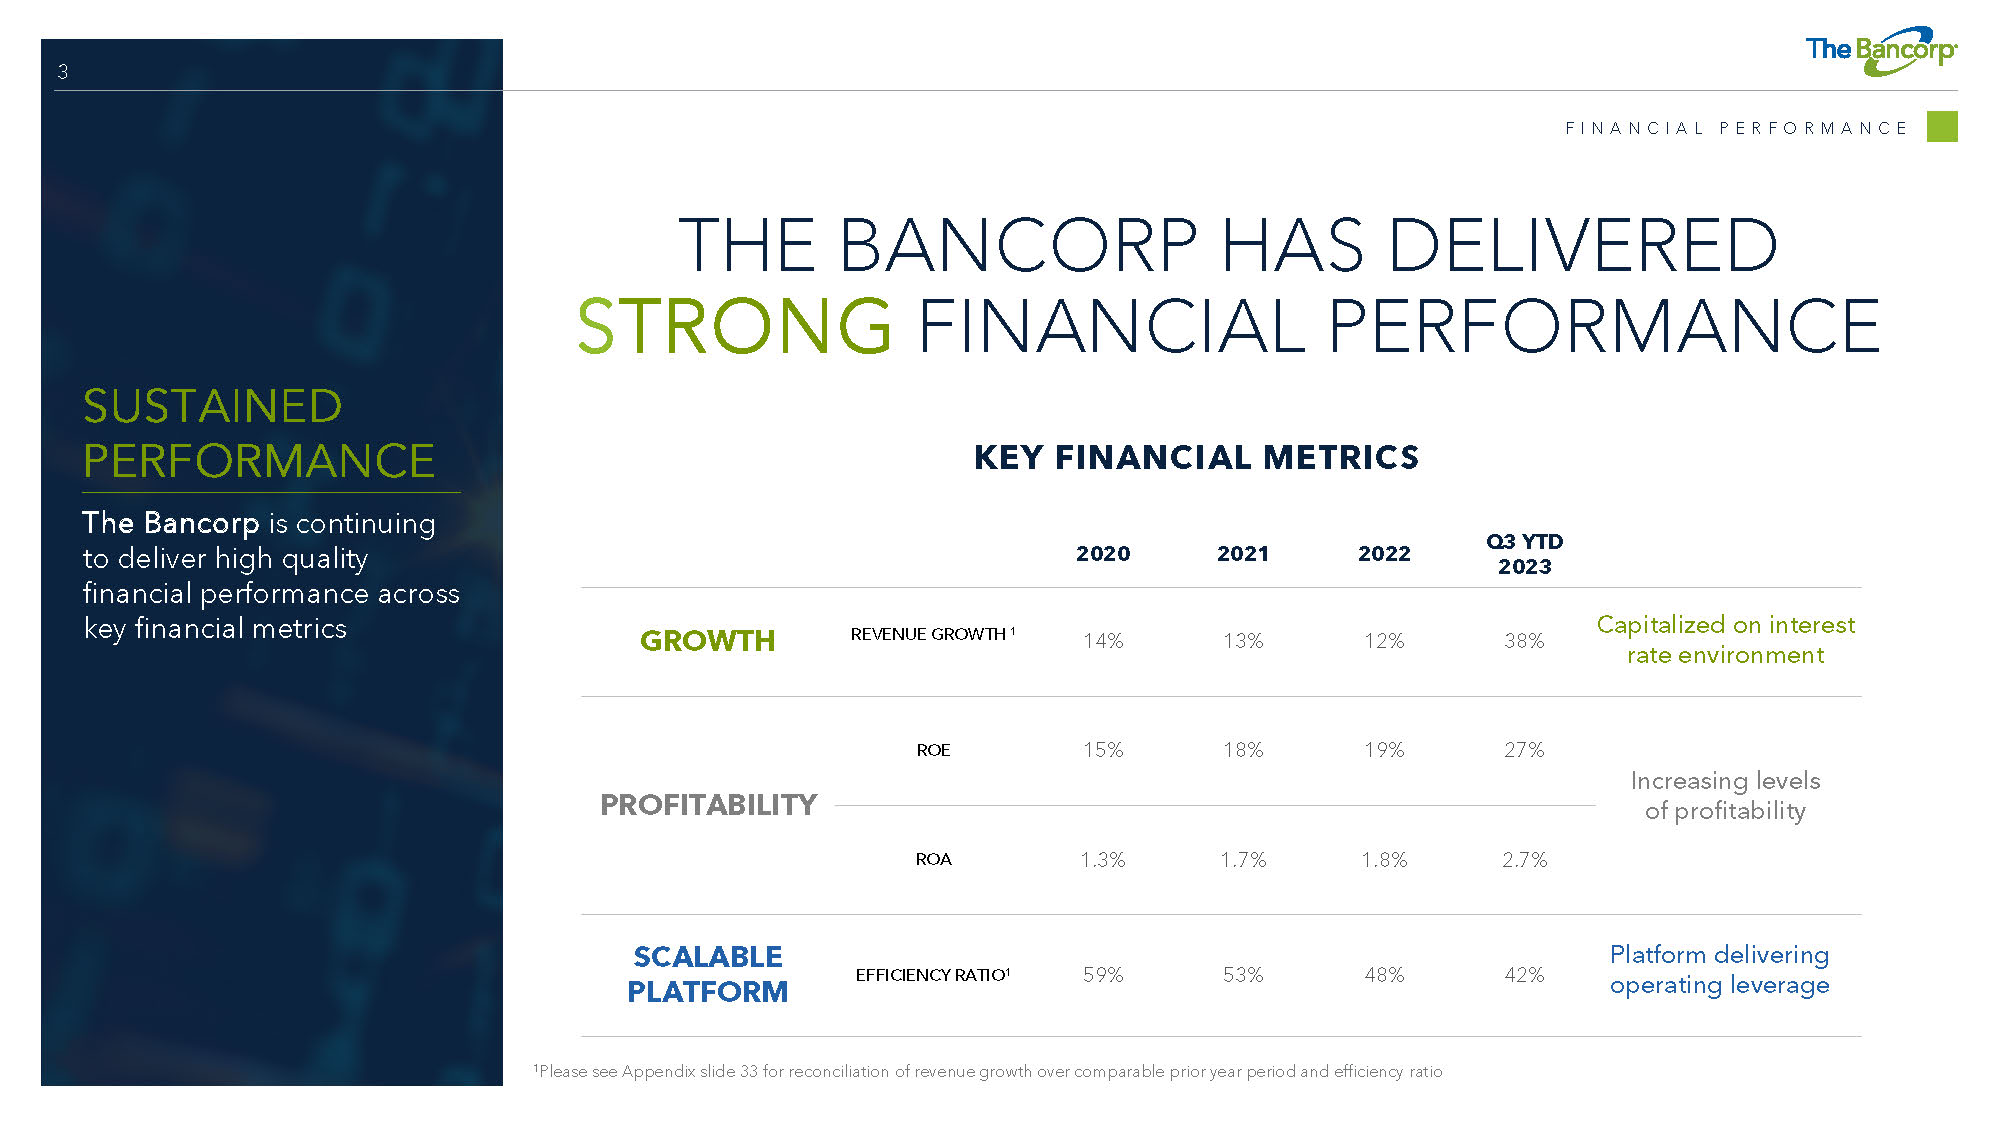
3 THE BANCORP HAS DELIVERED S TRONG FINANCIAL PERFORMANCE KEY FINANCIAL METRICS F I N A N C I A L P E R F O R M A N C E SUSTAINED PERFORMANCE The Bancorp is continuing to deliver high quality financial performance across key financial metrics 1 Please see Appendix slide 33 for reconciliation of revenue growth over comparable prior year period and efficiency ratio Q3 YTD 2023 2022 2021 2020 38% Capitalized on interest rate environment 12% 13% 14% REVENUE GROWTH 1 GROWTH 27% 19% 18% 15% ROE Increasing levels of profitability PROFITABILITY 2.7% 1.8% 1.7% 1.3% ROA Platform delivering 42% operating leverage 48% 53% 59% EFFICIENCY RATIO 1 SCALABLE PLATFORM
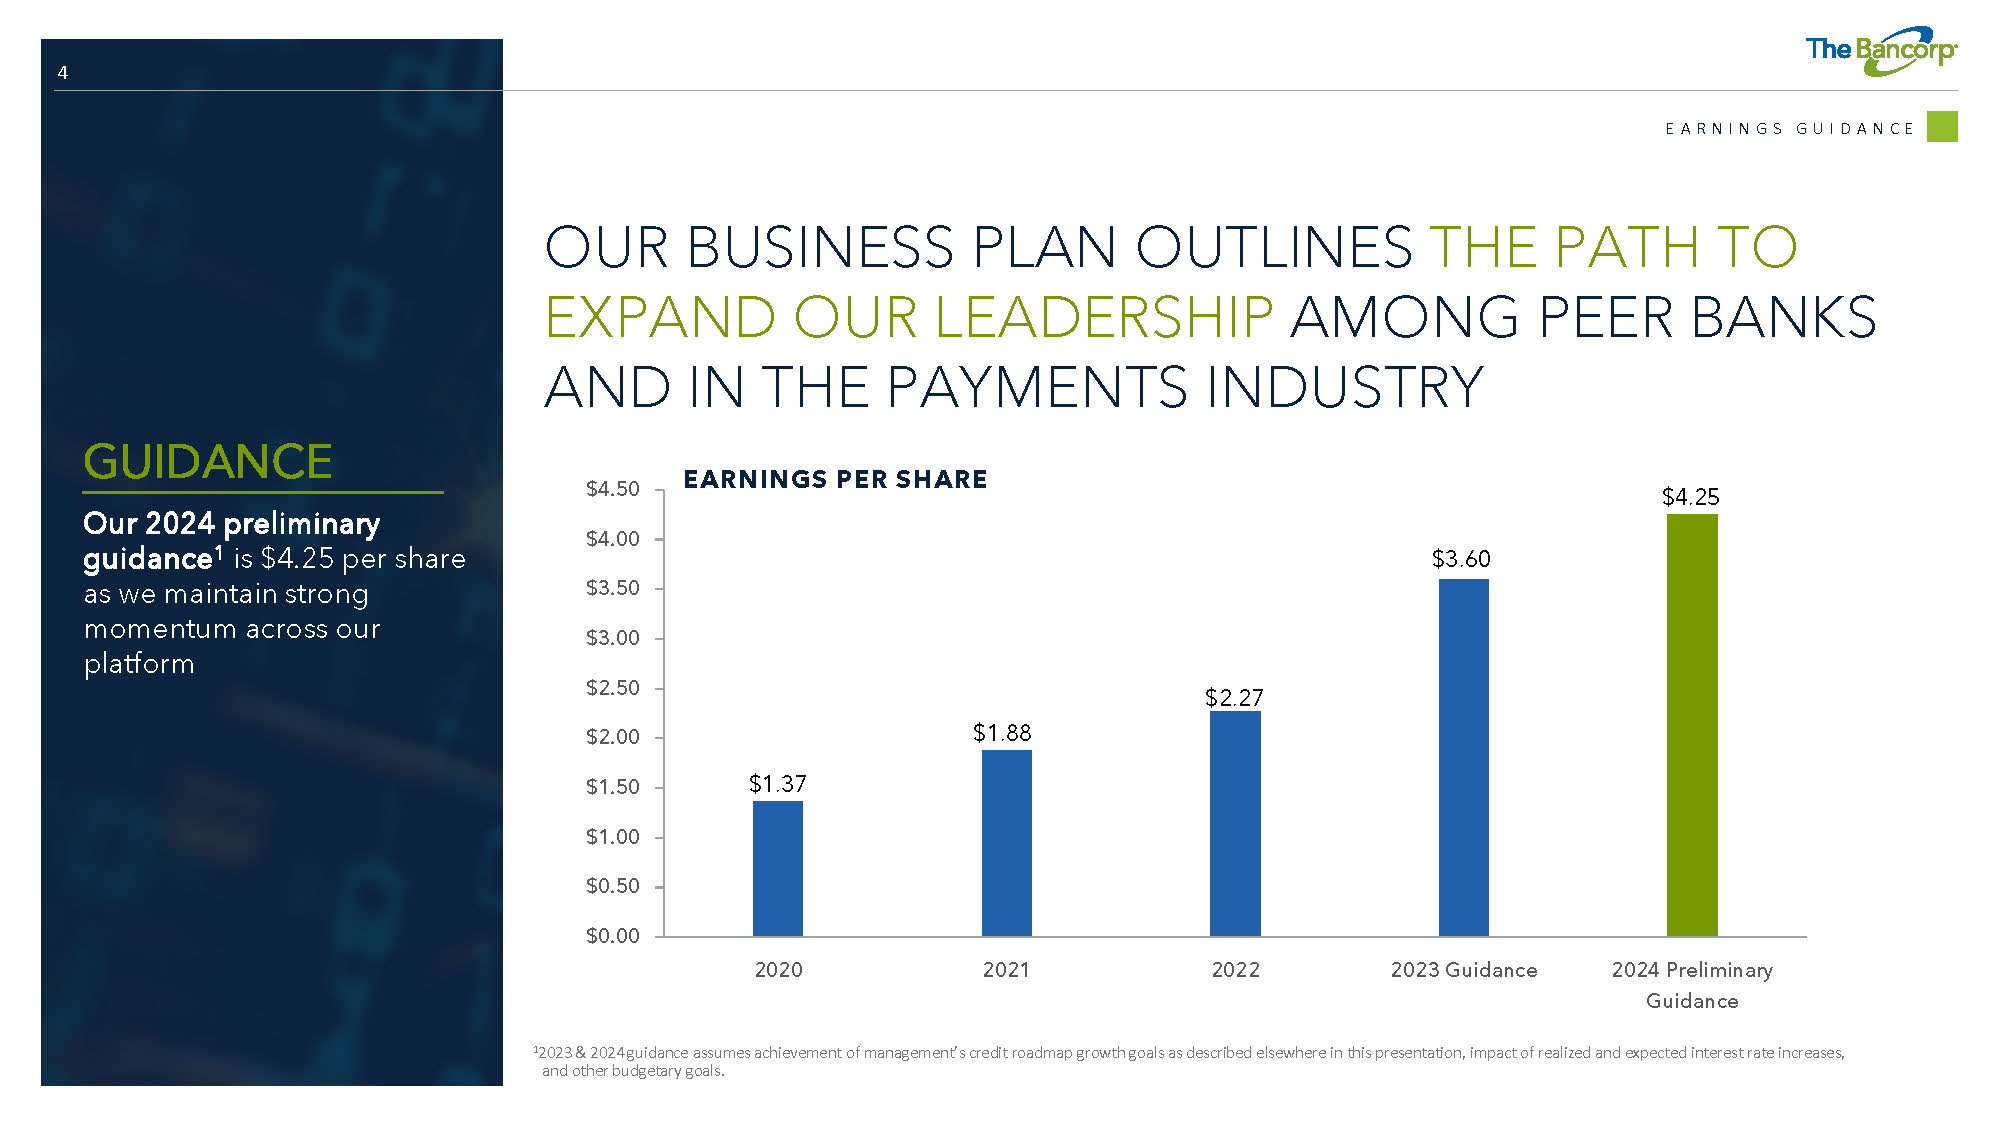
4 OUR BUSINESS PLAN OUTLINES THE PATH TO EXPAND OUR LEADERSHIP AMONG PEER BANKS AND IN THE PAYMENTS INDUSTRY $4.50 $4.00 $3.50 $3.00 $2.50 $2.00 $1.50 $1.00 $0.50 $0.00 2020 2021 2022 2023 Guidance 2024 Preliminary Guidance EARNINGS PER SHARE E A R N I N G S G U I D A N C E GUIDANCE Our 2024 preliminary guidance 1 is $4.25 per share as we maintain strong momentum across our platform 1 2023 & 2024 guidance assumes achievement of management’s credit roadmap growth goals as described elsewhere in this presentation, impact of realized and expected interest rate increases, and other budgetary goals. $1.37 $1.88 $2.27 $3.60 $4.25
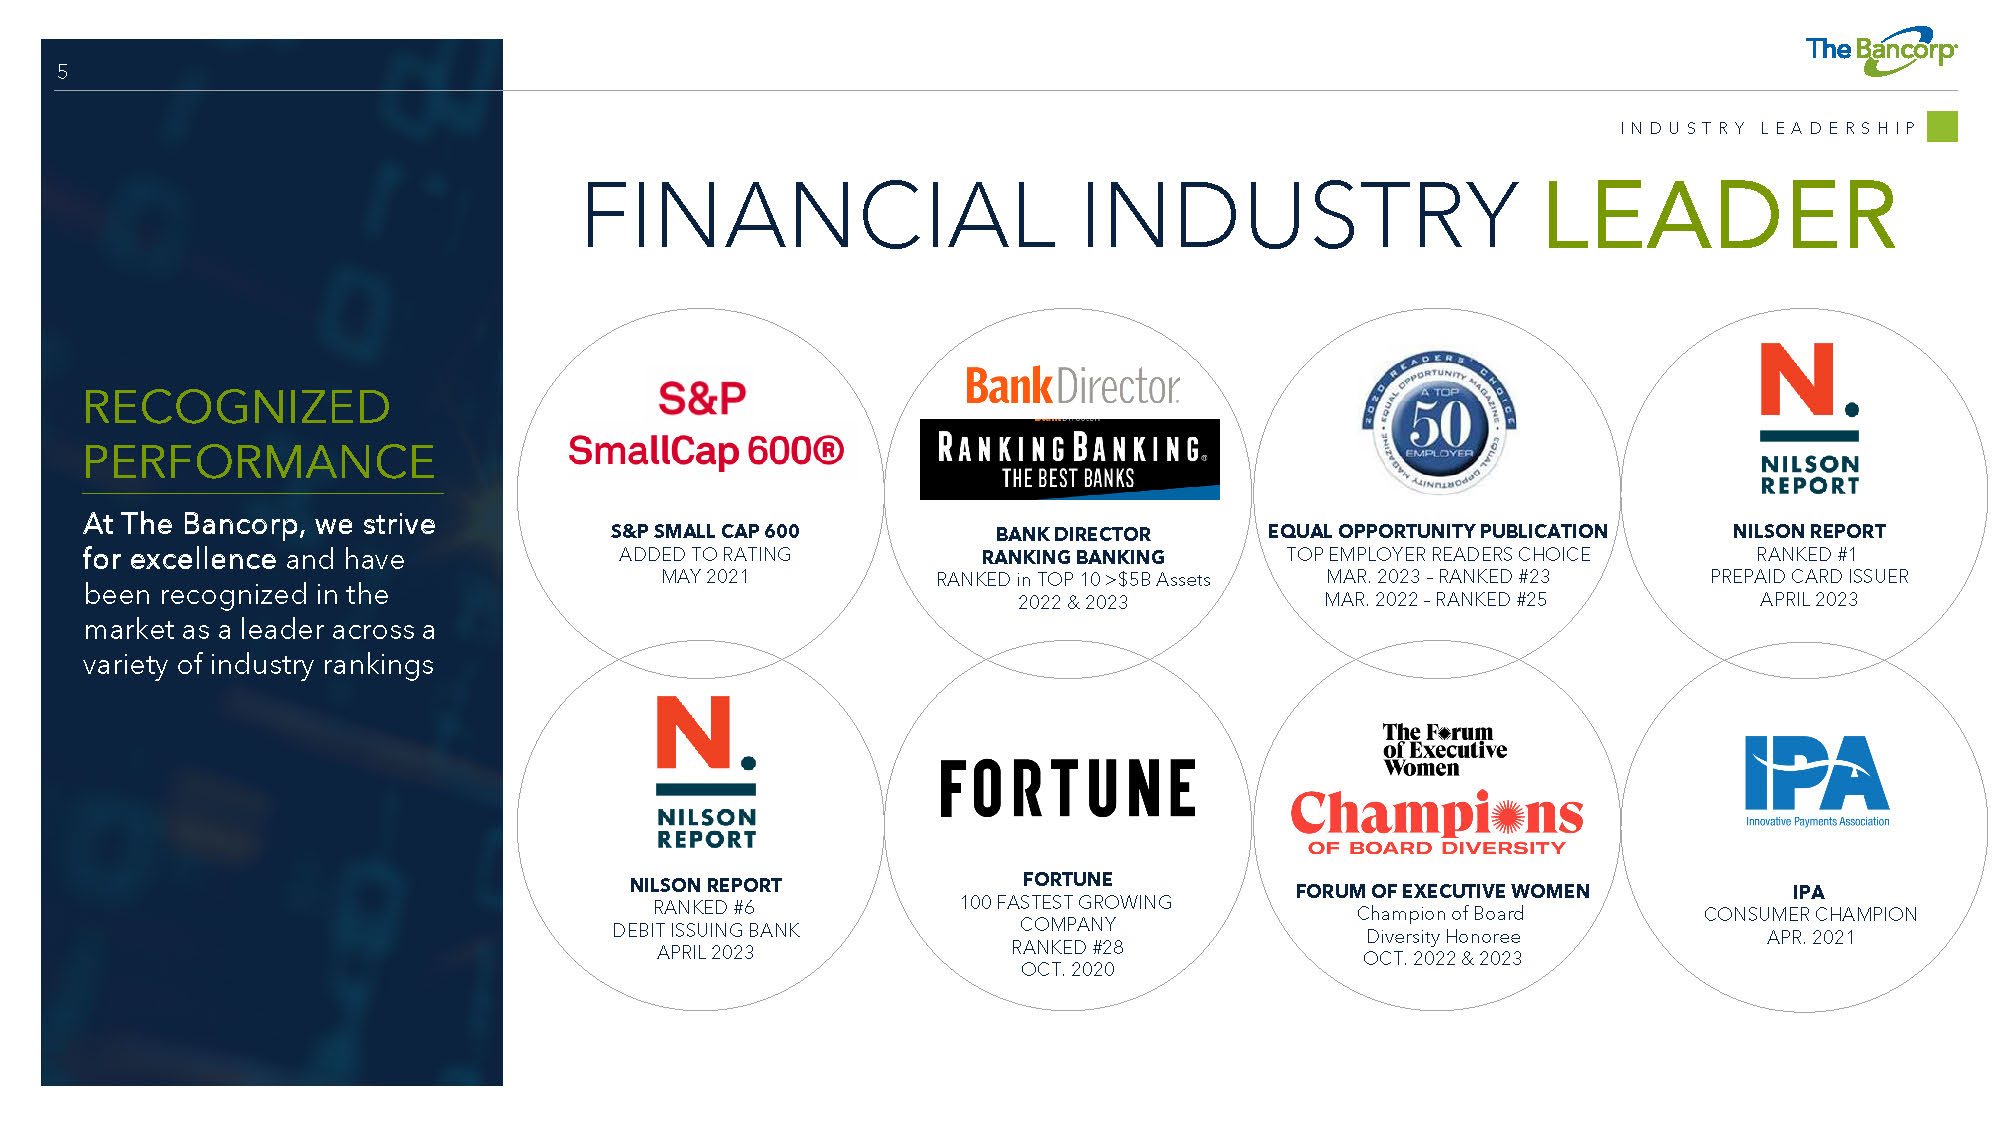
5 FINANCIAL INDUSTRY LEADER FORTUNE 100 FASTEST GROWING COMPANY RANKED #28 OCT. 2020 FORUM OF EXECUTIVE WOMEN Champion of Board Diversity Honoree OCT . 2022 & 2023 IPA CONSUMER CHAMPION APR. 2021 NILSON REPORT RANKED #1 PREPAID CARD ISSUER APRIL 2023 EQUAL OPPORTUNITY PUBLICATION TOP EMPLOYER READERS CHOICE MAR. 2023 – RANKED #23 MAR. 2022 – RANKED #25 S&P SMALL CAP 600 ADDED TO RATING MAY 2021 I N D U S T R Y L E A D E R S H I P NILSON REPORT RANKED #6 DEBIT ISSUING BANK APRIL 2023 RECOGNIZED PERFORMANCE At The Bancorp, we strive for excellence and have been recognized in the market as a leader across a variety of industry rankings BANK DIRECTOR RANKING BANKING RANKED in TOP 10 >$5B Assets 2022 & 2023

6 FINTECH LEADERSHIP THE BANCORP IS A KEY PLAYER IN THE PAYMENTS ECOSYSTEM FINTECH ECOSYSTEM Enabling fintech companies by providing industry leading card issuing, payments facilitation and regulatory expertise to a diversified portfolio of clients PAYMENT NETWORKS FACILITATE payments between parties via the card networks. PROGRAM MANAGERS CLIENT FACING platforms deliver highly scalable banking solutions to customers with emphasis on customer acquisition and technology . REGULATORS OVERSIGHT of domestic banking and payments activities. PROCESSORS BACK - OFFICE support for program managers providing record keeping and core platform services. F I N T E C H E C O S Y S T E M
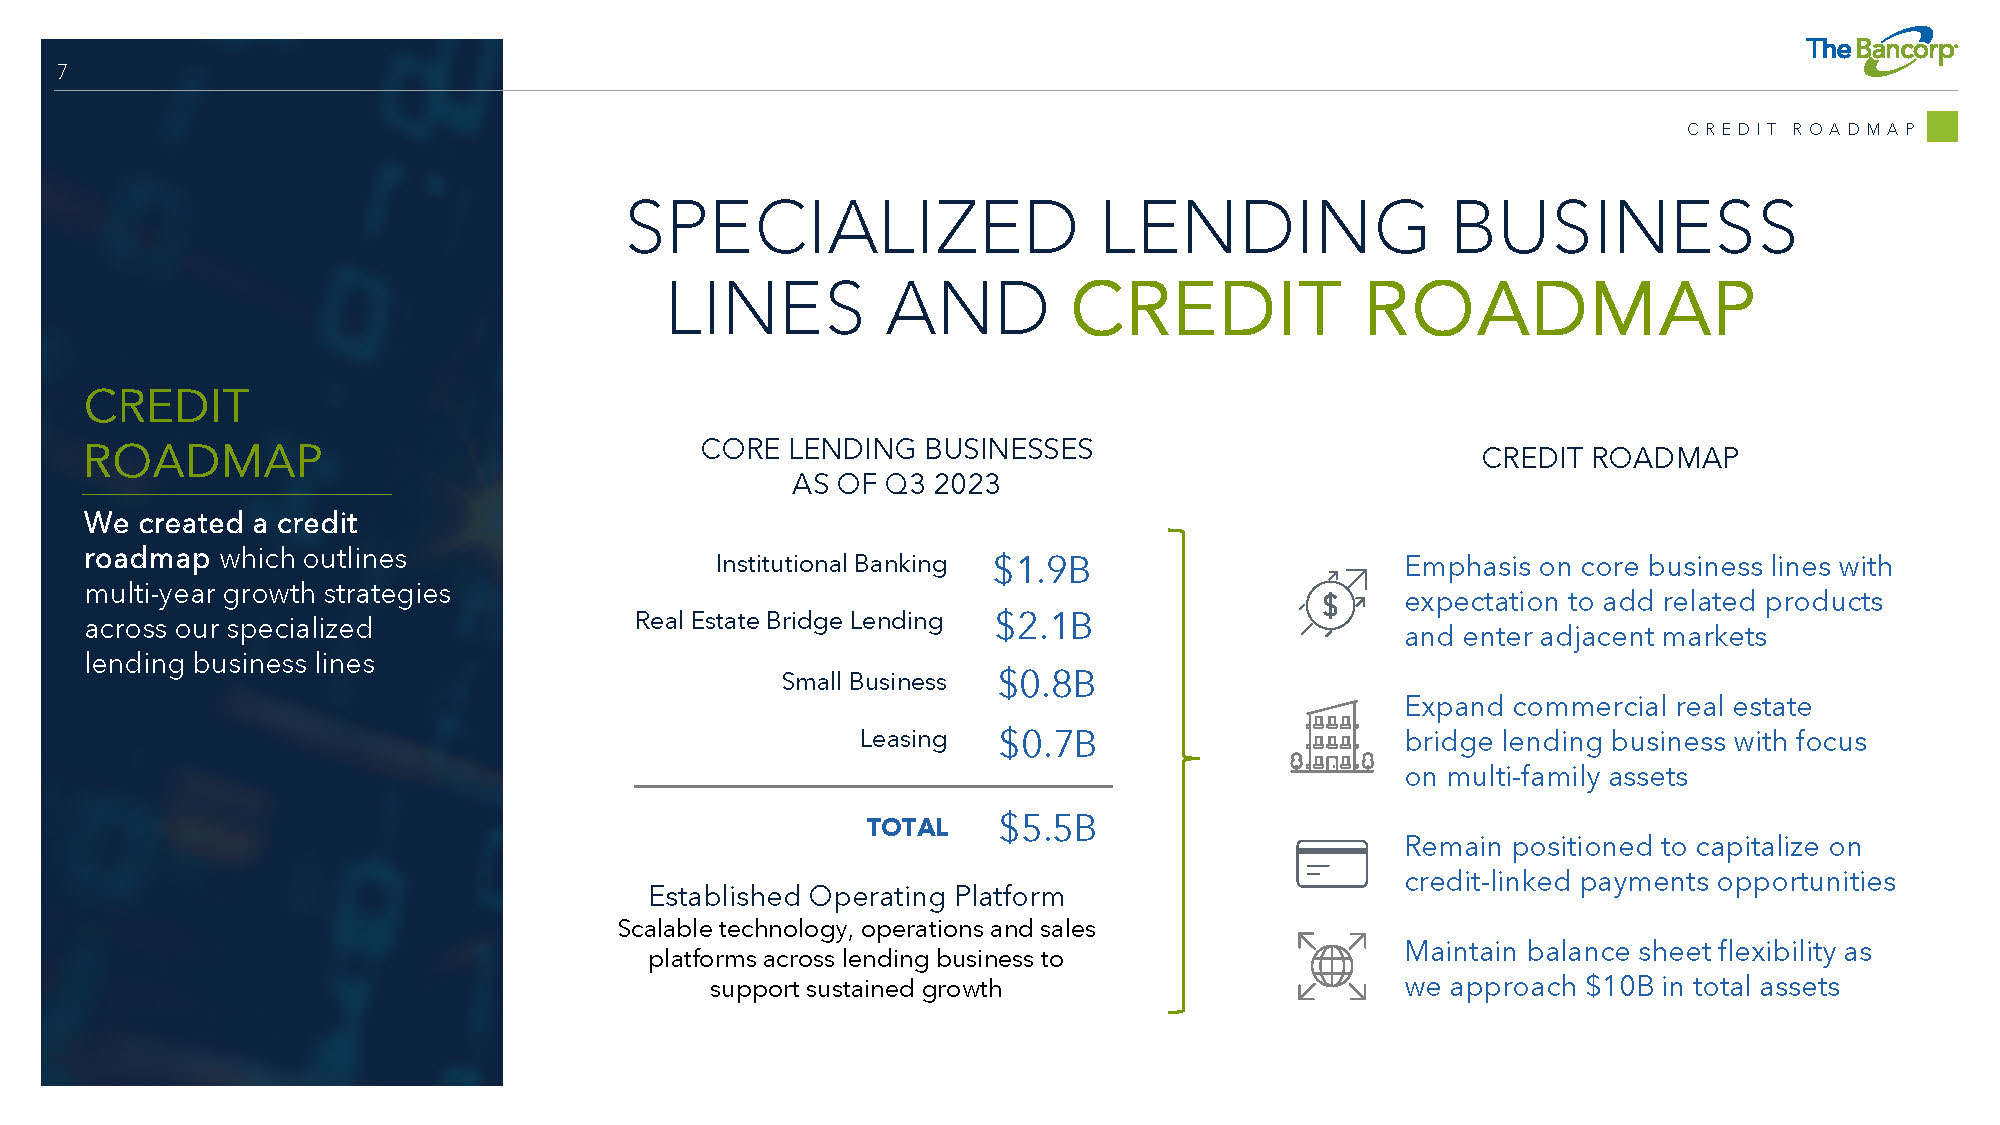
7 SPECIALIZED LENDING BUSINESS LINES AND CREDIT ROADMAP Emphasis on core business lines with expectation to add related products and enter adjacent markets Expand commercial real estate bridge lending business with focus on multi - family assets Remain positioned to capitalize on credit - linked payments opportunities Maintain balance sheet flexibility as we approach $10B in total assets Institutional Banking Real Estate Bridge Lending Small Business Leasing $1.9B $2.1B $0.8B $0.7B CORE LENDING BUSINESSES AS OF Q3 2023 TOTAL $5.5B Established Operating Platform Scalable technology, operations and sales platforms across lending business to support sustained growth CREDIT ROADMAP C R E D I T R O A D M A P CREDIT ROADMAP We created a credit roadmap which outlines multi - year growth strategies across our specialized lending business lines
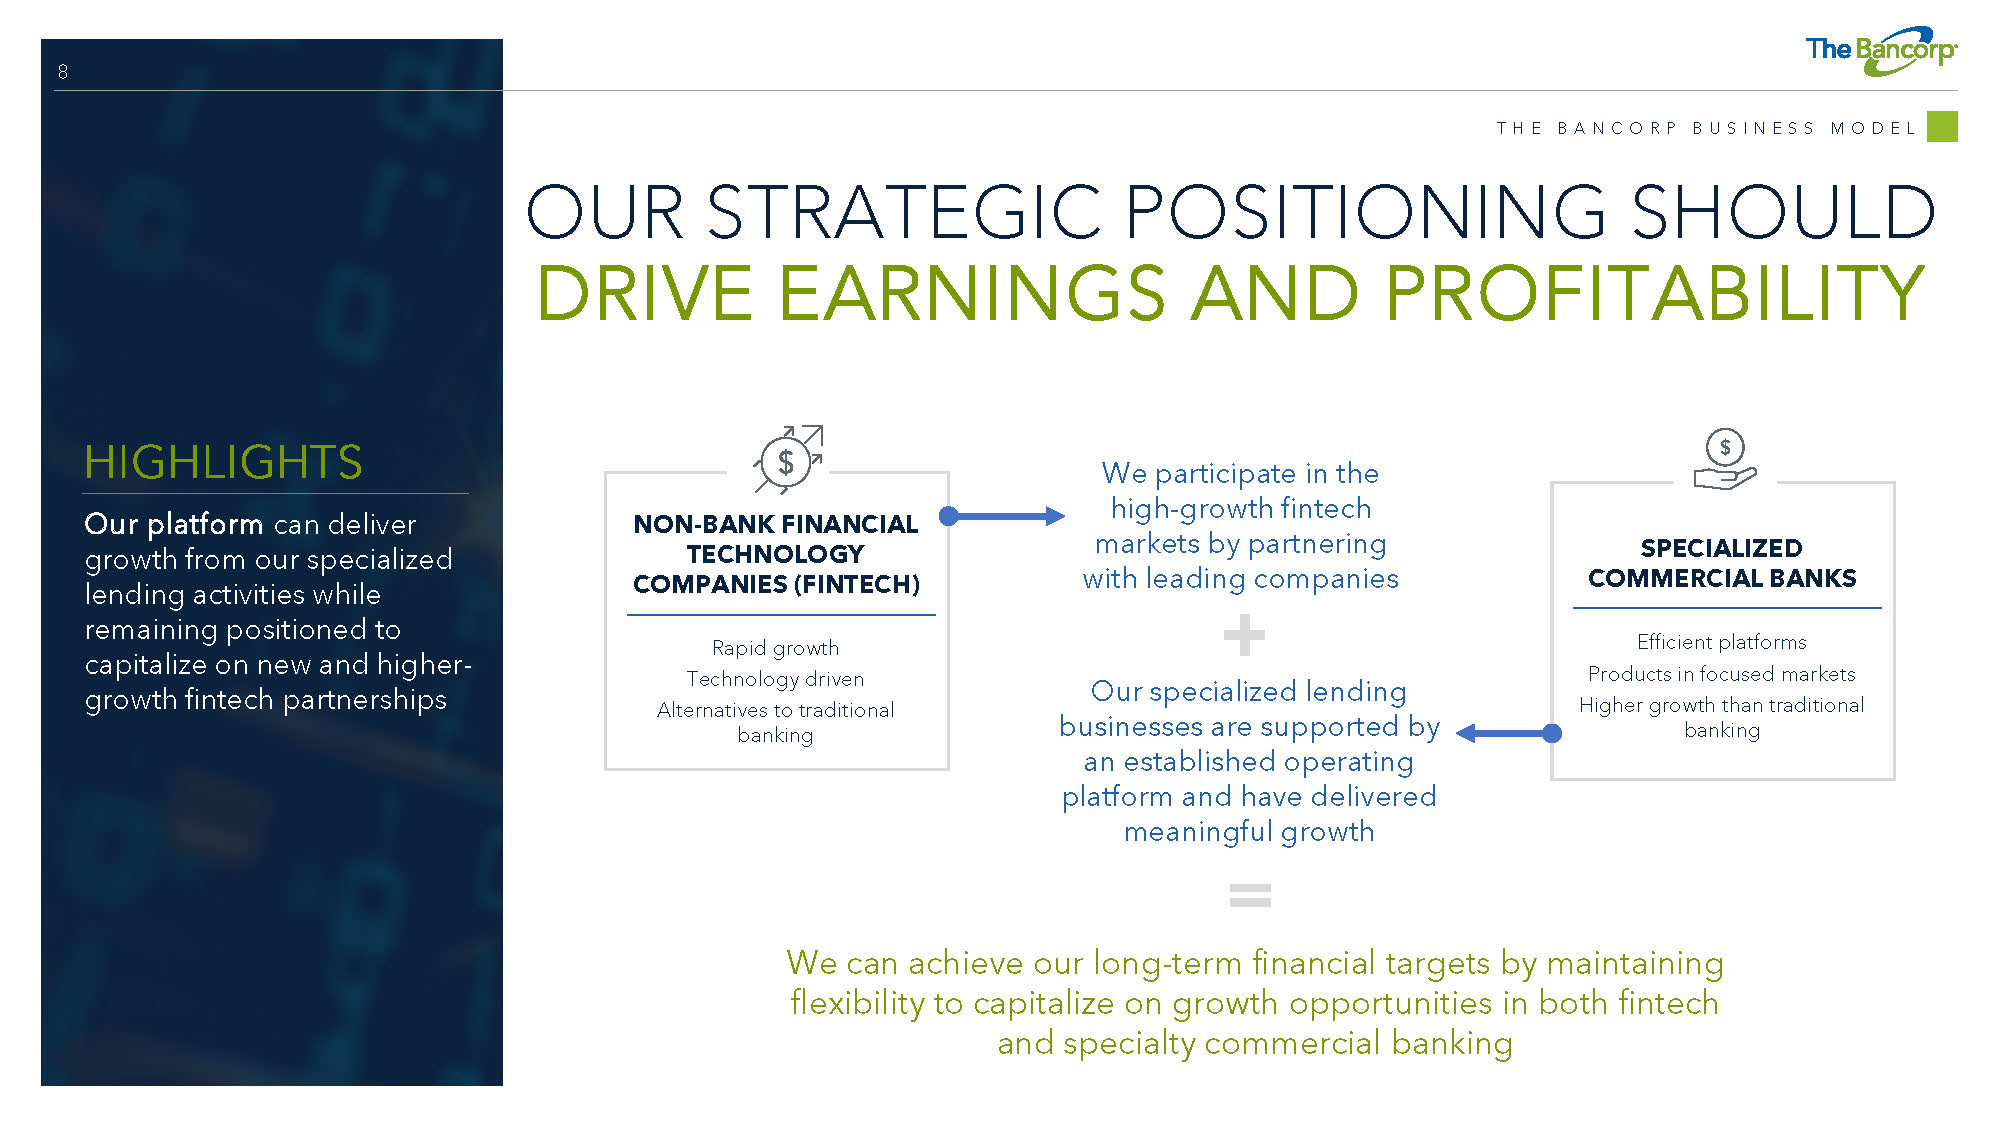
8 OUR STRATEGIC POSITIONING SHOULD DRIVE EARNINGS AND PROFITABILITY HIGHLIGHTS Our platform can deliver growth from our specialized lending activities while remaining positioned to capitalize on new and higher - growth fintech partnerships SPECIALIZED COMMERCIAL BANKS Efficient platforms Products in focused markets Higher growth than traditional banking We can achieve our long - term financial targets by maintaining flexibility to capitalize on growth opportunities in both fintech and specialty commercial banking T H E B A N C O R P B U S I N E S S M O D E L We participate in the high - growth fintech markets by partnering with leading companies Our specialized lending businesses are supported by an established operating platform and have delivered meaningful growth NON - BANK FINANCIAL TECHNOLOGY COMPANIES (FINTECH) Rapid growth Technology driven Alternatives to traditional banking
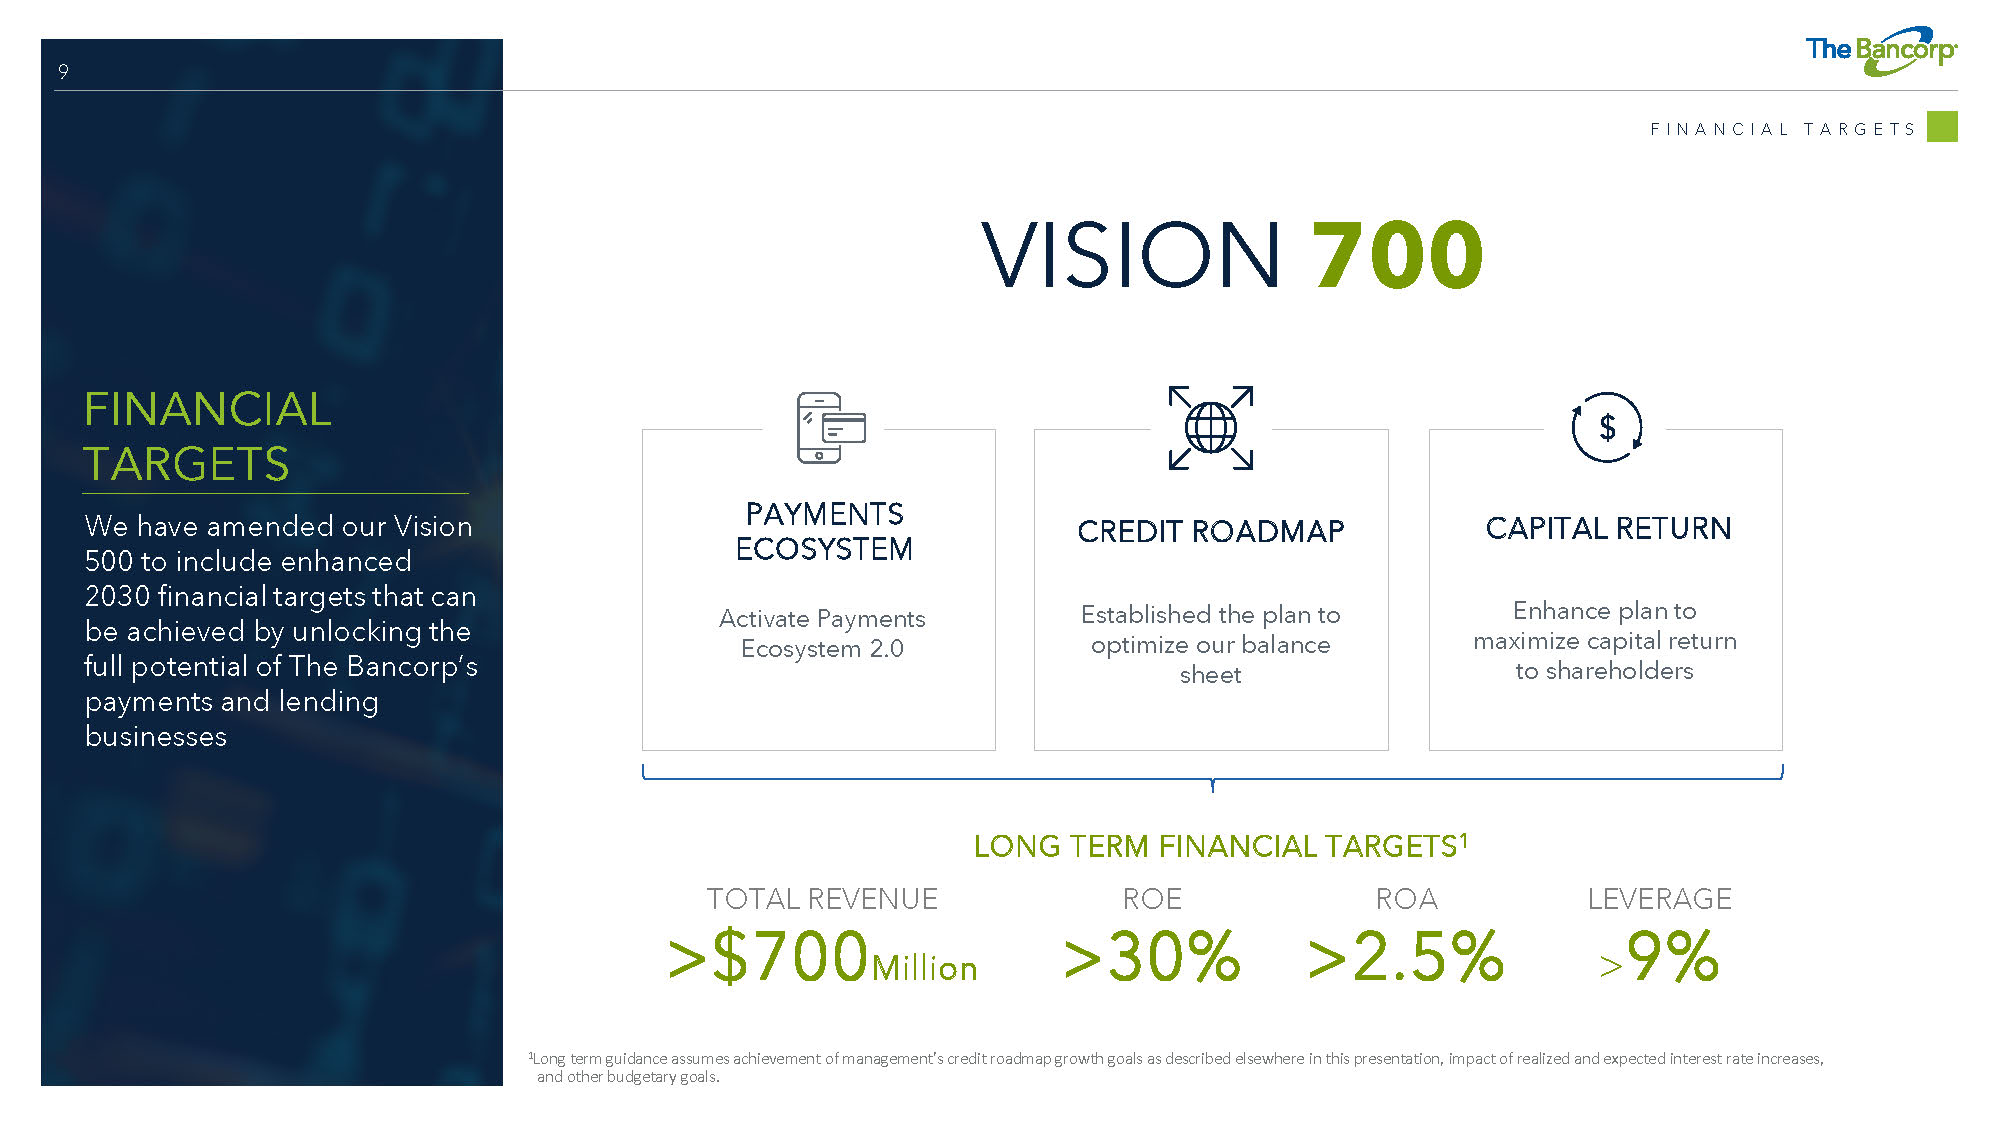
9 FINANCIAL TARGETS We have amended our Vision 500 to include enhanced 2030 financial targets that can be achieved by unlocking the full potential of The Bancorp’s payments and lending businesses CAPITAL RETURN Established the plan to optimize our balance sheet Enhance plan to maximize capital return to shareholders PAYMENTS ECOSYSTEM Activate Payments Ecosystem 2.0 CREDIT ROADMAP LONG TERM FINANCIAL TARGETS 1 TOTAL REVENUE ROE ROA LEVERAGE >$700 Million >30% >2.5% > 9% F I N A N C I A L T A R G E T S 1 Long term guidance assumes achievement of management’s credit roadmap growth goals as described elsewhere in this presentation, impact of realized and expected interest rate increases, and other budgetary goals. VISION 700

10 FINTECH SOLUTIONS GENERATES NON - INTEREST INCOME AND ATTRACTS STABLE, LOWER - COST DEPOSITS DEPLOYED INTO LOWER RISK ASSETS IN SPECIALIZED MARKETS FINTECH SOLUTIONS Enabling fintech companies by providing card sponsorship and facilitating other payments activities INSTITUTIONAL BANKING Lending solutions for wealth management firms + COMMERCIAL LENDING Small business lending and commercial fleet leasing T H E B A N C O R P B U S I N E S S M O D E L P A Y M EN TS & D E P O S I TS Market - leading payments activities generate non - interest income and stable, lower - cost deposits L E ND I NG Highly specialized lending products in high - growth markets T H E B A N C O R P B U S I N E S S M O D E L REAL ESTATE BRIDGE LENDING Focus on multi - family assets in high - growth markets
DEPOSITS & FEES: FINTECH SOLUTIONS GENERATES NON - INTEREST INCOME AND STABLE, LOWER - COST DEPOSITS
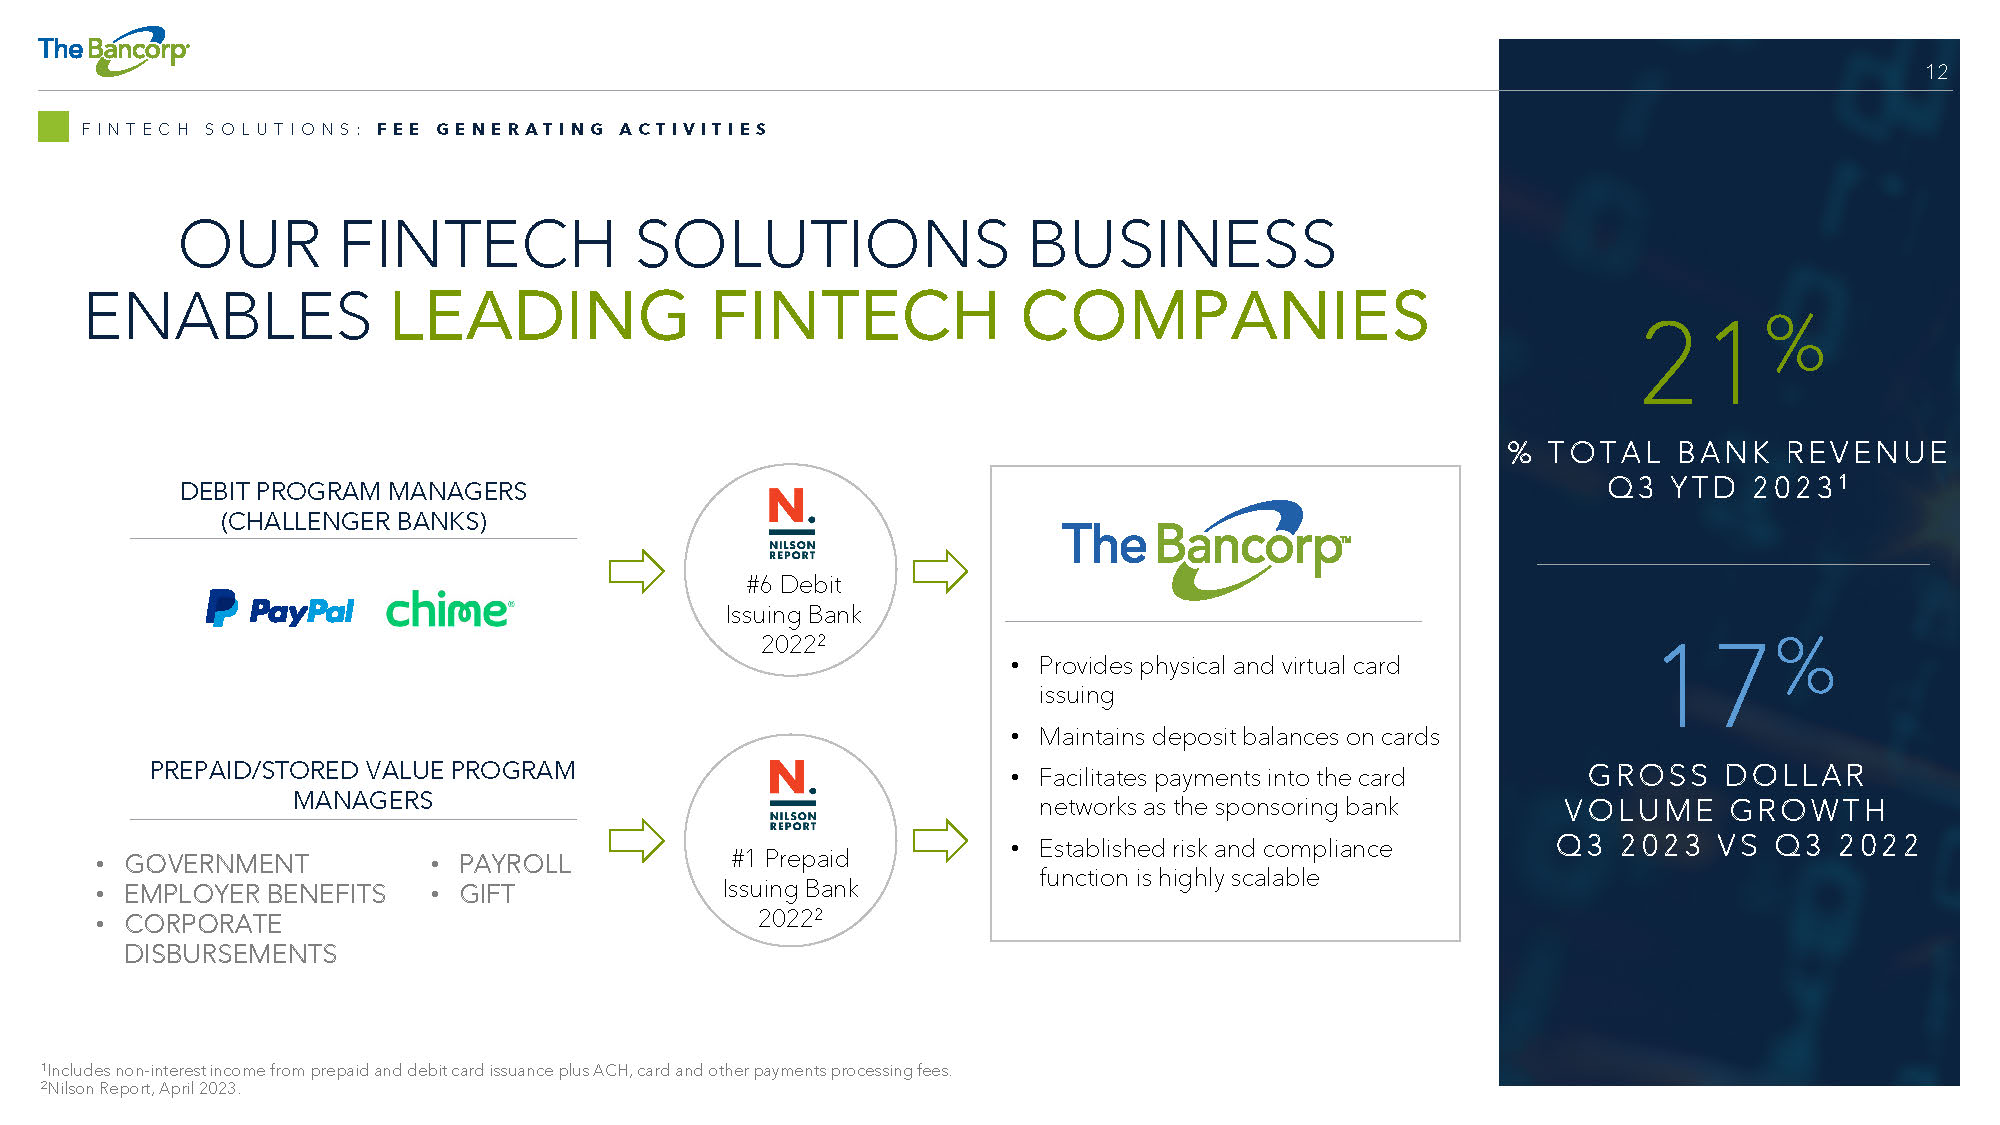
12 F I N T E C H S O L U T I O N S : F E E G E N E R A T I N G A C T I V I T I E S OUR FINTECH SOLUTIONS BUSINESS ENABLES LEADING FINTECH COMPANIES DEBIT PROGRAM MANAGERS (CHALLENGER BANKS) PREPAID/STORED VALUE PROGRAM MANAGERS • Provides physical and virtual card issuing • Maintains deposit balances on cards • Facilitates payments into the card networks as the sponsoring bank • Established risk and compliance function is highly scalable #6 Debit Issuing Bank 2022 2 #1 Prepaid Issuing Bank 2022 2 21 % % T O T AL B ANK R E VE NU E Q 3 Y T D 2023 1 GR OS S D OL L A R V OL U ME GR OW T H Q 3 2023 V S Q 3 2022 17 % • GOVERNMENT • EMPLOYER BENEFITS • CORPORATE DISBURSEMENTS • PAYROLL • GIFT 1 Includes non - interest income from prepaid and debit card issuance plus ACH, card and other payments processing fees. 2 Nilson Report, April 2023.
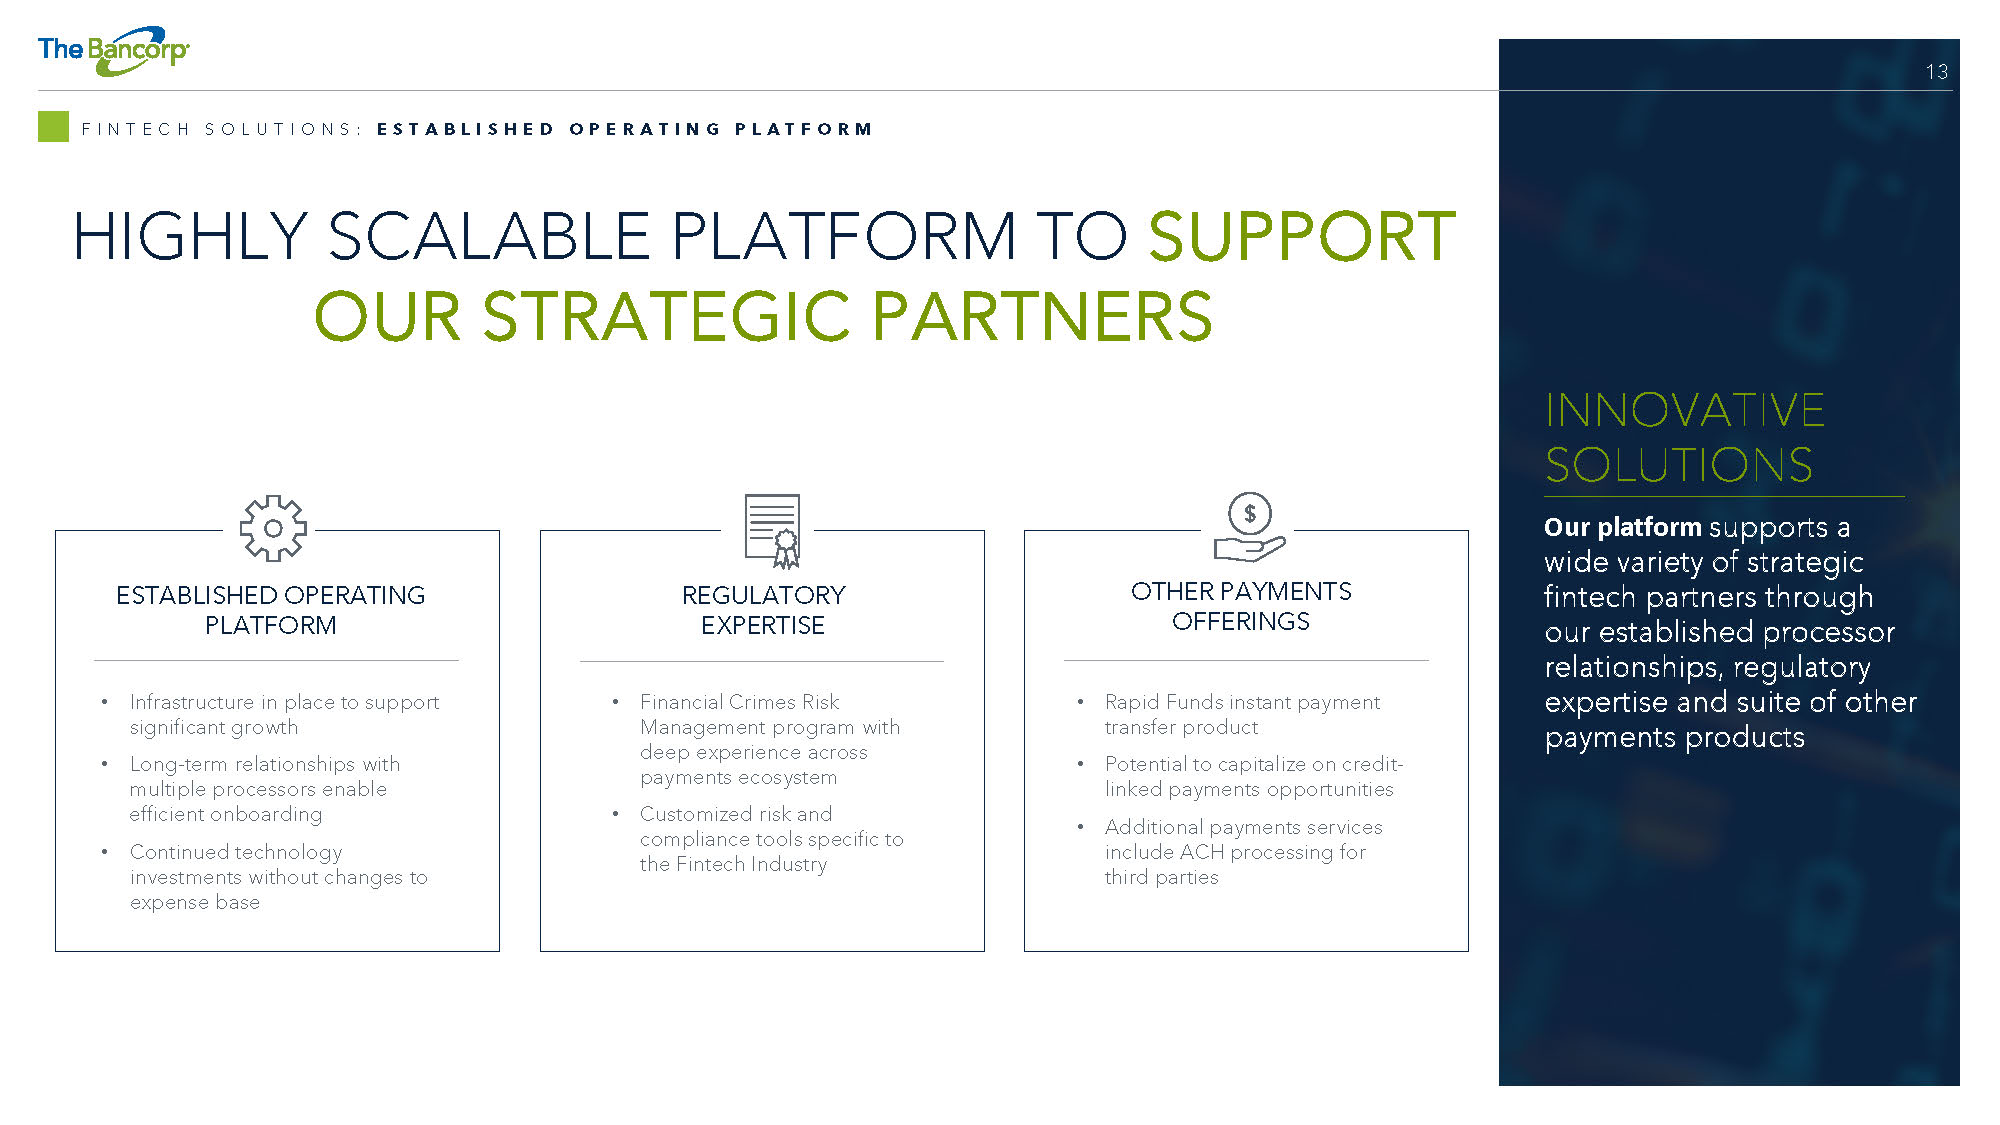
13 F I N T E C H S O L U T I O N S : E S T A B L I S H E D O P E R A T I N G P L A T F O R M HIGHLY SCALABLE PLATFORM TO SUPPORT OUR STRATEGIC PARTNERS ESTABLISHED OPERATING PLATFORM • Infrastructure in place to support significant growth • Long - term relationships with multiple processors enable efficient onboarding • Continued technology investments without changes to expense base REGULATORY EXPERTISE • Financial Crimes Risk Management program with deep experience across payments ecosystem • Customized risk and compliance tools specific to the Fintech Industry OTHER PAYMENTS OFFERINGS • Rapid Funds instant payment transfer product • Potential to capitalize on credit - linked payments opportunities • Additional payments services include ACH processing for third parties INNOVATIVE SOLUTIONS Our platform supports a wide variety of strategic fintech partners through our established processor relationships, regulatory expertise and suite of other payments products
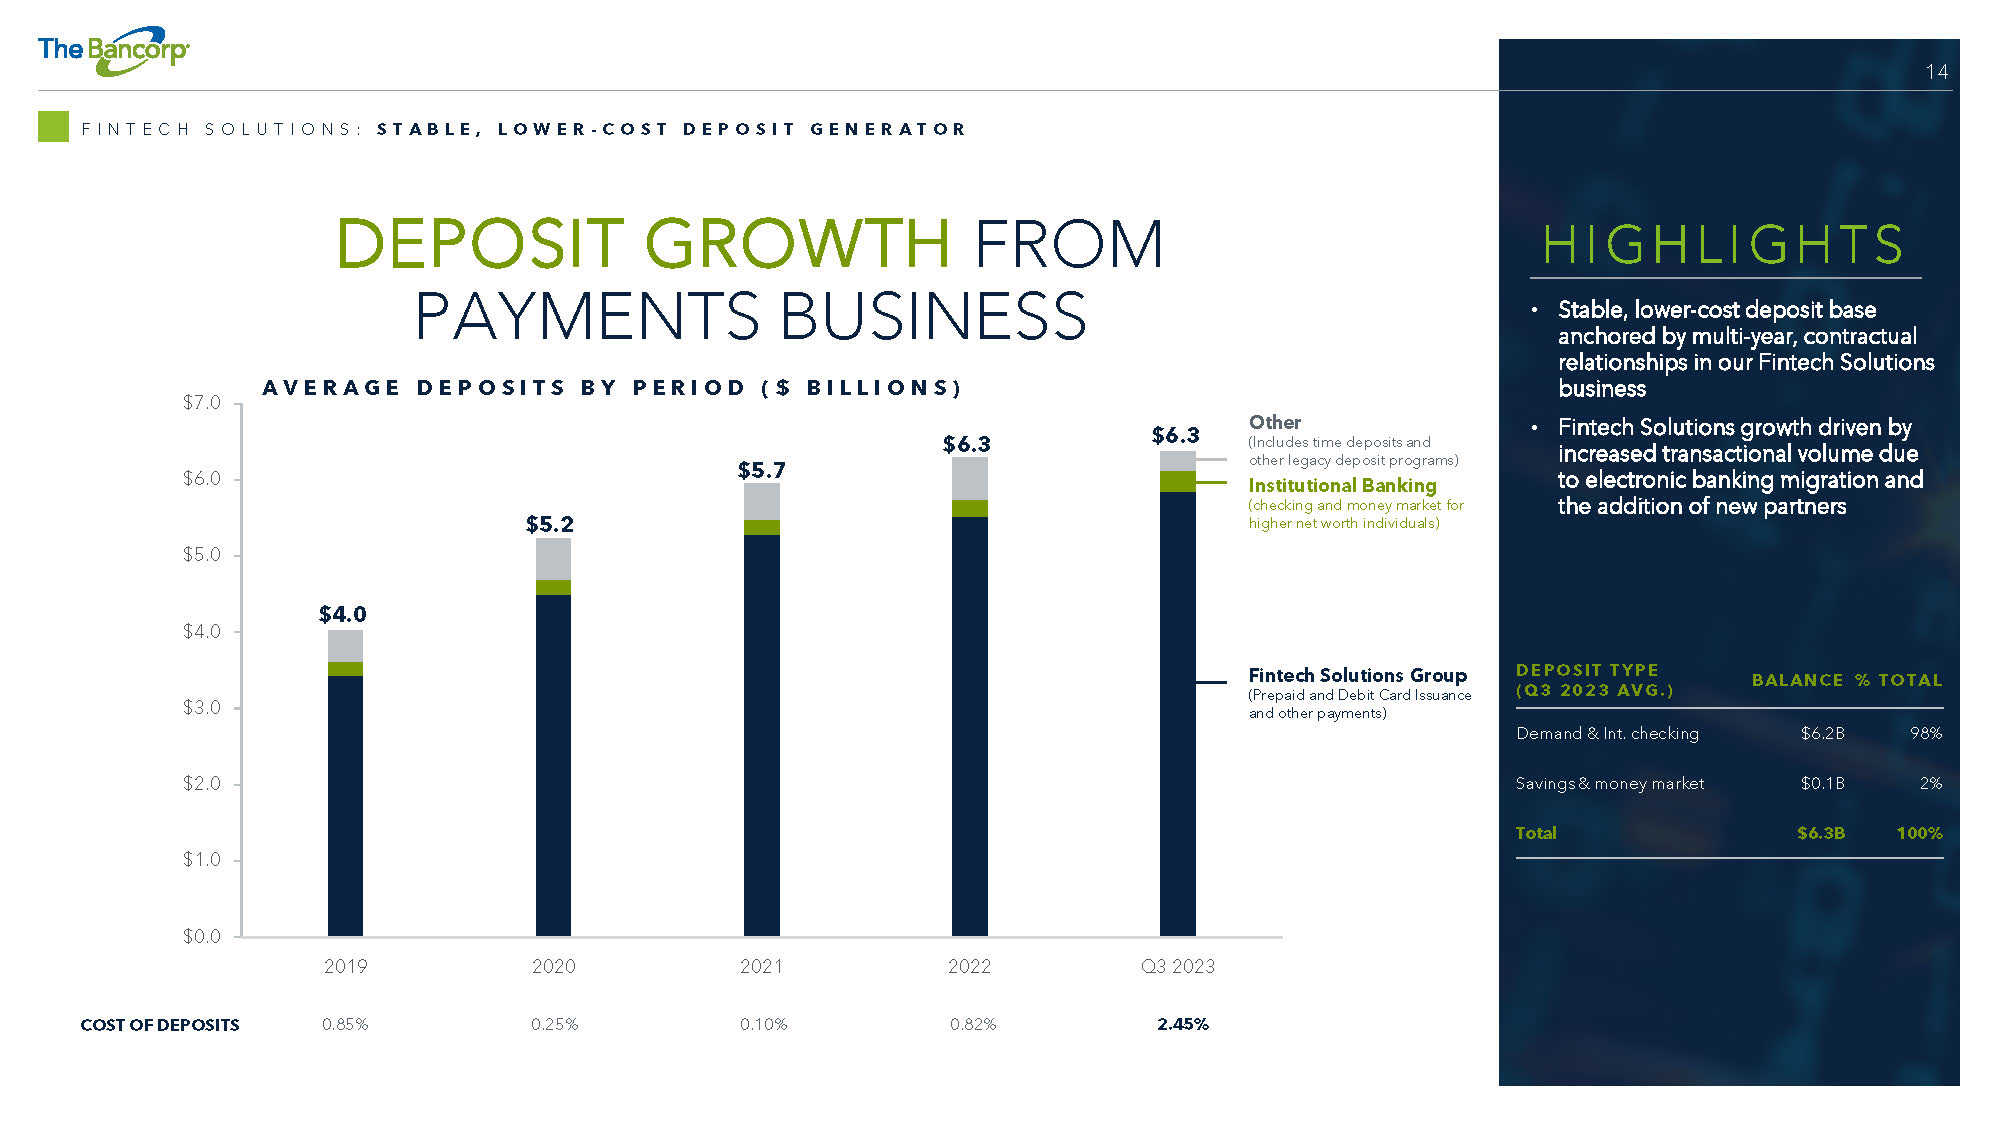
14 DEPOSIT GROWTH FROM PAYMENTS BUSINESS F I N T E C H S O L U T I O N S : S T A B L E , L O W E R - C O S T D E P O S I T G E N E R A T O R $2.0 $1.0 $0.0 $3.0 $4.0 $5.0 $6.0 $7.0 2019 2020 2021 2022 Q3 2023 A V E R A G E D E P O S I T S B Y P E R I O D ( $ B I L L I O N S ) Fintech Solutions Group (Prepaid and Debit Card Issuance and other payments) Institutional Banking (checking and money market for higher net worth individuals) Other (Includes time deposits and other legacy deposit programs) H I GH L I GH TS • Stable, lower - cost deposit base anchored by multi - year, contractual relationships in our Fintech Solutions business • Fintech Solutions growth driven by increased transactional volume due to electronic banking migration and the addition of new partners % TOTAL B ALANC E DEPOS IT TYPE ( Q 3 2023 AVG . ) 98% $6.2B Demand & Int. checking 2% $0.1B Savings & money market 100% $6.3B Total 2.45% 0.82% 0.10% 0.25% 0.85% COST OF DEPOSITS $4.0 $5.2 $5.7 $6.3 $6.3
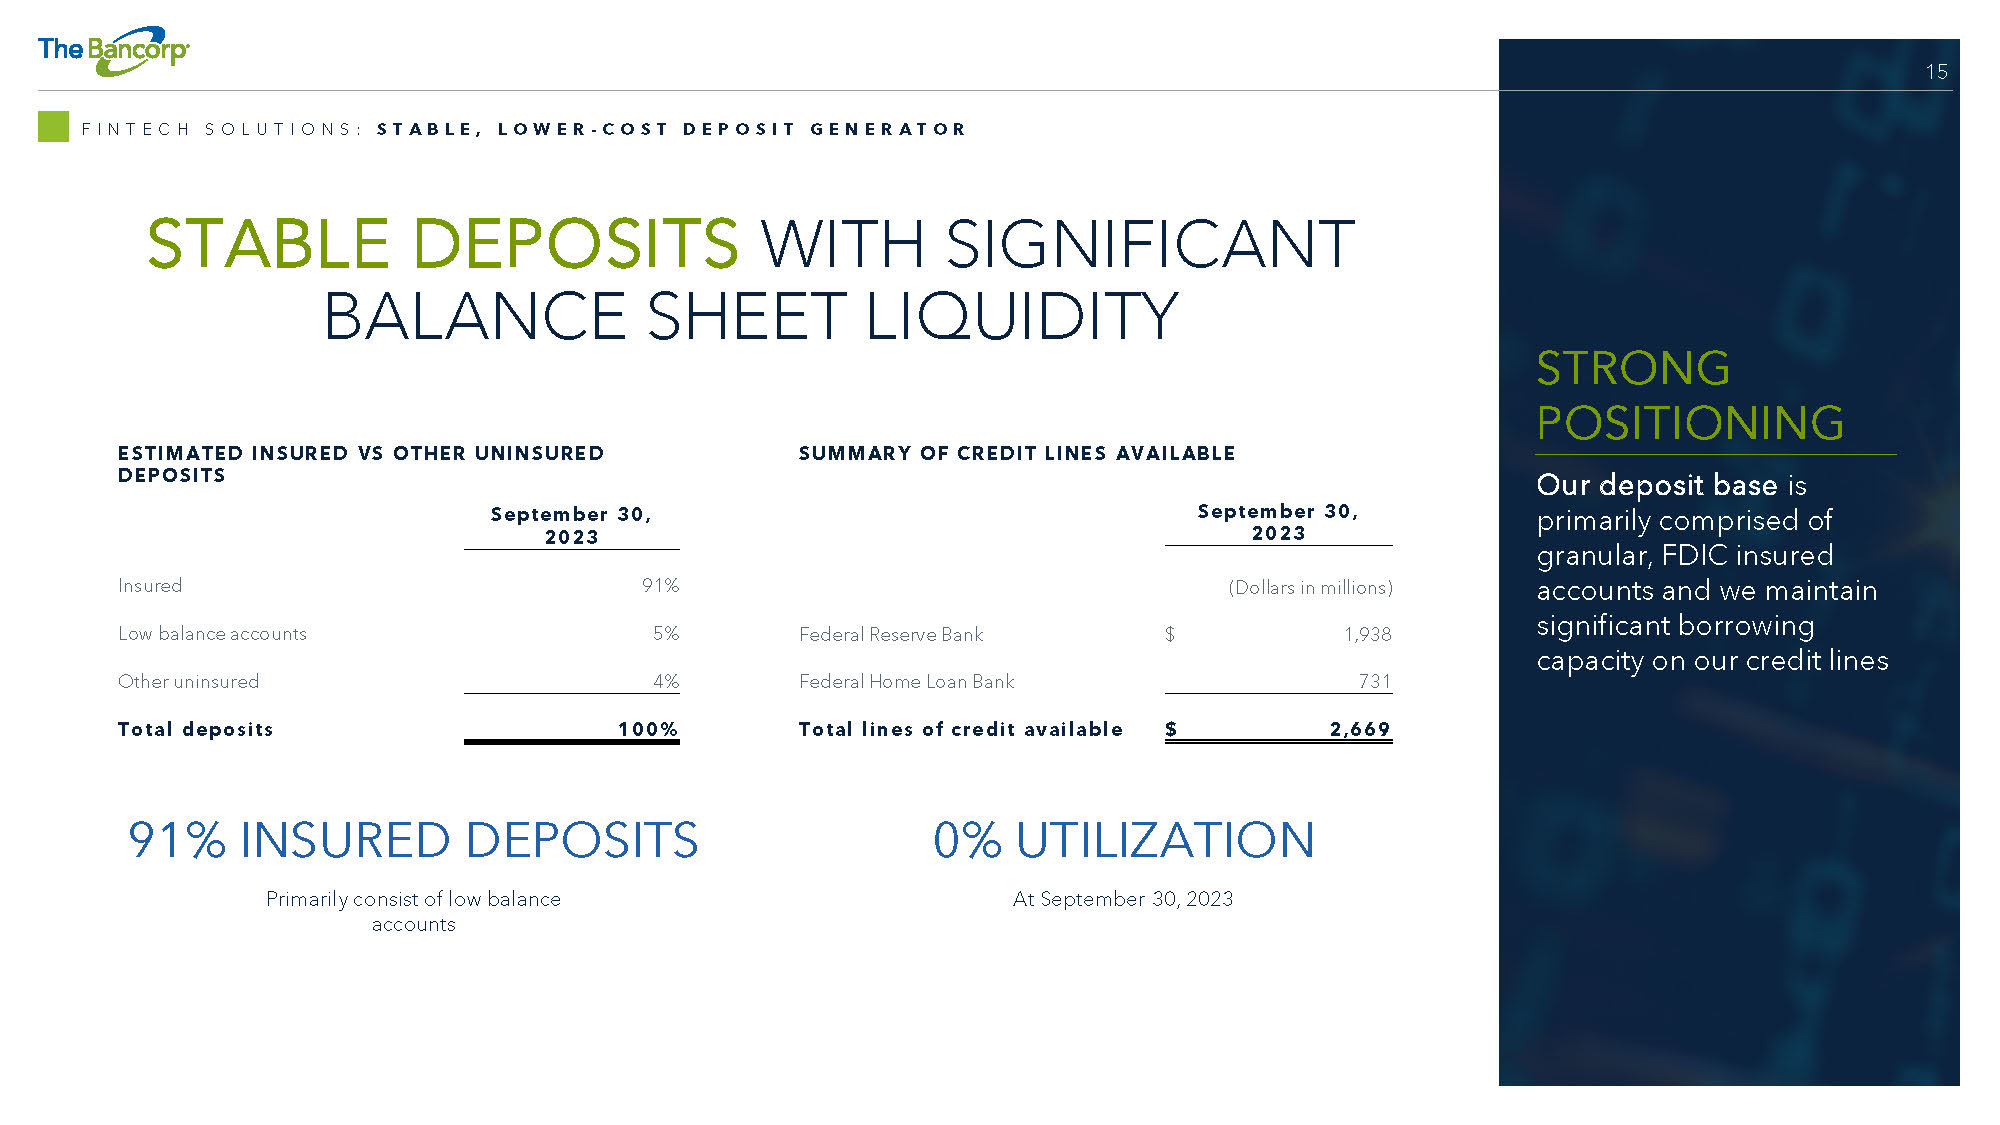
15 STABLE DEPOSITS WITH SIGNIFICANT BALANCE SHEET LIQUIDITY F I N T E C H S O L U T I O N S : S T A B L E , L O W E R - C O S T D E P O S I T G E N E R A T O R ESTIMATED INSURED VS OTHER UNINSURED DEPOSITS September 30 , 2023 91% Insured 5% Low balance accounts 4% Other uninsured 100% Total deposits SUMMARY OF CREDIT LINES AVAILABLE September 30 , 2023 (Dollars in millions) 1,938 $ Federal Reserve Bank 731 Federal Home Loan Bank 2, 669 $ Total l ines of credit available STRONG POSITIONING Our deposit base is primarily comprised of granular, FDIC insured accounts and we maintain significant borrowing capacity on our credit lines 91% INSURED DEPOSITS Primarily consist of low balance accounts 0% UTILIZATION At September 30, 2023

LOANS & LEASES: HIGHLY SPECIALIZED LENDING WITH LOW LOSS HISTORIES
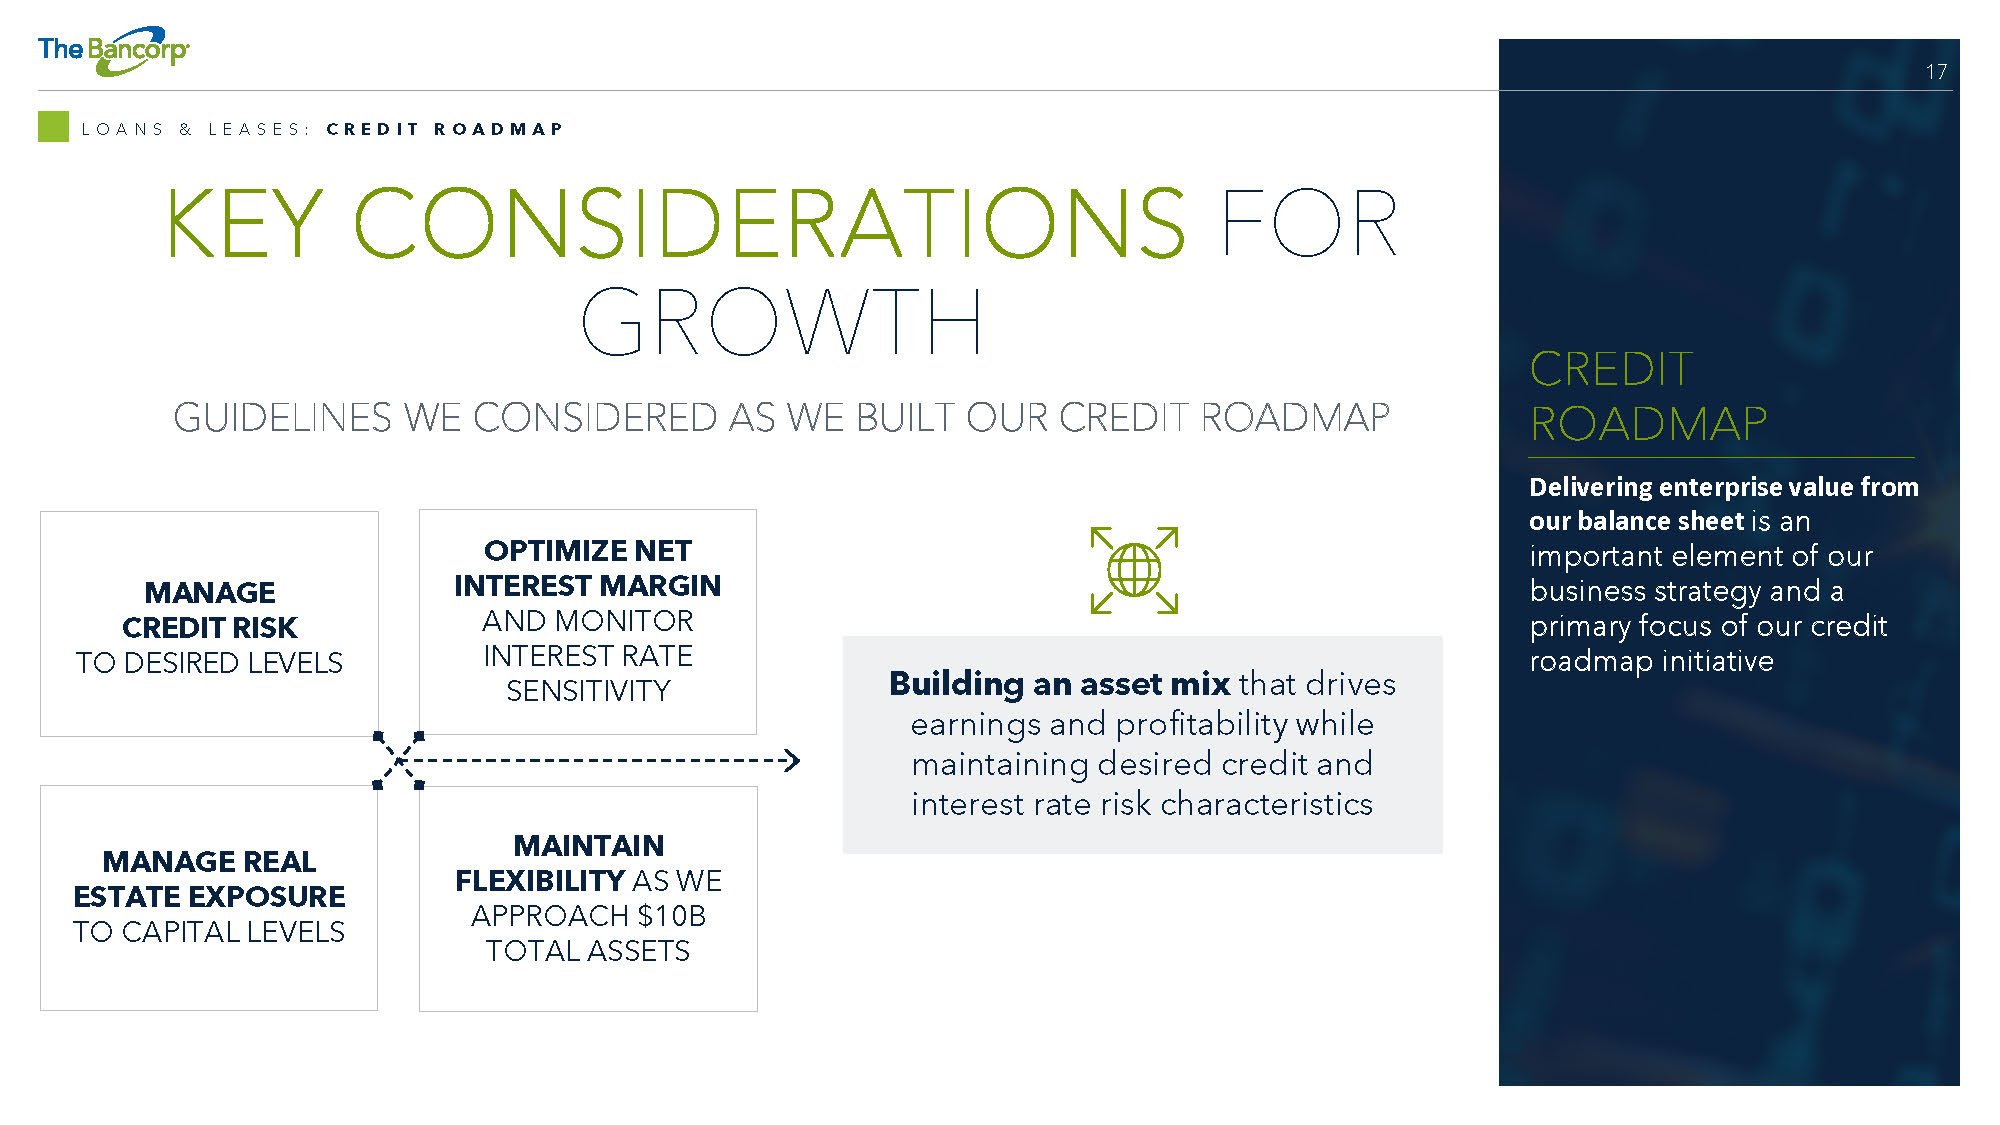
17 L O A N S & L E A S E S : C R E D I T R O A D M A P CREDIT ROADMAP Delivering enterprise value from our balance sheet is an important element of our business strategy and a primary focus of our credit roadmap initiative MANAGE CREDIT RISK TO DESIRED LEVELS OPTIMIZE NET INTEREST MARGIN AND MONITOR INTEREST RATE SENSITIVITY MANAGE REAL ESTATE EXPOSURE TO CAPITAL LEVELS MAINTAIN FLEXIBILITY AS WE APPROACH $10B TOTAL ASSETS Building an asset mix that drives earnings and profitability while maintaining desired credit and interest rate risk characteristics KEY CONSIDERATIONS FOR GROWTH GUIDELINES WE CONSIDERED AS WE BUILT OUR CREDIT ROADMAP
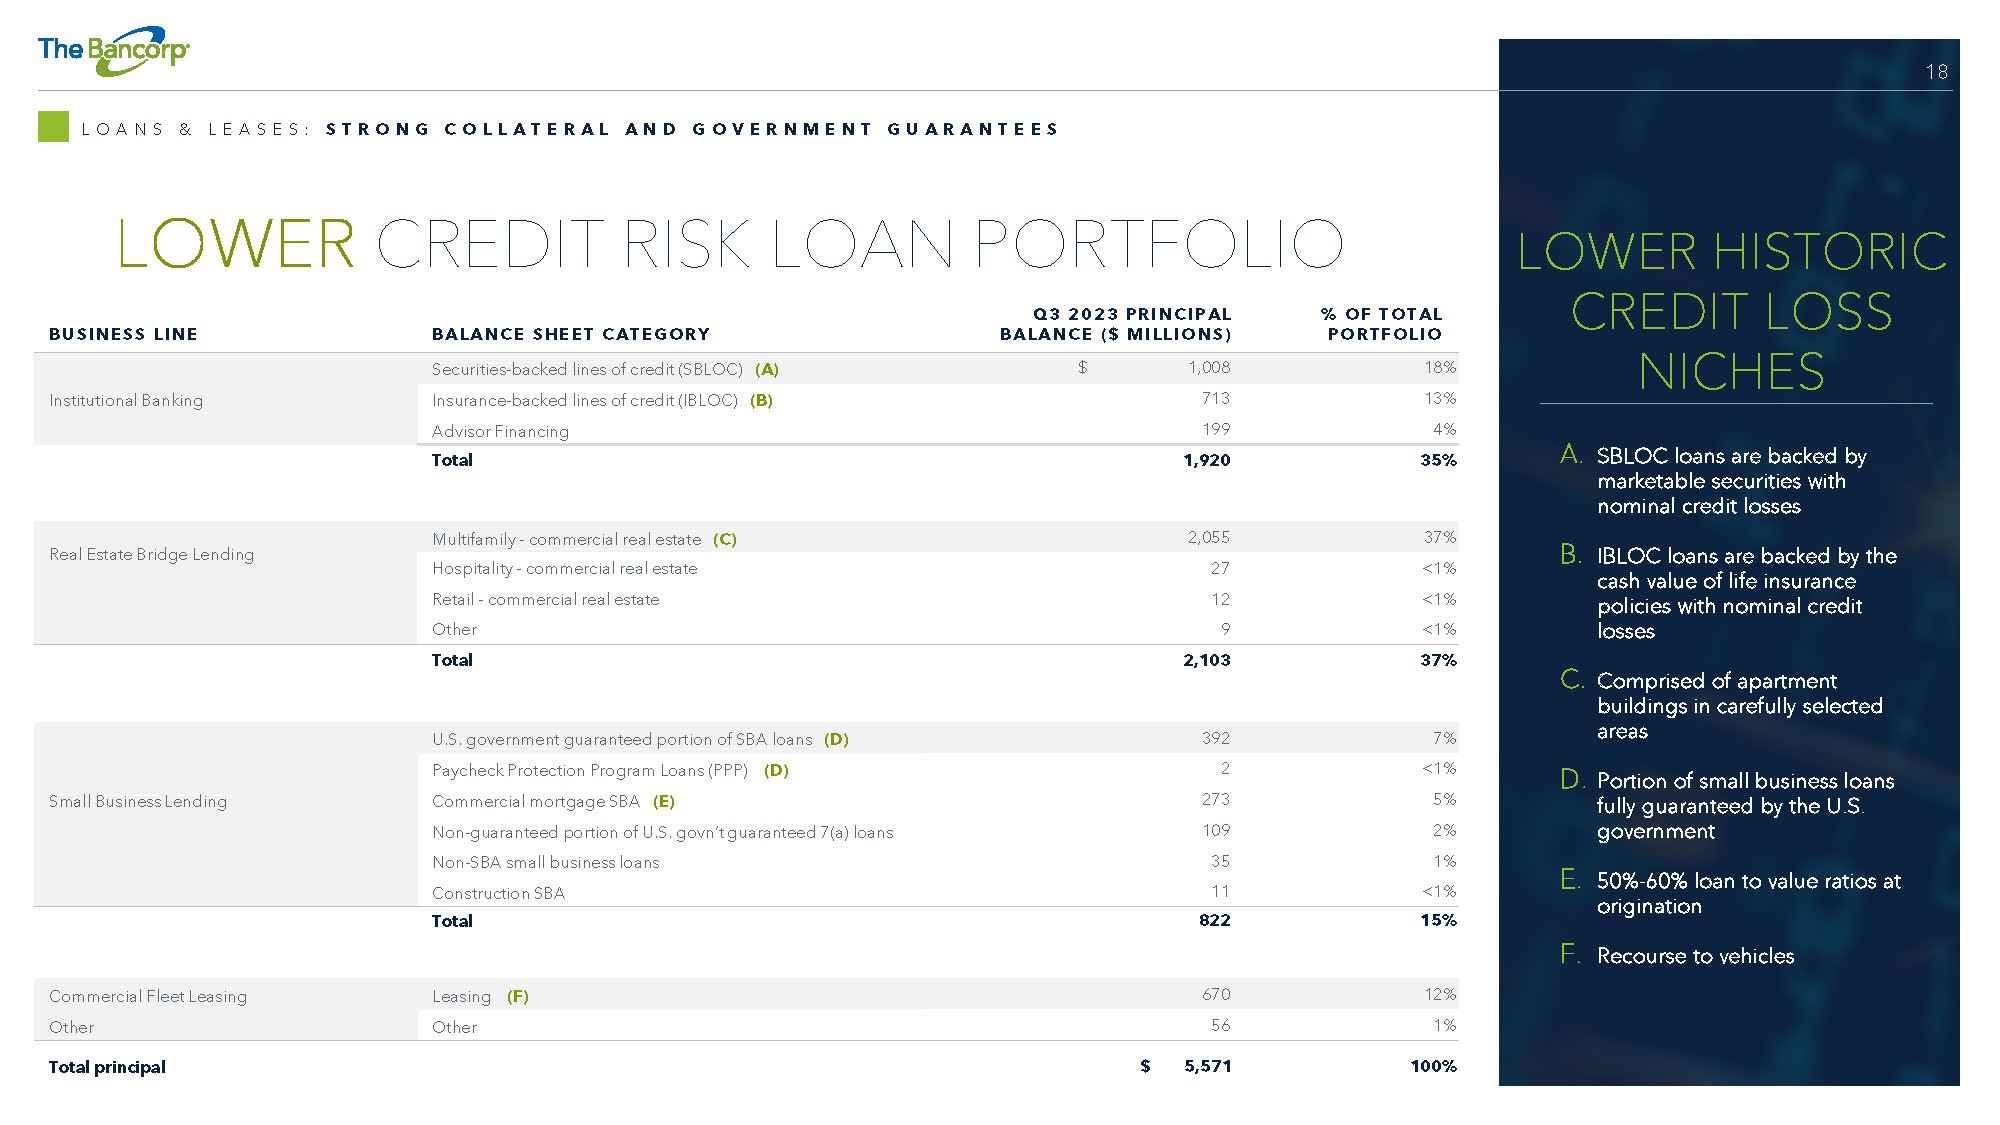
18 LOWER CREDIT RISK LOAN PORTFOLIO L O A N S & L E A S E S : S T R O N G C O L L A T E R A L A N D G O V E R N M E N T G U A R A N T E E S % OF TOTAL PORTF OLIO Q 3 2023 PRINC IPAL B ALANC E ( $ MILLIONS ) B ALANC E S HEET C ATEG ORY B USINESS LINE 18% $ 1,008 Securities - backed lines of credit (SBLOC) (A) 13% 713 Insurance - backed lines of credit (IBLOC) (B) Institutional Banking 4% 199 Advisor Financing 35% 1,920 Total 37% 2,055 Multifamily - commercial real estate (C) Real Estate Bridge Lending <1% 27 Hospitality - commercial real estate <1% 12 Retail - commercial real estate <1% 9 Other 37% 2,103 Total 7% 392 U.S. government guaranteed portion of SBA loans (D) <1% 2 Paycheck Protection Program Loans (PPP) (D) 5% 273 Commercial mortgage SBA (E) Small Business Lending 2% 109 Non - guaranteed portion of U.S. govn’t guaranteed 7(a) loans 1% 35 Non - SBA small business loans <1% 11 Construction SBA 15% 822 Total 12% 670 Leasing (F) Commercial Fleet Leasing 1% 56 Other Other 100% $ 5,571 Total principal LOWER HISTORIC CREDIT LOSS NICHES A. SBLOC loans are backed by marketable securities with nominal credit losses B. IBLOC loans are backed by the cash value of life insurance policies with nominal credit losses C. Comprised of apartment buildings in carefully selected areas D. Portion of small business loans fully guaranteed by the U.S. government E. 50% - 60% loan to value ratios at origination F. Recourse to vehicles
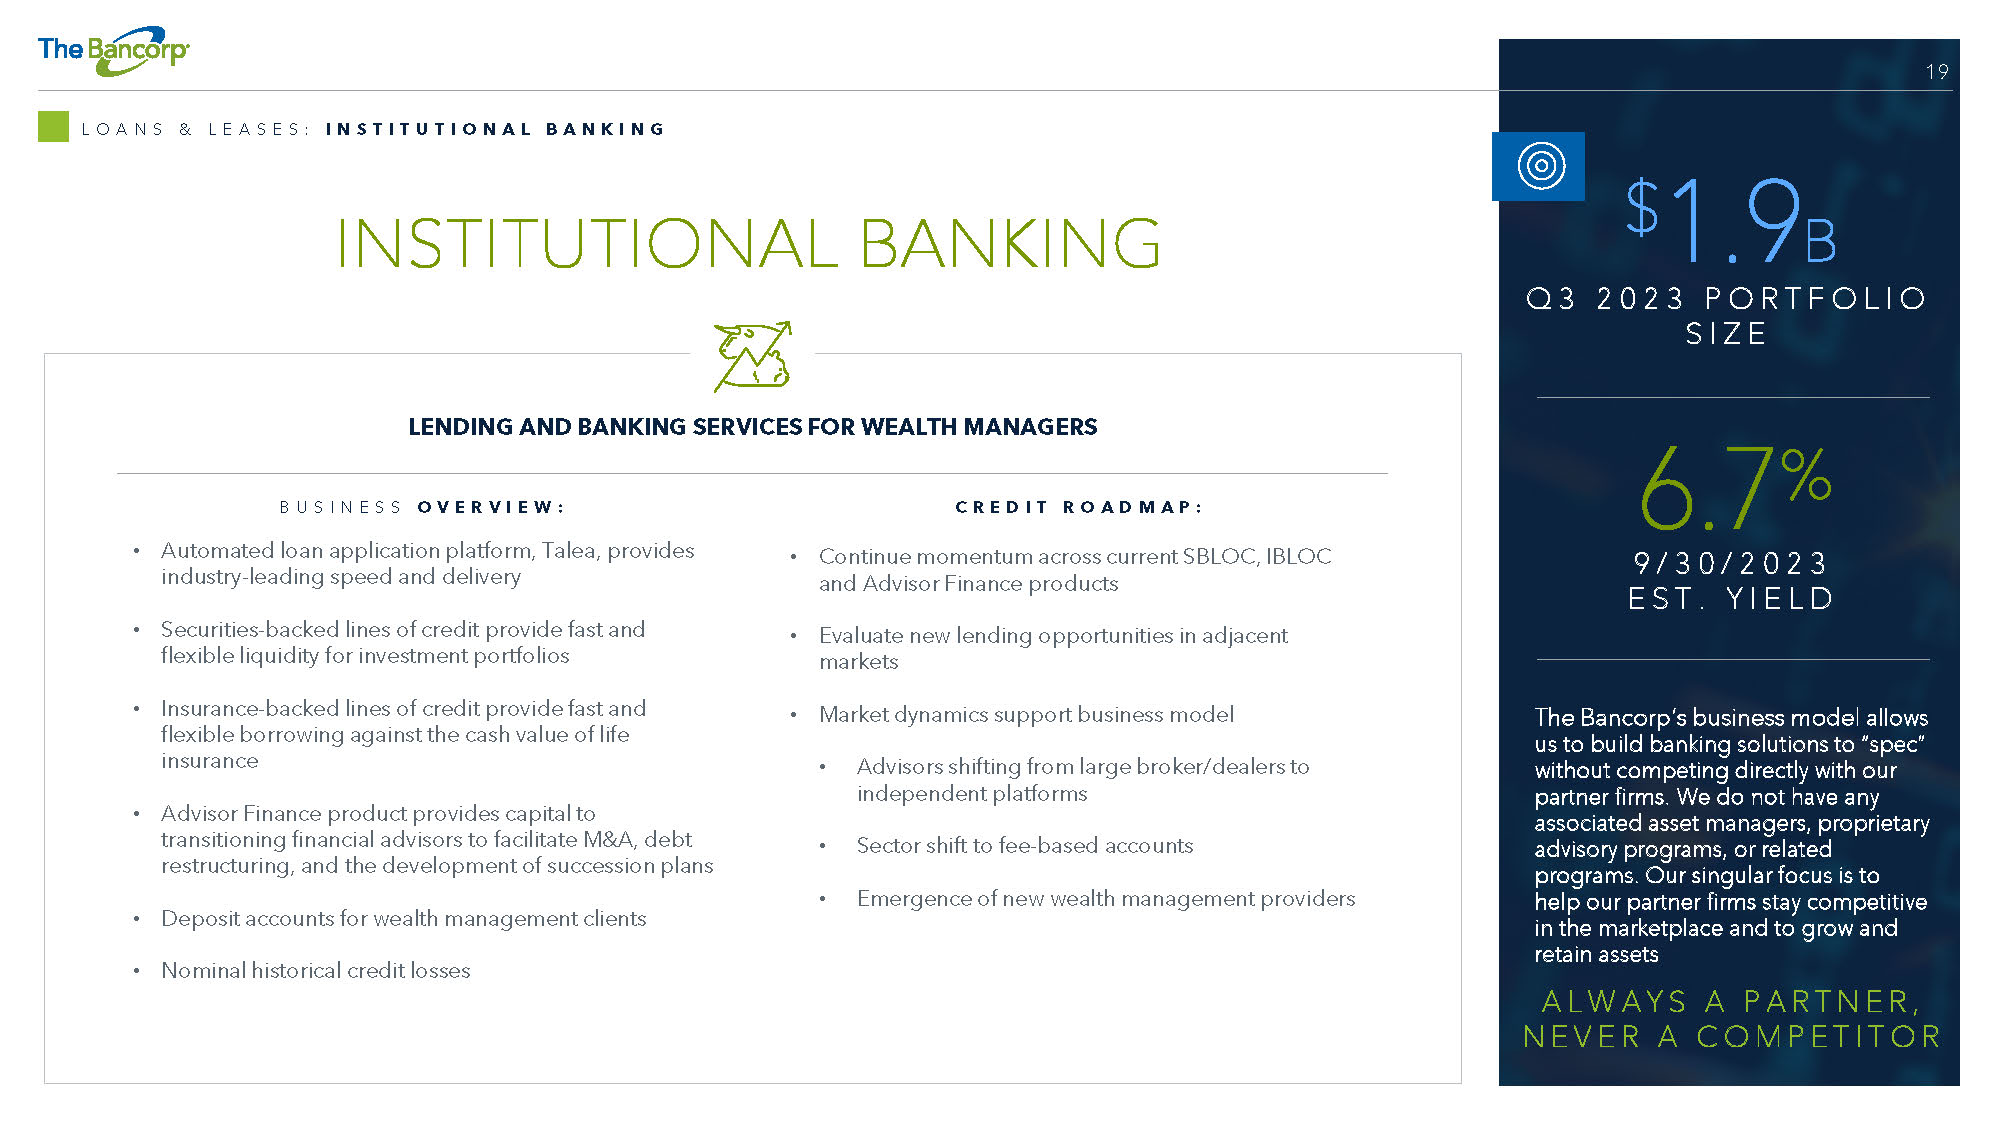
19 INSTITUTIONAL BANKING L O A N S & L E A S E S : I N S T I T U T I O N A L B A N K I N G B U S I N E S S O V E R V I E W : • Automated loan application platform, Talea, provides industry - leading speed and delivery • Securities - backed lines of credit provide fast and flexible liquidity for investment portfolios • Insurance - backed lines of credit provide fast and flexible borrowing against the cash value of life insurance • Advisor Finance product provides capital to transitioning financial advisors to facilitate M&A, debt restructuring, and the development of succession plans • Deposit accounts for wealth management clients • Nominal historical credit losses C R E D I T R O A D M A P : • Continue momentum across current SBLOC, IBLOC and Advisor Finance products • Evaluate new lending opportunities in adjacent markets • Market dynamics support business model • Advisors shifting from large broker/dealers to independent platforms • Sector shift to fee - based accounts • Emergence of new wealth management providers LENDING AND BANKING SERVICES FOR WEALTH MANAGERS The Bancorp’s business model allows us to build banking solutions to “spec” without competing directly with our partner firms. We do not have any associated asset managers, proprietary advisory programs, or related programs. Our singular focus is to help our partner firms stay competitive in the marketplace and to grow and retain assets AL WAYS A PAR T NE R , N EV ER A C OMP ET I T OR $ 1.9 B Q 3 2023 P O R T FO L I O SI Z E 6.7 % 9/ 30/ 2023 ES T . Y I EL D
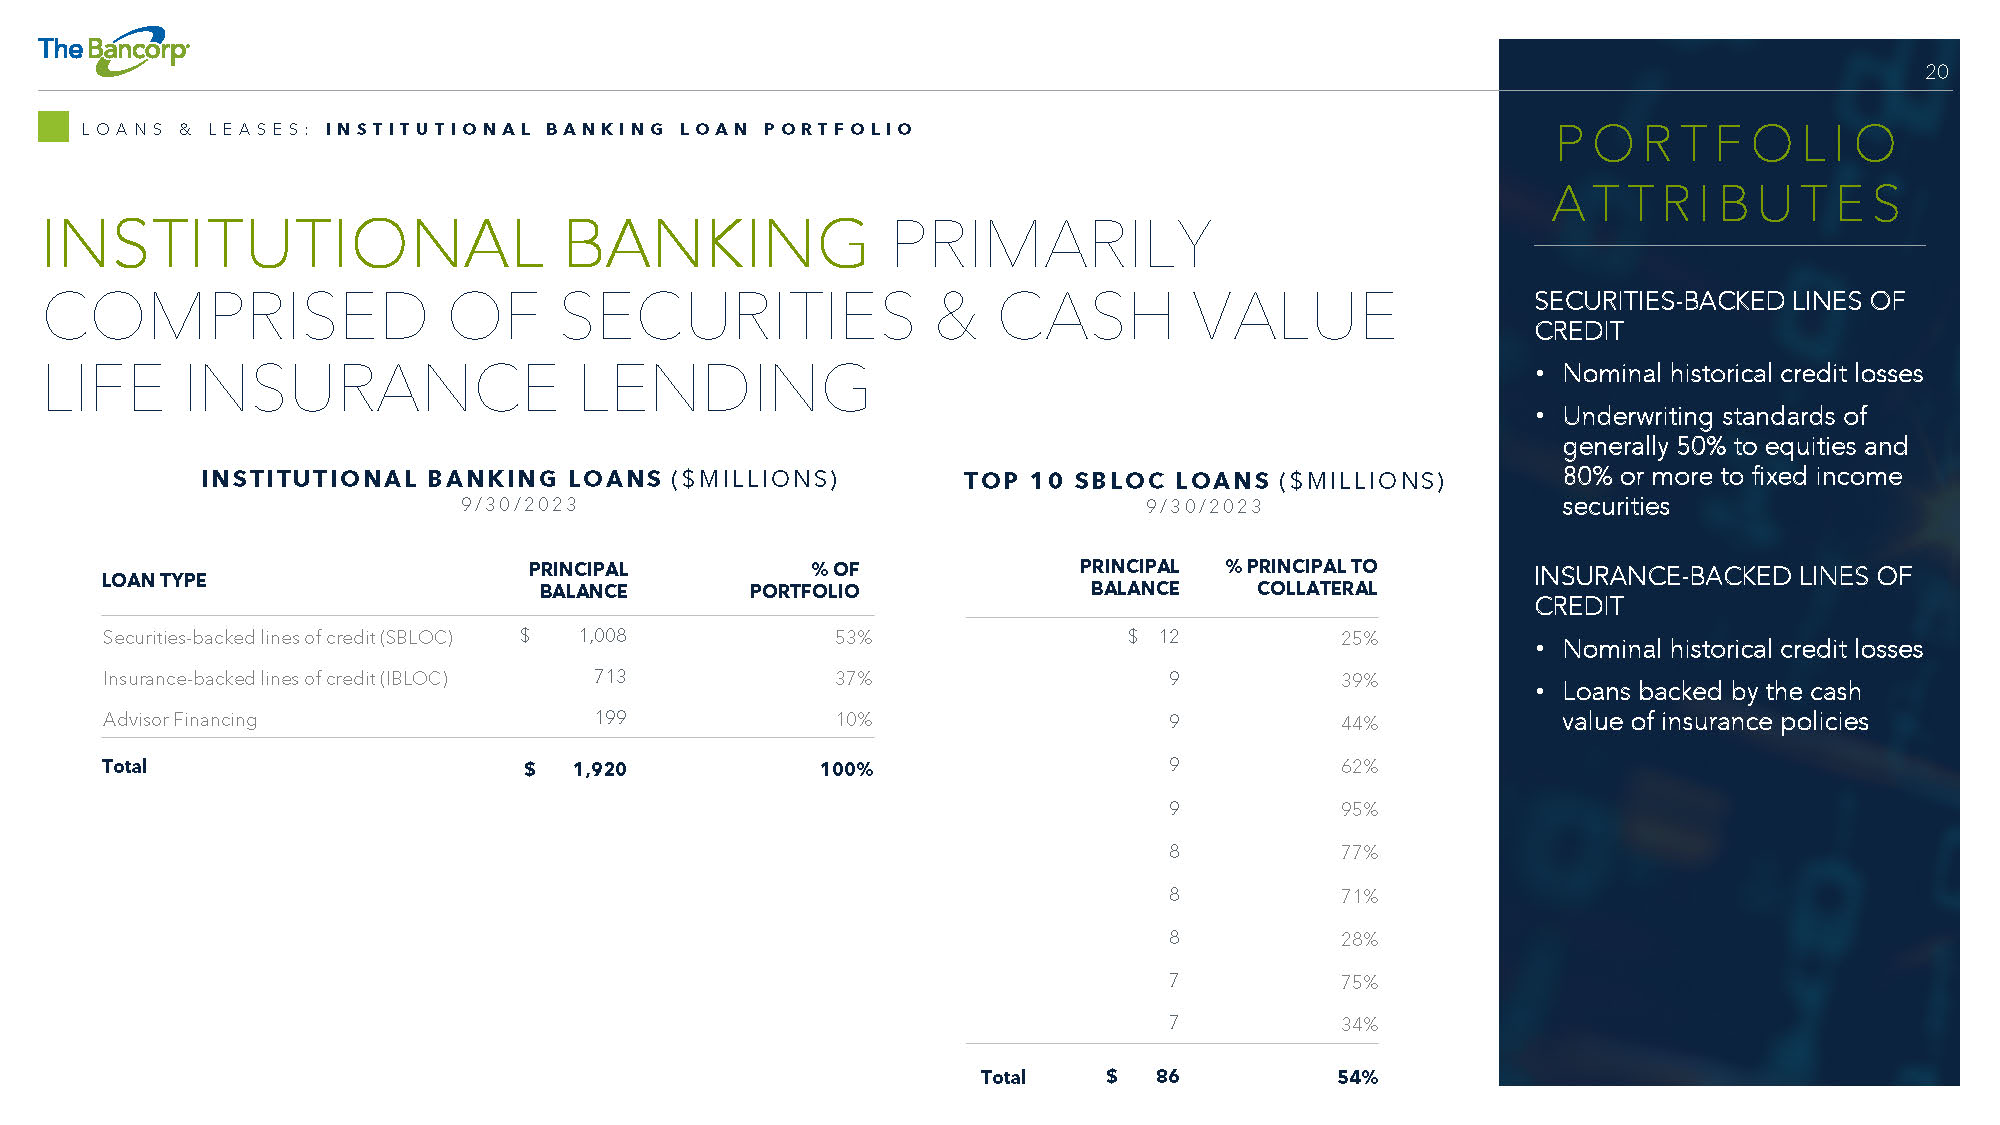
20 INSTITUTIONAL BANKING PRIMARILY COMPRISED OF SECURITIES & CASH VALUE LIFE INSURANCE LENDING L O A N S & L E A S E S : I N S T I T U T I O N A L B A N K I N G L O A N P O R T F O L I O % OF PORTFOLIO PRINCIPAL BALANCE LOAN TYPE 53% $ 1,008 Securities - backed lines of credit (SBLOC) 37% 713 Insurance - backed lines of credit (IBLOC) 10% 199 Advisor Financing 100% $ 1,920 Total I N ST I T U T I O N A L B A N KI N G LO A N S ( $ M I LL IO N S ) 9/ 30/ 2 0 23 SECURITIES - BACKED LINES OF CREDIT • Nominal historical credit losses • Underwriting standards of generally 50 % to equities and 80 % or more to fixed income securities POR T F OL I O A TTR I B U TES % PRINCIPAL TO COLLATERAL PRINCIPAL BALANCE 25% $ 12 39% 9 44% 9 62% 9 95% 9 77% 8 71% 8 28% 8 75% 7 34% 7 54% $ 86 Total T O P 10 SB LO C LO A N S ( $ M I LL IO N S ) 9/ 30/ 2 0 23 INSURANCE - BACKED LINES OF CREDIT • Nominal historical credit losses • Loans backed by the cash value of insurance policies
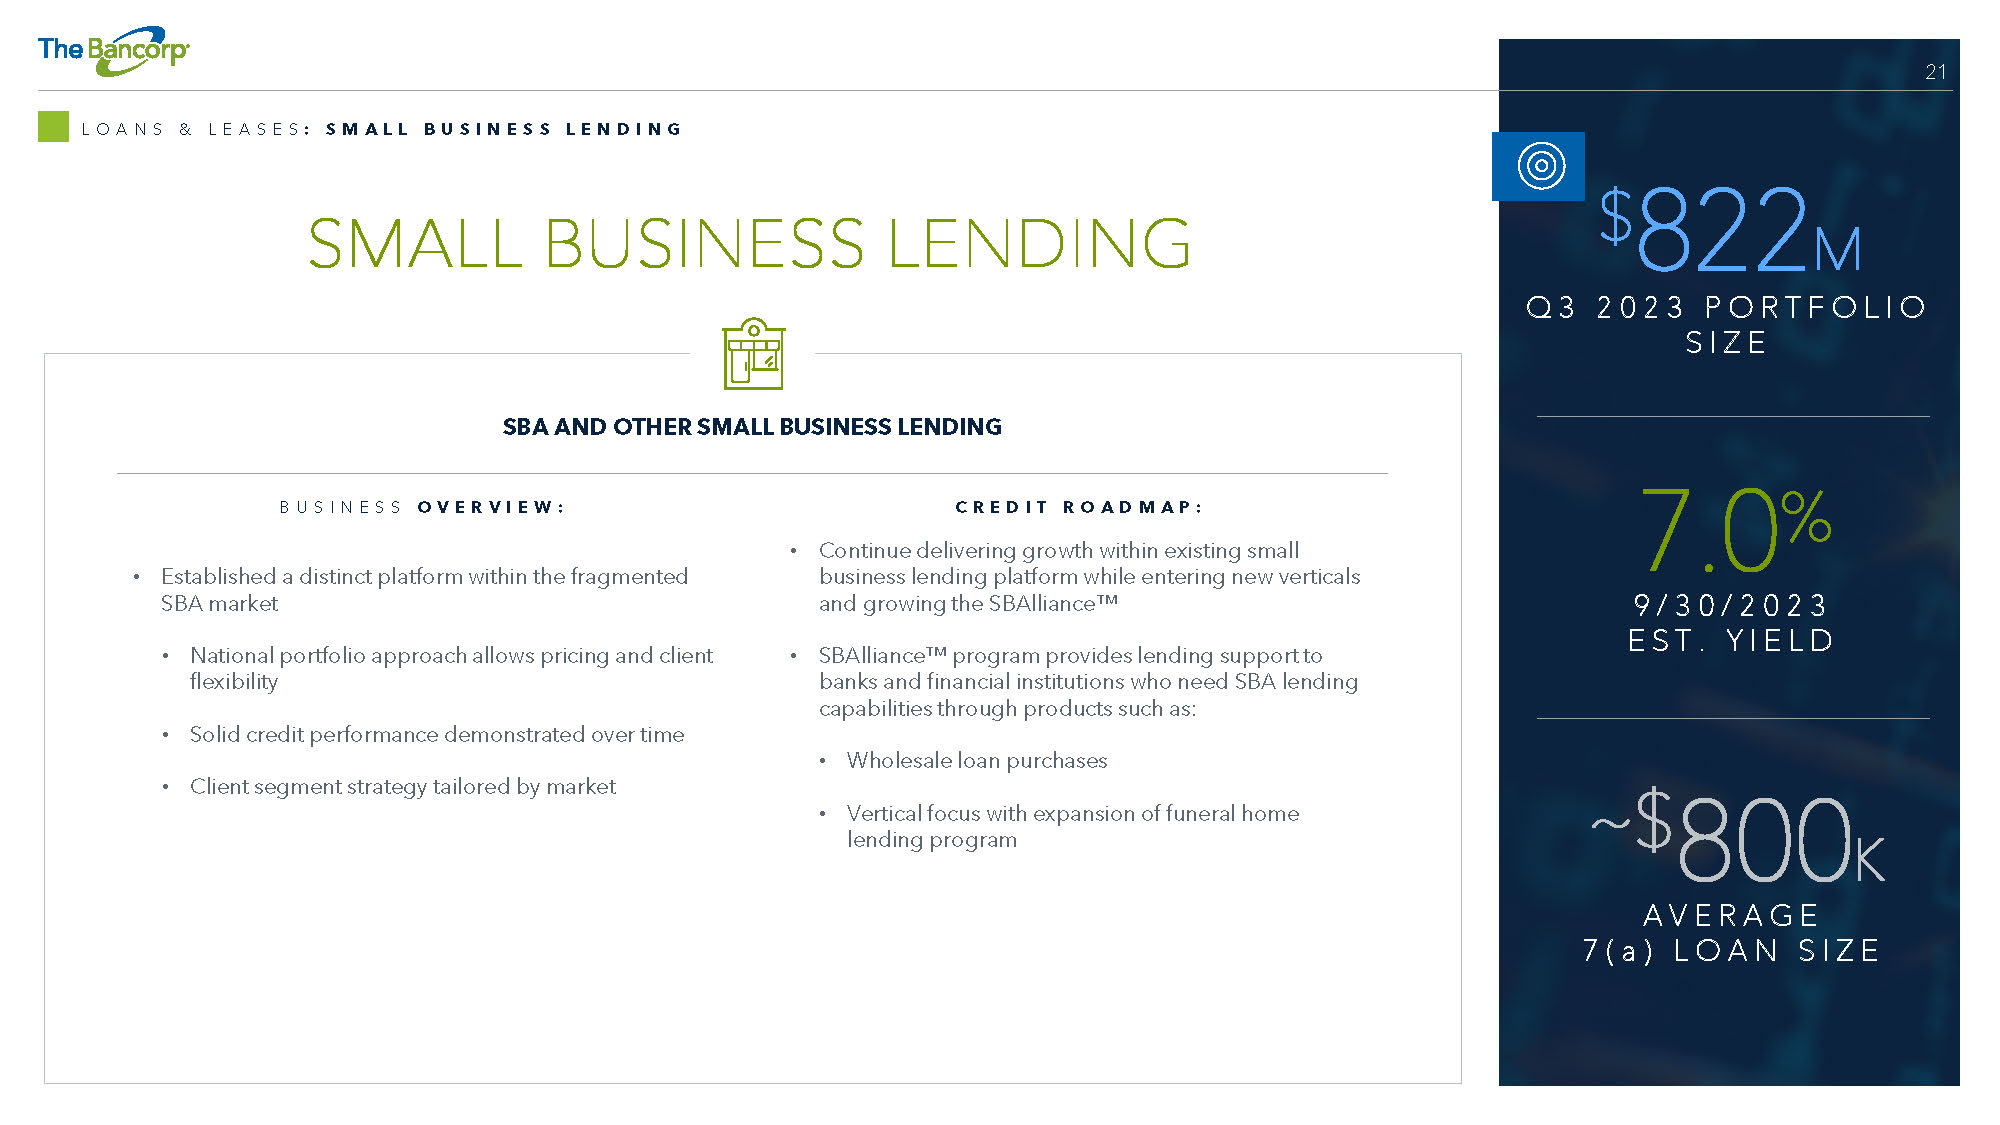
21 SMALL BUSINESS LENDING L O A N S & L E A S E S : S M A L L B U S I N E S S L E N D I N G B U S I N E S S O V E R V I E W : • Established a distinct platform within the fragmented SBA market • National portfolio approach allows pricing and client flexibility • Solid credit performance demonstrated over time • Client segment strategy tailored by market C R E D I T R O A D M A P : • Continue delivering growth within existing small business lending platform while entering new verticals and growing the SBAlliance Ő • SBAlliance Ő program provides lending support to banks and financial institutions who need SBA lending capabilities through products such as: • Wholesale loan purchases • Vertical focus with expansion of funeral home lending program SBA AND OTHER SMALL BUSINESS LENDING $ 822 M Q 3 2023 P O R T FO L I O SI Z E 7.0 % 9/ 30/ 2023 ES T . Y I EL D ~$ 800 K AVE R AG E 7 ( a ) L OA N S I Z E
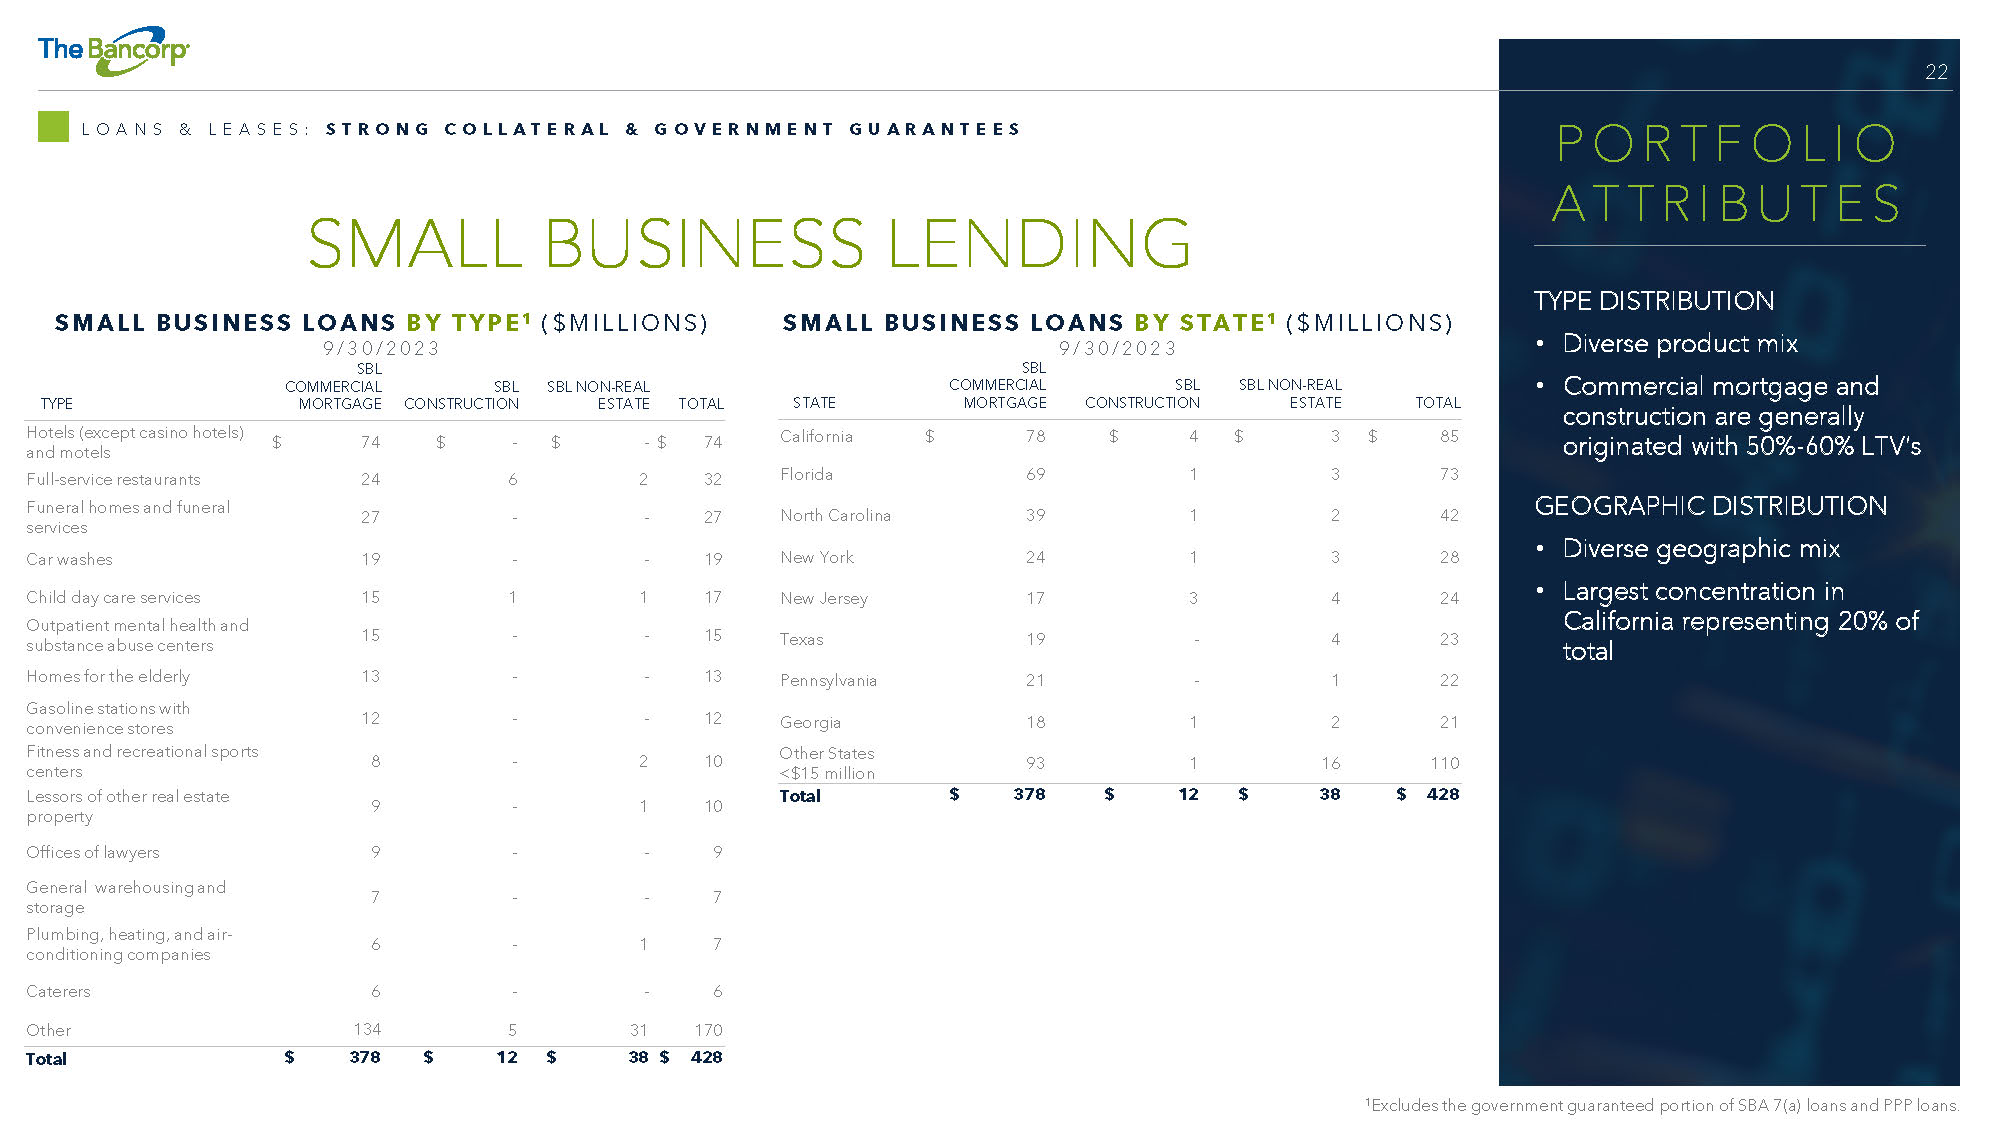
22 L O A N S & L E A S E S : S T R O N G C O L L A T E R A L & G O V E R N M E N T G U A R A N T E E S SM A LL B U SI N E S S LO A N S B Y T YP E 1 ( $ M IL LI O N S ) 9/ 30/ 2 0 23 1 Excludes the government guaranteed portion of SBA 7(a) loans and PPP loans. TYPE DISTRIBUTION • Diverse product mix • Commercial mortgage and construction are generally originated with 50% - 60% LTV’s GEOGRAPHIC DISTRIBUTION • Diverse geographic mix • Largest concentration in California representing 20% of total POR T F OL I O A TTR I B U TES SM A LL B U SI N E S S LO A N S B Y S TA TE 1 ( $ M ILL IO N S ) 9/ 30/ 2 0 23 TOTAL SBL NON - REAL ESTATE SBL CONSTRUCTION SBL COMMERCIAL MORTGAGE STATE $ 85 $ 3 $ 4 $ 78 California 73 3 1 69 Florida 42 2 1 39 North Carolina 28 3 1 24 New York 24 4 3 17 New Jersey 23 4 - 19 Texas 22 1 - 21 Pennsylvania 21 2 1 18 Georgia 110 16 1 93 Other States <$15 million $ 428 $ 38 $ 12 $ 378 Total SMALL BUSINESS LENDING TOTAL SBL NON - REAL ESTATE SBL CONSTRUCTION SBL COMMERCIAL MORTGAGE TYPE $ 74 $ - $ - $ 74 Hotels (except casino hotels) and motels 32 2 6 24 Full - service restaurants 27 - - 27 Funeral homes and funeral services 19 - - 19 Car washes 17 1 1 15 Child day care services 15 - - 15 Outpatient mental health and substance abuse centers 13 - - 13 Homes for the elderly 12 - - 12 Gasoline stations with convenience stores 10 2 - 8 Fitness and recreational sports centers 10 1 - 9 Lessors of other real estate property 9 - - 9 Offices of lawyers 7 - - 7 General warehousing and storage 7 1 - 6 Plumbing, heating, and air - conditioning companies 6 - - 6 Caterers 170 31 5 134 Other $ 428 $ 38 $ 12 $ 378 Total

23 L O A N S & L E A S E S : C O M M E R C I A L F L E E T L E A S I N G B U S I N E S S O V E R V I E W : • Niche provider of vehicle leasing solutions • Focus on smaller fleets (less than 150 vehicles) • Direct lessor (The Bancorp Bank, N . A . sources opportunities directly and provides value - add services such as outfitting police cars) • Historical acquisitions of small leasing companies have contributed to growth • Mix of commercial (~85%), government agencies and educational institutions (~15%) C R E D I T R O A D M A P : • Continue enhancing platform and growing balances • Enhanced sales process and support functions • Pursuing technology enhancements to scale business with efficiency • Constantly evaluating organic and inorganic growth opportunities in the vehicle space NICHE - VEHICLE FLEET LEASING SOLUTIONS COMMERCIAL FLEET LEASING $ 670 M Q 3 2023 P O R T FO L I O SI Z E 7.1 % 9/ 30/ 2023 ES T . Y I EL D
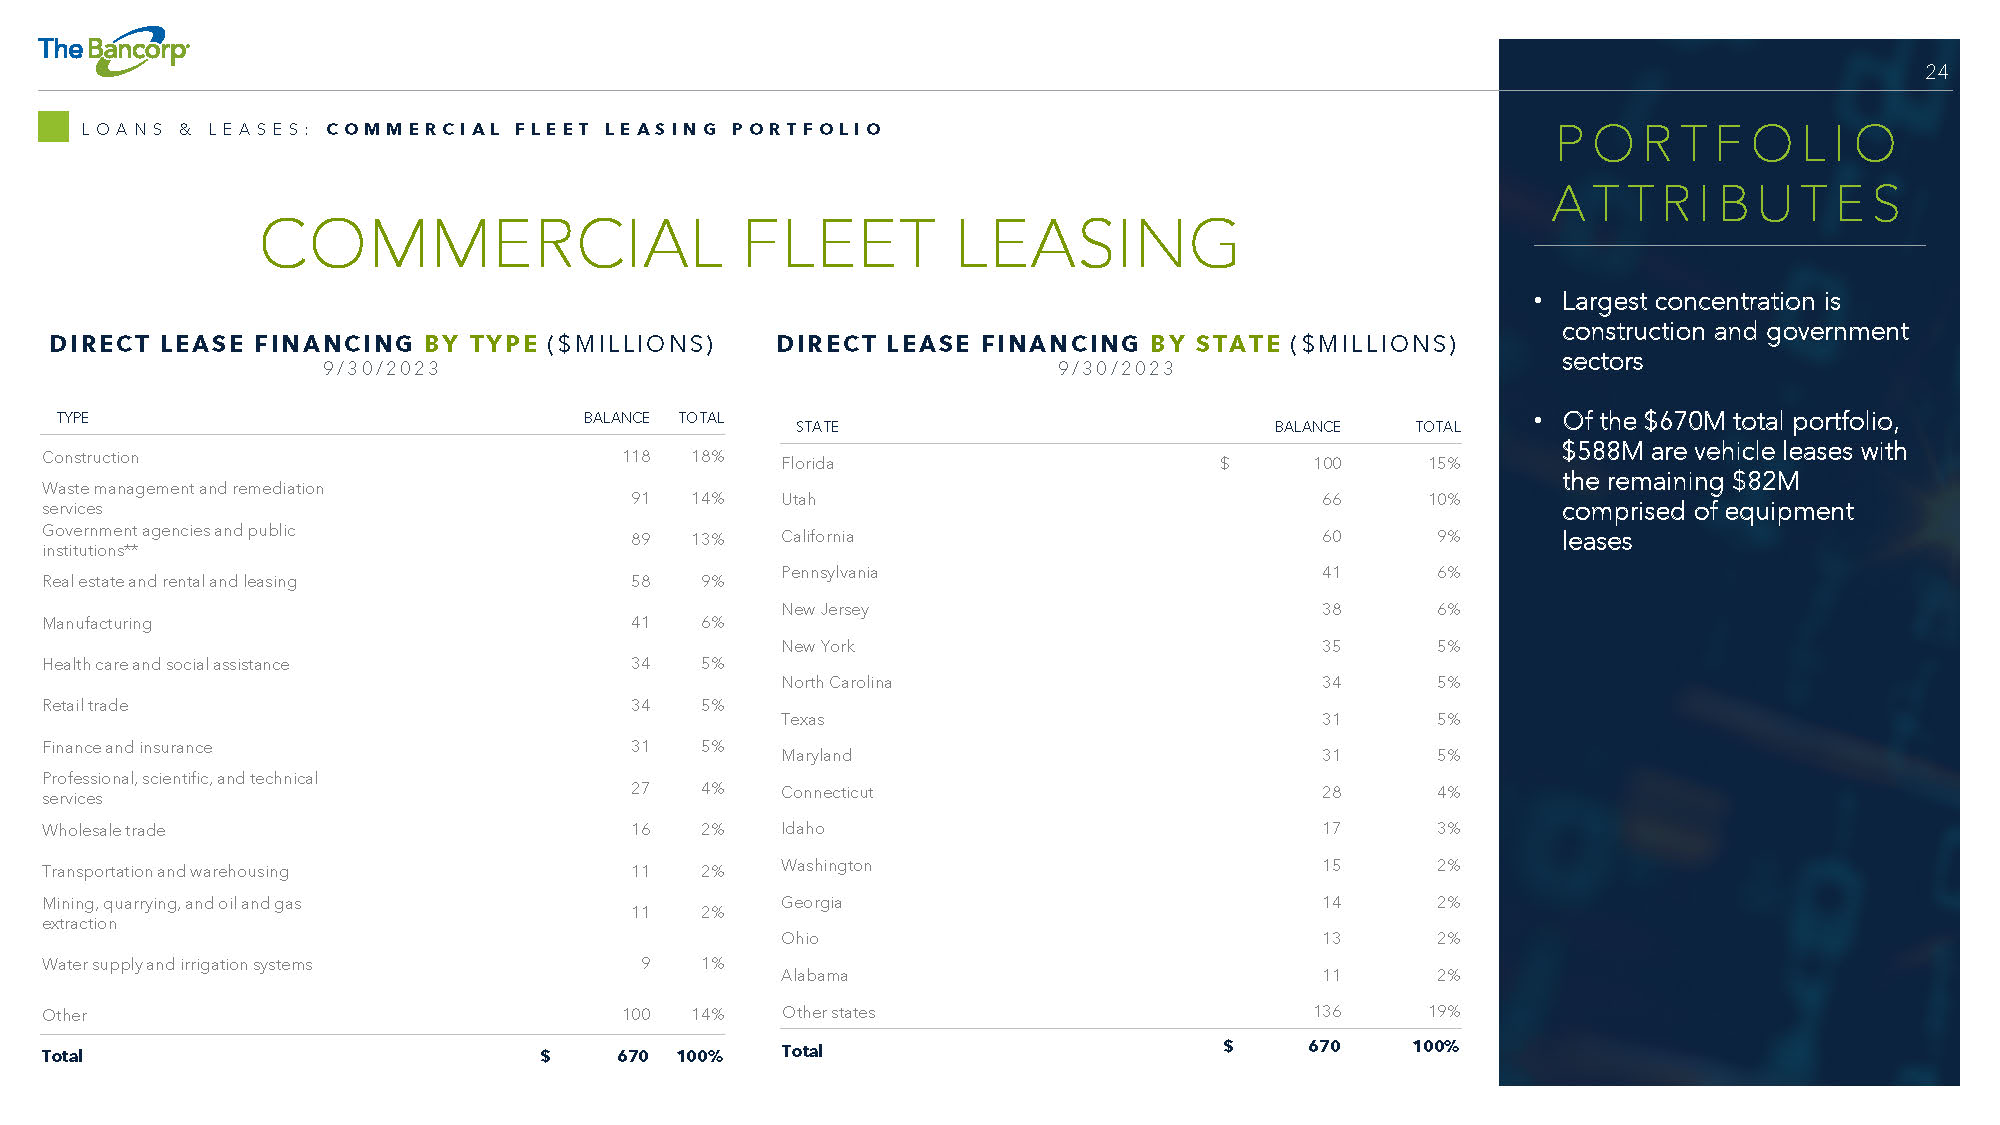
24 L O A N S & L E A S E S : C O M M E R C I A L F L E E T L E A S I N G P O R T F O L I O • Largest concentration is construction and government sectors • Of the $670M total portfolio, $588M are vehicle leases with the remaining $82M comprised of equipment leases POR T F OL I O A TTR I B U TES TOTAL BALANCE TYPE 18% 118 Construction 14% 91 Waste management and remediation services 13% 89 Government agencies and public institutions** 9% 58 Real estate and rental and leasing 6% 41 Manufacturing 5% 34 Health care and social assistance 5% 34 Retail trade 5% 31 Finance and insurance 4% 27 Professional, scientific, and technical services 2% 16 Wholesale trade 2% 11 Transportation and warehousing 2% 11 Mining, quarrying, and oil and gas extraction 1% 9 Water supply and irrigation systems 14% 100 Other 100% $ 670 Total DI R E C T L E A S E F I N A N C I N G B Y S TA TE ( $ M I LL IO N S ) 9/ 30/ 2 0 23 COMMERCIAL FLEET LEASING TOTAL BALANCE STATE 15% $ 100 Florida 10% 66 Utah 9% 60 California 6% 41 Pennsylvania 6% 38 New Jersey 5% 35 New York 5% 34 North Carolina 5% 31 Texas 5% 31 Maryland 4% 28 Connecticut 3% 17 Idaho 2% 15 Washington 2% 14 Georgia 2% 13 Ohio 2% 11 Alabama 19% 136 Other states 100% $ 670 Total DI R E C T L E A S E F I N A N C IN G B Y T YP E ( $ M IL LIO N S ) 9/ 30/ 2 0 23
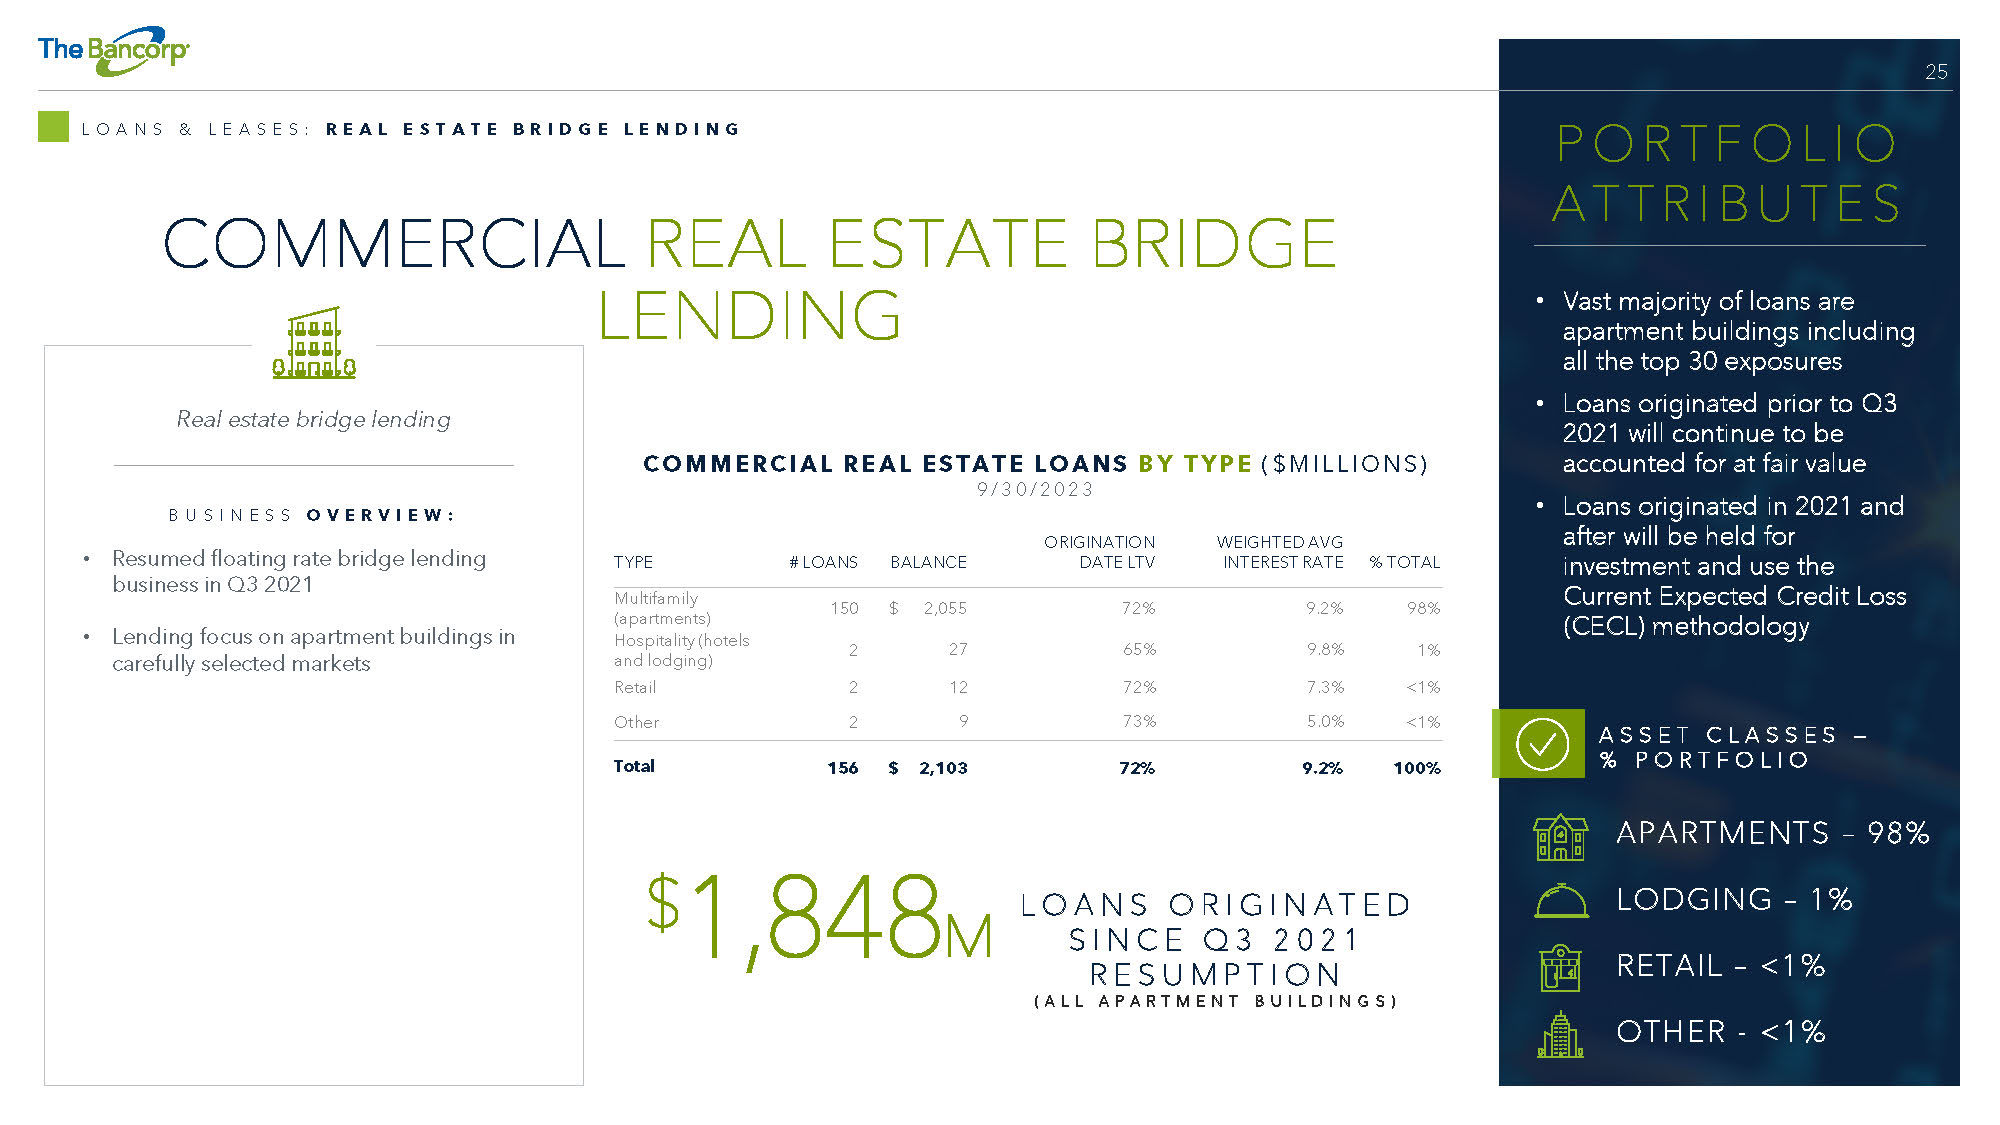
25 COMMERCIAL REAL ESTATE BRIDGE LENDING L O A N S & L E A S E S : R E A L E S T A T E B R I D G E L E N D I N G % TOTAL WEIGHTED AVG INTEREST RATE ORIGINATION DATE LTV BALANCE # LOANS TYPE 98% 9.2% 72% $ 2,055 150 Multifamily (apartments) 1% 9.8% 65% 27 2 Hospitality (hotels and lodging) <1% 7.3% 72% 12 2 Retail <1% 5.0% 73% 9 2 Other 100% 9.2% 72% $ 2,103 156 Total CO M M E R C I A L RE AL E S T A T E L O AN S B Y T YP E ( $ M I LLI O N S ) 9/ 30/ 2 0 23 B U S I N E S S O V E R V I E W : • Resumed floating rate bridge lending business in Q3 2021 • Lending focus on apartment buildings in carefully selected markets Real estate bridge lending APARTMENTS – 98% LODGING – 1% RETAIL – <1 % OTHER - <1 % A S S E T C L A S S E S — % P O R T F O L I O • Vast majority of loans are apartment buildings including all the top 30 exposures • Loans originated prior to Q3 2021 will continue to be accounted for at fair value • Loans originated in 2021 and after will be held for investment and use the Current Expected Credit Loss (CECL) methodology POR T F OL I O A TTR I B U TES $ 1,848 M L OA N S OR I GI N A T ED S I N C E Q 3 2021 R ES U MP T I ON ( A L L A P A R T M E N T B U I L D I N G S )

FINANCIAL REVIEW
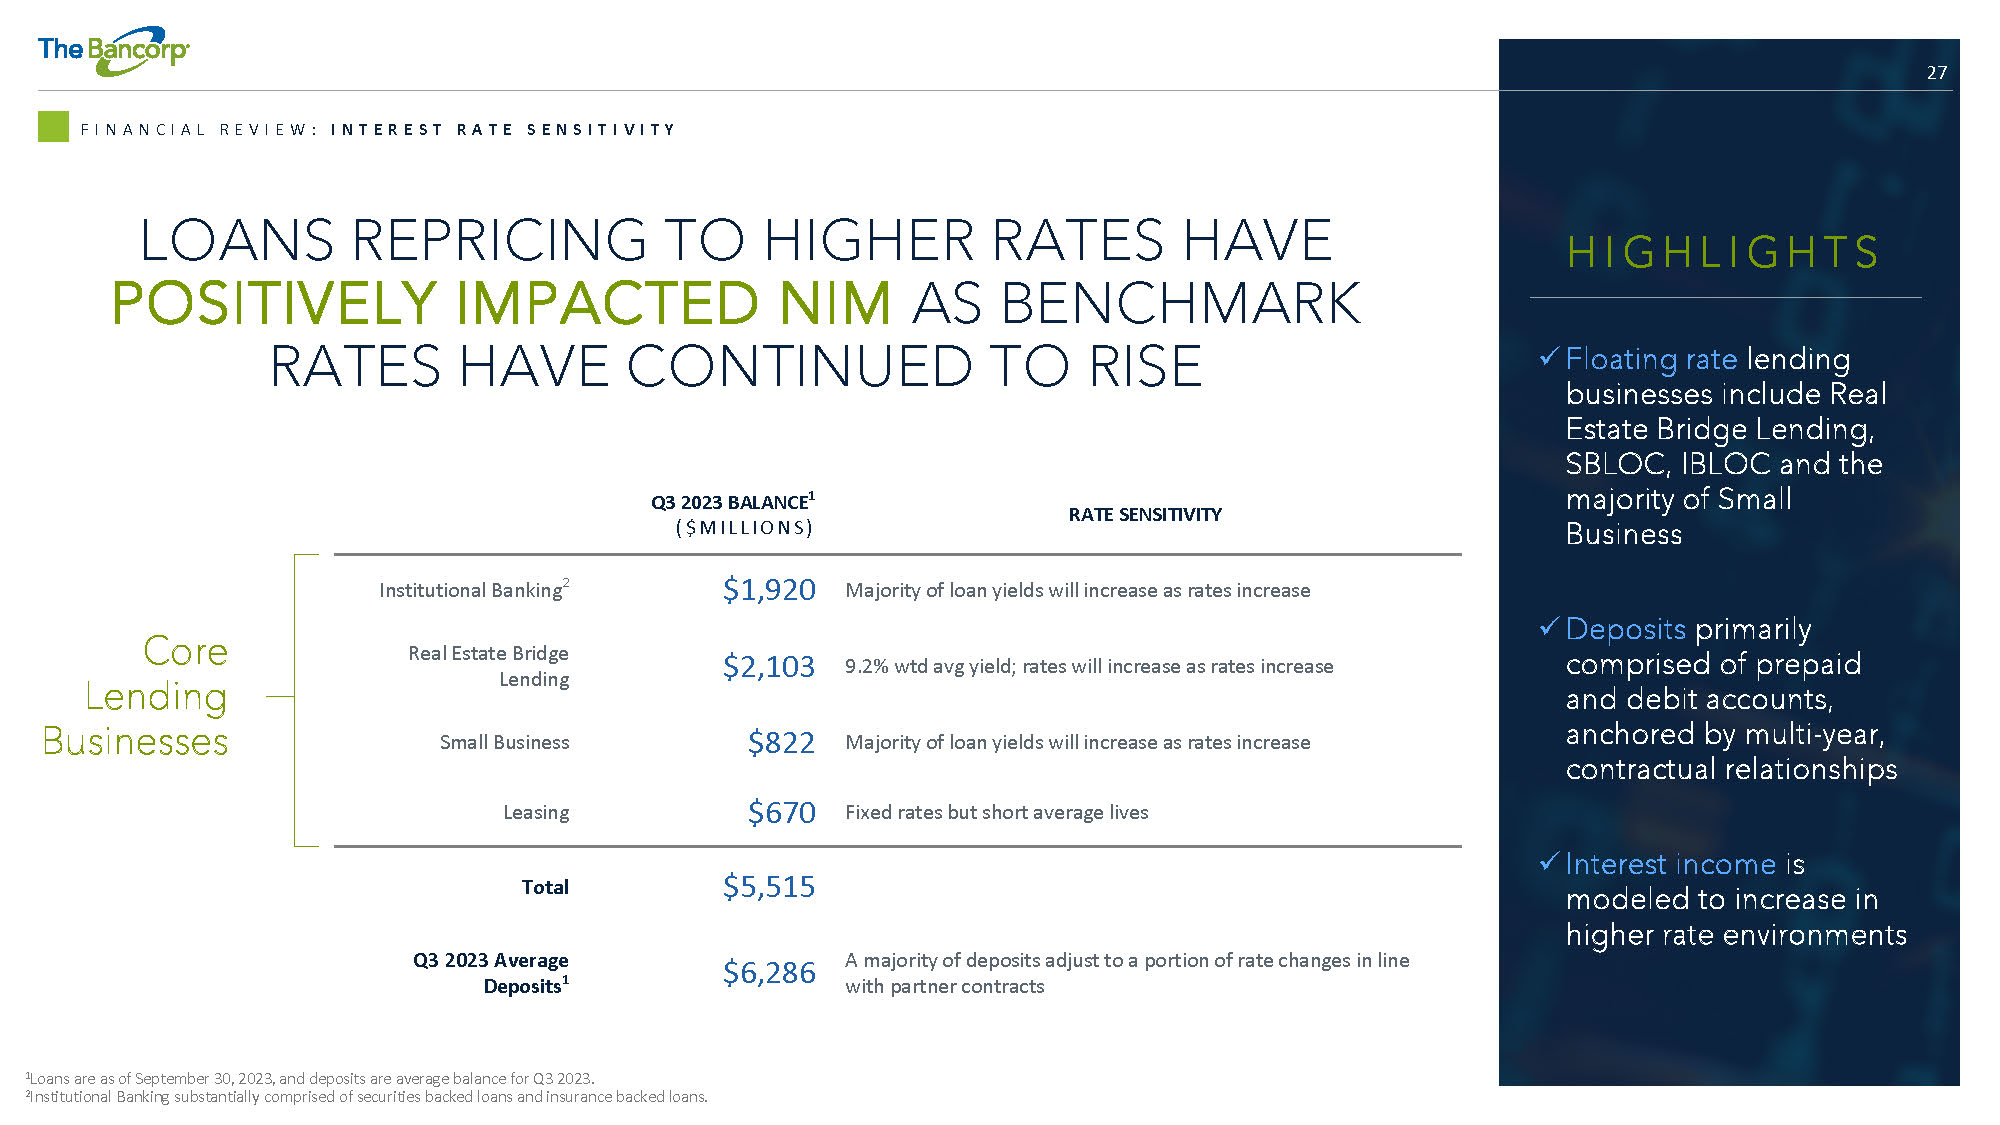
27 LOANS REPRICING TO HIGHER RATES HAVE POSITIVELY IMPACTED NIM AS BENCHMARK RATES HAVE CONTINUED TO RISE F I N A N C I A L R E V I E W : I N T E R E S T R A T E S E N S I T I V I T Y 1 Loans are as of September 30, 2023, and deposits are average balance for Q3 2023. 2 Institutional Banking substantially comprised of securities backed loans and insurance backed loans. RATE SENSITIVITY Q3 2023 BALANCE 1 ( $ M ILLIO N S ) Majority of loan yields will increase as rates increase $1,920 Institutional Banking 2 9.2% wtd avg yield; rates will increase as rates increase $2,103 Real Estate Bridge Lending Majority of loan yields will increase as rates increase $822 Small Business Fixed rates but short average lives $670 Leasing $5,515 Total A majority of deposits adjust to a portion of rate changes in line with partner contracts $6,286 Q3 2023 Average Deposits 1 Core Lending Businesses HI G HL I G HTS x Floating rate lending businesses include Real Estate Bridge Lending, SBLOC, IBLOC and the majority of Small Business x Deposits primarily comprised of prepaid and debit accounts, anchored by multi - year, contractual relationships x Interest income is modeled to increase in higher rate environments

28 REVENUE GROWTH HAS SIGNIFICANTLY EXCEEDED EXPENSE GROWTH F I N A N C I A L R E V I E W : E A R N I N G S A N D P R O F I T A B I L I T Y 1 Revenue includes net interest income and non - interest income. Please see Appendix slide 33. 2 Non - interest income as percentage of average assets ranks in top 11% of the uniform bank performance report peer group through Q2 2023. $0 $25 $50 $75 $100 $125 $150 $175 $200 2020 2021 2022 Q3 YTD 2022 Q3 YTD 2023 N O N - I N T E R E S T E X P E N S E $ Millions HI G HL I G HTS • Net interest income growth driven by increased NIM from heightened interest rate environment • Greater ratio of non - interest income to total assets compared to peers 2 $0 $50 $100 $150 $200 $250 $300 $350 2020 2021 2022 Q3 YTD 2022 Q3 YTD 2023 R E V E N U E 1 $ Millions $400
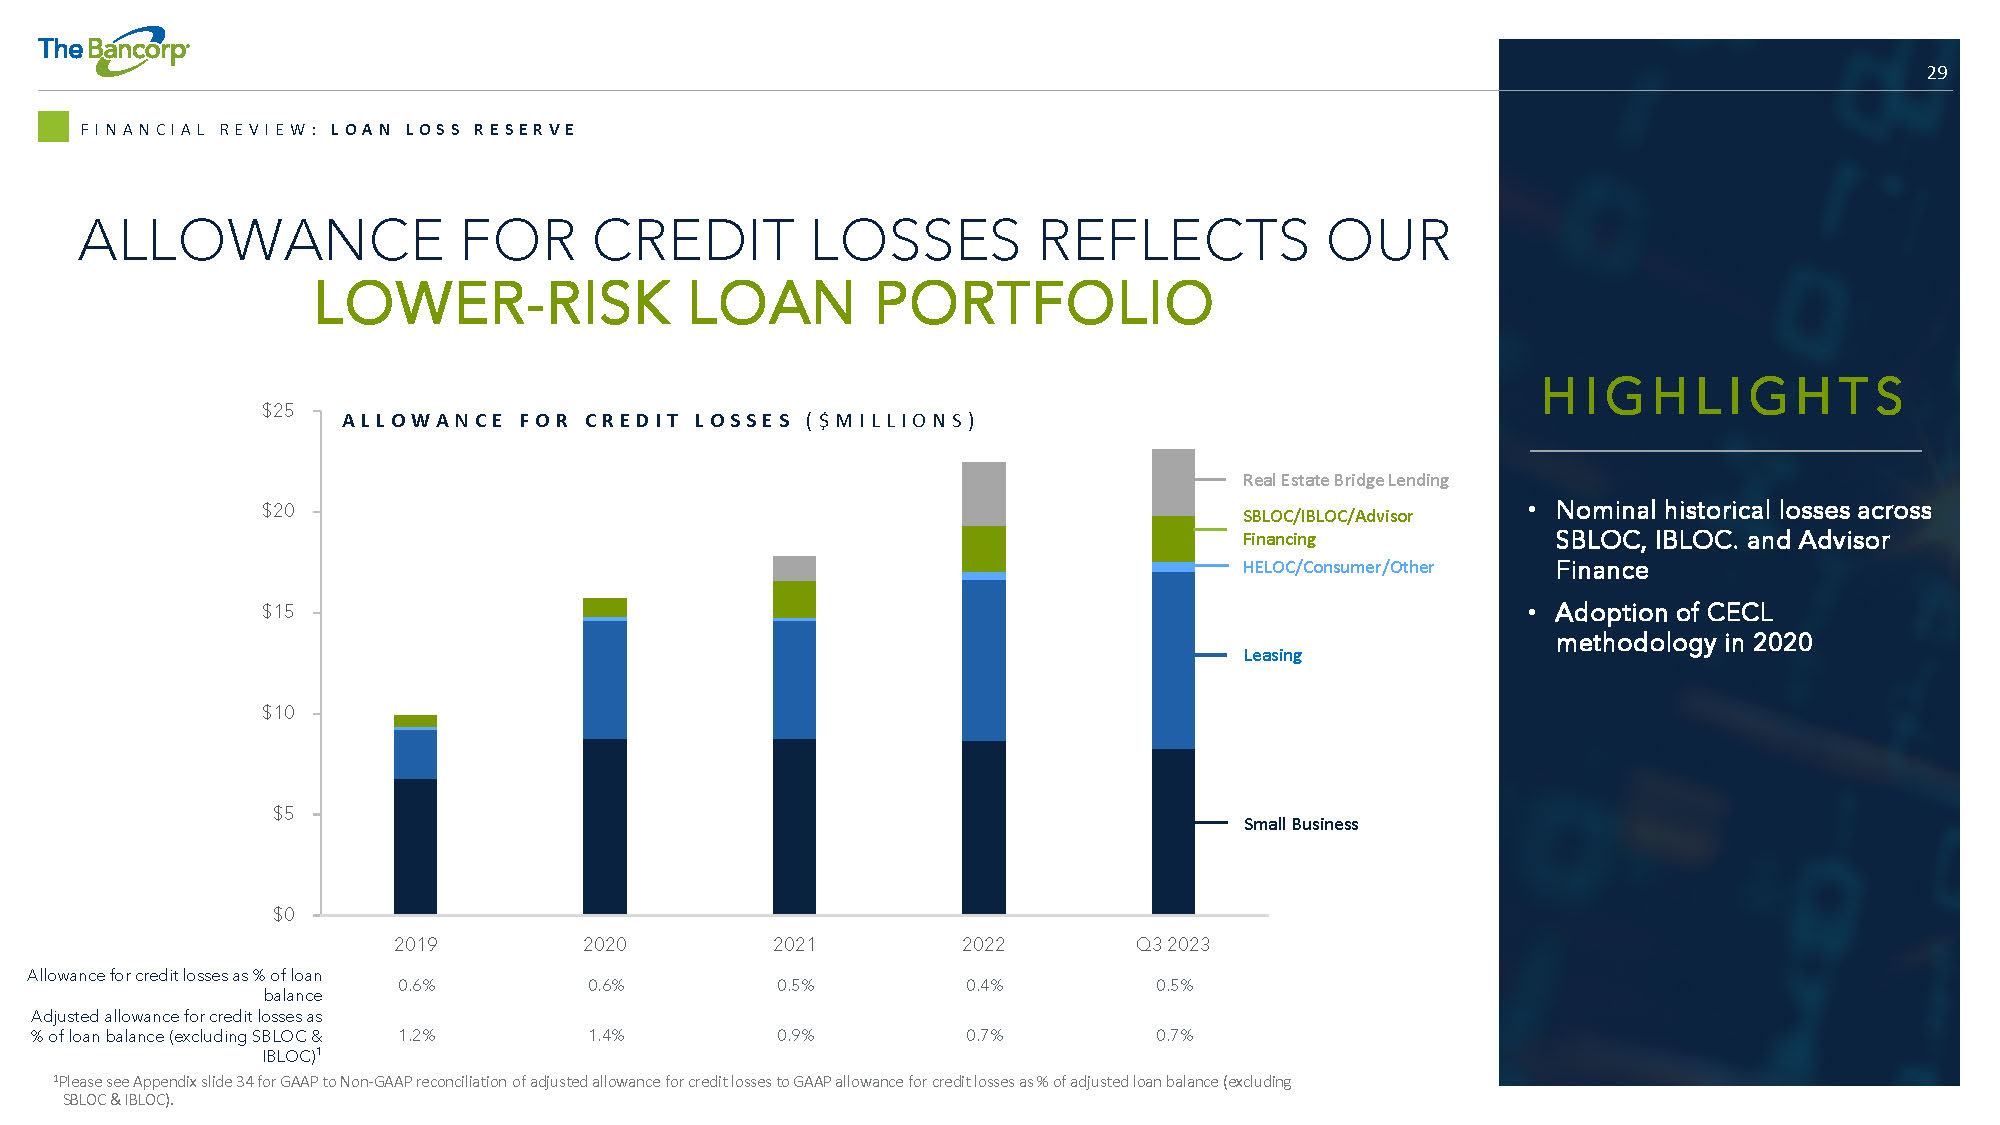
29 $0 $5 $10 $15 $20 $25 2019 2020 2021 2022 Q3 2023 ALLOWANCE FOR CREDIT LOSSES REFLECTS OUR LOWER - RISK LOAN PORTFOLIO F I N A N C I A L R E V I E W : L O A N L O S S R E S E R V E A L L O W A N C E F O R C R E D I T L O S S E S ( $ M I L L I O N S ) Small Business SBLOC/IBLOC/Advisor Financing HELOC/Consumer/Other 0.5% 0.4% 0.5% 0.6% 0.6% Allowance for credit losses as % of loan balance 0.7% 0.7% 0.9% 1.4% 1.2% Adjusted allowance for credit losses as % of loan balance (excluding SBLOC & IBLOC) 1 HIG HL IG HT S • Nominal historical losses across SBLOC, IBLOC. and Advisor Finance • Adoption of CECL methodology in 2020 Leasing Real Estate Bridge Lending 1 Please see Appendix slide 34 for GAAP to Non - GAAP reconciliation of adjusted allowance for credit losses to GAAP allowance for credit losses as % of adjusted loan balance (excluding SBLOC & IBLOC).
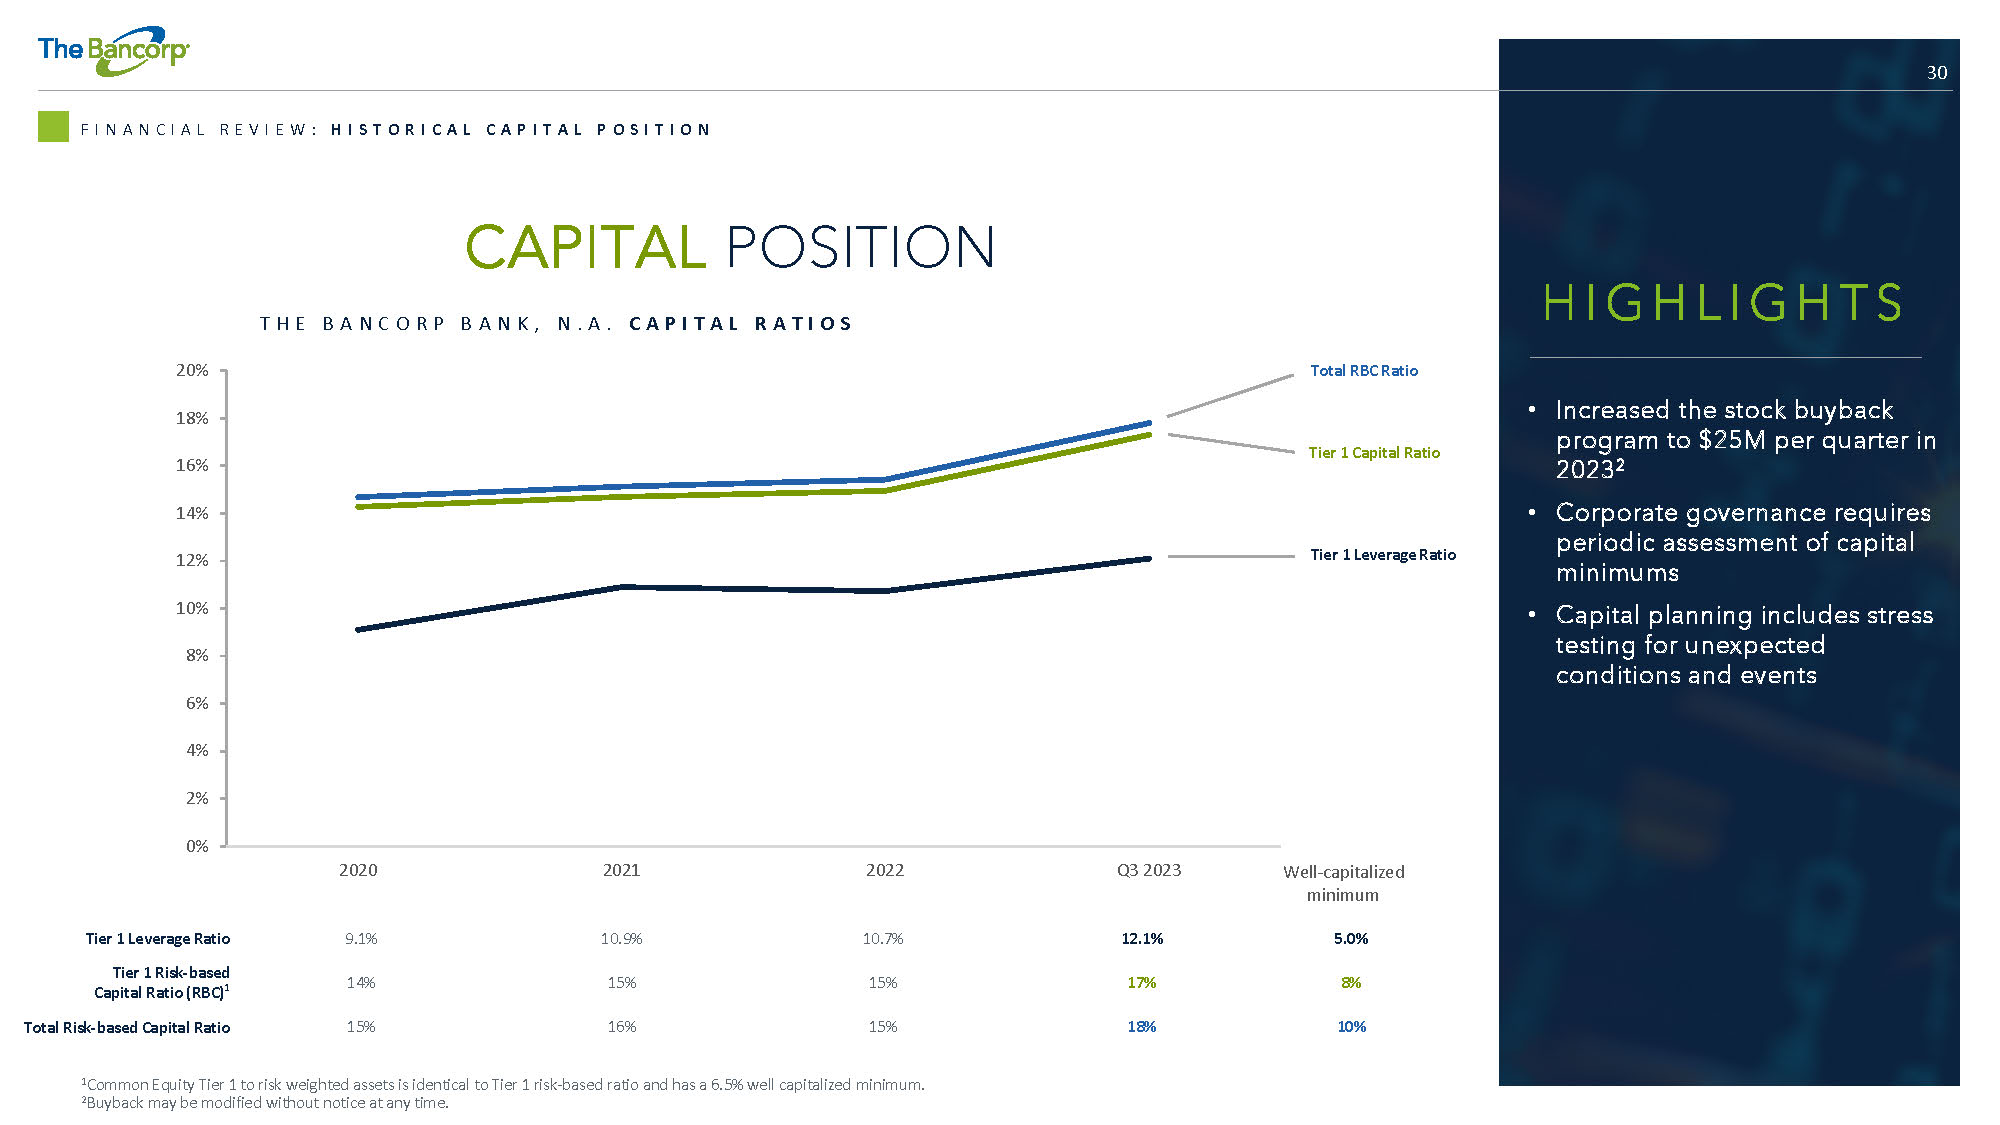
30 CAPITAL POSITION F I N A N C I A L R E V I E W : H I S T O R I C A L C A P I T A L P O S I T I O N HIG HL IG HT S • Increased the stock buyback program to $25M per quarter in 2023 2 • Corporate governance requires periodic assessment of capital minimums • Capital planning includes stress testing for unexpected conditions and events 6% 4% 2% 0% 8% 10% 12% 14% 16% 18% 20% 2020 2021 2022 Q3 2023 5.0% 12.1% 10.7% 10.9% 9.1% Tier 1 Leverage Ratio 8% 17% 15% 15% 14% Tier 1 Risk - based Capital Ratio (RBC) 1 10% 18% 15% 16% 15% Total Risk - based Capital Ratio Tier 1 Capital Ratio Total RBC Ratio Tier 1 Leverage Ratio T H E B A N C O R P B A N K , N . A . C A P I T A L R A T I O S 1 Common Equity Tier 1 to risk weighted assets is identical to Tier 1 risk - based ratio and has a 6.5% well capitalized minimum. 2 Buyback may be modified without notice at any time. Well - capitalized minimum
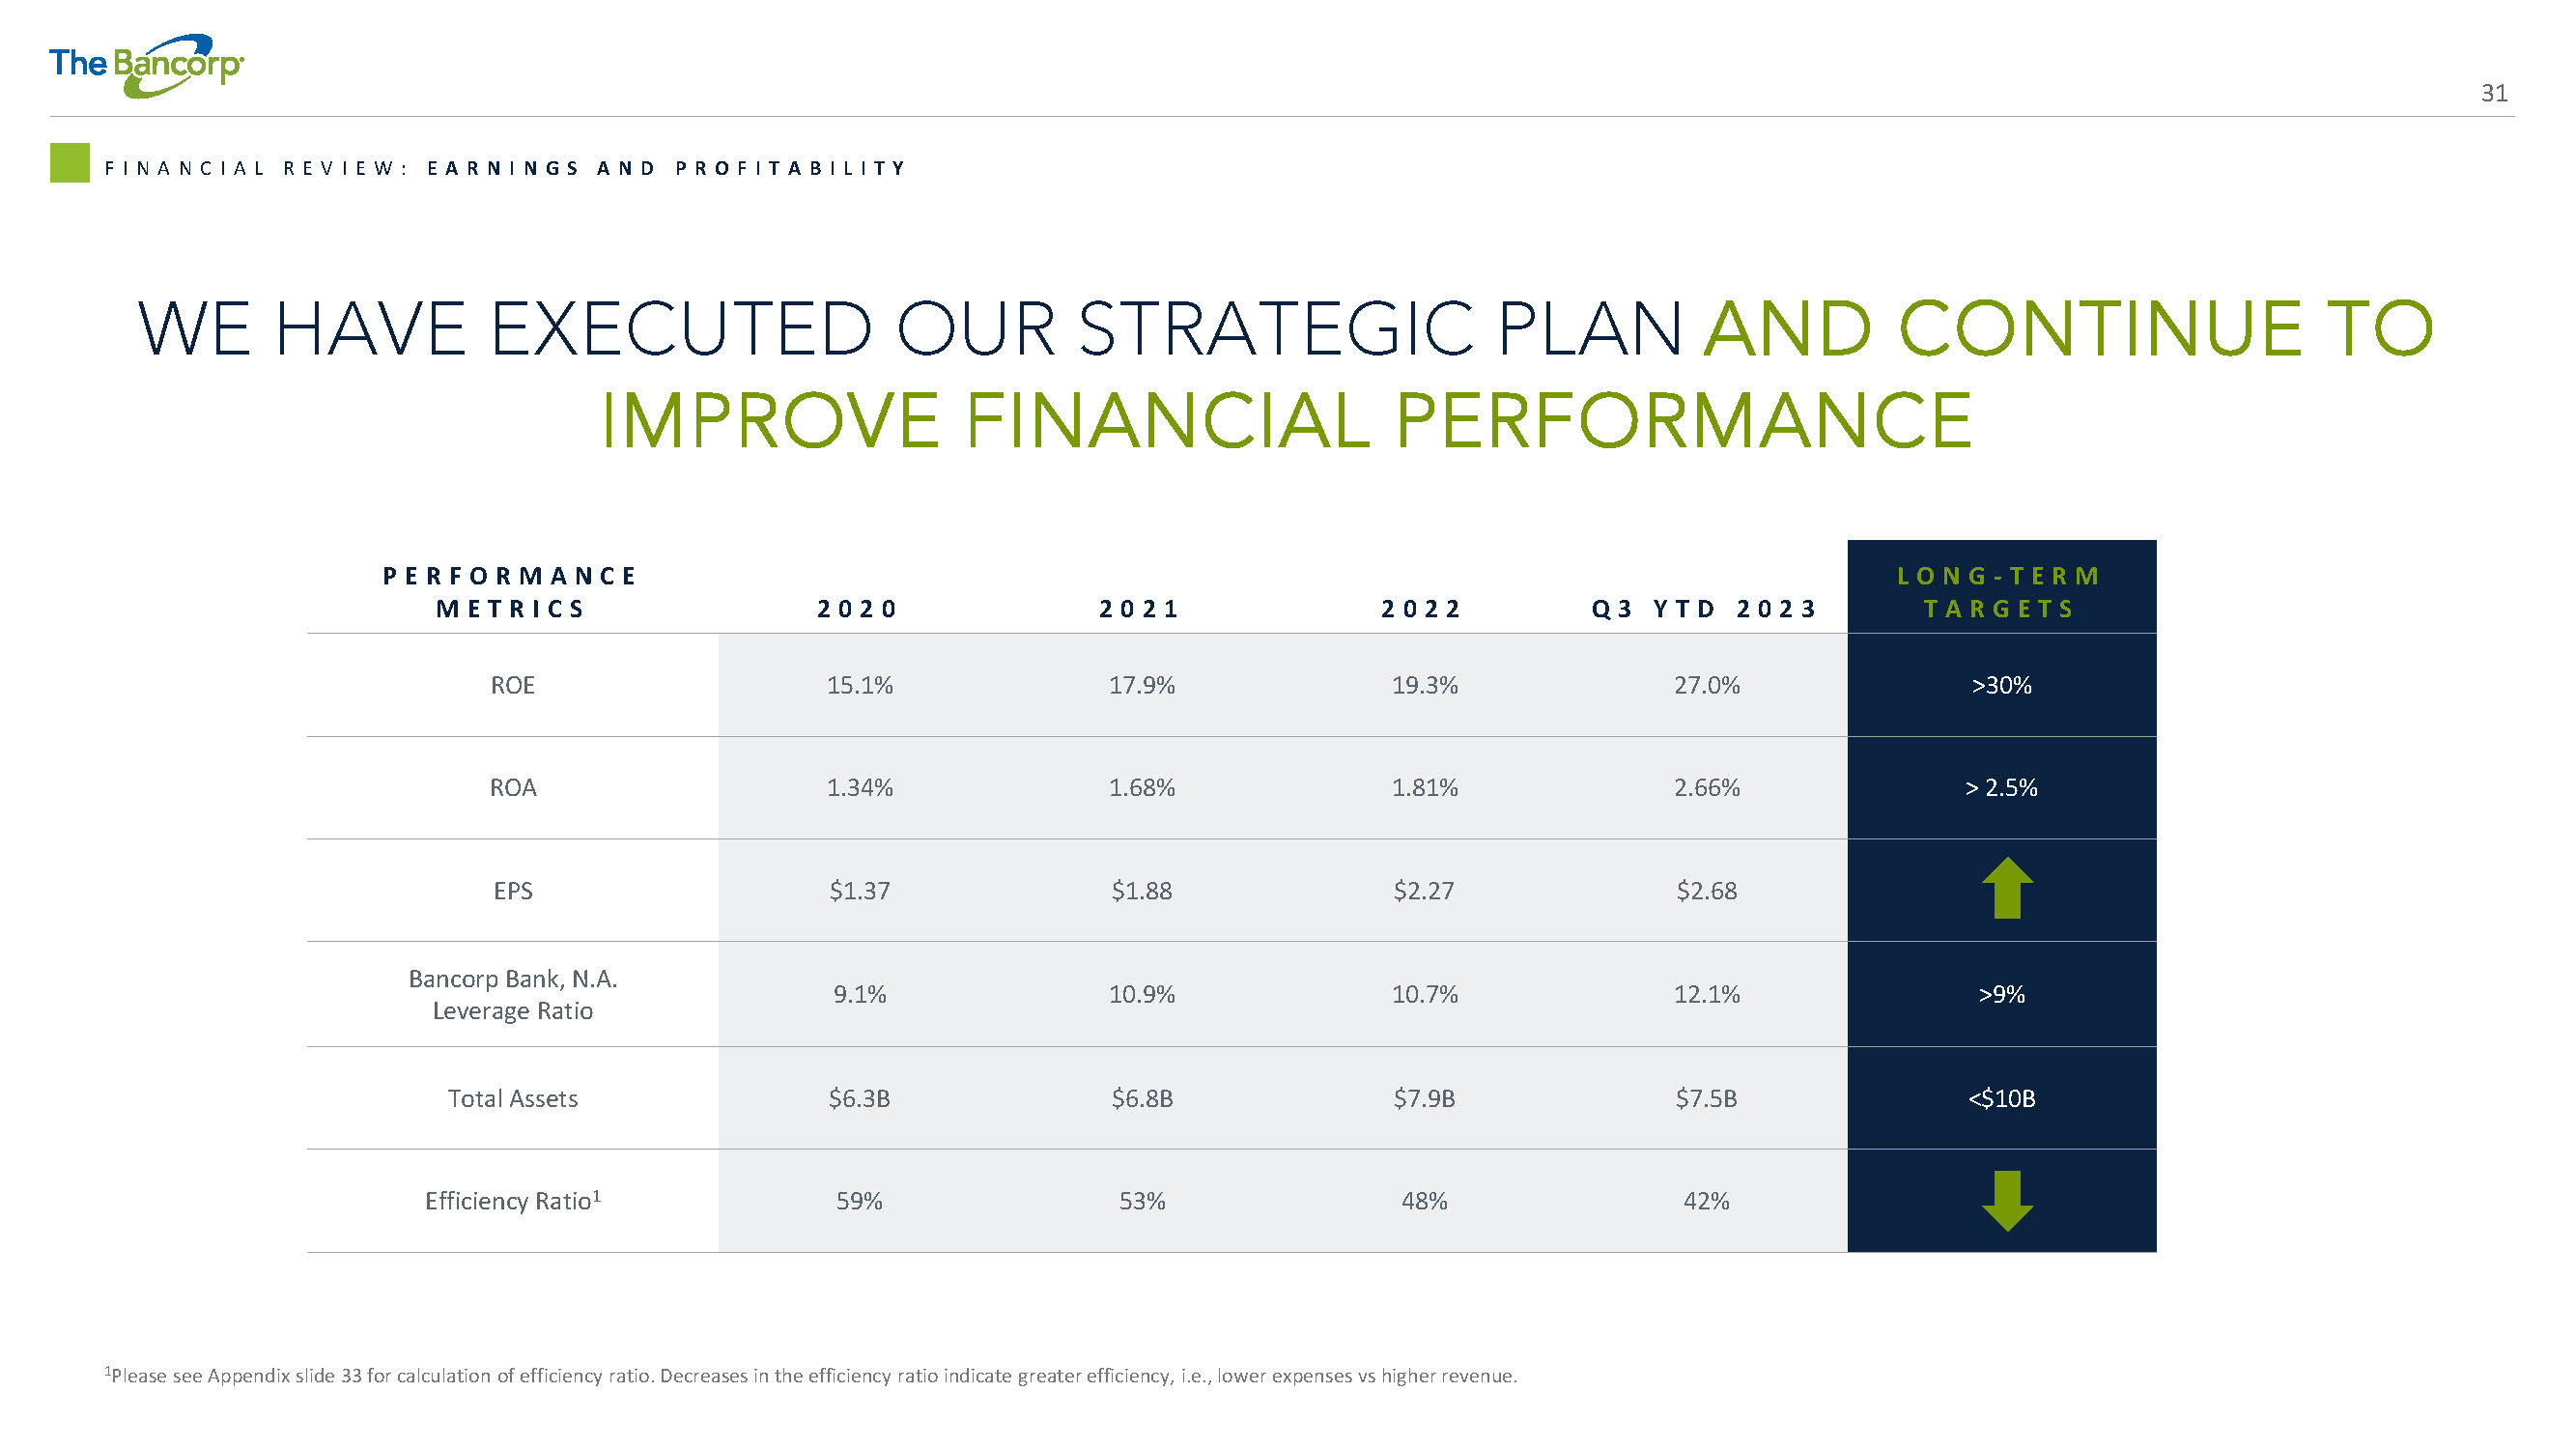
31 WE HAVE EXECUTED OUR STRATEGIC PLAN AND CONTINUE TO IMPROVE FINANCIAL PERFORMANCE F I N A N C I A L R E V I E W : E A R N I N G S A N D P R O F I T A B I L I T Y L O N G - T E R M T A R G E T S Q 3 Y T D 2 0 2 3 2 0 2 2 2 0 2 1 2 0 2 0 P E R F O R M A N C E M E T R I C S >30% 27.0% 19.3% 17.9% 15.1% ROE > 2.5% 2.66% 1.81% 1.68% 1.34% ROA $2.68 $2.27 $1.88 $1.37 EPS >9% 12.1% 10.7% 10.9% 9.1% Bancorp Bank, N.A. Leverage Ratio <$10B $7.5B $7.9B $6.8B $6.3B Total Assets 42% 48% 53% 59% Efficiency Ratio 1 1 Please see Appendix slide 33 for calculation of efficiency ratio. Decreases in the efficiency ratio indicate greater efficiency, i.e., lower expenses vs higher revenue.

APPENDIX
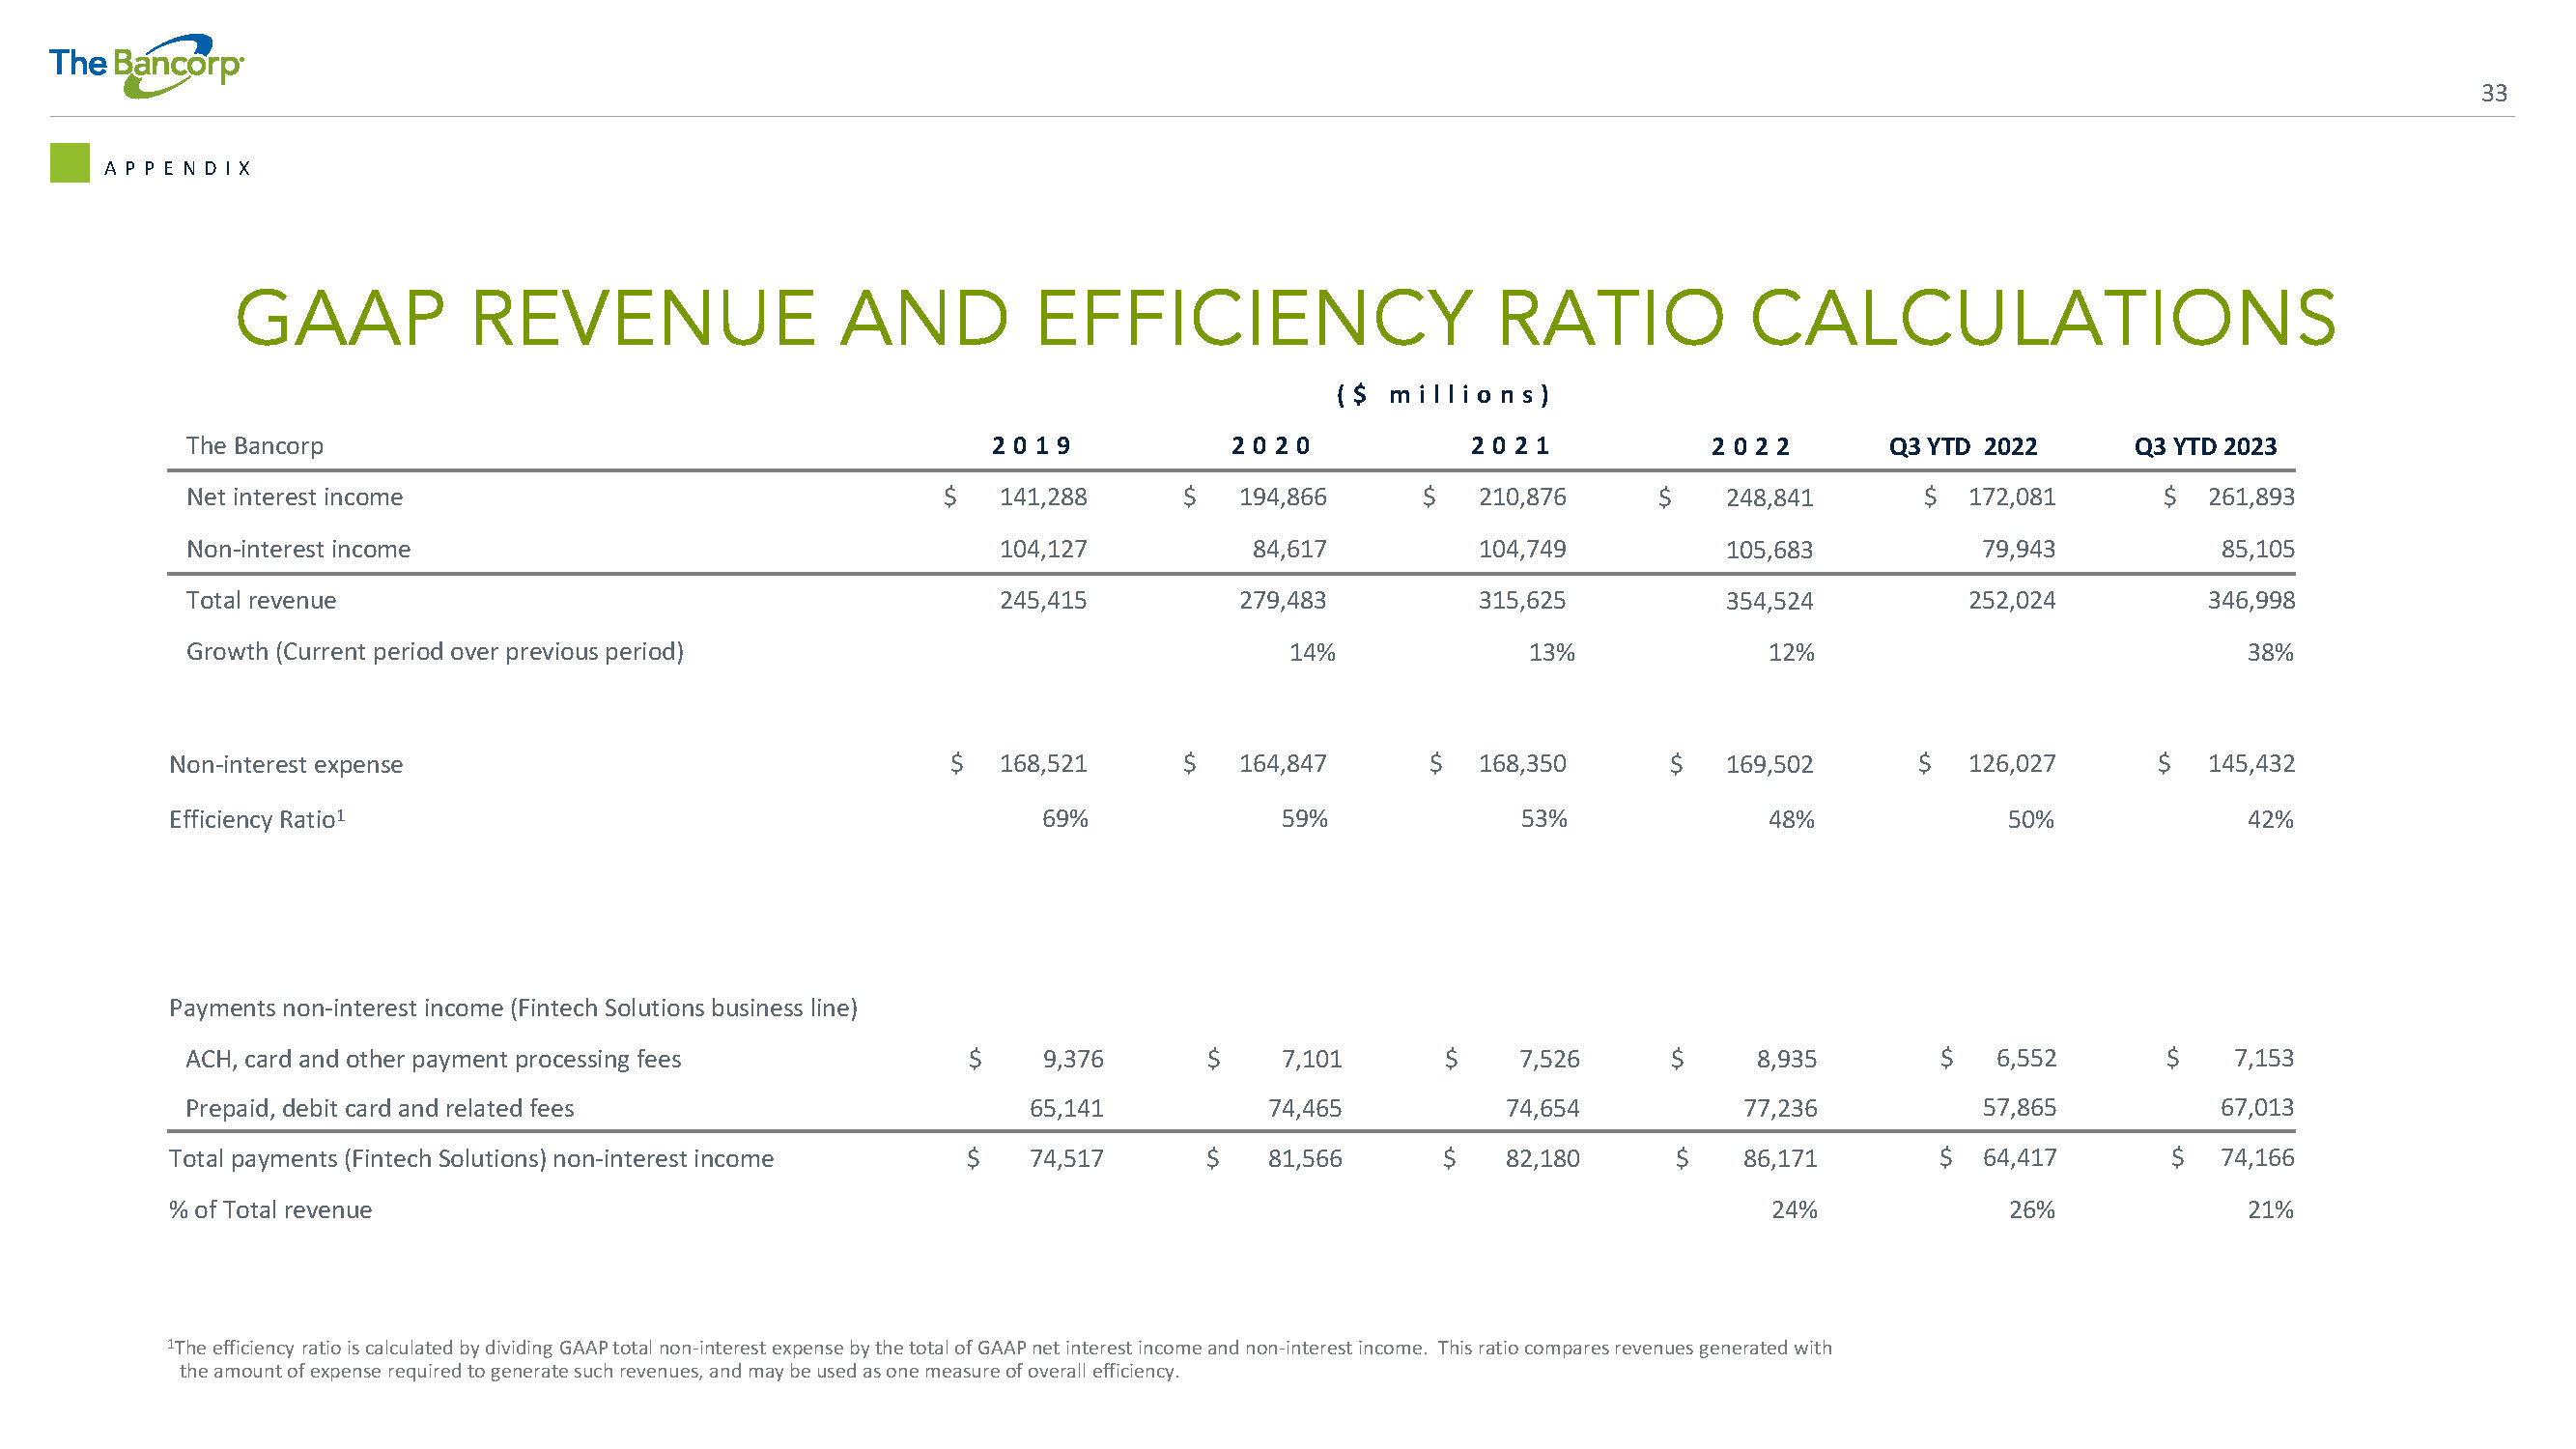
33 GAAP REVENUE AND EFFICIENCY RATIO CALCULATIONS A P P E N D I X ( $ m i l l i o n s ) Q3 YTD 2023 Q3 YTD 2022 2 0 2 2 2 0 2 1 2 0 2 0 2 0 1 9 The Bancorp $ 261,893 $ 172,081 $ 248,841 $ 210,876 $ 194,866 $ 141,288 Net interest income 85,105 79,943 105,683 104,749 84,617 104,127 Non - interest income 346,998 252,024 354,524 315,625 279,483 245,415 Total revenue 38% 12% 13% 14% Growth (Current period over previous period) $ 145,432 $ 126,027 $ 169,502 $ 168,350 $ 164,847 $ 168,521 Non - interest expense 42% 50% 48% 53% 59% 69% Efficiency Ratio 1 Payments non - interest income (Fintech Solutions business line) $ 7,153 $ 6,552 $ 8,935 $ 7,526 $ 7,101 $ 9,376 ACH, card and other payment processing fees 67,013 57,865 77,236 74,654 74,465 65,141 Prepaid, debit card and related fees $ 74,166 $ 64,417 $ 86,171 $ 82,180 $ 81,566 $ 74,517 Total payments (Fintech Solutions) non - interest income 21% 26% 24% % of Total revenue 1 The efficiency ratio is calculated by dividing GAAP total non - interest expense by the total of GAAP net interest income and non - interest income. This ratio compares revenues generated with the amount of expense required to generate such revenues, and may be used as one measure of overall efficiency.
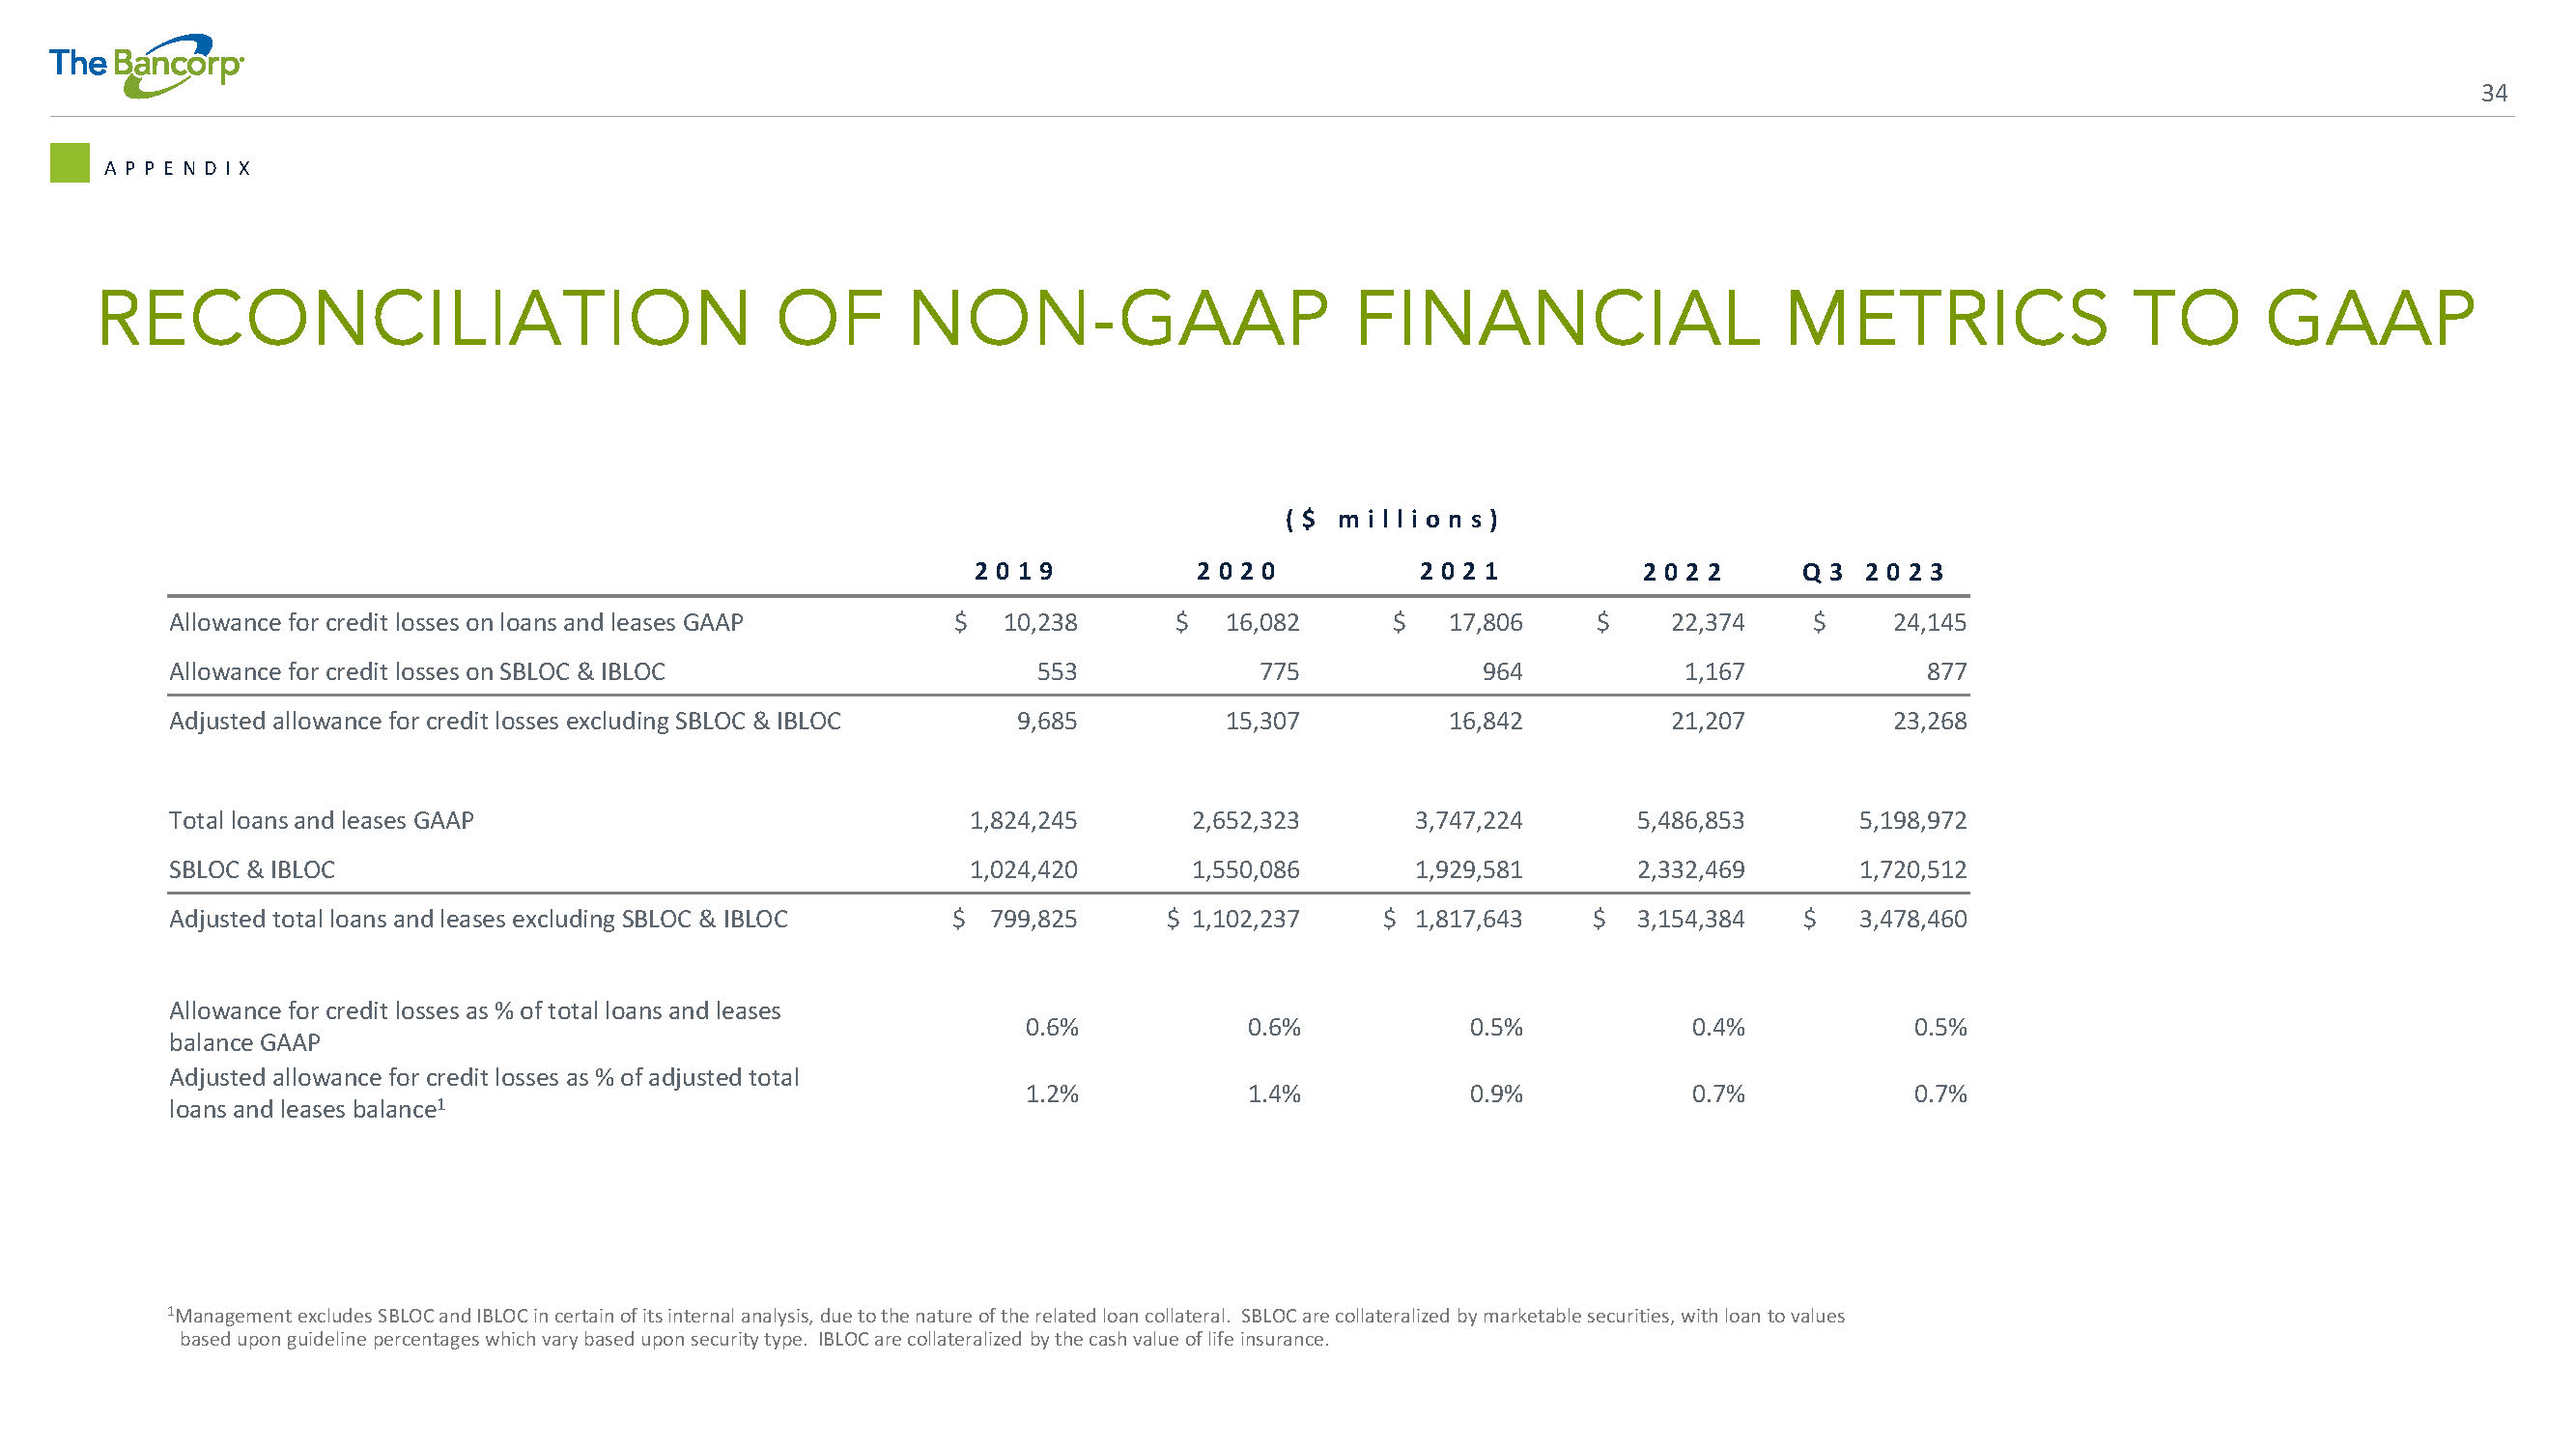
34 RECONCILIATION OF NON - GAAP FINANCIAL METRICS TO GAAP A P P E N D I X ( $ m i l l i o n s ) Q 3 2 0 2 3 2 0 2 2 2 0 2 1 2 0 2 0 2 0 1 9 $ 24,145 $ 22,374 $ 17,806 $ 16,082 $ 10,238 Allowance for credit losses on loans and leases GAAP 877 1,167 964 775 553 Allowance for credit losses on SBLOC & IBLOC 23,268 21,207 16,842 15,307 9,685 Adjusted allowance for credit losses excluding SBLOC & IBLOC 5,198,972 5,486,853 3,747,224 2,652,323 1,824,245 Total loans and leases GAAP 1,720,512 2,332,469 1,929,581 1,550,086 1,024,420 SBLOC & IBLOC $ 3,478,460 $ 3,154,384 $ 1,817,643 $ 1,102,237 $ 799,825 Adjusted total loans and leases excluding SBLOC & IBLOC 0.5% 0.4% 0.5% 0.6% 0.6% Allowance for credit losses as % of total loans and leases balance GAAP 0.7% 0.7% 0.9% 1.4% 1.2% Adjusted allowance for credit losses as % of adjusted total loans and leases balance 1 1 Management excludes SBLOC and IBLOC in certain of its internal analysis, due to the nature of the related loan collateral. SBLOC are collateralized by marketable securities, with loan to values based upon guideline percentages which vary based upon security type. IBLOC are collateralized by the cash value of life insurance.
v3.23.3
| X |
- DefinitionBoolean flag that is true when the XBRL content amends previously-filed or accepted submission.
| Name: |
dei_AmendmentFlag |
| Namespace Prefix: |
dei_ |
| Data Type: |
xbrli:booleanItemType |
| Balance Type: |
na |
| Period Type: |
duration |
|
| X |
- DefinitionFor the EDGAR submission types of Form 8-K: the date of the report, the date of the earliest event reported; for the EDGAR submission types of Form N-1A: the filing date; for all other submission types: the end of the reporting or transition period. The format of the date is YYYY-MM-DD.
| Name: |
dei_DocumentPeriodEndDate |
| Namespace Prefix: |
dei_ |
| Data Type: |
xbrli:dateItemType |
| Balance Type: |
na |
| Period Type: |
duration |
|
| X |
- DefinitionThe type of document being provided (such as 10-K, 10-Q, 485BPOS, etc). The document type is limited to the same value as the supporting SEC submission type, or the word 'Other'.
| Name: |
dei_DocumentType |
| Namespace Prefix: |
dei_ |
| Data Type: |
dei:submissionTypeItemType |
| Balance Type: |
na |
| Period Type: |
duration |
|
| X |
- DefinitionAddress Line 1 such as Attn, Building Name, Street Name
| Name: |
dei_EntityAddressAddressLine1 |
| Namespace Prefix: |
dei_ |
| Data Type: |
xbrli:normalizedStringItemType |
| Balance Type: |
na |
| Period Type: |
duration |
|
| X |
- Definition
+ References
+ Details
| Name: |
dei_EntityAddressCityOrTown |
| Namespace Prefix: |
dei_ |
| Data Type: |
xbrli:normalizedStringItemType |
| Balance Type: |
na |
| Period Type: |
duration |
|
| X |
- DefinitionCode for the postal or zip code
| Name: |
dei_EntityAddressPostalZipCode |
| Namespace Prefix: |
dei_ |
| Data Type: |
xbrli:normalizedStringItemType |
| Balance Type: |
na |
| Period Type: |
duration |
|
| X |
- DefinitionName of the state or province.
| Name: |
dei_EntityAddressStateOrProvince |
| Namespace Prefix: |
dei_ |
| Data Type: |
dei:stateOrProvinceItemType |
| Balance Type: |
na |
| Period Type: |
duration |
|
| X |
- DefinitionA unique 10-digit SEC-issued value to identify entities that have filed disclosures with the SEC. It is commonly abbreviated as CIK. Reference 1: http://www.xbrl.org/2003/role/presentationRef
-Publisher SEC
-Name Exchange Act
-Number 240
-Section 12
-Subsection b-2
| Name: |
dei_EntityCentralIndexKey |
| Namespace Prefix: |
dei_ |
| Data Type: |
dei:centralIndexKeyItemType |
| Balance Type: |
na |
| Period Type: |
duration |
|
| X |
- DefinitionIndicate if registrant meets the emerging growth company criteria. Reference 1: http://www.xbrl.org/2003/role/presentationRef
-Publisher SEC
-Name Exchange Act
-Number 240
-Section 12
-Subsection b-2
| Name: |
dei_EntityEmergingGrowthCompany |
| Namespace Prefix: |
dei_ |
| Data Type: |
xbrli:booleanItemType |
| Balance Type: |
na |
| Period Type: |
duration |
|
| X |
- DefinitionCommission file number. The field allows up to 17 characters. The prefix may contain 1-3 digits, the sequence number may contain 1-8 digits, the optional suffix may contain 1-4 characters, and the fields are separated with a hyphen.
| Name: |
dei_EntityFileNumber |
| Namespace Prefix: |
dei_ |
| Data Type: |
dei:fileNumberItemType |
| Balance Type: |
na |
| Period Type: |
duration |
|
| X |
- DefinitionTwo-character EDGAR code representing the state or country of incorporation.
| Name: |
dei_EntityIncorporationStateCountryCode |
| Namespace Prefix: |
dei_ |
| Data Type: |
dei:edgarStateCountryItemType |
| Balance Type: |
na |
| Period Type: |
duration |
|
| X |
- DefinitionThe exact name of the entity filing the report as specified in its charter, which is required by forms filed with the SEC. Reference 1: http://www.xbrl.org/2003/role/presentationRef
-Publisher SEC
-Name Exchange Act
-Number 240
-Section 12
-Subsection b-2
| Name: |
dei_EntityRegistrantName |
| Namespace Prefix: |
dei_ |
| Data Type: |
xbrli:normalizedStringItemType |
| Balance Type: |
na |
| Period Type: |
duration |
|
| X |
- DefinitionThe Tax Identification Number (TIN), also known as an Employer Identification Number (EIN), is a unique 9-digit value assigned by the IRS. Reference 1: http://www.xbrl.org/2003/role/presentationRef
-Publisher SEC
-Name Exchange Act
-Number 240
-Section 12
-Subsection b-2
| Name: |
dei_EntityTaxIdentificationNumber |
| Namespace Prefix: |
dei_ |
| Data Type: |
dei:employerIdItemType |
| Balance Type: |
na |
| Period Type: |
duration |
|
| X |
- DefinitionLocal phone number for entity.
| Name: |
dei_LocalPhoneNumber |
| Namespace Prefix: |
dei_ |
| Data Type: |
xbrli:normalizedStringItemType |
| Balance Type: |
na |
| Period Type: |
duration |
|
| X |
- DefinitionBoolean flag that is true when the Form 8-K filing is intended to satisfy the filing obligation of the registrant as pre-commencement communications pursuant to Rule 13e-4(c) under the Exchange Act. Reference 1: http://www.xbrl.org/2003/role/presentationRef
-Publisher SEC
-Name Exchange Act
-Number 240
-Section 13e
-Subsection 4c
| Name: |
dei_PreCommencementIssuerTenderOffer |
| Namespace Prefix: |
dei_ |
| Data Type: |
xbrli:booleanItemType |
| Balance Type: |
na |
| Period Type: |
duration |
|
| X |
- DefinitionBoolean flag that is true when the Form 8-K filing is intended to satisfy the filing obligation of the registrant as pre-commencement communications pursuant to Rule 14d-2(b) under the Exchange Act. Reference 1: http://www.xbrl.org/2003/role/presentationRef
-Publisher SEC
-Name Exchange Act
-Number 240
-Section 14d
-Subsection 2b
| Name: |
dei_PreCommencementTenderOffer |
| Namespace Prefix: |
dei_ |
| Data Type: |
xbrli:booleanItemType |
| Balance Type: |
na |
| Period Type: |
duration |
|
| X |
- DefinitionTitle of a 12(b) registered security. Reference 1: http://www.xbrl.org/2003/role/presentationRef
-Publisher SEC
-Name Exchange Act
-Number 240
-Section 12
-Subsection b
| Name: |
dei_Security12bTitle |
| Namespace Prefix: |
dei_ |
| Data Type: |
dei:securityTitleItemType |
| Balance Type: |
na |
| Period Type: |
duration |
|
| X |
- DefinitionName of the Exchange on which a security is registered. Reference 1: http://www.xbrl.org/2003/role/presentationRef
-Publisher SEC
-Name Exchange Act
-Number 240
-Section 12
-Subsection d1-1
| Name: |
dei_SecurityExchangeName |
| Namespace Prefix: |
dei_ |
| Data Type: |
dei:edgarExchangeCodeItemType |
| Balance Type: |
na |
| Period Type: |
duration |
|
| X |
- DefinitionBoolean flag that is true when the Form 8-K filing is intended to satisfy the filing obligation of the registrant as soliciting material pursuant to Rule 14a-12 under the Exchange Act. Reference 1: http://www.xbrl.org/2003/role/presentationRef
-Publisher SEC
-Name Exchange Act
-Section 14a
-Number 240
-Subsection 12
| Name: |
dei_SolicitingMaterial |
| Namespace Prefix: |
dei_ |
| Data Type: |
xbrli:booleanItemType |
| Balance Type: |
na |
| Period Type: |
duration |
|
| X |
- DefinitionTrading symbol of an instrument as listed on an exchange.
| Name: |
dei_TradingSymbol |
| Namespace Prefix: |
dei_ |
| Data Type: |
dei:tradingSymbolItemType |
| Balance Type: |
na |
| Period Type: |
duration |
|
| X |
- DefinitionBoolean flag that is true when the Form 8-K filing is intended to satisfy the filing obligation of the registrant as written communications pursuant to Rule 425 under the Securities Act. Reference 1: http://www.xbrl.org/2003/role/presentationRef
-Publisher SEC
-Name Securities Act
-Number 230
-Section 425
| Name: |
dei_WrittenCommunications |
| Namespace Prefix: |
dei_ |
| Data Type: |
xbrli:booleanItemType |
| Balance Type: |
na |
| Period Type: |
duration |
|
Bancorp (NASDAQ:TBBK)
Gráfica de Acción Histórica
De Abr 2024 a May 2024

Bancorp (NASDAQ:TBBK)
Gráfica de Acción Histórica
De May 2023 a May 2024
