Analyst Warns Of A ‘Super Signal’ For Cardano (ADA): Could It Outperform Bitcoin?
26 Septiembre 2024 - 11:00PM
NEWSBTC
Cardano (ADA) has recently recorded impressive gains of nearly 13%
over the past week, outperforming Bitcoin (BTC), the largest
cryptocurrency by market capitalization. Analysts are optimistic
about further price increases for ADA, particularly following the
emergence of a “super signal” on the ADA/BTC trading chart. Cardano
Price Tests Key Levels Market expert TrendRider highlighted this
potential in a recent post on X (formerly Twitter), noting that the
super signal indicates a strong possibility for ADA to gain value
against Bitcoin in the upcoming weeks. This signal carries
historical significance, boasting an 80% accuracy rate whenever it
has appeared, suggesting that further price gains for Cardano are
not just hopeful speculation but grounded in past performance.
Related Reading: Bitcoin Peaks At Highest Value In 2 Months Above
$65,000: Bull Run Predictions Currently trading at $0.398, ADA is
at a critical juncture, testing the 21-day exponential moving
average (EMA). TrendRider emphasizes that if Cardano manages to
close the week above this level, it could signal the continuation
of an upward trend. Following this, the price is expected to
encounter volatility around the $0.430 mark, where the 50-day EMA
is situated, and again at $0.490, which aligns with the 100 and
200-day moving averages. However, according to TrendRider’s
analysis, the ultimate target for Cardano could be the 200-day
simple moving average (SMA) at $0.75, which would be a significant
milestone for the token following the significant price declines it
has experienced over the past month. Market Analyst Predicts “Up
Only” Phase Further reinforcing the bullish outlook, market analyst
Alexander Legolas recently asserted that the crypto market has
entered an “up only” phase. This optimism extends not only to
Cardano but also to other prominent altcoins, which have shown
signs of recovery following two notable market corrections of over
20% each on August 5 and September 6. During these downturns,
the Cardano price fell to $0.27 and $0.303 respectively, marking
significant lows for the 2024 token after hitting its annual high
of $0.810 earlier this year during the Q1 rally, which also saw BTC
hit its all-time high of $73,700. Related Reading: Bitcoin Price
Forecast: Q4 Outlook Indicates Parabolic Move Toward $120,000
Legolas further predicts that ADA could experience substantial
upward momentum in the coming months, particularly as liquidity
increases in the altcoin market. He points to the recent breakout
of the total3 Alt chart from a massive cup and handle pattern as a
key indicator of positive market sentiment. If these
predictions come true, Cardano could even approach the $1 mark, a
rise of around 151% from current levels. However, the token would
still be down 67% from its all-time high of $3.09 reached during
the 2021 bull run. Featured image from DALL-E, chart from
TradingView.com
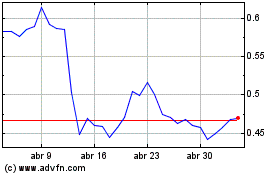
Cardano (COIN:ADAUSD)
Gráfica de Acción Histórica
De Nov 2024 a Dic 2024

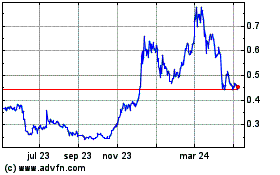
Cardano (COIN:ADAUSD)
Gráfica de Acción Histórica
De Dic 2023 a Dic 2024
