Toncoin Rally Above 4-Hour 100-Day SMA Puts TON On The Path To $7.6
09 Agosto 2024 - 10:30AM
NEWSBTC
Toncoin (TON) has gained significant upward momentum, recently
breaking above the 100-day Simple Moving Average (SMA) on the
4-hour chart. This bullish move signals strong buying interest that
could potentially put the crypto asset on the path to the $7.6
resistance level. The breakout above this key technical
indicator suggests that the bulls are in control, setting the stage
for a continued rally. This article analyzes Toncoin’s
recent breakout above the 100-day SMA on the 4-hour chart,
assesses market sentiment, and evaluates the significance of
the $7.6 resistance level as the next major target. Toncoin was
trading at approximately $6.50, marking an increase of over 3.55%,
with a market capitalization exceeding $16 billion and a trading
volume of more than $960 million at the time of writing. Over the
past 24 hours, the asset’s market cap has risen by over 3%, while
its trading volume has surged by more than 36%. Market Sentiment:
Bulls In Control Of TON’s Rally Currently, the price of Toncoin on
the 4-hour chart has been on a bullish move advancing above the
100-day Simple Moving Average (SMA) toward the $7.6 resistance
mark. The breach above this key indicator indicates continued
bullish control and the potential for further upward movement.
Additionally, a 4-hour Relative Strength Index (RSI) analysis
reveals that the indicator’s signal line has successfully climbed
above 50% and is now approaching the 70% mark, which is considered
the overbought zone. This suggests that buying pressure is
increasing, potentially leading to further upward movement for the
asset. On the 1-day chart, although Toncoin is still trading below
the 100-day SMA, it has successfully formed bullish momentum
candlesticks, aiming for both the 100-day SMA and the $7.6
resistance level, which means that the bulls are still in control
and could potentially push the price higher. Finally, on the 1-day
chart, the RSI signal line has climbed more than 35% from the
oversold zone and is currently approaching 50%, suggesting growing
bullish momentum for the cryptocurrency. Potential Scenarios: Will
Toncoin Reach $7.6 Or Face Rejection? In the event that TON’s price
reaches and breaks above the $7.6 resistance level, the crypto
asset could continue to rise, testing its all-time high of $8.30
and potentially setting a new all-time high once it surpasses this
mark. However, if Toncoin reaches the $7.6 resistance level and
faces a rebound, it might start to decline toward the $4.6 support
mark. Should the price fall below this support, it could drop
further to test the $3.3 support level and potentially continue to
lower support ranges on the chart if the $3.3 price target is
breached. Featured image from Adobe Stock, chart from
Tradingview.com
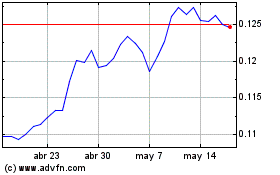
TRON (COIN:TRXUSD)
Gráfica de Acción Histórica
De Jul 2024 a Ago 2024

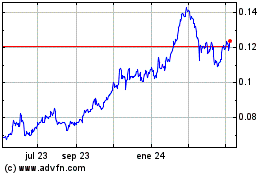
TRON (COIN:TRXUSD)
Gráfica de Acción Histórica
De Ago 2023 a Ago 2024
