0001839530false0001839530xbp:RedeemableWarrantsMember2024-05-132024-05-130001839530us-gaap:CommonStockMember2024-05-132024-05-1300018395302024-05-132024-05-13

UNITED STATES

SECURITIES AND EXCHANGE COMMISSION

Washington, D.C. 20549

FORM 8-K

CURRENT REPORT

Pursuant to Section 13 or Section 15(d)

of the Securities Exchange Act of 1934

Date of Report (Date of earliest event reported): May 13, 2024

XBP Europe Holdings, Inc.

(Exact name of registrant as specified in its charter)

Delaware


001-40206


85-2002883

(State or other jurisdiction of incorporation or organization)

(Commission File Number)

(I.R.S. Employer Identification Number)

2701 East Grauwyler Road Irving, Texas


75061

(Address of principal executive offices)

(Zip Code)

(844) 935-2832

Registrant’s telephone number, including area code

Not Applicable

(Former name or former address, if changed since last report)

Check the appropriate box below if the Form 8-K filing is intended to simultaneously satisfy the filing obligation of the Registrant under any of the following provisions:

Written communications pursuant to Rule 425 under the Securities Act (17 CFR 230.425)

Soliciting material pursuant to Rule 14a-12 under the Exchange Act (17 CFR 240.14a-12)

Pre-commencement communications pursuant to Rule 14d-2(b) under the Exchange Act (17 CFR 240.14d-2(b))

Pre-commencement communications pursuant to Rule 13e-4(c) under the Exchange Act (17 CFR 240.13e-4(c))

Securities registered pursuant to Section 12(b) of the Act:

Title of each class


Trading
Symbol(s)


Name of each exchange
on which registered

Common stock, par value $0.0001 per share

XBP

The Nasdaq Global Market

Redeemable warrants, each whole warrant exercisable for one share of common stock at an exercise price of $11.50

XBPEW

The Nasdaq Capital Market

Indicate by check mark whether the registrant is an emerging growth company as defined in Rule 405 of the Securities Act of 1933 (§230.405 of this chapter) or Rule 12b-2 of the Securities Exchange Act of 1934 (§240.12b-2of this chapter).

Emerging growth company

If an emerging growth company, indicate by check mark if the registrant has elected not to use the extended transition period for complying with any new or revised financial accounting standards provided pursuant to Section 13(a) of the Exchange Act.

Item 2.02 Results of Operations and Financial Condition.

On May 13, 2024, XBP Europe Holding, Inc. (the “Company”) issued a press release reporting financial results for the quarter ended March 31, 2024. The full text of the press release is furnished as Exhibit 99.1 to this Current Report on Form 8-K.

The information contained in Item 2.02 and Exhibit 99.1 attached hereto shall not be deemed “filed” for purposes of Section 18 of the Securities Exchange Act of 1934, as amended (the “Exchange Act”), or otherwise subject to the liabilities of that section, nor shall it be deemed incorporated by reference in any filing under the Securities Act of 1933, as amended (the “Securities Act”), or the Exchange Act, except as expressly set forth by specific reference in such a filing.

Item 7.01. Regulation FD Disclosure

On May 13, 2024, the Company posted an investor presentation to its website (www.xbpeurope.com). A copy of the investor presentation is furnished as Exhibit 99.2 to this Current Report on Form 8-K.

The information contained in this Item 7.01 and Exhibit 99.2 attached hereto shall not be deemed “filed” for purposes of Section 18 of the Exchange Act or otherwise subject to the liabilities of that section, nor will it be deemed incorporated by reference in any filing under the Securities Act or the Exchange Act, except as expressly set forth by specific reference in such filing.

Item 9.01. Financial Statements and Exhibits.

(d)Exhibits.

Exhibit No.


Description

99.1

Press Release dated May 13, 2024 announcing the first quarter results.

99.2

Investor Presentation dated May 13, 2024

104

Cover Page Interactive Data File (embedded within the Inline XBRL document)

SIGNATURE

Pursuant to the requirements of the Securities Exchange Act of 1934, the registrant has duly caused this report to be signed on its behalf by the undersigned hereunto duly authorized.

Dated: May 13, 2024

XBP EUROPE HOLDINGS, INC.

By:

/s/ Dejan Avramovic

Dejan Avramovic

Chief Financial Officer

Exhibit 99.1

Graphic

XBP Europe Holdings, Inc. Reports First Quarter 2024 Results

May 13, 2024

First Quarter Highlights

Revenue of $40.4 million, down 5.7% year-over-year (7.3% on a constant currency basis)
Gross margin grew to 24.6%, a 270 bps increase sequentially and 250 bps increase year-over-year
Net loss of $2.2 million includes $0.8 million of FX losses
High margin Technology segment grew to 28.4% of revenues, a 120 bps increase sequentially and 690 bps increase year-over-year
Awarded a multi-year contract with His Majesty’s Passport Office (“HMPO”) for a nationwide project in the UK with a Total Contract Value (“TCV”) of approximately $40 million

LONDON, UK and Santa Monica, CA, May 13, 2024 (GLOBE NEWSWIRE) – XBP Europe Holdings, Inc. (“XBP Europe” or the “Company”) (NASDAQ: XBP), a pan-European integrator of bills, payments, and related solutions and services seeking to enable the digital transformation of its clients, announced today its financial results for the first quarter ended March 31, 2024.

“We are excited to report results for our first full quarter as a public company. Our focus on sales execution is paying off, as evidenced by our recently announced transformation project win for HMPO in the UK. As a result of improved operating leverage and revenue mix shifting towards more technology, we continue to see solid expansion of our gross margins. We are off to an encouraging start in 2024 and well-positioned to execute on our growth objectives,” said Andrej Jonovic, Chief Executive Officer of XBP Europe.

Revenue: Total Revenue was $40.4 million, a decline of 5.7% compared to $42.8 million in 1Q 2023, primarily due to a large one-time license sale in 1Q 2023, as well as completion of one-time projects, lower volumes, and client contract ends, offset by positive impact of new business.

Bills & Payments segment revenue was $28.9 million, a decline of 14.0% year-over-year, due to completion of projects, lower volumes, and client contract ends, offset by positive impact of newly won business, some of which is in early stage of ramp.

Technology segment revenue was $11.5 million, an increase of 24.3% year-over-year, led by higher volume of software licenses sold and an increase in technology implementation and professional services revenue, partially offset by lower hardware revenues and a large one-time license sale in 1Q 2023.

Technology segment revenue was 28.4% of total revenues, an increase from 21.6% in 1Q 2023 and 27.1% in 4Q 2023.

Operating Income: Operating income was $0.1 million, compared with operating loss of $1.0 million in 1Q 2023. This improvement was driven by favorable mix shift given higher operating margins in the Technology segment, coupled with SG&A cost optimization, which included reduced operating lease and facility expenses in the quarter.

Net Loss: Net loss was $2.2 million, compared with a net loss of $2.5 million in 1Q 2023. The year-over-year decrease was primarily driven by improved operating profit, partially offset by higher FX losses in the quarter.

Adjusted EBITDA(1): Adjusted EBITDA was $1.8 million, a decrease of 23.4% compared to $2.4 million in 1Q 2023. Adjusted EBITDA margin was 4.5%, a decrease of 105 basis points from 5.6% in 1Q 2023.

Capital Expenditures: Capital expenditures were 0.1% of revenue compared to 1.5% of revenue in 1Q 2023, with the reduction primarily due to less investment in PP&E during the quarter versus a year ago. The Company expects to spend approximately $1.5 to $2.5 million on capital expenditures and capitalizable contracts set-up cost over the next 12 months.

Adequate Liquidity: The Company’s cash and cash equivalents totaled $3.5 million as of March 31, 2024. To fund our growth, our Secured Borrowing Facility (amended factoring agreement) provides for sale of new receivables up to a funding limit of €15.0 million.

Operational Highlights:

HMPO Contract: As announced on May 2, 2024, XBP Europe was selected by His Majesty’s Passport Office (“HMPO”) as its technology and services partner on a nationwide project, which aims to make documents dating back to 1837 digitally available to the General Register Office (“GRO”). The multi-year contract in the UK has an approximate Total Contract Value (“TCV”) of $40 million and is expected to go live by the summer of 2024.

Segment Revenue and Profitability:

Three months ended March 31, 2024

Bills & Payments


Technology


Total

Revenue, net

$ 28,874

$ 11,476

$ 40,350

Cost of revenue

25,317

5,097

30,414

Segment Gross Profit

3,557

6,379

9,936

Three months ended March 31, 2023

Bills & Payments


Technology


Total

Revenue, net

$ 33,568

$ 9,233

$ 42,801

Cost of revenue

28,725

4,616

33,341

Segment Gross Profit

4,843

4,617

9,460

Below is the note referenced above:

(1)

Adjusted EBITDA is a non-GAAP measure. A reconciliation of Adjusted EBITDA is attached to this release.

Supplemental Investor Presentation

An investor presentation relating to our first quarter 2024 performance is available at investors.xbpeurope.com. This information has also been furnished to the SEC in a current report on Form 8-K.

About Non-GAAP Financial Measures

This press release includes constant currency, EBITDA and Adjusted EBITDA, each of which is a financial measure that is not prepared in accordance with U.S. generally accepted accounting principles (“GAAP”). XBP Europe believes that the presentation of these non-GAAP financial measures will provide useful information to investors in assessing our financial performance, results of operations and liquidity and allows investors to better understand the trends in our business and to better understand and compare our results. XBP Europe’s board of directors and management use constant currency, EBITDA and Adjusted EBITDA to assess XBP Europe’s financial performance, because it allows them to compare XBP Europe’s operating performance on a consistent basis across periods by removing the effects of XBP Europe’s capital structure (such as varying levels of debt and interest expense, as well as transaction costs resulting from the combination with CF Acquisition Corp. VIII. on November 29, 2023). Adjusted EBITDA also seeks to remove the effects of restructuring and related expenses and other similar non-routine items, some of which are outside the control of our management team. Restructuring expenses are primarily related to the implementation of strategic actions and initiatives related to right sizing of the business. All of these costs are variable and dependent upon the nature of the actions being implemented and can vary significantly driven by business needs. Accordingly, due to that significant variability, we exclude these charges since we do not believe they truly reflect our past, current or future operating performance. The constant currency presentation excludes the impact of fluctuations in foreign currency exchange rates. We calculate constant currency revenue on a constant currency basis by converting our current-period local currency revenue using the exchange rates from the corresponding prior-period and compare these adjusted amounts to our corresponding prior period reported results. XBP Europe does not consider these non-GAAP measures in isolation or as an alternative to liquidity or financial measures determined in accordance with GAAP. A limitation of these non-GAAP financial measures


is that they exclude significant expenses and income that are required by GAAP to be recorded in XBP Europe’s financial statements. In addition, they are subject to inherent limitations as they reflect the exercise of judgments by management about which expenses and income are excluded or included in determining these non-GAAP financial measures and therefore the basis of presentation for these measures may not be comparable to similarly-titled measures used by other companies. These non-GAAP financial measures are not required to be uniformly applied, are not audited and should not be considered in isolation or as substitutes for results prepared in accordance with GAAP. Net loss is the GAAP measure most directly comparable to the non-GAAP measures presented here. For reconciliation of the comparable GAAP measures to these non-GAAP financial measures, see the schedules attached to this release.

Forward-Looking Statements

This press release contains certain “forward-looking statements” within the meaning of the United States Private Securities Litigation Reform Act of 1995, Section 27A of the Securities Act of 1933, as amended (the “Securities Act”), and Section 21E of the Exchange Act, including certain financial forecasts and projections. All statements other than statements of historical fact contained in this press release, including statements as to future results of operations and financial position, revenue and other metrics planned products and services, business strategy and plans, objectives of management for future operations of XBP Europe, market size and growth opportunities, competitive position and technological and market trends, are forward-looking statements. Some of these forward-looking statements can be identified by the use of forward-looking words, including “may,” “should,” “expect,” “intend,” “will,” “estimate,” “anticipate,” “believe,” “predict,” “plan,” “targets,” “projects,” “could,” “would,” “continue,” “forecast” or the negatives of these terms or variations of them or similar expressions. All forward-looking statements are subject to risks, uncertainties, and other factors which could cause actual results to differ materially from those expressed or implied by such forward-looking statements. All forward-looking statements are based upon estimates, forecasts and assumptions that, while considered reasonable by XBP Europe and its management, as the case may be, are inherently uncertain and many factors may cause the actual results to differ materially from current expectations which include, but are not limited to: (1) the outcome of any legal proceedings that may be instituted against XBP Europe or others and any definitive agreements with respect thereto; (2) the inability to meet the continued listing standards of Nasdaq or another securities exchange; (3) the risk that the business combination disrupts current plans and operations of XBP Europe and its subsidiaries; (4) the inability to recognize the anticipated benefits of the business combination, which may be affected by, among other things, competition, the ability of XBP Europe and its subsidiaries to grow and manage growth profitably, maintain relationships with customers and suppliers and retain its management and key employees; (5) costs related to the business combination; (6) changes in applicable laws or regulations; (7) the possibility that XBP Europe or any of its subsidiaries may be adversely affected by other economic, business and/or competitive factors; (8) risks related to XBP Europe’s potential inability to achieve or maintain profitability and generate cash; (9) the impact of the COVID-19 pandemic, including any mutations or variants thereof, and its effect on business and financial conditions; (10) volatility in the markets caused by geopolitical and economic factors; (11) the ability of XBP Europe to retain existing clients; (12) the potential inability of XBP Europe to manage growth effectively; (13) the ability to recruit, train and retain qualified personnel, and (14) other risks and uncertainties set forth in the sections entitled “Risk Factors” and “Cautionary Note Regarding Forward-Looking Statements” in the Annual Reports on Form 10-K filed on April 1, 2024 and, our subsequent quarterly reports on Form 10-Q and our current reports on Form 8-K as filed with the Securities and Exchange Commission (the “SEC”). These filings identify and address other important risks and uncertainties that could cause actual events and results to differ materially from those contained in the forward-looking statements. Nothing in this press release should be regarded as a representation by any person that the forward-looking statements set forth herein will be achieved or that any of the contemplated results of such forward-looking statements will be achieved. Readers should not place undue reliance on forward-looking statements, which speak only as of the date they are made. XBP Europe gives no assurance that either XBP Europe or any of its subsidiaries will achieve its expected results. XBP Europe undertakes no duty to update these forward-looking statements, except as otherwise required by law.

About XBP Europe

XBP Europe is a pan-European integrator of bills, payments and related solutions and services seeking to enable digital transformation of its more than 2,000 clients. The Company’s name – ‘XBP’ stands for ‘exchange for bills and payments’ and reflects the Company’s strategy to connect buyers and suppliers, across industries, including banking, healthcare, insurance, utilities and the public sector, to optimize clients’ bills and payments and related digitization processes. The Company provides business process management solutions with proprietary software suites and deep domain expertise, serving as a technology and services partner for its clients. Its cloud-based structure enables it to deploy its solutions across the European market, along with the Middle East and Africa. The physical footprint of XBP Europe spans 15 countries and 32 locations and a team of approximately 1,500 individuals. XBP Europe believes its business ultimately advances digital transformation, improves market wide liquidity by expediting payments, and encourages sustainable business practices. For more information, please visit: www.xbpeurope.com.


For more XBP Europe news, commentary, and industry perspectives, visit: https://www.xbpeurope.com/

And please follow us on social:

X: https://X.com/XBPEurope

LinkedIn: https://www.linkedin.com/company/xbp-europe/

The information posted on XBP Europe's website and/or via its social media accounts may be deemed material to investors. Accordingly, investors, media and others interested in XBP Europe should monitor XBP Europe’s website and its social media accounts in addition to XBP Europe’s press releases, SEC filings and public conference calls and webcasts.

Investor and/or Media Contacts:

investors@xbpeurope.com


XBP Europe Holdings, Inc.

Condensed Consolidated Balance Sheets

As of March 31, 2024 and December 31, 2023

(in thousands of United States dollars except share and per share amounts)

March 31, 

December 31,


2024


2023

ASSETS


Current assets


Cash and cash equivalents

$

3,501

$

6,905

Accounts receivable, net of allowance for credit losses of $1,489 and $1,272, respectively


30,945


30,795

Inventories, net


4,738


4,740

Prepaid expenses and other current assets


8,488


7,427

Total current assets


47,672


49,867

Property, plant and equipment, net of accumulated depreciation of $42,840 and $42,990, respectively


13,338


13,999

Operating lease right-of-use assets, net


6,940


6,865

Goodwill


22,383


22,910

Intangible assets, net


1,285


1,498

Deferred income tax assets


6,686


6,861

Other noncurrent assets


831


739

Total assets

$

99,135

$

102,739

LIABILITIES AND STOCKHOLDERS’ DEFICIT


LIABILITIES


Current liabilities


Accounts payable

$

15,599

$

14,414

Related party payables


11,766


13,350

Accrued liabilities


23,319


24,742

Accrued compensation and benefits


16,288


16,583

Customer deposits


329


536

Deferred revenue


6,403


6,004

Current portion of finance lease liabilities


538


638

Current portion of operating lease liabilities


1,950


1,941

Current portion of long-term debts


4,650


3,863

Total current liabilities


80,842


82,071

Related party notes payable


1,518


1,542

Long-term debt, net of current maturities


12,607


12,763

Finance lease liabilities, net of current portion


8


23

Pension liabilities


11,627


12,208

Operating lease liabilities, net of current portion


5,178


5,065

Other long-term liabilities


1,563


1,635

Total liabilities

$

113,343

$

115,307

Commitments and Contingencies (Note 12)


STOCKHOLDERS’ DEFICIT


Preferred stock, par value of $0.0001 per share; 10,000,000 shares authorized; none issued and outstanding as of March 31, 2024 and December 31, 2023, respectively


Common Stock, par value of $0.0001 per share; 160,000,000 shares authorized; 30,166,102 shares issued and outstanding as of March 31, 2024 and December 31, 2023, respectively


30


30

Accumulated deficit


(13,547)


(11,339)

Accumulated other comprehensive loss:


Foreign currency translation adjustment


(1,138)


(1,416)

Unrealized pension actuarial gains, net of tax


447


157

Total accumulated other comprehensive loss


(691)


(1,259)

Total stockholders’ deficit


(14,208)


(12,568)

Total liabilities and stockholders’ deficit

$

99,135

$

102,739


XBP Europe Holdings, Inc.

Condensed Consolidated Statements of Operations

For the three months ended March 31, 2024 and 2023

(in thousands of United States dollars except share and per share amounts)

Three months ended March 31, 


2024


2023

Revenue, net

$

40,284

$

42,778

Related party revenue, net


66


23

Cost of revenue (exclusive of depreciation and amortization)


30,396


33,290

Related party cost of revenue


18


51

Selling, general and administrative expenses (exclusive of depreciation and amortization)


7,946


8,414

Related party expense


962


1,165

Depreciation and amortization


957


910

Operating profit (loss)


71


(1,029)

Other expense (income), net


Interest expense, net


1,427


1,253

Related party interest income, net


19


45

Foreign exchange losses, net


832


279

Changes in fair value of warrant liability


(37)


Pension income, net


(422)


(192)

Net loss before income taxes


(1,748)


(2,414)

Income tax expense


460


92

Net loss

$

(2,208)

$

(2,506)

Loss per share:


Basic and diluted

$

(0.07)

$

(0.11)


XBP Europe Holdings, Inc.

Condensed Consolidated Statements of Cash Flows

For the three months ended March 31, 2024 and 2023

(in thousands of United States dollars)

Three months ended March 31, 


2024


2023

Cash flows from operating activities

Net loss

$

(2,208)

$

(2,506)

Adjustments to reconcile net loss to net cash used in operating activities:


Depreciation


776


814

Amortization of intangible assets


181


130

Credit loss expense


217


29

Changes in fair value of warrant liability

(37)

Unrealized foreign currency losses


759


592

Change in deferred income taxes


44


45

Change in operating assets and liabilities


Accounts receivable


(1,160)


2,114

Inventories


(102)


323

Prepaid expense and other assets


(1,342)


(822)

Accounts payable


1,463


(2,488)

Related parties payable


(1,711)


(1,473)

Accrued expenses and other liabilities


(791)


(2,416)

Deferred revenue


492


1,550

Customer deposits


(191)


(639)

Net cash used in operating activities


(3,610)


(4,747)

Cash flows from investing activities


Purchase of property, plant and equipment


(385)


(622)

Net cash used in investing activities


(385)


(622)

Cash flows from financing activities


Borrowings under secured borrowing facility


37


32,080

Principal repayment on borrowings under secured borrowing facility


(31,325)

Principal payments on long-term obligations

(235)

(225)

Proceeds from Secured Credit Facility


976


Principal payments on finance leases


(100)


(196)

Net cash provided by financing activities


678


334

Effect of exchange rates on cash and cash equivalents


(87)


(158)

Net decrease in cash and cash equivalents


(3,404)


(5,193)

Cash and equivalents, beginning of period


6,905


7,473

Cash and equivalents, end of period

$

3,501

$

2,280

Supplemental cash flow data:


Income tax payments, net of refunds received


(16)


493

Interest paid


534


433


XBP Europe Holdings, Inc.

Schedule 1: Reconciliation of Adjusted EBITDA and constant currency revenues

Reconciliation of Non-GAAP Financial Measures to GAAP Measures

Non-GAAP constant currency revenue reconciliation

Quarter ended March 31, 

($ in thousands)


2024


2023

Revenues, as reported (GAAP)

40,350

42,801

Foreign currency exchange impact (1)

(673)


Revenues, at constant currency (Non-GAAP)

39,677

42,801

Reconciliation of Adjusted EBITDA

Quarter ended March 31, 

($ in thousands)


2024


2023

Net loss (GAAP)

(2,208)

(2,506)

Income tax expenses

460

92

Interest expense including related party interest expense, net

1,446

1,298

Depreciation and amortization

957

910

EBITDA (Non-GAAP)

655

(206)

Restructuring and related expenses (2)

332

818

Related party management fee and royalties

-

401

Foreign exchange losses, net

832

279

Changes in fair value of warrant liability

(37)

-

Transaction Fees (3)

49

1,099

Adjusted EBITDA (Non-GAAP) (4)

1,831

2,391

(1)

Constant currency excludes the impact of foreign currency fluctuations and is computed by applying the average exchange rates for the quarter ended March 31, 2023, to the revenues during the corresponding period in 2024.

(2)

Adjustment represents costs associated with restructuring, including employee severance and vendor and lease termination costs.

(3)

Represents transaction costs incurred as part of the Business Combination.

(4)

Supplemental financial measures that are not required by, or presented in accordance with, accounting principles generally accepted in the United States (“GAAP”). These non-GAAP financial measures should not be considered as alternatives to operating or net income or cash flows from operating activities, in each case determined in accordance with GAAP. These non-GAAP financial measures are among the indicators used by management to measure the performance of the Company’s operations, and also among the criteria upon which performance-based compensation may be based. Adjusted EBITDA also is used by our lenders for debt covenant compliance purposes.

Similar non-GAAP financial measures may be calculated differently by other companies, including other companies in our industry, limiting their usefulness as comparative measures. Because of these limitations, you should consider the non-GAAP financial measures alongside other performance measures and liquidity measures, including operating income, various cash flow metrics, net income and our other GAAP results.

Source: XBP Europe Holdings, Inc.


Exhibit 99.2

GRAPHIC

©XBP EUROPE 2024 First Quarter 2024 Results May 13, 2024

GRAPHIC

©XBP EUROPE 2024 Safe Harbor Statements Forward-Looking Statements: Certain statements included in this presentation are not historical facts but are forward-looking statements for purposes of the safe harbor provisions under The Private Securities Litigation Reform Act of 1995. Forward-looking statements generally are accompanied by words such as “may”, “should”, “would”, “plan”, “intend”, “anticipate”, “believe”, “estimate”, “predict”, “potential”, “seem”, “seek”, “continue”, “future”, “will”, “expect”, “outlook” or other similar words, phrases or expressions. These forward-looking statements include statements regarding our industry, future events, estimated or anticipated future results and benefits, future opportunities for XBP Europe Holdings, Inc. (“XBP Europe” or the “Company”), and other statements that are not historical facts. These statements are based on the current expectations of XBP Europe management and are not predictions of actual performance. These statements are subject to a number of risks and uncertainties, including without limitation (1) the outcome of any legal proceedings that may be instituted against XBP Europe or others and any definitive agreements with respect thereto; (2) the inability to meet the continued listing standards of Nasdaq or another securities exchange; (3) the risk that the business combination disrupts current plans and operations of XBP Europe and its subsidiaries; (4) the inability to recognize the anticipated benefits of the business combination, which may be affected by, among other things, competition, the ability of XBP Europe and its subsidiaries to grow and manage growth profitably, maintain relationships with customers and suppliers and retain its management and key employees; (5) costs related to the business combination; (6) changes in applicable laws or regulations; (7) the possibility that XBP Europe or any of its subsidiaries may be adversely affected by other economic, business and/or competitive factors; (8) risks related to XBP Europe’s potential inability to achieve or maintain profitability and generate cash; (9) the impact of the COVID-19 pandemic, including any mutations or variants thereof, and its effect on business and financial conditions; (10) volatility in the markets caused by geopolitical and economic factors; (11) the ability of XBP Europe to retain existing clients; (12) the potential inability of XBP Europe to manage growth effectively; (13) the ability to recruit, train and retain qualified personnel, and (14) other risks and uncertainties set forth in the sections entitled “Risk Factors” and “Cautionary Note Regarding Forward-Looking Statements” in the Annual Reports on Form 10-K filed on April 1, 2024 and subsequent filings with the Securities and Exchange Commission (the “SEC”). In addition, forward-looking statements provide XBP Europe’s expectations, plans or forecasts of future events and views as of the date of this communication. XBP Europe anticipates that subsequent events and developments will cause XBP Europe’s assessments to change. These forward-looking statements should not be relied upon as representing XBP Europe’s assessments as of any date subsequent to the date of this presentation. Non-GAAP Financial Measures: This presentation includes constant currency, EBITDA and Adjusted EBITDA, each of which is a financial measure that is not prepared in accordance with U.S. generally accepted accounting principles (“GAAP”). XBP Europe believes that the presentation of these non-GAAP financial measures will provide useful information to investors in assessing our financial performance, results of operations and liquidity and allows investors to better understand the trends in our business and to better understand and compare our results. XBP Europe’s board of directors and management use constant currency, EBITDA and Adjusted EBITDA to assess XBP Europe’s financial performance, because it allows them to compare XBP Europe’s operating performance on a consistent basis across periods by removing the effects of XBP Europe’s capital structure (such as varying levels of debt and interest expense, as well as transaction costs resulting from the business combination with CF Acquisition Corp. VIII on November 29, 2023). Adjusted EBITDA also seeks to remove the effects of integration and related restructuring expenses and other similar non-routine items, some of which are outside the control of our management team. Restructuring expenses are primarily related to the implementation of strategic actions and initiatives related to right-sizing of the business. All of these costs are variable and dependent upon the nature of the actions being implemented and can vary significantly driven by business needs. Accordingly, due to that significant variability, we exclude these charges since we do not believe they truly reflect our past, current or future operating performance. The constant currency presentation excludes the impact of fluctuations in foreign currency exchange rates. We calculate constant currency revenue and Adjusted EBITDA on a constant currency basis by converting our current-period local currency financial results using the exchange rates from the corresponding prior-period and compare these adjusted amounts to our corresponding prior period reported results. XBP Europe does not consider these non-GAAP measures in isolation or as an alternative to liquidity or financial measures determined in accordance with GAAP. A limitation of these non-GAAP financial measures is that they exclude significant expenses and income that are required by GAAP to be recorded in XBP Europe’s financial statements. In addition, they are subject to inherent limitations as they reflect the exercise of judgments by management about which expenses and income are excluded or included in determining these non-GAAP financial measures and therefore the basis of presentation for these measures may not be comparable to similarly-titled measures used by other companies. These non-GAAP financial measures are not required to be uniformly applied, are not audited and should not be considered in isolation or as substitutes for results prepared in accordance with GAAP. Net loss is the GAAP measure most directly comparable to the non-GAAP measures presented here. For reconciliation of the comparable GAAP measures to these non-GAAP financial measures, see the slide titled Reconciliation of non-GAAP measures. Rounding: Due to rounding, numbers presented throughout this document may not add up precisely to the totals provided and percentages may not precisely reflect absolute figures. Supplemental Information: These slides are not intended to be a stand-alone presentation but should be read together with “Management’s Discussion and Analysis of Financial Condition and Results of Operations” and the consolidated financial statements and the related notes thereto included in our public filings.

GRAPHIC

©XBP EUROPE 2024 About XBP Europe 3 Listed on NASDAQ - see our website here. Where Secure hybrid cloud infrastructure enables XBP Europe to deploy its solutions to clients across the European market, along with the Middle East and Africa. Our physical footprint spans 15 countries in over 32 locations supported by our ~1,500 employees. What We provide bills and payments process management by partnering with our clients, enabling their data modernization and AI journeys with suites of solutions and services. Who XBP Europe Holdings, Inc. (Nasdaq: XBP, XBPEW), is a pan-European integrator of bills, payments, and related solutions and services seeking to enable the digital transformation of our clients. We serve many of the largest private and public sector clients in the UK and Europe, and our extensive network reaches majority of populations in key European markets. Why As a public company, we are able to participate in the large European economy, grow with our clients, and create value for our employees and stakeholders. Who, Where, Why & What

GRAPHIC

©XBP EUROPE 2024 XBP Europe product suites - Summary 4 Banking & Finance One of largest non-bank processors of payments in Europe ● Request to Pay [RtP/UK, R2P/EU] ● Confirmation of Payee [CoP] ● Know Your Customer [KYC] ● Mortgage & Loan Origination ● Payment Processing ● Foreign Exchange & Cross-Border Payments ● Check clearing infrastructure Enterprise Information Management Scan, process, digitize documents and get usable data ● Intelligent Document Processing ● Document Digitization ● Data Visualisation ● Big Data Analytics ● Infrastructure AI Finance & Accounting Enhanced invoicing, payments, reporting, analysis ● Exchange for Bills & Payments [XBP] ● Procure to Pay [P2P] ● Order to Cash [O2C] ● F&A Outsourcing ● ERP Data Consolidation Cloud & AI powered Cyber Security ● AI enabled cyber security ● Data modernization ● Cloud migration and management Integrated Communications Optimize communications over physical/digital channels ● XBP OmniDirect ● Print & Mail ● Contact Center Services Work From Anywhere Digital workplace and remote working technologies ● Digital Mailroom [DMR] ● Smart Lockers ● Digital Signature [Drysign] Small & Medium Businesses (SMB) Modular SaaS solutions that scale with a business ● XBP SMB ● DMR SMB ● Beats ● Peri Intelligent Process Automation Automate to digitally transform manual processes ● Workflow Automation ● Robotic Process Automation ● Data Science Projects

GRAPHIC

©XBP EUROPE 2024 We serve a diversified base of public and private sector customers 5 Large Enterprises and Small Businesses Finance Departments [F&A, EIM, IPA, IC, WFA, SaaS] We empower accounting and finance through a suite of solutions that offer automation, communication, and business insights to seamlessly manage transactions and help to improve liquidity. Financial Institutions, Banks & Insurance Companies [Digital Banking, Financial BPO Services] We help financial institutions to provide a better experience to billers, payers, and clients, thereby optimizing payment transactions and improving satisfaction, loyalty, and retention. Governments & Public Sector Organizations [EIM, BPO] We help governments and public sector organizations on their digital transformation journey, including workflow solutions, documents processing, and content management. Industry Specific and Industry Agnostic Enterprise Software and Services #Banking • 30 top global and European banks • Provider of state-of-the-art technology platform that processes 100% of UK cheque clearing • XBP Europe’s technology supports ~63 million online banking customers #Public Sector Serving 55+ central & local governmental entities across 7 countries #Financial Services 50+ Enterprise level clients across all regions

GRAPHIC

©XBP EUROPE 2024 1Q 2024 Financial Summary and Highlights 6

GRAPHIC

©XBP EUROPE 2024 1Q 2024 at a Glance 7 YoY +2.5% Sequentially +2.7% Revenue $40.4M YoY +$1.1M Sequentially +$3.3M YoY -5.7% Sequentially -2.0% Gross Margin 24.6% Adj EBITDA1 $1.8M YoY -5.6% 51% higher YoY Employees ~1,500 Operating Profit $0.1 M SG&A $7.9M New Business Win Rate YoY -23.4% Sequentially -56.9% Investments in Sales Opened two new sales offices: Frankfurt and Paris 1: Reference Adj EBITDA reconciliation on slide 13 YoY +5.6% Sequentially +2.8% Technology segment Gross Margin 55.6% YoY -1.1% Sequentially -5.8% Adj EBITDA Margin 4.5% Sequential -23.2%

GRAPHIC

©XBP EUROPE 2024 1Q 2024 Financial Highlights 8 • Revenue decline primarily due to large one-time license sale in 1Q 2023 • Gross Margin improved YoY driven by improved product mix shift towards high-margin Technology revenues 1: Reference Adj EBITDA reconciliation on slide 13 1Q 2024 1Q 2023 YoY Revenue, net 40,350 $ 42,801 $ -5.7% Operating Profit 71 (1,029) NM Net Loss Before Tax (1,748) (2,414) -27.6% Net Loss (2,208) (2,506) -11.9% Adj EBITDA1 2,391 1,831 -23.4% Capital Expenditures (385) (622) -38.1% EPS (0.07) $ (0.11) $ NM Gross Margin 24.6% 22.1% 2.5% Adj EBITDA Margin 4.5% 5.6% -1.1%

GRAPHIC

©XBP EUROPE 2024 Driving Higher Gross Margin Through Operating Leverage and Mix Shift 9 • Technology increased to 28.4% of total revenues, up 690 bps YoY, contributing significantly to overall improvement in gross margin • Bills & Payments gross margin declined modestly YoY; however, ramp of large-scale projects combined with increased operating leverage are expected to have a positive impact on gross margin 1Q 2024 1Q 2023 YoY Revenue 28,874 $ 33,568 $ -14.0% Cost of Revenue 25,317 28,725 -11.9% Gross Margin 12.3% 14.4% -2.1% % of Total Revenue 71.6% 78.4% -6.9% Revenue 11,476 $ 9,233 $ 24.3% Cost of Revenue 5,097 4,616 10.4% Gross Margin 55.6% 50.0% 5.6% % of Total Revenue 28.4% 21.6% 6.9% Revenue 40,350 $ 42,801 $ -5.7% Cost of Revenue 30,414 $ 33,341 $ -8.8% Gross Margin 24.6% 22.1% 2.5% Total XBP Europe Technology Bills & Payments

GRAPHIC

©XBP EUROPE 2024 Appendix 10

GRAPHIC

©XBP EUROPE 2024 Our presence in EMEA 11 XBP Europe Solutions reach majority of populations in key markets. The Company processed several hundred million payment transactions in 2023. United Kingdom (population 67 million) ~100% of all check payments archived or processed Sweden (population 10 million) ~7 million individuals and 500,000+ companies use bank giro processed by XBP Ireland (population 5 million) process~95% of all payments by check Norway (population 5 million) process 100% of bank giro Germany (population 83 million) technology is used to support 50+ million online banking customers Pan-European Presence 15 Countries1 32 Locations 1. Where team members are based 11

GRAPHIC

©XBP EUROPE 2024 Client and industry diversification 12 $167M FY2023 Revenue 40% Western Europe 31% Central Europe 18% UK & Ireland 11% Northern Europe Bills and Payments 73% 22% Top 2 -10 13% Top 11 - 20 22% Top 21 - 50 40% All Other 3% - Top client Diversified client base Services & Products Geography Technology 27% 12

GRAPHIC

©XBP EUROPE 2024 
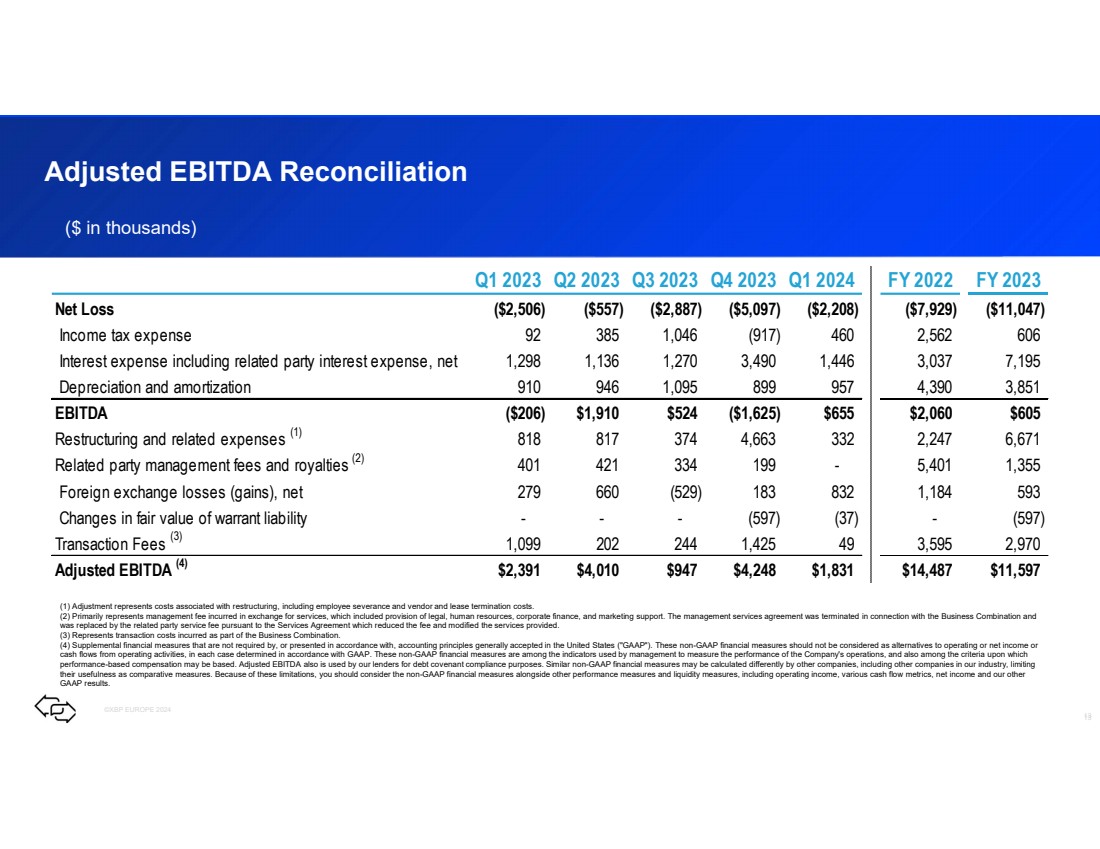
Adjusted EBITDA Reconciliation 13 ($ in thousands) (1) Adjustment represents costs associated with restructuring, including employee severance and vendor and lease termination costs. (2) Primarily represents management fee incurred in exchange for services, which included provision of legal, human resources, corporate finance, and marketing support. The management services agreement was terminated in connection with the Business Combination and was replaced by the related party service fee pursuant to the Services Agreement which reduced the fee and modified the services provided. (3) Represents transaction costs incurred as part of the Business Combination. (4) Supplemental financial measures that are not required by, or presented in accordance with, accounting principles generally accepted in the United States ("GAAP"). These non-GAAP financial measures should not be considered as alternatives to operating or net income or cash flows from operating activities, in each case determined in accordance with GAAP. These non-GAAP financial measures are among the indicators used by management to measure the performance of the Company's operations, and also among the criteria upon which performance-based compensation may be based. Adjusted EBITDA also is used by our lenders for debt covenant compliance purposes. Similar non-GAAP financial measures may be calculated differently by other companies, including other companies in our industry, limiting their usefulness as comparative measures. Because of these limitations, you should consider the non-GAAP financial measures alongside other performance measures and liquidity measures, including operating income, various cash flow metrics, net income and our other GAAP results. Q1 2023 Q2 2023 Q3 2023 Q4 2023 Q1 2024 FY 2022 FY 2023 Net Loss ($2,506) ($557) ($2,887) ($5,097) ($2,208) ($7,929) ($11,047) Income tax expense 92 385 1,046 (917) 460 2,562 606 Interest expense including related party interest expense, net 1,298 1,136 1,270 3,490 1,446 3,037 7,195 Depreciation and amortization 910 946 1,095 899 957 4,390 3,851 EBITDA ($206) $1,910 $524 ($1,625) $655 $2,060 $605 Restructuring and related expenses (1) 817 818 374 4,663 332 2,247 6,671 Related party management fees and royalties (2) 421 401 334 199 - 5,401 1,355 Foreign exchange losses (gains), net 279 660 (529) 183 832 1,184 593 Changes in fair value of warrant liability - - - (597) (37) - (597) Transaction Fees (3) 202 1,099 244 1,425 49 3,595 2,970 Adjusted EBITDA (4) $2,391 $4,010 $947 $4,248 $1,831 $14,487 $11,597

GRAPHIC

©XBP EUROPE 2024 Non-GAAP Reconciliation 14 (1) Constant currency excludes the impact of foreign currency fluctuations and is computed by applying the average exchange rates for the quarter ended March 31, 2023, to the revenues during the corresponding period in 2024. (2) Adjustment represents costs associated with restructuring, including employee severance and vendor and lease termination costs. (3) Represents transaction costs incurred as part of the Business Combination. (4) Supplemental financial measures that are not required by, or presented in accordance with, accounting principles generally accepted in the United States (“GAAP”). These non-GAAP financial measures should not be considered as alternatives to operating or net income or cash flows from operating activities, in each case determined in accordance with GAAP. These non-GAAP financial measures are among the indicators used by management to measure the performance of the Company’s operations, and also among the criteria upon which performance-based compensation may be based. Adjusted EBITDA also is used by our lenders for debt covenant compliance purposes. Similar non-GAAP financial measures may be calculated differently by other companies, including other companies in our industry, limiting their usefulness as comparative measures. Because of these limitations, you should consider the non-GAAP financial measures alongside other performance measures and liquidity measures, including operating income, various cash flow metrics, net income and our other GAAP results. Reconciliation of Non-GAAP Financial Measures to GAAP Measures Non-GAAP constant currency revenue reconciliation Quarter ended March 31, ($ in thousands) 2024 2023 Revenues, as reported (GAAP) 40,350 42,801 Foreign currency exchange impact (1) (673) Revenues, at constant currency (Non-GAAP) 39,677 42,801 Reconciliation of Adjusted EBITDA Quarter ended March 31, ($ in thousands) 2024 2023 Net loss (GAAP) (2,208) (2,506) Income tax expenses 460 92 Interest expense including related party interest expense, net 1,446 1,298 Depreciation and amortization 957 910 EBITDA (Non-GAAP) 655 (206) Restructuring and related expenses (2) 332 818 Related party management fee and royalties - 401 Foreign exchange losses, net 832 279 Changes in fair value of warrant liability (37) - Transaction Fees (3) 49 1,099 Adjusted EBITDA (Non-GAAP) (4) 1,831 2,391

GRAPHIC

©XBP EUROPE 2024 15 15 Defined Terms in Presentation and Notes • ACV: Annual contract value in dollars • Gross Margin: Total revenue less cost of revenue as a percentage of total revenue • Capital Expenditures: Funds used to buy, maintain, or improve physical or fixed assets used in the Company’s operations • New Business Win Rate: ACV closed in the period versus prior period

v3.24.1.1.u2
Document and Entity Information
May 13, 2024
Document Type 8-K
Document Period End Date May 13, 2024
Entity File Number 001-40206
Entity Registrant Name XBP Europe Holdings, Inc.
Entity Incorporation, State or Country Code DE
Entity Tax Identification Number 85-2002883
Entity Address, Address Line One 2701 East Grauwyler Road
Entity Address, City or Town Irving
Entity Address State Or Province TX
Entity Address, Postal Zip Code 75061
City Area Code 844
Local Phone Number 935-2832
Entity Emerging Growth Company true
Entity Ex Transition Period false
Entity Central Index Key 0001839530
Amendment Flag false
Written Communications false
Soliciting Material false
Pre-commencement Tender Offer false
Pre-commencement Issuer Tender Offer false
Common Stock, Par Value $0.0001 per share  
Title of 12(b) Security Common stock, par value $0.0001 per share
Trading Symbol XBP
Security Exchange Name NASDAQ
Redeemable warrants, each whole warrant exercisable for one share of common stock at an exercise price of $11.50  
Title of 12(b) Security Redeemable warrants, each whole warrant exercisable for one share of common stock at an exercise price of $11.50
Trading Symbol XBPEW
Security Exchange Name NASDAQ

XBP Europe (NASDAQ:XBPEW)
Gráfica de Acción Histórica
De Abr 2024 a May 2024 Haga Click aquí para más Gráficas XBP Europe.
XBP Europe (NASDAQ:XBPEW)
Gráfica de Acción Histórica
De May 2023 a May 2024 Haga Click aquí para más Gráficas XBP Europe.