TIDMTAN
RNS Number : 8437G
Tanfield Group PLC
24 July 2023
The information contained within this announcement is deemed by
the Company to constitute inside information under the Market Abuse
Regulation (EU) No. 596/2014. Upon the publication of this
announcement via a Regulatory Information Service ("RIS"), this
inside information is now considered to be in the public domain
Tanfield Group Plc
("Tanfield", or "the Company")
Interim Results for the six-month period to 30 June 2023
Tanfield, an investing company as defined by AIM Rules,
announces its half year results for the period ending 30 June 2023.
The unaudited financial information will shortly be available on
the Company website at www.tanfieldgroup.com .
Background
-- Tanfield is a 49% shareholder in the equity of Snorkel
International Holdings LLC ("Snorkel") following the joint venture
between the Company and Xtreme Manufacturing LLC ("Xtreme") (the
"Contemplated Transaction"), a company owned by Don Ahern of Ahern
Rentals Inc, relating to Snorkel, in October 2013 .
-- T he Snorkel investment is valued at GBP19.1m. The outcome of
the US Proceedings referenced below could have an impact on this
valuation.
-- On 22 October 2019, the Company announced that it had
received a Summons and Complaint, filed in Nevada (the "US
Proceedings") by subsidiaries of Xtreme, relating to the
Contemplated Transaction .
-- On 24 October 2019, the Company announced it had become
necessary to issue and serve a claim in the English High Court (the
"UK Proceedings") against its former solicitors acting for the
Company at the time of the Contemplated Transaction. On 18 October
2022, the Company announced that it had settled its claims in
relation to the UK Proceedings on a no-fault basis.
-- The Company's loss in H1 2023 reduced to GBP154k (H1 2022:
GBP499k) primarily as a consequence of a reduction in legal
expenditure following the settlement of the UK Proceedings, and the
elimination of finance expenses following the repayment of
borrowings, in late 2022.
Overview of investments
As announced on 18 May 2023, in the first quarter of 2023
Snorkel's sales increased by 4.4% to US$43.5m (Q1 2022: US$41.7m).
Whilst the increase in sales was a fairly modest US$1.8m in value,
the EBITDA for the first quarter of 2023 improved to a US$0.2m
profit (Q1 2022: US$3.5m loss), an improvement of some US$3.7m.
Further information relating to the recent performance of Snorkel
can be found in the 18 May 2023 announcement.
The Company is now focussed on the US Proceedings which are
continuing, with a jury trial currently scheduled to take place in
early 2024. However, the Board expect the trial date will be
rescheduled to around the summer of 2024. The Board continue to
believe that a positive outcome to those proceedings is possible.
So far as it is necessary, the Company will continue to vigorously
defend its position whilst continuing to seek advice.
Further updates will be provided to Shareholders as and when
appropriate.
For further information:
Tanfield Group Plc 020 7220 1666
Daryn Robinson
WH Ireland Limited - Nominated Advisor / Broker
   James Joyce / Andrew de Andrade                                          020 7220 1666

 STATEMENT OF COMPREHENSIVE INCOME
 FOR THE SIX MONTHSING 30 JUNE
  2023
                                                                                                     Year
                                                                                                       to
                                                           Six months            Six months        31 Dec
                                                                   to                    to            22
                                                               30 Jun                30 Jun
                                                       23 (unaudited)        22 (unaudited)     (audited)
                                                             GBP000's              GBP000's      GBP000's
---------------------------  ---------  -----  ----------------------  --------------------  ------------

 Revenue                                                            -                -                  -
 Staff costs                                                     (77)             (52)              (242)
 Other operating income                                            11               10              6,900
 Other operating expenses                                       (140)            (269)            (1,163)
------------------------------------------------------  -------------  ---------------  -----------------
 (Loss)/profit from operations                                  (206)            (311)              5,495
 Finance expense                                                    -            (188)              (565)
 Finance income                                                    52                -                 16
------------------------------------------------------  -------------  ---------------  -----------------
 (Loss)/profit before tax                                       (154)            (499)              4,946
 Taxation                                                           -                -                  -
---------------------------  ---------  --------------  -------------  ---------------  -----------------
 (Loss)/profit & total comprehensive income
  for the period attributable to equity
  shareholders                                                  (154)            (499)              4,946
------------------------------------------------------  -------------  ---------------  -----------------


 (Loss)/profit per share
 Basic and diluted (p)                                         (0.09)           (0.31)               3.04


 BALANCE SHEET
 AS AT 30 JUNE 2023
                                                                    30 Jun            30 Jun          31 Dec
                                                                        23                22              22
                                                               (unaudited)       (unaudited)       (audited)
                                                                  GBP000's          GBP000's        GBP000's
------------------------------------  --------  --------  ----------------  ----------------  --------------
 Non current assets
 Non current Investments                                            19,100            19,100          19,100
--------------------------------------------------------  ----------------  ----------------  --------------
                                                                    19,100            19,100          19,100
 --------  --------                                       ----------------  ----------------  --------------
 Current assets
 Trade and other receivables                                            53                67              30
 Cash and cash equivalents                                           3,652             1,368           3,824
--------------------------------------------------------  ----------------  ----------------  --------------
                                                                     3,705             1,435           3,854
 --------  --------                                       ----------------  ----------------  --------------

 Total assets                                                       22,805            20,535          22,954
--------------------------------------------------------  ----------------  ----------------  --------------

 Non-current liabilities
 Borrowings                                                              -             2,958               -
------------------------------------  --------  --------  ----------------  ----------------  --------------
                                                                         -             2,958               -
------------------------------------  --------  --------  ----------------  ----------------  --------------

 Current liabilities
 Trade and other payables                                               69               132              64
--------------------------------------------------------  ----------------  ----------------  --------------
                                                                        69               132              64
 --------  --------                                       ----------------  ----------------  --------------

 Total liabilities                                                      69             3,090              64
--------------------------------------------------------  ----------------  ----------------  --------------

 Equity
 Share capital                                                       8,145             8,145           8,145
 Share premium                                                      17,336            17,336          17,336
 Special reserve                                                    66,837            66,837          66,837
 Merger reserve                                                      1,534             1,534           1,534
 Retained earnings                                                (71,116)          (76,407)        (70,962)
--------------------------------------------------------  ----------------  ----------------  --------------
 Total equity                                                       22,736            17,445          22,890
--------------------------------------------------------  ----------------  ----------------  --------------

 Total equity and total liabilities                                 22,805            20,535          22,954
--------------------------------------------------------  ----------------  ----------------  --------------


 STATEMENT OF CHANGES IN EQUITY
                                  Share        Share      Share     Merger    Special   Retained      Total
                                capital      premium     option    reserve    reserve   earnings
                                                        reserve
                               GBP000's     GBP000's   GBP000's   GBP000's   GBP000's   GBP000's   GBP000's
   -----------------------  -----------  -----------  ---------  ---------  ---------  ---------  ---------
    Six months to 30 June 2023
     (unaudited)

    At 1 January 2023             8,145       17,336          -      1,534     66,837   (70,962)     22,890
   -----------------------  -----------  -----------  ---------  ---------  ---------  ---------  ---------
    Comprehensive income
    Loss for the period               -            -          -          -          -      (154)      (154)
   -----------------------  -----------  -----------  ---------  ---------  ---------  ---------  ---------
    Total comprehensive
     income
     for the period                   -            -          -          -          -      (154)      (154)
    At 30 June 2023               8,145       17,336          -      1,534     66,837   (71,116)     22,736
   -----------------------  -----------  -----------  ---------  ---------  ---------  ---------  ---------

    Six months to 30 June 2022
     (unaudited)

    At 1 January 2022             8,145       17,336          -      1,534     66,837   (75,908)     17,944
   -----------------------  -----------  -----------  ---------  ---------  ---------  ---------  ---------
    Comprehensive income
    Loss for the period               -            -          -          -          -      (499)      (499)
   -----------------------  -----------  -----------  ---------  ---------  ---------  ---------  ---------
    Total comprehensive
     income
     for the period                   -            -          -          -          -      (499)      (499)
   -----------------------  -----------  -----------  ---------  ---------  ---------  ---------  ---------
    At 30 June 2022               8,145       17,336          -      1,534     66,837   (76,407)     17,445
   -----------------------  -----------  -----------  ---------  ---------  ---------  ---------  ---------

    Year to December 2022 (audited)

    At 1 January 2022             8,145       17,336          -      1,534     66,837   (75,908)     17,944
   -----------------------  -----------  -----------  ---------  ---------  ---------  ---------  ---------
    Comprehensive income
    Profit for the year               -            -          -          -          -      4,946      4,946
   -----------------------  -----------  -----------  ---------  ---------  ---------  ---------  ---------
    Total comprehensive
     income
     for the year                     -            -          -          -          -      4,946      4,946
    At 31 December 2022           8,145       17,336          -      1,534     66,837   (70,962)     22,890
   -----------------------  -----------  -----------  ---------  ---------  ---------  ---------  ---------


 CASH FLOW STATEMENT
 FOR THE SIX MONTHSING 30 JUNE 2023
                                                                                              Year
                                                                                                to
                                                                                            31 Dec
                                                                                                22
                                                           Six months     Six months
                                                                to 30          to 30
                                                               Jun 23         Jun 22
                                                          (unaudited)    (unaudited)     (audited)
                                                             GBP000's       GBP000's      GBP000's
-------------------------------------------  ---------  -------------  -------------  ------------

 (Loss)/profit before tax                                       (154)          (499)         4,946
 Adjustment for:
 Finance expense                                                    -            188           565
 Finance income                                                  (52)              -          (16)
------------------------------------------------------  -------------  -------------  ------------
 Changes in operating assets and
  liabilities / working capital:
 (Increase)/decrease in receivables                              (23)           (44)           (7)
 Increase/(decrease) in payables                                    5             60           (8)
------------------------------------------------------  -------------  -------------  ------------
 Cash (used in)/generated by operations                         (224)          (295)         5,480
------------------------------------------------------  -------------  -------------  ------------
 Interest paid                                                      -              -         (810)
------------------------------------------------------  -------------  -------------  ------------
 Net cash (used in)/generated by
  operating activities                                          (224)          (295)         4,670
------------------------------------------------------  -------------  -------------  ------------

 Cash flow from Investing Activities
  Interest received                                                52              -            16
------------------------------------------------------  -------------  -------------  ------------
 Net used in investing activities                                  52              -            16
------------------------------------------------------  -------------  -------------  ------------

 Cash flow from financing activities
  Proceeds from borrowings                                          -          1,075         1,375
  Repayment of borrowings                                           -              -       (2,825)
------------------------------------------------------  -------------  -------------  ------------
 Net cash (used in)/generated by
  financing activities                                              -          1,075       (1,450)
------------------------------------------------------  -------------  -------------  ------------

 Net increase in cash and cash equivalents                      (172)            780         3,236
 Cash and cash equivalents at the
  start of period                                               3,824            588           588
------------------------------------------------------  -------------  -------------  ------------
 Cash and cash equivalents at the
  end of the period                                             3,652          1,368         3,824
------------------------------------------------------  -------------  -------------  ------------


 1 Basis of preparation
  The Interim Report of the Company for the six months ended 30 June
  2023 has been prepared in accordance with AIM Rule 18 and not in
  accordance with IAS34 "Interim Financial Reporting" therefore is
  not fully in compliance with IFRS.

  The half year report does not constitute financial statements as
  defined in Section 434 of the Companies Act 2006 and does not include
  all of the information and disclosures required for full annual
  statements. It should be read in conjunction with the annual report
  and financial statements for the year ended 31 December 2022 which
  is available on request from the Company's registered office, c/o
  Weightmans LLP, 1 St James' Gate, Newcastle upon Tyne, NE99 1YQ
  or can be downloaded from the corporate website www.tanfieldgroup.com.

  2 Accounting Policies
  Impact of accounting standards to be applied in future periods
  There are a number of standards and interpretations which have
  been issued by the International Accounting Standards Board that
  are effective for periods beginning subsequent to 31 December 2023
  that the Group has decided not to adopt early. The Group does not
  believe these standards and interpretations will have a material
  impact on the financial statements once adopted.
  3 Loss per share
 The calculation of the basic and diluted loss per share is based
  on the following data:
                                                                                          Year
                                                            Six months   Six months         to
                                                                              to 30     31 Dec
                                                          to 30 Jun 23       Jun 22         22

 Number of shares                                                000's        000's      000's
------------------------------------------  ---  ---------------------  -----------  ---------
 Weighted average number of ordinary shares
  for the purposes of basic earnings per
  share                                                        162,907      162,907    162,907
-----------------------------------------------------------   --------  -----------  ---------


 Loss From operations                                         GBP000's     GBP000's   GBP000's
------------------------------------------  ---  ---------------------  -----------  ---------
 Loss for the purposes of basic earnings
  per share being net profit attributable
  to owners of the parent                                        (154)        (499)         4,946
------------------------------------------------------  ---  ---------  -----------  ------------

 Loss per share from operations
 Basic and diluted (p)                                          (0.09)       (0.31)     (3.04)
This information is provided by RNS, the news service of the
London Stock Exchange. RNS is approved by the Financial Conduct
Authority to act as a Primary Information Provider in the United
Kingdom. Terms and conditions relating to the use and distribution
of this information may apply. For further information, please
contact rns@lseg.com or visit www.rns.com.
RNS may use your IP address to confirm compliance with the terms
and conditions, to analyse how you engage with the information
contained in this communication, and to share such analysis on an
anonymised basis with others as part of our commercial services.
For further information about how RNS and the London Stock Exchange
use the personal data you provide us, please see our Privacy
Policy.
END
IR PPUWWMUPWGPG
(END) Dow Jones Newswires
July 24, 2023 02:00 ET (06:00 GMT)
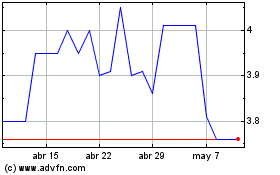
Tanfield (LSE:TAN)
Gráfica de Acción Histórica
De Mar 2024 a Abr 2024

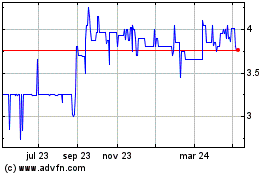
Tanfield (LSE:TAN)
Gráfica de Acción Histórica
De Abr 2023 a Abr 2024
