0001406666FALSE00014066662022-07-152022-07-15
UNITED STATES
SECURITIES AND EXCHANGE COMMISSION
WASHINGTON, D.C. 20549
FORM 8-K
CURRENT REPORT
Pursuant to Section 13 or 15(d) of the
Securities Exchange Act of 1934
Date of Report (Date of earliest event reported): July 22, 2024
CALIX, INC.
(Exact name of Registrant as specified in its charter)
| | | | | | | | | | | | | | |
| | | | |
| Delaware | | 001-34674 | | 68-0438710 |
(State or other jurisdiction
of incorporation) | | (Commission
File No.) | | (I.R.S. Employer
Identification No.) |
| | |
2777 Orchard Parkway, San Jose, California | | 95134 |
| (Address of principal executive offices) | | (Zip Code) |
| | |
(408) 514-3000 |
| (Registrant’s telephone number, including area code) |
| | |
| Not Applicable |
| (Former name or former address if changed since last report) |
Check the appropriate box below if the Form 8-K filing is intended to simultaneously satisfy the filing obligation of the registrant under any of the following provisions:
| | | | | |
| ☐ | Written communications pursuant to Rule 425 under the Securities Act (17 CFR 230.425) |
| | | | | |
| ☐ | Soliciting material pursuant to Rule 14a-12 under the Exchange Act (17 CFR 240.14a-12) |
| | | | | |
| ☐ | Pre-commencement communications pursuant to Rule 14d-2(b) under the Exchange Act (17 CFR 240.14d-2(b)) |
| | | | | |
| ☐ | Pre-commencement communications pursuant to Rule 13e-4(c) under the Exchange Act (17 CFR 240.13e-4(c)) |
Securities registered pursuant to Section 12(b) of the Act:
| | | | | | | | | | | | | | |
Title of Each Class | | Trading Symbol | | Name of Each Exchange on Which Registered |
Common Stock, par value $0.025 per share | | CALX | | New York Stock Exchange |
Indicate by check mark whether the registrant is an emerging growth company as defined in Rule 405 of the Securities Act of 1933 (§ 230.405 of this chapter) or Rule 12b-2 of the Securities Exchange Act of 1934 (§ 240.12b-2 of this chapter).
If an emerging growth company, indicate by check mark if the registrant has elected not to use the extended transition period for complying with any new or revised financial accounting standards provided pursuant to Section 13(a) of the Exchange Act). o
Item 2.02 Results of Operations and Financial Condition.
On July 22, 2024, Calix, Inc. (the “Company”) issued a press release announcing it has publicly disseminated a stockholder letter with its financial results for the second quarter ended June 29, 2024. The press release is attached hereto as Exhibit 99.1. The stockholder letter, a copy of which is attached hereto as Exhibit 99.2 and incorporated herein by reference, includes reference to the non-GAAP measures of non-GAAP gross margin, non-GAAP operating expenses, non-GAAP sales and marketing investments, non-GAAP research and development investments, non-GAAP general and administrative investments, non-GAAP effective income tax rate, non-GAAP net income, non-GAAP net income per diluted common share and non-GAAP free cash flow. These non-GAAP measures are provided to enhance the reader’s understanding of the Company’s operating performance as they primarily exclude non-cash stock-based compensation, intangible asset amortization, litigation settlement and the impact from changes in income taxes, which the Company believes are not indicative of its core operating results. Management believes that the non-GAAP measures used in this stockholder letter provide investors with important perspectives into the Company’s ongoing business performance and management uses these non-GAAP measures to evaluate financial results and to establish operational goals. The presentation of these non-GAAP measures is not meant to be a substitute for results presented in accordance with U.S. GAAP, but rather should be evaluated in conjunction with those GAAP results. A reconciliation of the non-GAAP results to the most directly comparable U.S. GAAP results is contained in tabular form in Exhibit 99.2. The non-GAAP financial measures used by the Company may be calculated differently from, and therefore may not be comparable to, similarly titled measures used by other companies.
Such information shall not be deemed “filed” for purposes of Section 18 of the Securities Exchange Act of 1934, as amended (the “Exchange Act”), and is not incorporated by reference into any filing of the Company, whether made before or after the date hereof, regardless of any general incorporation language in such filing.
Item 9.01 Financial Statements and Exhibits.
(d) Exhibits
| | | | | | | | |
| Exhibit No. | | Description |
| 99.1 | | |
| 99.2 | | |
SIGNATURES
Pursuant to the requirements of the Securities Exchange Act of 1934, the Registrant has duly caused this report to be signed on its behalf by the undersigned hereunto duly authorized.
| | | | | | | | | | | | | | | | | | | | | | | | | | |
| Date: | July 22, 2024 | | | | | CALIX, INC. |
| | | | |
| | | | | | By: | | /s/ Cory Sindelar |
| | | | | | | | Cory Sindelar |
| | | | | | | | Chief Financial Officer |
EXHIBIT INDEX
| | | | | | | | |
| Exhibit No. | | Description |
| 99.1 | | |
| 99.2 | | |
Exhibit 99.1
Calix Releases Second Quarter 2024 Financial Results
SAN JOSE, CA – July 22, 2024 – Calix, Inc. (NYSE: CALX) today announced unaudited financial results for its second quarter of 2024, which have been posted as a letter to stockholders to the investor relations section of its website. Please visit the Calix investor relations website at https://investor-relations.calix.com to view the letter to stockholders, along with accompanying supplemental financial information.
A conference call to discuss these results with President & CEO Michael Weening and CFO Cory Sindelar will be held tomorrow, July 23, 2024, at 5:30 a.m. Pacific Time / 8:30 a.m. Eastern Time.
Interested parties may listen to a live webcast of the conference call by visiting the Events section of the Calix Investor Relations website. The live conference call will be available by dialing (877) 407-4019, or international (201) 689-8337, with conference ID# 13747128. Participants may also click this link for instant telephone access to the event. The link will become active approximately 15 minutes prior to the start of the conference call. The conference call and webcast will include forward-looking information.
A webcast replay of the conference call will be available following its completion and will be archived on the Calix Investor Relations website.
About Calix
Calix, Inc. (NYSE: CALX) – Calix is an appliance-based platform, cloud and managed services company. Broadband service providers leverage the Calix broadband platform, cloud and managed services model to simplify operations, subscriber engagement and services; innovate for their consumer, business and municipal subscribers; and grow their value for members, investors and the communities they serve.
Our end-to-end platform, cloud and managed services democratize the use of data—enabling our customers of any size to operate efficiently, acquire subscribers and deliver exceptional experiences. Calix is dedicated to driving continuous improvement in partnership with our growing ecosystem to support the transformation of our BSP customers and their communities.
Category: Financial
Investor Inquiries:
Jim Fanucchi
VP, Investor Relations
InvestorRelations@calix.com
(408) 404-5400
Exhibit 99.2
July 22, 2024
Fellow Calix stockholders:
The second quarter of fiscal 2024 reflected the continued strength of our appliance-based platform, cloud and managed services model. We believe revenue of $198.1 million in the second quarter of 2024 represents the low point for revenue in 2024. We delivered record gross margin as our broadband service provider (BSP) customers continued to gain subscribers due to the outstanding services and value they are providing their subscribers. Our operational excellence remained evident in our strong balance sheet metrics and our fifth consecutive quarter of double-digit free cash flow.
Our platform, cloud and managed services business saw robust growth and is expanding at an increasing rate. Remaining performance obligations (RPOs) increased 25% year-over-year and an even more outstanding 9% quarter-over quarter. This performance was driven by our BSP customers’ success with their subscribers as they simplify their operations, subscriber engagement and services, innovate for their consumer, business and municipal subscribers and grow their value for members, investors and the communities they serve.
Moreover, as the market is beginning to “Cross the Chasm,” our new customer performance is accelerating. We added 24 new BSP customers in the quarter, up from 10 in the prior quarter. Our new BSP customers are partnering with Calix to differentiate themselves in an increasingly competitive market by transforming their business models with our unique platform, cloud and managed services offering. Unlike in previous quarters when many of our new customers were newly formed entities, nearly all of our new customers came from existing service providers that were served by legacy box manufacturers…a trend we expect will continue. As our appliance footprint grows, it opens new expansion opportunities for our platform, cloud and managed services.
As we have highlighted in recent letters, the network and Wi-Fi appliance portion of our business has been challenged in 2024 by decision making delays on BEAD and government funding, customer purchase adjustments related to our shortened lead-times, and persistently high interest rates, which have BSP customers balancing new subscriber acquisition on existing networks versus incremental builds. As our customers’ clarity with regards to their business needs improves and demand continues to grow, we believe that the third quarter of 2024 will mark our return to sequential quarterly revenue growth.
At Calix, “better, better, never best” is ingrained in our company culture. Calix gains consistent acclaim inside and outside the industry as customers differentiate to win consumer, community and business markets with the Calix broadband platform including:
•Glassdoor - Best Led Companies. Calix was ranked 31 for large companies.
•Calix has been recognized by Comparably for Best Career Growth and Best Leadership Teams.
•Calix received 6 total Stevie Awards recognizing the capabilities of the Calix broadband platform, including:
◦Gold Stevie “Marketing Campaign of the Year” with customer Highline for Engagement Cloud
◦Silver Stevie ‘Marketing Disruptor of the Year” with customer Highline for Engagement Cloud
◦Silver Stevie “Best Use of Data to Drive Brand Strategy” with customer PTCI for Engagement Cloud
As always, our leadership team remains focused on improving our financial performance over the long-term across four measurable objectives:
•Deliberate revenue growth
•Gross margin expansion
•Disciplined operating expense investment
•Ongoing predictability
We remain committed to enabling our BSP customers to transform their businesses and succeed in their markets. As the only end-to-end platform company enabling BSPs to capitalize on the multi-decade disruption of the legacy broadband industry by transforming into a comprehensive business model that enables differentiation in an increasingly competitive market, we are expanding our footprint in 2024 as we assist service providers to “Cross the Chasm.” We will continue to align our strategy and investments to support our customers, which in turn we believe will deliver improved long-term financial performance over many years.
Second Quarter 2024 Financial Results
| | | | | | | | | | | |
| GAAP | Non-GAAP | Guidance Non-GAAP 1 |
| Revenue | $198.1m | $198.1m | $197.0m – $203.0m |
| Gross margin | 54.3% | 55.1% 2 | 54.25% – 56.25% 1 |
| Operating expenses | $119.0m | $104.2m 2 | $106.0m – $109.0m 1 |
| Net income (loss) per diluted common share | ($0.12) | $0.09 2 | $0.03 – $0.09 1 |
| | | | | | | |
1 | Non-GAAP guidance provided on April 22, 2024. | | |
2 | Non-GAAP excludes stock-based compensation and intangible asset amortization as well as the income tax impact of these items. See GAAP to non-GAAP reconciliations beginning on page 14. | | |
| | | |
| | | |
| | | |
| | | |
| | | |
| | | |
| | | |
| | | |
For the second quarter of 2024, revenue was $198.1 million, representing a decrease of 12% from the prior quarter and 24% compared with the same quarter a year ago.
Revenue EDGE revenue decreased by 7% from the prior quarter as BSP customers continued to adjust their purchases to our shortened supply lead times and was down 12% compared with the year ago quarter as a couple of significant customers reevaluated their capital priorities and as customers more broadly adjusted their purchases to our shortened supply lead times.
Intelligent Access EDGE revenue was down 28% from the prior quarter and 32% compared with the year ago quarter as a few significant customers slowed their network builds as they reevaluate capital priorities and continuing indecision by customers in general on new network builds as they consider or pursue government stimulus. The market continues to be driven by the technology upgrade cycle to consolidated networks and 10 Gigabit PON.
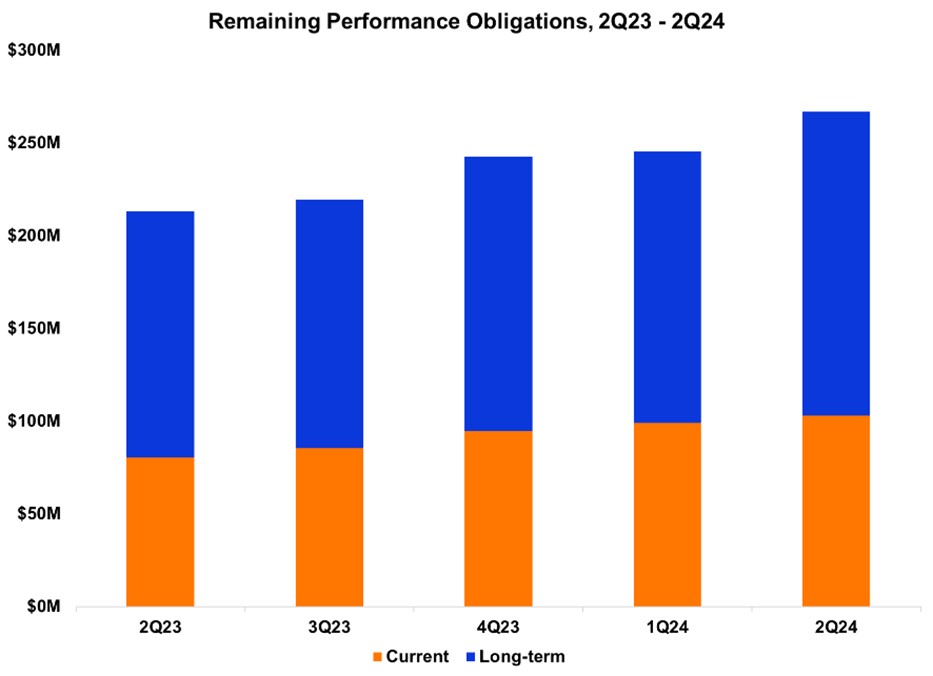
RPOs result from long-term commitments made by our customers and consist mainly of Calix Cloud, managed services, extended warranties and support/maintenance agreements and exclude platform licenses, month-to-month usage-based models and true-ups. These commitments generally have an initial term of three years. As of the end of the second quarter of 2024, our RPOs were $266.9 million, which is an increase of $21.7 million, or 9%, from the prior quarter and an increase of $53.9 million, or 25%, from the same quarter a year ago. Meanwhile, current RPO was $103.0 million, up 4% from $99.1 million at the end of the prior quarter and up 28% from $80.4 million at the quarter end a year ago. The increases reflect the continued adoption of our platform offerings by our BSP customers. We expect quarterly RPOs will continue to grow.
Expanded customer adoption of our platform, cloud and managed services was again evidenced by the
strong increase in all three metrics compared with the prior quarter. As we have noted previously, our platform, cloud and managed services monetize based on subscriber count, and the growth in subscribers and on-going adoption of our platform, cloud and managed services form the “expand” in our “land and expand” strategy. Over time, we expect the recurring revenue from continued platform, cloud and managed services adoption will drive higher gross margin.
We added 17 new Revenue EDGE and/or Intelligent Access EDGE customer deployments in the second quarter of 2024. By deploying the Revenue EDGE, BSPs can quickly implement and sell managed services, thereby enabling them to improve their average revenue per user at high margins with the greatest levels of subscriber satisfaction.
We added 19 new Calix Cloud deployments, which include Engagement Cloud, Service Cloud and/or Operations Cloud in the second quarter of 2024. Calix Cloud allows our BSPs to benefit from the power of data-driven insights to drive best-in-class Net Promoter ScoresSM.
Our managed services showed continued growth as 22 additional customers began deploying a managed service. We currently offer the following SmartLife managed services: SmartHome (which includes Wi-FiIQ, CommandIQ, ProtectIQ and ExperienceIQ), Arlo Secure, Bark, SmartBiz and SmartTown.
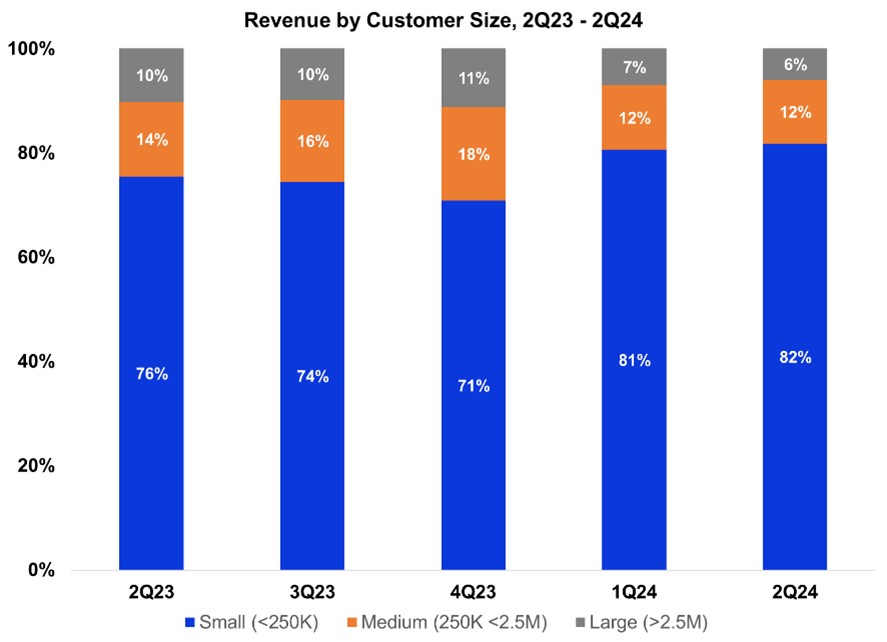
As we have discussed previously, technology disruptions start with small customers and eventually work their way up to large customers. While we expect this trend will continue in the future, there remain a few customers in the large and medium category that have reduced their level of appliance purchases in the near term as they reevaluate their priorities and requirements. The decline in the large and medium category in the second quarter of 2024 was less than we had anticipated, which points to the start of stabilization for these customers. We also had one small customer grow its subscriber base such that it is now a medium-sized customer. Overall, large and medium customer revenue declined 17% in absolute dollars. Revenue from small customers accounted for 82% of revenue for the second quarter of 2024, up from 81% for the prior quarter, and decreased 11% in absolute dollars.
U.S. revenue was 92% of total revenue for the second quarter of 2024, down from 93% in the first quarter of 2023, and up from 89% of revenue for the year ago quarter. U.S. revenue declined 13% in absolute dollars sequentially and declined 21% compared with the year ago quarter. International revenue was 8% of revenue in the second quarter of 2024, down $0.8 million, or 5%, from the prior quarter due mostly to lower shipments to the Middle East and Africa. International revenue was down 46% compared with the year ago period primarily due to lower shipments to Europe and to a lesser extent the Americas outside the United States.
Our GAAP gross margin for the second quarter of 2024 was a record 54.3%, an increase of 10 basis points sequentially and 200 basis points year-over-year. Included in GAAP gross margin was stock-based compensation and intangible asset amortization. Excluding these items, our non-GAAP gross margin for the second quarter of 2024 was a record 55.1%, representing an increase of 20 basis points sequentially and 230 basis points from the year ago period. The continued improvement is primarily due to platform, cloud and managed services revenue as it continues to grow as well as being a greater mix of total revenue as our appliance revenue was down in the second quarter of 2024. We expect that gross margin will continue to increase each quarter; however, the amount of increase may vary from quarter to quarter.
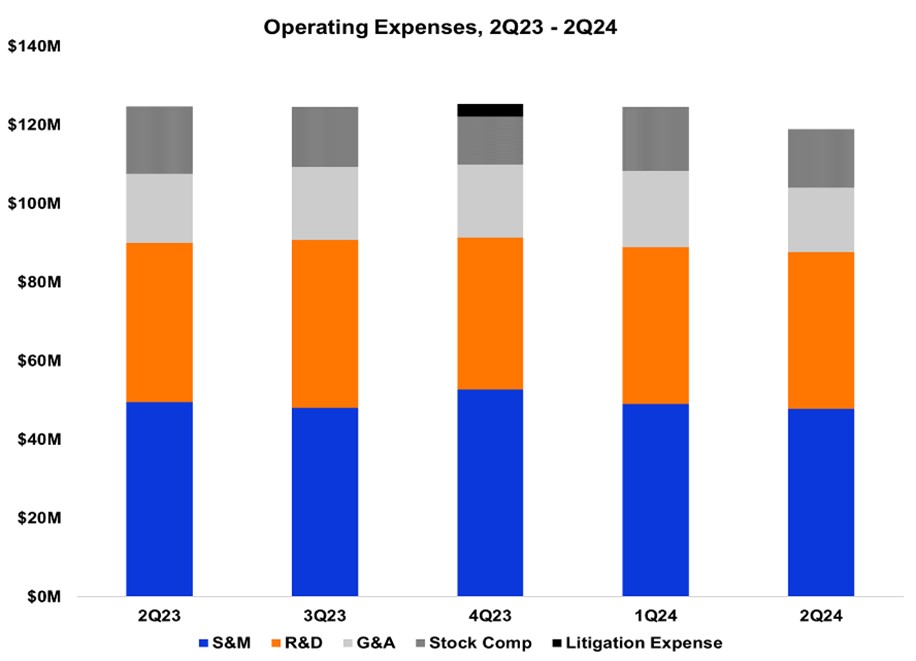
Our GAAP and non-GAAP operating expenses for the second quarter of 2024 were $119.0 million and $104.2 million, representing 60.0% and 52.6% of revenue, respectively. Sequentially, GAAP operating expenses decreased by $5.6 million. Excluding the stock-based compensation, non-GAAP operating expenses decreased by $4.2 million from the prior quarter primarily from lower professional fees, personnel expenses and outside services. Compared with the year ago quarter, GAAP and non-GAAP operating expenses decreased by $5.7 million and $3.4 million, respectively. The decline in non-GAAP operating expenses is primarily due to outside services and professional fees. Non-GAAP sales and marketing investments were 24.2% of revenue, which is above our Target Financial Model range of 18% to 20%. Non-GAAP research and development investments were 36.4% of gross profit, which is above our Target Financial Model of 29%. Non-GAAP general and administrative investments were 8.3% of revenue, which is above our Target Financial Model of 7%. We continue to plan our 2024 operating expense investments to be consistent with the level of investment in 2023 as we believe 2024 represents
an opportunity to grow our footprint ahead of the anticipated U.S. government broadband investment in 2025.
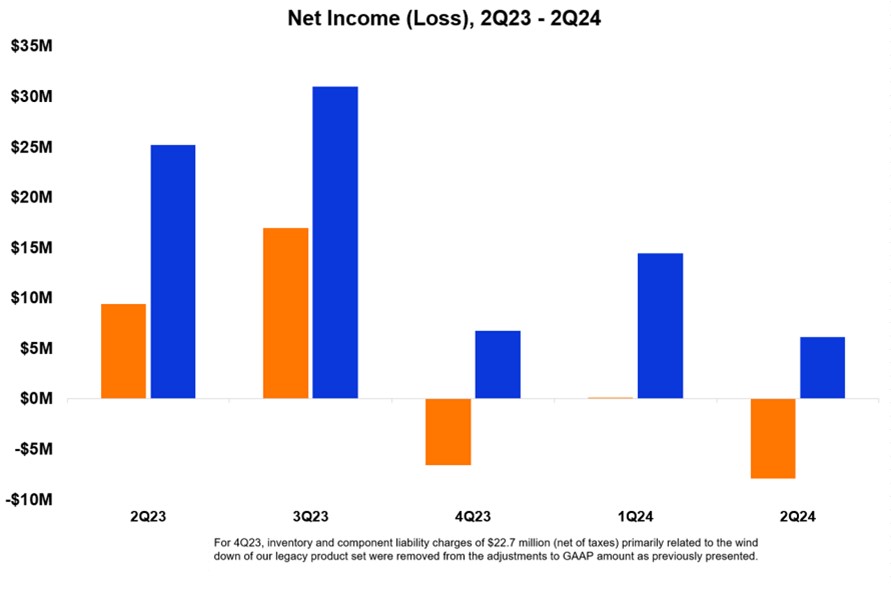
GAAP net loss of $8.0 million for the second quarter of 2024 decreased approximately $8.1 million sequentially and decreased approximately $17.3 million compared with the same quarter a year ago. These declines were primarily related to the lower revenue compared with each of these periods. GAAP net loss for the second quarter of 2024 included stock-based compensation of $15.5 million and intangible asset amortization of $1.0 million, partially offset by the income tax effect for these items of $2.3 million. Our non-GAAP net income for the second quarter of 2024 was $6.1 million, a decrease of $8.3 million when compared with $14.4 million in the prior quarter. The change was mainly due to the lower revenue and was partially offset by higher gross margin and lower operating expenses and income taxes. Non-GAAP net income decreased approximately $19.1 million when compared with $25.2 million from the same quarter last year primarily due to lower revenue and partially offset by higher gross margin and lower income taxes.
Balance Sheet and Cash Flow
Our balance sheet remains strong. Our Days Sales Outstanding (DSO) at the end of the second quarter 2024 was 38 days, down 2 days from the prior quarter and up 4 days from the same quarter a year ago. Our Target Financial Model for DSO remains between 35 and 45 days. Inventory turns were 2.8, down from 3.1 in the prior quarter and down from 3.0 in the second quarter a year ago. The decrease in inventory turns relate to an increase in component inventory and lower shipments. Inventory turns based on finished goods inventory only was 3.7. Inventory turns for the second quarter of 2024 were below our Target Financial Model of 3 to 4 turns. We expect to be below our Target Financial Model for a few
quarters while we consume these components. In the second quarter of 2024, our inventory deposits decreased by $5.8 million, bringing our total inventory deposits to $70.3 million. Days payable outstanding (DPO) at the end of the second quarter was 10 days, down 12 days from the prior quarter and down 15 days from the year ago quarter. Our Target Financial Model for DPO is between 25 and 35 days. Our cash conversion cycle was 158 days compared with 134 days in the prior quarter and 131 days in the same quarter last year. Our Target Financial Model for our cash conversion cycle remains to be between 100 and 130 days.
We ended the second quarter of 2024 with cash and investments of $261.2 million, which was a sequential increase of $21.7 million. The increase was primarily due to positive non-GAAP free cash flow of $16.4 million and proceeds from equity-based employee benefit plans of $4.0 million. Compared with the second quarter a year ago, our cash and investments decreased by $2.9 million primarily due to our common stock repurchases of $80.1 million over the last four quarters partially offset by positive non-GAAP free cash flow of $50.3 million and proceeds from equity-based employee benefit plans of $28.7 million. At the end of the second quarter of 2024, we had $109.9 million available under our stock repurchase program. We continue to expect both GAAP operating and non-GAAP free cash flow to remain strong due to continued non-GAAP profitability and cash conversion cycle improvements.
Third Quarter 2024 Guidance
| | | | | | | | |
| Guidance Non-GAAP | Guidance Reconciled to GAAP |
| Revenue | $198.0m – $204.0m | $198.0m – $204.0m |
| Gross margin | 54.25% – 56.25% 1 | 53.55% – 55.55% |
| Operating expenses | $105.0m – $108.0m 1 | $121.0m – $124.0m |
Net income (loss) per diluted common share 2 | $0.05 – $0.11 1 | $(0.18) – $(0.12) |
| | | | | | | |
1 | Non-GAAP excludes stock-based compensation and intangible asset amortization as well as the income tax impact of these items. See GAAP to non-GAAP reconciliation on page 16. | | |
2 | Based on 68.6 million weighted-average diluted common shares outstanding. | | |
| | | |
| | | |
| | | |
| | | |
| | | |
| | | |
| | | |
| | | |
Our guidance for the third quarter of 2024, ending September 28, 2024, reflects our expectations as of the date of this letter.
Our revenue guidance for the third quarter of 2024 is for revenue to be between $198 million and $204 million, representing an increase of $3 million (at the midpoint) from the prior quarter. We expect our platform, cloud and managed services will continue to grow; and while we continue to increase our sales activity and footprint expansion, we are taking a cautious view on appliance shipments.
Due to the continued expansion of our platform, cloud and managed services, our non-GAAP gross margin guidance for the third quarter of 2024 of 55.25% (at the midpoint) would be up 15 basis points from the prior quarter.
Our non-GAAP operating expense guidance for the third quarter of 2024 remains higher than our Target Financial Model as a percentage of revenue due to the current revenue outlook. Throughout 2024, we plan to keep our operating expenses relatively constant with the prior year as we execute on the opportunity to land new footprint prior to the anticipated arrival of the U.S. government stimulus starting in 2025.
We expect our 2024 non-GAAP effective tax rate 2024 to be in a range of 20% to 22%.
Summary
We remain in the early stages in this once-in-a-generation disruption of the broadband industry. Our BSP customers are thriving in this disruptive market as the Calix model enables a simple path to a comprehensive business model that differentiates to win consumer, business and municipal subscribers at an ever-increasing pace. We expect further footprint gains as we continue to convert legacy network operators who are struggling with commoditization, margin declines and slowing growth while Calix partnered BSPs innovate at a faster and faster pace.
Our BSP customers’ success remains the foundation for our long-term growth and will continue to expand across three vectors:
•New subscribers: BSP customers leverage our platform, cloud and managed services to differentiate themselves in their markets thereby adding subscribers.
•Existing subscribers: BSP customers adopt additional platform extensions, cloud and managed services to reduce their operational costs and grow revenue per subscriber.
•New BSPs: We continue to convert legacy operators into new strategically aligned service providers who recognize that our unique platform, cloud and managed services model enables their teams to transform their business as they simplify their operations, subscriber engagement and services, innovate for their consumer, business and municipal subscribers and grow their value for members, investors and the communities they serve.
We remain confident in the multi-year outlook for our business. Each quarter we grow our footprint by adding to our BSP customer base and expand the reach of our platform, cloud and managed services across our 1,065 BSPs and their subscribers. With the expected market upturn closer and broadband stimulus funds poised to make their way to our BSP customers starting in 2025, we are in an enviable position to maximize on these positive trends and return to predictable growth that should last for many years.
We sincerely thank our employees, customers, partners, vendors and stockholders for their continued support.
Sincerely,
| | | | | | | | |
Michael Weening President and CEO | | Cory Sindelar CFO |
Conference Call
In conjunction with this announcement, Calix will host a conference call tomorrow, July 23, 2024, at 5:30 a.m. Pacific Time / 8:30 a.m. Eastern Time to answer questions regarding our second quarter 2024 financial results. A live audio webcast and replay of the call will be available in the Investor Relations section of the Calix website at http://investor-relations.calix.com.
Live call access information: Dial-in number: (877) 407-4019 (U.S.) or (201) 689-8337 (outside the U.S.) ID# 13747128.
The conference call and webcast will include forward-looking information.
Investor Inquiries
Jim Fanucchi
VP, Investor Relations
InvestorRelations@calix.com
(408) 404-5400
About Calix
Calix, Inc. (NYSE: CALX) — Calix is an appliance-based platform, cloud and managed services company. Broadband service providers leverage the Calix broadband platform, cloud and managed services to simplify operations, engagement and service; innovate for their consumer, business and municipal subscribers; and grow their business and the communities they serve.
Our end-to-end platform, cloud and managed services democratize the use of data—enabling our customers of any size to operate efficiently, acquire subscribers and deliver exceptional experiences. Calix is dedicated to driving continuous improvement in partnership with our growing ecosystem to support the transformation of our BSP customers and their communities.
Forward-Looking Statements
Statements made in this stockholder letter and the earnings call referencing the stockholder letter that are not statements of historical fact are forward-looking statements. Forward-looking statements are subject to the “safe harbor” provisions of the Private Securities Litigation Reform Act of 1995. Forward-looking statements relate to, but are not limited to, component and logistics costs, potential customer or market opportunities, growth and future opportunities, customer demand or the sustainability of continued demand, anticipated customer purchase trends, anticipated government funding, expected customer and product mix or anticipated adoption or deployment of our appliances, platform, cloud or managed services, industry, market and customer trends, opportunities with existing and prospective customers, the timing of BEAD/BABA shipments, free cash flow and liquidity, continuation of our stock repurchase program and future financial performance (including the outlook for the third quarter of 2024, full year and future periods and performance against our Target Financial Model). Forward-looking statements are subject to risks and uncertainties that could cause actual results to differ materially from expectations, including but not limited to fluctuations in our financial and operating results, the capital spending decisions of our customers, changes and disruptions in the market and industry, availability of capital in the market, potential for growth in our business driven by government funds, changes in and impacts of regulations and/or government sponsored programs, competition, our ability to achieve market acceptance of our appliances, platform, cloud or managed services, our ability to grow our customer base, fluctuations in costs associated with our appliances and services including higher costs, dependence on third-parties for production and resource management associated with our global supply chain that may cause delays in production, inventory write-offs or component liabilities, cost overruns, disruptions in global trade and relations, social unrest and political uncertainties and other unanticipated factors, as well as the risks and uncertainties described in our annual reports on Form 10-K and our quarterly reports on Form 10-Q, each as filed with the SEC and available at www.sec.gov, particularly in
the sections titled “Risk Factors.” Forward-looking statements speak only as of the date the statements are made and are based on information available to us at the time those statements are made and/or management’s good faith belief as of that time with respect to future events. Calix assumes no obligation to update forward-looking statements to reflect actual performance or results, changes in assumptions or changes in other factors affecting forward-looking information, except to the extent required by applicable securities laws. Accordingly, investors should not place undue reliance on any forward-looking statements.
Use of Non-GAAP Financial Information
The Company uses certain non-GAAP financial measures in this stockholder letter to supplement its consolidated financial statements, which are presented in accordance with U.S. GAAP. These non-GAAP measures include non-GAAP gross margin, non-GAAP operating expenses, non-GAAP sales and marketing investments, non-GAAP research and development investments, non-GAAP general and administrative investments, non-GAAP effective income tax rate, non-GAAP net income, non-GAAP net income per diluted common share and non-GAAP free cash flow. These non-GAAP measures are provided to enhance the reader’s understanding of the Company’s operating performance as they primarily exclude non-cash stock-based compensation, intangible asset amortization, litigation settlement and the impact from changes in income taxes, which the Company believes are not indicative of its core operating results. Management believes that the non-GAAP measures used in this stockholder letter provide investors with important perspectives into the Company’s ongoing business performance and management uses these non-GAAP measures to evaluate financial results and to establish operational goals. The presentation of these non-GAAP measures is not meant to be a substitute for results presented in accordance with GAAP, but rather should be evaluated in conjunction with those GAAP results. A reconciliation of the non-GAAP results to the most directly comparable GAAP results is provided in this stockholder letter. The non-GAAP financial measures used by the Company may be calculated differently from, and therefore may not be comparable to, similarly titled measures used by other companies.
Net Promoter®, NPS®, NPS Prism® and the NPS-related emoticons are registered trademarks of Bain & Company, Inc., Satmetrix Systems, Inc. and Fred Reichheld. Net Promoter Score℠ and Net Promoter System℠ are service marks of Bain & Company, Inc., Satmetrix Systems, Inc. and Fred Reichheld.
| | | | | | | | | | | | | | | | | | | | | | | | | | | | | | | | |
| Calix, Inc. |
| Condensed Consolidated Statements of Operations |
| (Unaudited, in thousands, except per share data) |
| | | | | | | | | | |
| | | | Three Months Ended | | Six Months Ended |
| | | | June 29, | | July 1, | | June 29, | | July 1, |
| | | | 2024 | | 2023 | | 2024 | | 2023 |
| | | | | | |
| Revenue | | $ | 198,139 | | | $ | 261,016 | | | $ | 424,449 | | | $ | 511,024 | |
| Cost of revenue | | 90,536 | | | 124,546 | | | 194,269 | | | 246,503 | |
| Gross profit | | 107,603 | | | 136,470 | | | 230,180 | | | 264,521 | |
| Operating expenses: | | | | | | | | |
| Sales and marketing | | 52,238 | | | 54,596 | | | 106,135 | | | 106,461 | |
| Research and development | | 44,123 | | | 45,341 | | | 88,545 | | | 88,514 | |
| General and administrative | | 22,598 | | | 24,722 | | | 48,888 | | | 47,799 | |
| | Total operating expenses | | 118,959 | | | 124,659 | | | 243,568 | | | 242,774 | |
| Operating income (loss) | | (11,356) | | | 11,811 | | | (13,388) | | | 21,747 | |
| Interest income and other expense, net: | | | | | | | | |
| Interest income, net | | 2,960 | | | 2,255 | | | 5,595 | | | 3,895 | |
| Other income (expense), net | | (286) | | | 163 | | | (421) | | | (4) | |
| | Total interest income and other expense, net | | 2,674 | | | 2,418 | | | 5,174 | | | 3,891 | |
| Income (loss) before income taxes | | (8,682) | | | 14,229 | | | (8,214) | | | 25,638 | |
| Income taxes (benefit) | | (724) | | | 4,856 | | | (359) | | | 6,667 | |
| Net income (loss) | | $ | (7,958) | | | $ | 9,373 | | | $ | (7,855) | | | $ | 18,971 | |
| Net income (loss) per common share: | | | | | | | | |
| | Basic | | $ | (0.12) | | | $ | 0.14 | | | $ | (0.12) | | | $ | 0.29 | |
| | Diluted | | $ | (0.12) | | | $ | 0.13 | | | $ | (0.12) | | | $ | 0.27 | |
| Weighted average number of shares used to compute net income (loss) per common share: | | | | | | | |
| | Basic | | 65,678 | | | 66,271 | | | 65,509 | | | 66,157 | |
| | Diluted | | 65,678 | | | 69,657 | | | 65,509 | | | 69,684 | |
| | | | | | | | | | |
| | | | | | | | | | | | | | |
| Calix, Inc. |
| Condensed Consolidated Balance Sheets |
| (Unaudited, in thousands) |
| | | | |
| | June 29, | | December 31, |
| | 2024 | | 2023 |
| ASSETS |
| Current assets: | | | | |
| Cash and cash equivalents | | $ | 84,486 | | | $ | 63,409 | |
| Marketable securities | | 176,733 | | | 156,937 | |
| Accounts receivable, net | | 82,064 | | | 126,027 | |
| Inventory | | 113,484 | | | 132,985 | |
| Prepaid expenses and other current assets | | 113,391 | | | 118,598 | |
| Total current assets | | 570,158 | | | 597,956 | |
| Property and equipment, net | | 31,058 | | | 29,461 | |
| Right-of-use operating leases | | 8,250 | | | 9,262 | |
| Deferred tax assets | | 173,047 | | | 167,691 | |
| Goodwill | | 116,175 | | | 116,175 | |
| Other assets | | 19,208 | | | 21,320 | |
| | $ | 917,896 | | | $ | 941,865 | |
LIABILITIES AND STOCKHOLDERS’ EQUITY |
| Current liabilities: | | | | |
| Accounts payable | | $ | 11,697 | | | $ | 34,746 | |
| Accrued liabilities | | 89,145 | | | 116,227 | |
| Deferred revenue | | 32,298 | | | 36,669 | |
| Total current liabilities | | 133,140 | | | 187,642 | |
| Long-term portion of deferred revenue | | 21,936 | | | 24,864 | |
| Operating leases | | 5,859 | | | 7,421 | |
| Other long-term liabilities | | 2,737 | | | 2,956 | |
| Total liabilities | | 163,672 | | | 222,883 | |
| Stockholders’ equity: | | | | |
| Common stock | | 1,645 | | | 1,627 | |
| Additional paid-in capital | | 1,121,786 | | | 1,078,393 | |
| Accumulated other comprehensive loss | | (973) | | | (659) | |
| Accumulated deficit | | (368,234) | | | (360,379) | |
| Total stockholders’ equity | | 754,224 | | | 718,982 | |
| | $ | 917,896 | | | $ | 941,865 | |
| | | | | | | | | | | | | | |
| Calix, Inc. |
| Condensed Consolidated Statements of Cash Flows |
| (Unaudited, in thousands) |
| | | | |
| | Six Months Ended |
| | June 29, | | July 1, |
| | 2024 | | 2023 |
| Operating activities: | | | | |
| Net income (loss) | | $ | (7,855) | | | $ | 18,971 | |
| Adjustments to reconcile net income (loss) to net cash provided by operating activities: | | | | |
| Stock-based compensation | | 32,315 | | | 34,064 | |
| Depreciation and amortization | | 9,988 | | | 7,915 | |
| Deferred income taxes | | (5,284) | | | 884 | |
| Net accretion of available-for-sale securities | | (2,716) | | | (1,897) | |
| Changes in operating assets and liabilities: | | | | |
| Accounts receivable, net | | 43,962 | | | (3,176) | |
| Inventory | | 19,500 | | | (4,234) | |
| Prepaid expenses and other assets | | 6,420 | | | (26,123) | |
| Accounts payable | | (23,424) | | | (6,305) | |
| Accrued liabilities | | (26,787) | | | (502) | |
| Deferred revenue | | (7,300) | | | 8,626 | |
| Other long-term liabilities | | (1,781) | | | (2,647) | |
| Net cash provided by operating activities | | 37,038 | | | 25,576 | |
Investing activities: | | | | |
| Purchases of property and equipment | | (9,661) | | | (10,107) | |
| Purchases of marketable securities | | (148,897) | | | (105,888) | |
| Sales of marketable securities | | 48,734 | | | — | |
| Maturities of marketable securities | | 82,805 | | | 97,223 | |
| Net cash used in investing activities | | (27,019) | | | (18,772) | |
| Financing activities: | | | | |
| Proceeds from common stock issuances related to employee benefit plans | | 14,834 | | | 18,284 | |
| Repurchases of common stock | | (3,738) | | | (10,000) | |
| Payments related to financing arrangements | | — | | | (4,088) | |
| Net cash provided by financing activities | | 11,096 | | | 4,196 | |
| Effect of exchange rate changes on cash and cash equivalents | | (38) | | | 114 | |
| Net increase in cash and cash equivalents | | 21,077 | | | 11,114 | |
| Cash and cash equivalents at beginning of period | | 63,409 | | | 79,073 | |
| Cash and cash equivalents at end of period | | $ | 84,486 | | | $ | 90,187 | |
| | | | | | | | | | | | | | | | | | | | | | | | | | | | | | | | |
| Calix, Inc. |
| Reconciliation of GAAP to Non-GAAP Gross Margin |
| (Unaudited) |
| | Three Months Ended |
| | June 29,
2024 | | March 30,
2024 | | December 31, 2023 1 | | September 30,
2023 | | July 1,
2023 |
| GAAP gross margin | | 54.3 | % | | 54.2 | % | | 42.8 | % | | 53.3 | % | | 52.3 | % |
| Adjustments to GAAP amount: | | | | | | | | | | |
| Stock-based compensation | | 0.3 | | | 0.3 | | | 0.2 | | | 0.3 | | | 0.3 | |
| Intangible asset amortization | | 0.5 | | | 0.4 | | | 0.3 | | | 0.2 | | | 0.2 | |
| Non-GAAP gross margin | | 55.1 | % | | 54.9 | % | | 43.3 | % | | 53.8 | % | | 52.8 | % |
| | | | | | | |
1 | Inventory and component liability charges of 10.8% primarily related to the wind down of our legacy product set were removed from the adjustments to GAAP amounts as previously presented. | | |
| | | |
| | | |
| | | |
| | | |
| | | |
| | | |
| | | |
| | | |
| | | | | | | | | | | | | | | | | | | | | | | | | | | | | | | | |
| Calix, Inc. |
| Reconciliation of GAAP to Non-GAAP Operating Expenses |
| (Unaudited, in thousands) |
| | Three Months Ended |
| | June 29, | | March 30, | | December 31, | | September 30, | | July 1, |
| | 2024 | | 2024 | | 2023 | | 2023 | | 2023 |
| GAAP operating expenses: | | | | | | | | | | |
| Sales and marketing | | $ | 52,238 | | | $ | 53,897 | | | $ | 55,747 | | | $ | 52,356 | | | $ | 54,596 | |
| Research and development | | 44,123 | | | 44,422 | | | 42,295 | | | 46,963 | | | 45,341 | |
| General and administrative | | 22,598 | | | 26,290 | | | 27,295 | | | 25,301 | | | 24,722 | |
| | 118,959 | | | 124,609 | | | 125,337 | | | 124,620 | | | 124,659 | |
| Stock-based compensation: | | | | | | | | | | |
| Sales and marketing | | (4,191) | | | (4,850) | | | (3,075) | | | (4,333) | | | (5,053) | |
| Research and development | | (4,398) | | | (4,515) | | | (3,583) | | | (4,245) | | | (4,860) | |
| General and administrative | | (6,162) | | | (6,855) | | | (5,424) | | | (6,714) | | | (7,151) | |
| | (14,751) | | | (16,220) | | | (12,082) | | | (15,292) | | | (17,064) | |
| | | | | | | | | | |
| Litigation settlement – General and administrative | | — | | | — | | | (3,250) | | | — | | | — | |
| | | | | | | | | | |
| Non-GAAP operating expenses: | | | | | | | | | | |
| Sales and marketing | | 48,047 | | | 49,047 | | | 52,672 | | | 48,023 | | | 49,543 | |
| Research and development | | 39,725 | | | 39,907 | | | 38,712 | | | 42,718 | | | 40,481 | |
| General and administrative | | 16,436 | | | 19,435 | | | 18,621 | | | 18,587 | | | 17,571 | |
| | $ | 104,208 | | | $ | 108,389 | | | $ | 110,005 | | | $ | 109,328 | | | $ | 107,595 | |
| | | | | | | | | | | | | | | | | | | | | | | | | | | | | | | | | | | |
| Calix, Inc. |
| Reconciliation of GAAP Net Income (Loss) to Non-GAAP Net Income |
| (Unaudited, in thousands) |
| | Three Months Ended | |
| | June 29, | | March 30, | | December 31, | | Sept. 30, | | July 1, | |
| | 2024 | | 2024 | | 2023 1 | | 2023 | | 2023 | |
| GAAP net income (loss) | | $ | (7,958) | | | $ | 103 | | | $ | (6,599) | | | $ | 16,953 | | | $ | 9,373 | | |
| Adjustments to GAAP amount: | | | | | | | | | | | |
| Stock-based compensation | | 15,458 | | | 16,856 | | | 12,681 | | | 16,026 | | | 17,844 | | |
| Intangible asset amortization | | 956 | | | 956 | | | 757 | | | 658 | | | 658 | | |
| Litigation settlement | | — | | | — | | | 3,250 | | | — | | | — | | |
Income tax effect of non-GAAP adjustments | | (2,348) | | | (3,474) | | | (3,374) | | | (2,641) | | | (2,672) | | |
| Non-GAAP net income | | $ | 6,108 | | | $ | 14,441 | | | $ | 6,715 | | | $ | 30,996 | | | $ | 25,203 | | |
| | | | | | | | | | | |
| | | | | | | |
1 | Inventory and component liability charges of $22.7 million (net of taxes) primarily related to the wind down of our legacy product set were removed from the adjustments to GAAP amount as previously presented. | | |
| | | |
| | | |
| | | |
| | | |
| | | |
| | | |
| | | |
| | | |
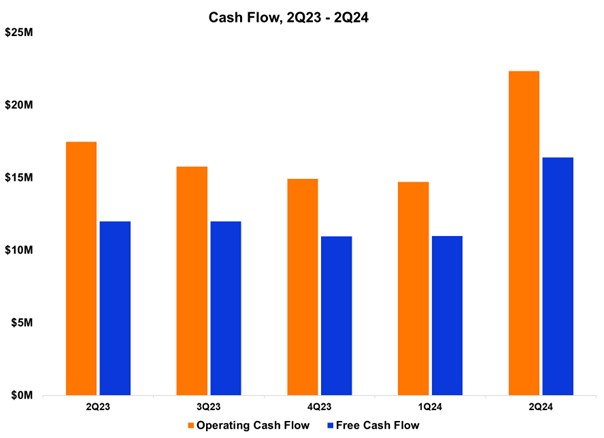
| | | | | | | | | | | | | | | | | | | | | | | | | | | | | | | | |
| Calix, Inc. |
| Non-GAAP Free Cash Flow Reconciliation |
| (Unaudited, in thousands) |
| | Three Months Ended |
| | June 29, | | March 30, | | December 31, | | Sept. 30, | | July 1, |
| | 2024 | | 2024 | | 2023 | | 2023 | | 2023 |
| Net cash provided by operating activities | | $ | 22,347 | | | $ | 14,691 | | | $ | 14,924 | | | $ | 15,751 | | | $ | 17,464 | |
| Purchases of property and equipment | | (5,952) | | | (3,709) | | | (3,972) | | | (3,776) | | | (5,489) | |
| Non-GAAP free cash flow | | $ | 16,395 | | | $ | 10,982 | | | $ | 10,952 | | | $ | 11,975 | | | $ | 11,975 | |
| | | | | | | | |
| Calix, Inc. |
Reconciliation of GAAP Net Loss to Non-GAAP Net Income Per Diluted Common Share 1 |
| (Unaudited) |
| | Three Months Ended
June 29, 2024 |
| GAAP net loss per diluted common share | | $ | (0.12) | |
| Adjustments to GAAP amount: | | |
| Stock-based compensation | | 0.23 | |
| Intangible asset amortization | | 0.01 | |
Income tax effect of non-GAAP adjustments | | (0.03) | |
| Non-GAAP net income per diluted common share | | $ | 0.09 | |
| | | | | | | |
1 | Based on 68.2 million weighted-average diluted common shares outstanding. | | |
| | | |
| | | |
| | | |
| | | |
| | | |
| | | |
| | | |
| | | |
| | | | | | | | | | | | | | | | | | | | | | | | | | |
| Calix, Inc. |
| Reconciliation of GAAP to Non-GAAP Guidance |
| (Unaudited, dollars in thousands, except per share data) |
| Three Months Ending September 28, 2024 |
| | GAAP | | Stock-Based Compensation | | Intangible
Asset Amortization | | Non-GAAP |
| Gross margin | | 53.55% - 55.55% | | 0.3% | | 0.4% | | 54.25% - 56.25% |
| Operating expenses | | $121,000 - $124,000 | | $(16,000) | | $ — | | $105,000 - $108,000 |
Net income (loss) per diluted common share 1 | | $(0.18) - $(0.12) | | $0.22 2 | | $0.01 2 | | $0.05 - $0.11 |
| | | | | | | |
1 | Based on 68.6 million weighted-average diluted common shares outstanding. | | |
2 | Net of income taxes. | | |
| | | |
| | | |
| | | |
| | | |
| | | |
| | | |
| | | |
| | | |
| X |
- DefinitionBoolean flag that is true when the XBRL content amends previously-filed or accepted submission.
| Name: |
dei_AmendmentFlag |
| Namespace Prefix: |
dei_ |
| Data Type: |
xbrli:booleanItemType |
| Balance Type: |
na |
| Period Type: |
duration |
|
| X |
- DefinitionFor the EDGAR submission types of Form 8-K: the date of the report, the date of the earliest event reported; for the EDGAR submission types of Form N-1A: the filing date; for all other submission types: the end of the reporting or transition period. The format of the date is YYYY-MM-DD.
| Name: |
dei_DocumentPeriodEndDate |
| Namespace Prefix: |
dei_ |
| Data Type: |
xbrli:dateItemType |
| Balance Type: |
na |
| Period Type: |
duration |
|
| X |
- DefinitionThe type of document being provided (such as 10-K, 10-Q, 485BPOS, etc). The document type is limited to the same value as the supporting SEC submission type, or the word 'Other'.
| Name: |
dei_DocumentType |
| Namespace Prefix: |
dei_ |
| Data Type: |
dei:submissionTypeItemType |
| Balance Type: |
na |
| Period Type: |
duration |
|
| X |
- DefinitionAddress Line 1 such as Attn, Building Name, Street Name
| Name: |
dei_EntityAddressAddressLine1 |
| Namespace Prefix: |
dei_ |
| Data Type: |
xbrli:normalizedStringItemType |
| Balance Type: |
na |
| Period Type: |
duration |
|
| X |
- Definition
+ References
+ Details
| Name: |
dei_EntityAddressCityOrTown |
| Namespace Prefix: |
dei_ |
| Data Type: |
xbrli:normalizedStringItemType |
| Balance Type: |
na |
| Period Type: |
duration |
|
| X |
- DefinitionCode for the postal or zip code
| Name: |
dei_EntityAddressPostalZipCode |
| Namespace Prefix: |
dei_ |
| Data Type: |
xbrli:normalizedStringItemType |
| Balance Type: |
na |
| Period Type: |
duration |
|
| X |
- DefinitionName of the state or province.
| Name: |
dei_EntityAddressStateOrProvince |
| Namespace Prefix: |
dei_ |
| Data Type: |
dei:stateOrProvinceItemType |
| Balance Type: |
na |
| Period Type: |
duration |
|
| X |
- DefinitionA unique 10-digit SEC-issued value to identify entities that have filed disclosures with the SEC. It is commonly abbreviated as CIK. Reference 1: http://www.xbrl.org/2003/role/presentationRef
-Publisher SEC
-Name Exchange Act
-Number 240
-Section 12
-Subsection b-2
| Name: |
dei_EntityCentralIndexKey |
| Namespace Prefix: |
dei_ |
| Data Type: |
dei:centralIndexKeyItemType |
| Balance Type: |
na |
| Period Type: |
duration |
|
| X |
- DefinitionIndicate if registrant meets the emerging growth company criteria. Reference 1: http://www.xbrl.org/2003/role/presentationRef
-Publisher SEC
-Name Exchange Act
-Number 240
-Section 12
-Subsection b-2
| Name: |
dei_EntityEmergingGrowthCompany |
| Namespace Prefix: |
dei_ |
| Data Type: |
xbrli:booleanItemType |
| Balance Type: |
na |
| Period Type: |
duration |
|
| X |
- DefinitionCommission file number. The field allows up to 17 characters. The prefix may contain 1-3 digits, the sequence number may contain 1-8 digits, the optional suffix may contain 1-4 characters, and the fields are separated with a hyphen.
| Name: |
dei_EntityFileNumber |
| Namespace Prefix: |
dei_ |
| Data Type: |
dei:fileNumberItemType |
| Balance Type: |
na |
| Period Type: |
duration |
|
| X |
- DefinitionTwo-character EDGAR code representing the state or country of incorporation.
| Name: |
dei_EntityIncorporationStateCountryCode |
| Namespace Prefix: |
dei_ |
| Data Type: |
dei:edgarStateCountryItemType |
| Balance Type: |
na |
| Period Type: |
duration |
|
| X |
- DefinitionThe exact name of the entity filing the report as specified in its charter, which is required by forms filed with the SEC. Reference 1: http://www.xbrl.org/2003/role/presentationRef
-Publisher SEC
-Name Exchange Act
-Number 240
-Section 12
-Subsection b-2
| Name: |
dei_EntityRegistrantName |
| Namespace Prefix: |
dei_ |
| Data Type: |
xbrli:normalizedStringItemType |
| Balance Type: |
na |
| Period Type: |
duration |
|
| X |
- DefinitionThe Tax Identification Number (TIN), also known as an Employer Identification Number (EIN), is a unique 9-digit value assigned by the IRS. Reference 1: http://www.xbrl.org/2003/role/presentationRef
-Publisher SEC
-Name Exchange Act
-Number 240
-Section 12
-Subsection b-2
| Name: |
dei_EntityTaxIdentificationNumber |
| Namespace Prefix: |
dei_ |
| Data Type: |
dei:employerIdItemType |
| Balance Type: |
na |
| Period Type: |
duration |
|
| X |
- DefinitionLocal phone number for entity.
| Name: |
dei_LocalPhoneNumber |
| Namespace Prefix: |
dei_ |
| Data Type: |
xbrli:normalizedStringItemType |
| Balance Type: |
na |
| Period Type: |
duration |
|
| X |
- DefinitionBoolean flag that is true when the Form 8-K filing is intended to satisfy the filing obligation of the registrant as pre-commencement communications pursuant to Rule 13e-4(c) under the Exchange Act. Reference 1: http://www.xbrl.org/2003/role/presentationRef
-Publisher SEC
-Name Exchange Act
-Number 240
-Section 13e
-Subsection 4c
| Name: |
dei_PreCommencementIssuerTenderOffer |
| Namespace Prefix: |
dei_ |
| Data Type: |
xbrli:booleanItemType |
| Balance Type: |
na |
| Period Type: |
duration |
|
| X |
- DefinitionBoolean flag that is true when the Form 8-K filing is intended to satisfy the filing obligation of the registrant as pre-commencement communications pursuant to Rule 14d-2(b) under the Exchange Act. Reference 1: http://www.xbrl.org/2003/role/presentationRef
-Publisher SEC
-Name Exchange Act
-Number 240
-Section 14d
-Subsection 2b
| Name: |
dei_PreCommencementTenderOffer |
| Namespace Prefix: |
dei_ |
| Data Type: |
xbrli:booleanItemType |
| Balance Type: |
na |
| Period Type: |
duration |
|
| X |
- DefinitionTitle of a 12(b) registered security. Reference 1: http://www.xbrl.org/2003/role/presentationRef
-Publisher SEC
-Name Exchange Act
-Number 240
-Section 12
-Subsection b
| Name: |
dei_Security12bTitle |
| Namespace Prefix: |
dei_ |
| Data Type: |
dei:securityTitleItemType |
| Balance Type: |
na |
| Period Type: |
duration |
|
| X |
- DefinitionName of the Exchange on which a security is registered. Reference 1: http://www.xbrl.org/2003/role/presentationRef
-Publisher SEC
-Name Exchange Act
-Number 240
-Section 12
-Subsection d1-1
| Name: |
dei_SecurityExchangeName |
| Namespace Prefix: |
dei_ |
| Data Type: |
dei:edgarExchangeCodeItemType |
| Balance Type: |
na |
| Period Type: |
duration |
|
| X |
- DefinitionBoolean flag that is true when the Form 8-K filing is intended to satisfy the filing obligation of the registrant as soliciting material pursuant to Rule 14a-12 under the Exchange Act. Reference 1: http://www.xbrl.org/2003/role/presentationRef
-Publisher SEC
-Name Exchange Act
-Number 240
-Section 14a
-Subsection 12
| Name: |
dei_SolicitingMaterial |
| Namespace Prefix: |
dei_ |
| Data Type: |
xbrli:booleanItemType |
| Balance Type: |
na |
| Period Type: |
duration |
|
| X |
- DefinitionTrading symbol of an instrument as listed on an exchange.
| Name: |
dei_TradingSymbol |
| Namespace Prefix: |
dei_ |
| Data Type: |
dei:tradingSymbolItemType |
| Balance Type: |
na |
| Period Type: |
duration |
|
| X |
- DefinitionBoolean flag that is true when the Form 8-K filing is intended to satisfy the filing obligation of the registrant as written communications pursuant to Rule 425 under the Securities Act. Reference 1: http://www.xbrl.org/2003/role/presentationRef
-Publisher SEC
-Name Securities Act
-Number 230
-Section 425
| Name: |
dei_WrittenCommunications |
| Namespace Prefix: |
dei_ |
| Data Type: |
xbrli:booleanItemType |
| Balance Type: |
na |
| Period Type: |
duration |
|
Calix (NYSE:CALX)
Gráfica de Acción Histórica
De Jun 2024 a Jul 2024

Calix (NYSE:CALX)
Gráfica de Acción Histórica
De Jul 2023 a Jul 2024
