Form 8-K - Current report
04 Agosto 2023 - 6:00AM
Edgar (US Regulatory)
0001677576
false
0001677576
2023-08-04
2023-08-04
0001677576
us-gaap:CommonStockMember
2023-08-04
2023-08-04
0001677576
us-gaap:SeriesAPreferredStockMember
2023-08-04
2023-08-04
iso4217:USD
xbrli:shares
iso4217:USD
xbrli:shares
UNITED STATES
SECURITIES AND
EXCHANGE COMMISSION
WASHINGTON,
D.C. 20549
FORM 8-K
CURRENT REPORT
Pursuant to
Section 13 or 15(d)
of the Securities
Exchange Act of 1934
Date of
Report (Date of earliest event reported): August
4, 2023
Innovative Industrial
Properties, Inc.
(Exact name
of registrant as specified in its charter)
| Maryland |
|
001-37949 |
|
81-2963381 |
|
(State or Other Jurisdiction
of Incorporation) |
|
(Commission
File No.) |
|
(I.R.S. Employer
Identification No.) |
1389 Center
Drive, Suite 200
Park City, UT
84098
(Address of
principal executive offices, including zip code)
Registrant’s
telephone number, including area code: (858) 997-3332
Check the appropriate box below if
the Form 8-K filing is intended to simultaneously satisfy the filing obligation of the registrant under any of the following provisions
(see General Instruction A.2. below):
| ¨ |
Written communications pursuant to Rule 425 under the Securities Act (17 CFR 230.425) |
| ¨ |
Soliciting material pursuant to Rule 14a-12 under the Exchange Act (17 CFR 240.14a-12) |
| ¨ |
Pre-commencement communications pursuant
to Rule 14d-2(b) under the Exchange Act (17 CFR 240.14d-2(b)) |
| ¨ |
Pre-commencement communications pursuant to Rule 13e-4(c) under
the Exchange Act (17 CFR 240.13e-4(c)) |
Indicate
by check mark whether the registrant is an emerging growth company as defined in Rule 405 of the Securities Act of 1933 (§230.405
of this chapter) or Rule 12b-2 of the Securities Exchange Act of 1934 (§240.12b-2 of this chapter). Emerging growth company
¨
If an emerging growth company, indicate by check mark if the
registrant has elected not to use the extended transition period for complying with any new or revised financial accounting standards
provided pursuant to Section 13(a) of the Exchange Act. ¨
Securities Registered pursuant to Section 12(b) of the Act:
| Title of each class |
|
Trading Symbol(s) |
|
Name of each exchange on which registered |
| Common Stock, par value $0.001 per share |
|
IIPR |
|
New York Stock Exchange |
| Series A Preferred Stock, par value $0.001 per share |
|
IIPR-PA |
|
New York Stock Exchange |
Item 7.01
Regulation FD Disclosure.
On
August 4, 2023, Innovative Industrial Properties, Inc. (the “Company”) posted an investor presentation to its website located
at http://investors.innovativeindustrialproperties.com/. A copy of the investor presentation is attached hereto as Exhibit 99.1 and
is incorporated by reference herein.
The
information contained in this Current Report, including Exhibit 99.1 referenced herein, is being furnished and shall not be deemed “filed”
for purposes of Section 18 of the Securities Exchange Act of 1934, as amended, or otherwise subject to the liabilities of that section.
Such information shall not be incorporated by reference into any filing of the Company, whether made before or after the date hereof,
regardless of any general incorporation language in such filing.
Item 9.01 Financial Statements and
Exhibits.
SIGNATURES
Pursuant to the requirements
of the Securities Exchange Act of 1934, the registrant has duly caused this report to be signed on its behalf by the undersigned hereunto
duly authorized.
| Date: August 4, 2023 |
INNOVATIVE INDUSTRIAL PROPERTIES, INC. |
| |
|
|
| |
By: |
/s/ David Smith |
| |
Name: |
David Smith |
| |
Title: |
Chief Financial Officer |
| |
|
Exhibit 99.1

| Innovative Industrial Properties
1
INNOVATIVE
INDUSTRIAL
PROPERTIES
NYSE: IIPR
INNOVATIVEINDUSTRIALPROPERTIES.COM
COMPANY PRESENTATION
POSTED: AUGUST 4, 2023 |

| Innovative Industrial Properties 2
FORWARD LOOKING STATEMENTS
This presentation and our associated comments include "forward-looking statements" (within the meaning of the Private Securities Litigation Reform Act of 1995, Section 27A of the Securities Act of
1933, as amended, and Section 21E of the Securities Exchange Act of 1934, as amended) that are subject to risks and uncertainties. In particular, statements pertaining to our capital resources, portfolio
performance and results of operations contain forward-looking statements. Likewise, our statements regarding anticipated growth in our funds from operations and anticipated market and regulatory
conditions, our strategic direction, our dividend rate and policy, demographics, results of operations, plans and objectives are forward-looking statements. Forward-looking statements involve numerous
risks and uncertainties, and you should not rely on them as predictions of future events. Forward-looking statements depend on assumptions, data or methods which may be incorrect or imprecise, and
we may not be able to realize them. We do not guarantee that the transactions and events described will happen as described (or that they will happen at all). You can identify forward-looking statements
by the use of forward-looking terminology such as "believes“, "expects“, "may“, "will“, "should“, "seeks“, "approximately“, "intends“, "plans“, "estimates" or "anticipates" or the negative of these words and
phrases or similar words or phrases. You can also identify forward-looking statements by discussions of strategy, plans or intentions. The following factors, among others, could cause actual results and
future events to differ materially from those set forth or contemplated in the forward-looking statements: rates of default on leases for our assets; concentration of our portfolio of assets and limited
number of tenants; the estimated growth in and evolving market dynamics of the regulated cannabis market; the demand for regulated cannabis facilities; inflation dynamics; our ability to improve our
internal control over financial reporting, including our inability to remediate an identified material weakness, and the costs and the time associated with such efforts; the impact of pandemics on us, our
business, our tenants, or the economy generally; war and other hostilities, including the conflict in Ukraine; our business and investment strategy; our projected operating results; actions and initiatives of
the U.S. or state governments and changes to government policies and the execution and impact of these actions, initiatives and policies, including the fact that cannabis remains illegal under federal
law; availability of suitable investment opportunities in the regulated cannabis industry; our understanding of our competition and our potential tenants’ alternative financing sources; the expected
medical-use or adult-use cannabis legalization in certain states; shifts in public opinion regarding regulated cannabis; the potential impact on us from litigation matters, including rising liability and
insurance costs; the additional risks that may be associated with certain of our tenants cultivating, processing and/or dispensing adult-use cannabis in our facilities; the state of the U.S. economy
generally or in specific geographic areas; economic trends and economic recoveries; our ability to access equity or debt capital; financing rates for our target assets; our level of indebtedness, which
could reduce funds available for other business purposes and reduce our operational flexibility; covenants in our debt instruments, which may limit our flexibility and adversely affect our financial
condition; our ability to maintain our investment grade credit rating; changes in the values of our assets; our expected portfolio of assets; our expected investments; interest rate mismatches between
our assets and our borrowings used to fund such investments; changes in interest rates and the market value of our assets; the degree to which any interest rate or other hedging strategies may or may
not protect us from interest rate volatility; the impact of and changes in governmental regulations, tax law and rates, accounting guidance and similar matters; our ability to maintain our qualification as a
real estate investment trust for U.S. federal income tax purposes; our ability to maintain our exemption from registration under the Investment Company Act of 1940; availability of qualified personnel;
and market trends in our industry, interest rates, real estate values, the securities markets or the general economy.
The risks included here are not exhaustive, and additional factors could adversely affect our business and financial performance. In addition, we discussed a number of material risks in our most recent
Annual Report on Form 10-K and subsequent Quarterly Reports on Form 10-Q. Those risks continue to be relevant to our performance and financial condition. Moreover, we operate in a very competitive
and rapidly changing environment. New risk factors emerge from time to time and it is not possible for management to predict all such risk factors, nor can it assess the impact of all such risk factors on
our business or the extent to which any factor, or combination of factors, may cause actual results to differ materially from those contained in any forward-looking statements. Any forward-looking
statement made by us speaks only of the date on which we make it. We undertake no obligation to publicly update or revise any forward-looking statements, whether as a result of new information,
future events or otherwise, except as may be required by law. Stockholders and investors are cautioned not to unduly rely on such forward-looking statements when evaluating the information presented
in our filings and reports.
Market and industry data are included in this presentation. We have obtained substantially all of this information from internal studies, public filings, other independent published industry sources and
market studies prepared by third parties. We believe these internal studies, public filings, other independent published industry sources and market studies prepared by third parties are reliable.
However, this information may prove to be inaccurate. No representation or warranty is made as to the accuracy of such information. All amounts shown in this presentation are unaudited. This is not an
offer to sell or solicitation to buy securities of Innovative Industrial Properties, Inc. Any offers to sell or solicitations to buy securities of Innovative Industrial Properties, Inc. shall be made only by means of
a prospectus approved for that purpose. |

| Innovative Industrial Properties 3
Founded in 2016
We are the first and only publicly traded company on
the New York Stock Exchange (NYSE: IIPR) to provide
real estate capital to the regulated cannabis industry
WHY IIPR WAS FORMED
Specialized Real
Estate
U.S. cannabis operators require mission
critical facilities with specialized buildouts
to optimize environment and conform to
licensing and zoning requirements
Outsized Need for
Capital
U.S. cannabis operators have an outsized
need for capital to fund growth
Rapid Adoption of
State Legalization
As of August 2023, 40 states and
Washington, D.C. have legalized cannabis
for medical-use, and 23 states and
Washington, D.C. have legalized cannabis
for adult-use
(2)
Large and Growing
Industry
Regulated cannabis sales estimated to
grow to $45 billion by 2027, almost
double 2022 estimated regulated sales of
$26 billion(1)
Limited Access to
Financing
Due to federal prohibition and being a
nascent industry, U.S. cannabis operators
were historically required to fund growth
through highly dilutive forms of capital
absent other forms of financing
(1) Source: BDSA Legal Cannabis Market Forecast (June 2023).
(2) Source: 2023 U.S. Cannabis Report, New Frontier Data, National Conference of State Legislatures (www.ncsl.org) as of June 2023. |

| Innovative Industrial Properties 4
OUR BUSINESS MODEL & BENEFITS
Structured long-term cash flows
• Generally, 15-20 year initial lease terms (vs. ~5
years for traditional industrial leases)
• Leases generally subject to parent company
guarantees covering operations throughout the
United States
Capital efficient lease structure
• Target leases are 100% triple-net
⚬ No recurring capital expenditures during lease
term
⚬ All property expenses paid by the tenant,
including capital repairs and replacements
Strong initial rental yields with
annual escalations
We work closely with
state-licensed
cannabis operators
Provide non-dilutive
capital
Facilitate our tenants’
growth plans
Execute sale-leasebacks
and fund improvements
for cultivation,
processing and retail
properties |

| Innovative Industrial Properties 5
# of Tenants by
Year
(5)
# of Properties
by Year
# of States by
Year 1
4
9
14
17
19 19 19
2016 2017 2018 2019 2020 2021 2022 6/30
1
4
8
18
20
26
29 30
2016 2017 2018 2019 2020 2021 2022 6/30
Capital
Committed by
Year ($)(1) 30.0M 73.3M 167.4M
690.0M
1.3B
2.0B
2.3B 2.4B
2016 2017 2018 2019 2020 2021 2022 6/30
IIPR AS OF JUNE 30, 2023
Note: Data as of June 30, 2023, unless otherwise noted.
(1) Total Committed / Invested Capital includes (1) total investments in properties (consisting of purchase price and construction funding and improvements reimbursed to tenants, if any, but excluding transaction costs) and (2) total additional commitments to reimburse certain tenants and sellers for completion of
construction and improvements at the properties. Excludes a $23.0 million loan commitment from us to a developer for construction of a regulated cannabis cultivation and processing facility in California and a seller-financed note issued to us by the buyer in connection with our disposition of a portfolio of four
properties in southern California.
(2) Operating Portfolio is defined as all properties that (a) are leased or (b) are not leased but ready for their intended use. Operating Portfolio includes approximately 1.0 million square feet under development or redevelopment.
(3) Reflects annualized common stock dividend paid on July 14, 2023 of $1.80 per share. The decision to declare or pay dividends is in the sole discretion of our board of directors in light of conditions then existing, and there can be no assurance that a dividend will be declared or paid for any time period in any
amount.
(4) Weighted average lease length calculated by weighting the remaining lease term based on the base rent and management fees, after the expiration of applicable base rent phase-in periods for the Operating Portfolio.
(5) Each “Tenant” represents the parent company of the tenant, for which the parent company has provided a corporate guaranty. A parent company may have multiple tenant subsidiaries across IIP’s properties. Includes one tenant for a pre-leased and under-development property in CA.
$2.4B
Total
Committed /
Invested
Capital(1)
108
Properties
(Operating
Portfolio - 103)(2)
8.1M
Rentable Square
Feet - Operating
Portfolio(2)
19
U.S. States
$7.20
Q2 2023
Annualized
Dividend(3)
$76.5M
Q2 2023
Total Revenue
14.9 Years
Weighted
Average Lease
Length(4)
1 5 11
45
65
102
110 108
2016 2017 2018 2019 2020 2021 2022 6/30 |

| Innovative Industrial Properties 6
PORTFOLIO OVERVIEW
IIPR has a geographically diversified portfolio of properties throughout the United States
State Diversification(1)
PA MA IL MI CA NY FL OH NJ MD Other Total
16.1% 12.8% 12.8% 11.7% 8.7% 8.0% 7.0% 4.7% 4.4% 3.7% 10.1% 100%
Public vs. Private
(1)
58% Public 42% Private
Note: Data as of June 30, 2023, unless otherwise noted.
(1) As a % of Total Committed / Invested Capital. % based on the Total Portfolio for State Diversification. % based on leased Operating Portfolio, for all others. See footnote (1) on page 5.
(2) “MSO” stands for Multi-State Operator which means the tenant (or guarantor) conducts cannabis operations in more than one state. “SSO” stands for Single-State Operator which means the tenant (or guarantor) conducts cannabis operations in a single state.
(3) “Industrial” reflects facilities utilized or expected to be utilized for regulated cannabis cultivation, processing and/or distribution activities, which can consist of industrial and/or greenhouse space.
Property Type
(1)
3%
Retail
91%
Industrial(3)
6%
Industrial
/ Retail
Operator Type
(1)(2)
89% MSO 11% SSO |

| Innovative Industrial Properties 7
TRACK RECORD OF GROWTH
AND PROFITABILITY
Note: Dollars in thousands.
(1) “Net Operating Income (NOI)” reported as total revenue less property expenses on the company’s consolidated statements of income.
(2) "CAGR" represents compound annualized growth rate for the relevant metric.
(3) “G&A” reported as “general and administrative expense” on the company’s consolidated statements of income.
(4) See the company’s applicable periodic reports filed with the SEC for definitions of funds from operations (“FFO”) and adjusted funds from operations ("AFFO") (each a supplemental non-GAAP financial measure) and reconciliation of FFO and AFFO to GAAP net income attributable to common stockholders.
$2,352 $9,727
$34,992
$98,078
$174,984
$233,748
2017 2018 2019 2020 2021 2022
Year Over Year AFFO(2)(4)
Year Over Year G&A as a % of NOI
(1)(3)
$5,610 $6,375 $9,818
$14,182
$22,961
$38,520
89.0%
44.4%
22.6%
12.7% 11.5% 14.5%
2017 2018 2019 2020 2021 2022
G&A
G&A % of NOI
Year Over Year FFO(2)(4)
$520 $8,262
$30,722
$92,403
$154,414
$210,736
2017 2018 2019 2020 2021 2022
Year Over Year Net Operating Income (NOI)(1)(2)
$6,302 $14,342
$43,352
$111,944
$200,108
$265,839
2017 2018 2019 2020 2021 2022 |

| Innovative Industrial Properties 8
2% 1%
(3%)
10% 9% 9%
3%
19%
48%
1-Year CAGR 3-Year CAGR 5-Year CAGR
REIT(2) S&P 500 IIPR
Common Stock Dividend Per Share(1)
4%
(6%)
(2%)
8%
21%
10%
1%
25%
53%
1-Year CAGR 3-Year CAGR 5-Year CAGR
REIT(2) S&P 500 IIPR (Diluted)
Net Income Attributable to Common Stockholders Per Share
(1)
COMPARATIVE
PERFORMANCE
(1) Per S&P Capital IQ Pro latest available data as of August 2, 2023. S&P Capital IQ Pro excludes outliers for each index. See footnote (2) on page 7.
(2) REIT index is made up of constituent data for the FTSE NAREIT U.S. Real Estate Index Series found on the National Association of Real Estate Investment Trusts (“NAREIT”) website, representing publicly traded REITs across the United States.
(3) Calculated as base rent and property management fees collected over contractual base rent and property management fees due for the period. Includes security deposits applied for the payment of rent. Q3 2022, Q4 2022 and Q1 2023 include approximately $2.2 million, $541,000 and $3.1 million, respectively, of
security deposits applied in connection with non-payment of rent. Q1 2023 also includes approximately $1.1 million of security deposits applied for payment of rent in connection with previously disclosed amendments with Holistic Industries, Inc. (“Holistic”) at a California property and a Michigan property, which are
subject to repayment over a future twelve-month period. Q2 2023 includes $1.5 million of security deposits applied for payment of rent in connection with the Holistic amendments and a previously disclosed amendment with Temescal Wellness of Massachusetts, LLC, all of which are subject to repayment over a
future twelve-month period.
$30.0M $73.3M $167.4M
$690.0M
$1.3B
$2.0B
$2.3B $2.4B
100% 100% 100% 100% 99% 100% 97% 98%
2016 2017 2018 2019 2020 2021 2022 6/30
Invested Capital
% Rent Collection
Historical Rent Collection (Operating Portfolio)(3) |

| Innovative Industrial Properties 9
IIP Portfolio First Quarter 2023(3) Tenant Information
Total
Invested Capital(1) Investment # of Adjusted Market MSO
# Tenant $ % Square Feet(2) / Square Feet Leases Revenue EBITDA(4) Capitalization(5) / SSO(6)
1 PharmaCann $321,172 13.5% 688 $467 11 Private Co. Private Co. Private Co. MSO
2 Ascend Wellness (AWH) 214,050 9.0% 624 343 4 $114 $23 $127 MSO
3 Green Thumb Industries 176,800 7.4% 664 266 3 249 76 1,806 MSO
4 Parallel 175,650 7.4% 832 211 3 Private Co. Private Co. Private Co. MSO
5 Curaleaf 175,047 7.3% 578 303 8 336 73 2,236 MSO
6 Columbia Care 147,834 6.2% 588 251 21 125 16 189 MSO
7 Trulieve 146,503 6.1% 740 198 6 289 78 730 MSO
8 Holistic Industries 121,900 5.1% 333 366 5 Private Co. Private Co. Private Co. MSO
9 Cresco Labs 120,845 5.1% 379 319 5 194 29 511 MSO
10 4Front Ventures(7) 119,150 5.0% 488 244 4 30 4 98 MSO
Top 10 Tenants Total $1,718,951 72.0% 5,914 $291 70
TOP TEN TENANTS
BY INVESTED CAPITAL
Note: Data as of June 30, 2023, unless otherwise noted.
(1) Dollars in thousands, see footnote (1) on page 5.
(2) Square feet in thousands.
(3) Dollars in millions, based on each company’s public securities filings and earnings release, available at www.sec.gov, www.sedar.com, or each company’s respective website, for the quarter ended March 31, 2023.
(4) Adjusted EBITDA is a non-GAAP financial measure utilized in the industry. For definitions and reconciliations of Adjusted EBITDA to net income, see each company’s public securities filings, available at www.sec.gov or www.sedar.com.
(5) Dollars in millions, per S&P Capital IQ Pro as of 6/30/2023.
(6) See footnote (2) on page 6.
(7) Includes one property acquired in January 2022 for $16.0 million which did not satisfy the requirements for sale-leaseback accounting and therefore, the transaction is recognized as a note receivable and is included in other assets, net on our consolidated balance sheet.
Top ten tenants represent ~72% of the company’s invested capital |

| Innovative Industrial Properties 10
Balance Sheet Statistics
$4.4 Million
$300.0 Million
2023 2024 2025 2026 2027 Thereafter
Exchangeable Senior Notes Notes Due 2026
BALANCE SHEET
HIGHLIGHTS
Debt Overview
Exchangeable Senior Notes:
• $4.4M of 3.75% exchangeable senior notes, maturing February 21, 2024
• Exchangeable for cash, common stock, or a combination (at IIP’s option)
Unsecured Senior Notes:
• Investment Grade Rating BBB+ from Egan Jones, since May 2021
• $300.0M of 5.50% unsecured senior notes due May 25, 2026
Capital Structure(2) Debt Maturity Profile
(3)
Note: As of June 30, 2023, unless otherwise noted.
(1) Calculated in accordance with the indenture governing the Notes due 2026, included in the Current Report on Form 8-K filed with the Securities and Exchange Commission on May 25, 2021.
(2) Share price per S&P Capital IQ Pro as of 6/30/2023.
(3) Principal amount shown as provided in the Company’s latest quarterly filing.
$0.0B
$0.3B
$0.6B
$0.9B
$1.2B
$1.5B
$1.8B
$2.1B
$2.0B in Common Equity
$15.0M in Preferred Equity
$304.4M in Gross Debt
12% Debt to
Total Gross
Assets(1)
>16x Debt
Service Coverage
Ratio(1)
No Material Debt
Maturities Until
2026
IIP Is One of the Lowest Leveraged Public REITs |
| Innovative Industrial Properties 11
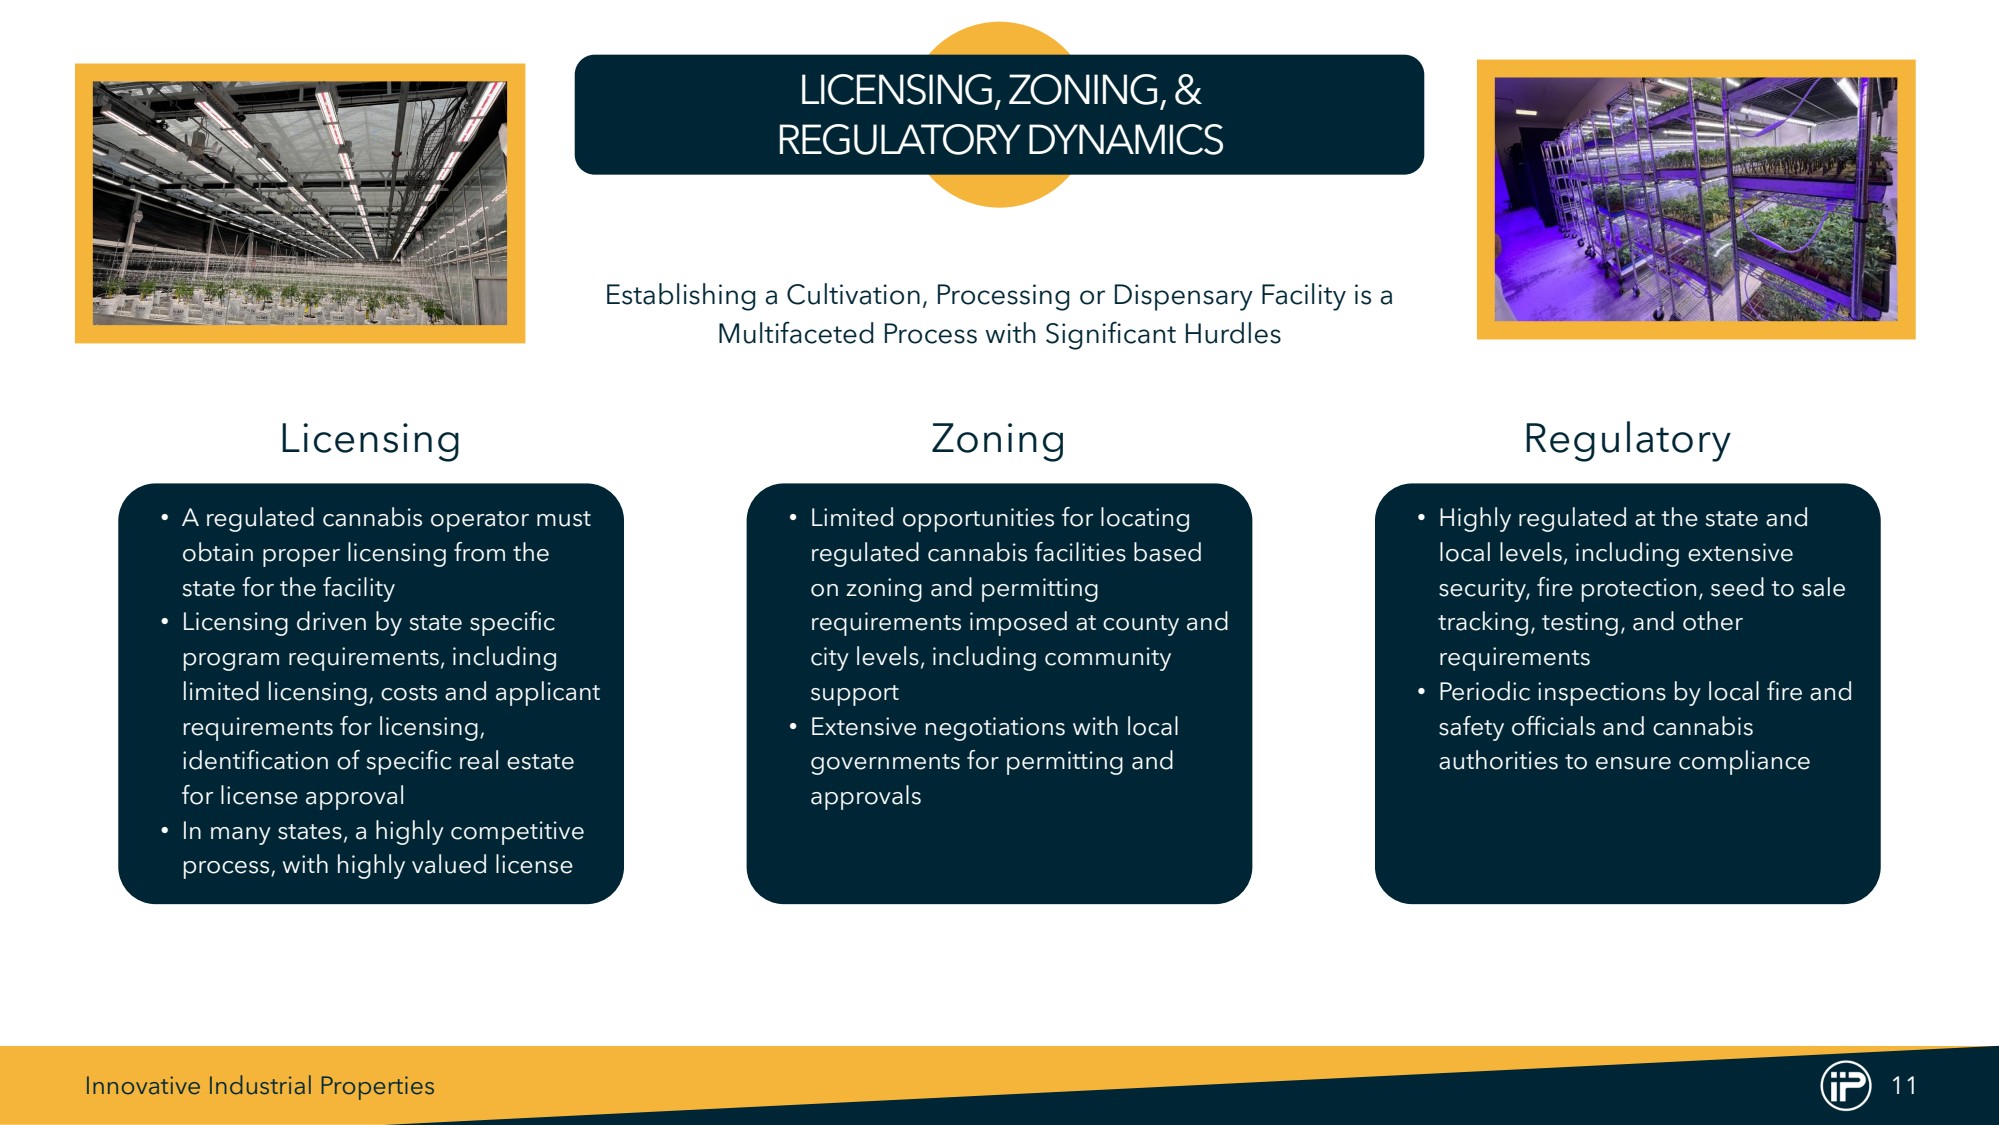
LICENSING, ZONING, &
REGULATORY DYNAMICS
Establishing a Cultivation, Processing or Dispensary Facility is a
Multifaceted Process with Significant Hurdles
• A regulated cannabis operator must
obtain proper licensing from the
state for the facility
• Licensing driven by state specific
program requirements, including
limited licensing, costs and applicant
requirements for licensing,
identification of specific real estate
for license approval
• In many states, a highly competitive
process, with highly valued license
Licensing Zoning Regulatory
• Limited opportunities for locating
regulated cannabis facilities based
on zoning and permitting
requirements imposed at county and
city levels, including community
support
• Extensive negotiations with local
governments for permitting and
approvals
• Highly regulated at the state and
local levels, including extensive
security, fire protection, seed to sale
tracking, testing, and other
requirements
• Periodic inspections by local fire and
safety officials and cannabis
authorities to ensure compliance |
| Innovative Industrial Properties 12
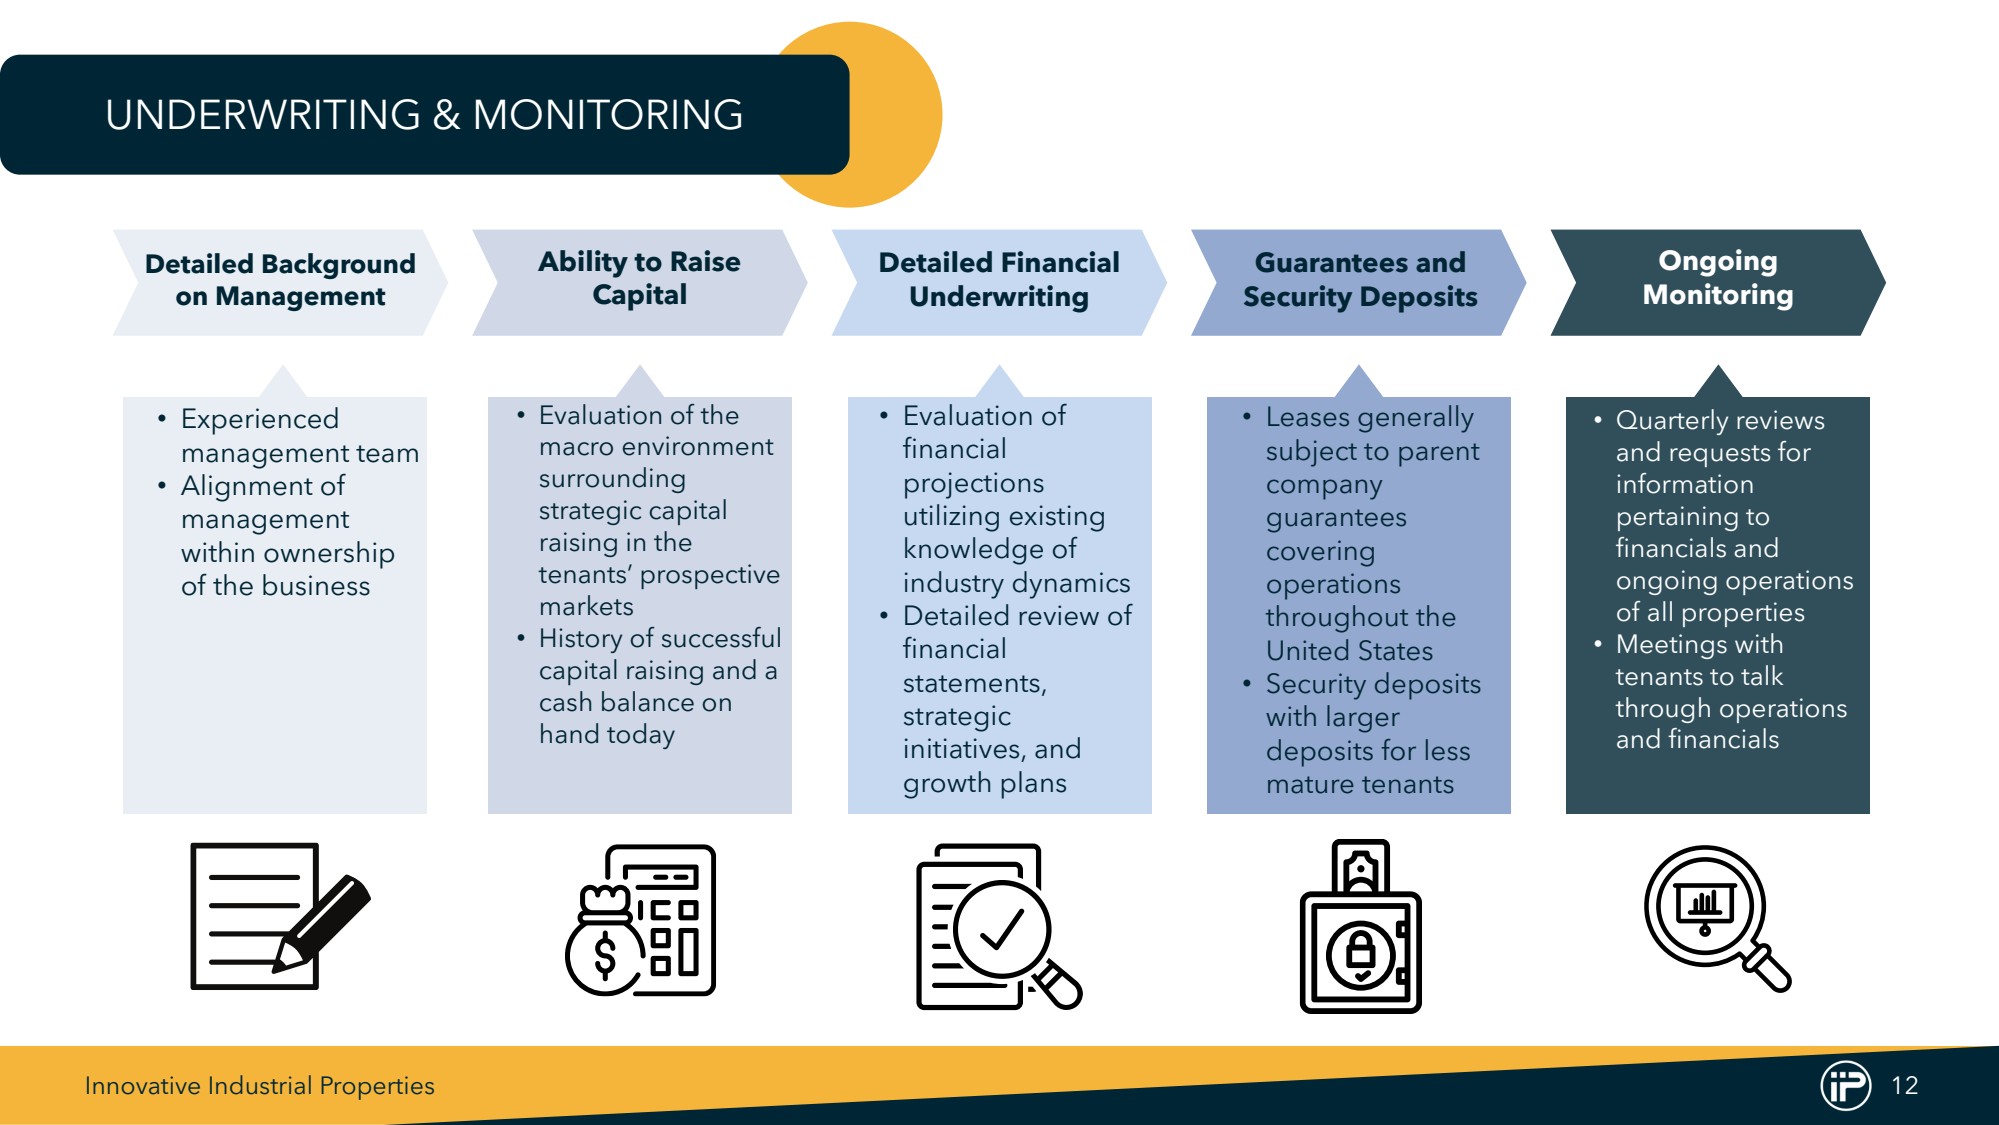
UNDERWRITING & MONITORING
• Evaluation of
financial
projections
utilizing existing
knowledge of
industry dynamics
• Detailed review of
financial
statements,
strategic
initiatives, and
growth plans
• Experienced
management team
• Alignment of
management
within ownership
of the business
Detailed Background
on Management
Ability to Raise
Capital
Detailed Financial
Underwriting
Guarantees and
Security Deposits
Ongoing
Monitoring
• Quarterly reviews
and requests for
information
pertaining to
financials and
ongoing operations
of all properties
• Meetings with
tenants to talk
through operations
and financials
• Evaluation of the
macro environment
surrounding
strategic capital
raising in the
tenants’ prospective
markets
• History of successful
capital raising and a
cash balance on
hand today
• Leases generally
subject to parent
company
guarantees
covering
operations
throughout the
United States
• Security deposits
with larger
deposits for less
mature tenants |

| Innovative Industrial Properties 13
Grow Rooms:
• Mother room – houses the large plants with
genetics desired for the production plants
• Clone room – leaves from the mother plants are
used to propagate new plants
• Veg room – clone room plants are transferred to
the veg room, which may include tiered
benching for efficiency
• Flower room – veg room plants are transferred to
the flower room, which may also include tiering
for enhanced productivity
Flower rooms generally require the following:
• Temperature and humidity maintenance
• Grow lighting
• A growing medium or substrate
• Irrigation and fertigation control systems
• Carbon dioxide
• Mechanical ventilation
Other Key Infrastructure Considerations:
• Enhanced mechanical, electrical, and plumbing
infrastructure (“MEP”)
• Significant ceiling clearance
• Water recycling systems
• Emergency power systems
• On-site energy generation
Note: For illustrative purposes only; building infrastructure specifications can vary significantly from property to property.
INSIDE LOOK: CULTIVATION AND
PROCESSING FACILITY
Mother Room
Flower Room Fertigation Room
Extraction Room
Extraction Room Methods:
• Carbon dioxide extraction
• Ethanol extraction
• Hydrocarbon extraction
• Solventless extraction
Extraction Core Focus:
• Safety
• Workflow
• Scalability |

| Innovative Industrial Properties 14
$30B $35B $39B $44B
$51B
$57B
$62B
$67B
$71B
2022E 2023E 2024E 2025E 2026E 2027E 2028E 2029E 2030E
CANNABIS IS A LARGE
AND GROWING INDUSTRY
$30B
$35B
$40B $44B
$48B
$51B
$54B
$57B $58B
2022E 2023E 2024E 2025E 2026E 2027E 2028E 2029E 2030E
Long-Term Growth Outlook
for Cannabis
$71B
Est. Legal
Cannabis
Sales Growth
by 2030
representing a
11% CAGR(1)
68%
U.S.
Population of
States with an
IIP Presence(2)
+9%
Avg. 5 Yr. Est.
Cannabis
Sales CAGR
for IIP Property
Owned
States(3)
Est. Forecast Sales U.S. Potential Legal Cannabis
(1)
Est. Sales Forecast U.S. Current Legal Cannabis
(4)
(1) 2023 U.S. Cannabis Report, New Frontier Data, based on 9 states demonstrating strong likelihood to legalize adult use cannabis, and 9 states likely to legalize medical use prior to 2030 according to New Frontier Data.
(2) Per 2020 US Census Data.
(3) Per the 2023 MJBiz Factbook, 11th Edition. High-end sales estimates were used.
(4) 2023 U.S. Cannabis Report, New Frontier Data, based on existing states that have adopted adult use and/or medical use cannabis programs as of March 2023. |

| Innovative Industrial Properties 15
EXECUTIVE CHAIRMAN
& CO-FOUNDER
Alan Gold
Executive Chairman & Co-Founder
Co-founder of BioMed Realty Trust (formerly NYSE: BMR);
served as Chairman and CEO from inception of its predecessor
in 1998 through BMR’s sale in 2016
• Owner and operator of high-quality life science real estate
• Previously publicly traded investment grade REIT
Co-founded Alexandria Real Estate Equities (NYSE: ARE) in
1994 and served as President and a director until 1998
• Invests in office buildings and laboratories leased to
life science and technology companies
Executive Chairman of IQHQ, Inc.
• Privately-held life science real estate company with
properties in both the U.S. and U.K.
Alan Gold has experience starting real estate companies focused on nuanced, regulated industries. |

| Innovative Industrial Properties 16
SENIOR MANAGEMENT TEAM
David Smith
• 20+ years of finance and real
estate experience
• Former CFO of Aventine
Property Group, Inc.
CFO and Treasurer
• 35+ years of legal and
regulatory experience
• Previously co-founded Iso
Nano International, LLC
Paul Smithers
President, CEO and Co-Founder
Ben Regin
• 18+ years of real estate and
accounting experience
• Former Senior Associate,
Investments and Asset
Management at BioMed Realty
CIO
Catherine Hastings Ben Regin
• 20+ years of accounting and
real estate experience
• Former VP, Internal Audit of
BioMed Realty
COO
• Former VP, Corporate Legal of
BioMed Realty
• Former attorney at Latham &
Watkins LLP
Brian Wolfe
VP, GC, and Secretary
Andy Bui
• Former Senior Director,
Financial Reporting at BioMed
Realty
VP, Chief Accounting Officer
• 20+ years legal experience
representing real estate
matters
• Former attorney at Foley &
Lardner LLP
VP, Real Estate Counsel
Tracie Hager Kelly Spicher
• 30+ years of experience in
property management
• Former VP, Property
Management at BioMed Realty
VP, Asset Management |
Cover
|
Aug. 04, 2023 |
| Document Information [Line Items] |
|
| Document Type |
8-K
|
| Amendment Flag |
false
|
| Document Period End Date |
Aug. 04, 2023
|
| Entity File Number |
001-37949
|
| Entity Registrant Name |
Innovative Industrial
Properties, Inc.
|
| Entity Central Index Key |
0001677576
|
| Entity Tax Identification Number |
81-2963381
|
| Entity Incorporation, State or Country Code |
MD
|
| Entity Address, Address Line One |
1389 Center
Drive
|
| Entity Address, Address Line Two |
Suite 200
|
| Entity Address, City or Town |
Park City
|
| Entity Address, State or Province |
UT
|
| Entity Address, Postal Zip Code |
84098
|
| City Area Code |
858
|
| Local Phone Number |
997-3332
|
| Written Communications |
false
|
| Soliciting Material |
false
|
| Pre-commencement Tender Offer |
false
|
| Pre-commencement Issuer Tender Offer |
false
|
| Entity Emerging Growth Company |
false
|
| Common Stock [Member] |
|
| Document Information [Line Items] |
|
| Title of 12(b) Security |
Common Stock, par value $0.001 per share
|
| Trading Symbol |
IIPR
|
| Security Exchange Name |
NYSE
|
| Series A Preferred Stock [Member] |
|
| Document Information [Line Items] |
|
| Title of 12(b) Security |
Series A Preferred Stock, par value $0.001 per share
|
| Trading Symbol |
IIPR-PA
|
| Security Exchange Name |
NYSE
|
| X |
- DefinitionBoolean flag that is true when the XBRL content amends previously-filed or accepted submission.
| Name: |
dei_AmendmentFlag |
| Namespace Prefix: |
dei_ |
| Data Type: |
xbrli:booleanItemType |
| Balance Type: |
na |
| Period Type: |
duration |
|
| X |
- DefinitionFor the EDGAR submission types of Form 8-K: the date of the report, the date of the earliest event reported; for the EDGAR submission types of Form N-1A: the filing date; for all other submission types: the end of the reporting or transition period. The format of the date is YYYY-MM-DD.
| Name: |
dei_DocumentPeriodEndDate |
| Namespace Prefix: |
dei_ |
| Data Type: |
xbrli:dateItemType |
| Balance Type: |
na |
| Period Type: |
duration |
|
| X |
- DefinitionThe type of document being provided (such as 10-K, 10-Q, 485BPOS, etc). The document type is limited to the same value as the supporting SEC submission type, or the word 'Other'.
| Name: |
dei_DocumentType |
| Namespace Prefix: |
dei_ |
| Data Type: |
dei:submissionTypeItemType |
| Balance Type: |
na |
| Period Type: |
duration |
|
| X |
- DefinitionAddress Line 1 such as Attn, Building Name, Street Name
| Name: |
dei_EntityAddressAddressLine1 |
| Namespace Prefix: |
dei_ |
| Data Type: |
xbrli:normalizedStringItemType |
| Balance Type: |
na |
| Period Type: |
duration |
|
| X |
- DefinitionAddress Line 2 such as Street or Suite number
| Name: |
dei_EntityAddressAddressLine2 |
| Namespace Prefix: |
dei_ |
| Data Type: |
xbrli:normalizedStringItemType |
| Balance Type: |
na |
| Period Type: |
duration |
|
| X |
- Definition
+ References
+ Details
| Name: |
dei_EntityAddressCityOrTown |
| Namespace Prefix: |
dei_ |
| Data Type: |
xbrli:normalizedStringItemType |
| Balance Type: |
na |
| Period Type: |
duration |
|
| X |
- DefinitionCode for the postal or zip code
| Name: |
dei_EntityAddressPostalZipCode |
| Namespace Prefix: |
dei_ |
| Data Type: |
xbrli:normalizedStringItemType |
| Balance Type: |
na |
| Period Type: |
duration |
|
| X |
- DefinitionName of the state or province.
| Name: |
dei_EntityAddressStateOrProvince |
| Namespace Prefix: |
dei_ |
| Data Type: |
dei:stateOrProvinceItemType |
| Balance Type: |
na |
| Period Type: |
duration |
|
| X |
- DefinitionA unique 10-digit SEC-issued value to identify entities that have filed disclosures with the SEC. It is commonly abbreviated as CIK. Reference 1: http://www.xbrl.org/2003/role/presentationRef
-Publisher SEC
-Name Exchange Act
-Number 240
-Section 12
-Subsection b-2
| Name: |
dei_EntityCentralIndexKey |
| Namespace Prefix: |
dei_ |
| Data Type: |
dei:centralIndexKeyItemType |
| Balance Type: |
na |
| Period Type: |
duration |
|
| X |
- DefinitionIndicate if registrant meets the emerging growth company criteria. Reference 1: http://www.xbrl.org/2003/role/presentationRef
-Publisher SEC
-Name Exchange Act
-Number 240
-Section 12
-Subsection b-2
| Name: |
dei_EntityEmergingGrowthCompany |
| Namespace Prefix: |
dei_ |
| Data Type: |
xbrli:booleanItemType |
| Balance Type: |
na |
| Period Type: |
duration |
|
| X |
- DefinitionCommission file number. The field allows up to 17 characters. The prefix may contain 1-3 digits, the sequence number may contain 1-8 digits, the optional suffix may contain 1-4 characters, and the fields are separated with a hyphen.
| Name: |
dei_EntityFileNumber |
| Namespace Prefix: |
dei_ |
| Data Type: |
dei:fileNumberItemType |
| Balance Type: |
na |
| Period Type: |
duration |
|
| X |
- DefinitionTwo-character EDGAR code representing the state or country of incorporation.
| Name: |
dei_EntityIncorporationStateCountryCode |
| Namespace Prefix: |
dei_ |
| Data Type: |
dei:edgarStateCountryItemType |
| Balance Type: |
na |
| Period Type: |
duration |
|
| X |
- DefinitionThe exact name of the entity filing the report as specified in its charter, which is required by forms filed with the SEC. Reference 1: http://www.xbrl.org/2003/role/presentationRef
-Publisher SEC
-Name Exchange Act
-Number 240
-Section 12
-Subsection b-2
| Name: |
dei_EntityRegistrantName |
| Namespace Prefix: |
dei_ |
| Data Type: |
xbrli:normalizedStringItemType |
| Balance Type: |
na |
| Period Type: |
duration |
|
| X |
- DefinitionThe Tax Identification Number (TIN), also known as an Employer Identification Number (EIN), is a unique 9-digit value assigned by the IRS. Reference 1: http://www.xbrl.org/2003/role/presentationRef
-Publisher SEC
-Name Exchange Act
-Number 240
-Section 12
-Subsection b-2
| Name: |
dei_EntityTaxIdentificationNumber |
| Namespace Prefix: |
dei_ |
| Data Type: |
dei:employerIdItemType |
| Balance Type: |
na |
| Period Type: |
duration |
|
| X |
- DefinitionLocal phone number for entity.
| Name: |
dei_LocalPhoneNumber |
| Namespace Prefix: |
dei_ |
| Data Type: |
xbrli:normalizedStringItemType |
| Balance Type: |
na |
| Period Type: |
duration |
|
| X |
- DefinitionBoolean flag that is true when the Form 8-K filing is intended to satisfy the filing obligation of the registrant as pre-commencement communications pursuant to Rule 13e-4(c) under the Exchange Act. Reference 1: http://www.xbrl.org/2003/role/presentationRef
-Publisher SEC
-Name Exchange Act
-Number 240
-Section 13e
-Subsection 4c
| Name: |
dei_PreCommencementIssuerTenderOffer |
| Namespace Prefix: |
dei_ |
| Data Type: |
xbrli:booleanItemType |
| Balance Type: |
na |
| Period Type: |
duration |
|
| X |
- DefinitionBoolean flag that is true when the Form 8-K filing is intended to satisfy the filing obligation of the registrant as pre-commencement communications pursuant to Rule 14d-2(b) under the Exchange Act. Reference 1: http://www.xbrl.org/2003/role/presentationRef
-Publisher SEC
-Name Exchange Act
-Number 240
-Section 14d
-Subsection 2b
| Name: |
dei_PreCommencementTenderOffer |
| Namespace Prefix: |
dei_ |
| Data Type: |
xbrli:booleanItemType |
| Balance Type: |
na |
| Period Type: |
duration |
|
| X |
- DefinitionTitle of a 12(b) registered security. Reference 1: http://www.xbrl.org/2003/role/presentationRef
-Publisher SEC
-Name Exchange Act
-Number 240
-Section 12
-Subsection b
| Name: |
dei_Security12bTitle |
| Namespace Prefix: |
dei_ |
| Data Type: |
dei:securityTitleItemType |
| Balance Type: |
na |
| Period Type: |
duration |
|
| X |
- DefinitionName of the Exchange on which a security is registered. Reference 1: http://www.xbrl.org/2003/role/presentationRef
-Publisher SEC
-Name Exchange Act
-Number 240
-Section 12
-Subsection d1-1
| Name: |
dei_SecurityExchangeName |
| Namespace Prefix: |
dei_ |
| Data Type: |
dei:edgarExchangeCodeItemType |
| Balance Type: |
na |
| Period Type: |
duration |
|
| X |
- DefinitionBoolean flag that is true when the Form 8-K filing is intended to satisfy the filing obligation of the registrant as soliciting material pursuant to Rule 14a-12 under the Exchange Act. Reference 1: http://www.xbrl.org/2003/role/presentationRef
-Publisher SEC
-Name Exchange Act
-Section 14a
-Number 240
-Subsection 12
| Name: |
dei_SolicitingMaterial |
| Namespace Prefix: |
dei_ |
| Data Type: |
xbrli:booleanItemType |
| Balance Type: |
na |
| Period Type: |
duration |
|
| X |
- DefinitionTrading symbol of an instrument as listed on an exchange.
| Name: |
dei_TradingSymbol |
| Namespace Prefix: |
dei_ |
| Data Type: |
dei:tradingSymbolItemType |
| Balance Type: |
na |
| Period Type: |
duration |
|
| X |
- DefinitionBoolean flag that is true when the Form 8-K filing is intended to satisfy the filing obligation of the registrant as written communications pursuant to Rule 425 under the Securities Act. Reference 1: http://www.xbrl.org/2003/role/presentationRef
-Publisher SEC
-Name Securities Act
-Number 230
-Section 425
| Name: |
dei_WrittenCommunications |
| Namespace Prefix: |
dei_ |
| Data Type: |
xbrli:booleanItemType |
| Balance Type: |
na |
| Period Type: |
duration |
|
| X |
- Details
| Name: |
us-gaap_StatementClassOfStockAxis=us-gaap_CommonStockMember |
| Namespace Prefix: |
|
| Data Type: |
na |
| Balance Type: |
|
| Period Type: |
|
|
| X |
- Details
| Name: |
us-gaap_StatementClassOfStockAxis=us-gaap_SeriesAPreferredStockMember |
| Namespace Prefix: |
|
| Data Type: |
na |
| Balance Type: |
|
| Period Type: |
|
|
Innovative Industrial Pr... (NYSE:IIPR)
Gráfica de Acción Histórica
De Abr 2024 a May 2024

Innovative Industrial Pr... (NYSE:IIPR)
Gráfica de Acción Histórica
De May 2023 a May 2024
