Cardano (ADA) Falls To $0.44, Is The Uptrend Invalidated?
26 Julio 2022 - 8:00PM
NEWSBTC
Cardano displayed bearishness on its chart at the time of writing.
Over the last 24 hours Cardano fell by 7% on its chart. Broader
market also displayed bearish spell over the last few days. Bitcoin
was bordering the $20,000 mark and the altcoins followed suit. ADA
had over the past few days crossed past the $0.55 resistance mark
but it failed to sustain itself above that price mark. The bears
have exerted pressure in the market and the technical outlook has
also pictured bearishness on the chart. Bullish strength has been
on a halt as market movers have significantly depreciated on their
respective charts. At the moment, Cardano has been trading close to
the support level of $0.42. Buyers also exited the market.
Continued selling pressure will drag the coin below the $0.42 level
to the $0.33 price mark. A push at the present price level could
cause ADA to move up slightly on the chart but that could be termed
as a brief recovery. Cardano Price Analysis: Four Hour Chart ADA
was trading at $0.44 on the four hour chart. The altcoin had
consistently formed lower lows on the chart depicting bearishness.
Overhead resistance for the coin stood at $0.51 and the local
support level at $0.42. After ADA touched at $0.52 it failed to
break the resistance mark again. Over the last week, ADA
encountered resistance at the same price mark. If buying strength
returns, the coin could revisit the $0.48 level, however, the bears
will remain strong until Cardano trades above the $0.52 price mark
for a substantial period of time. A fall from the current price
mark could make ADA touch the lows of $0.33 over the upcoming
trading sessions. Technical Analysis ADA’s drop in value was
followed by a sharp decline in the buying pressure. Selling
strength mounted which has forced the coin to retreat further on
the chart. The Relative Strength Index was below the half-line and
near the oversold zone. RSI however, bounced off the oversold
territory, it is too soon to say if over the upcoming sessions the
coin could recover on its chart. The price of Cardano was below the
20-SMA line which indicated that sellers were responsible in
driving the price momentum in the market. Related Reading | Bitcoin
Bounces Off Historic “Mayer Multiple” Bottom Zone The altcoin
reflected fall in buying strength on the four hour chart. Moving
Average Convergence Divergence portrayed price momentum and
reversals in the same. MACD underwent a bearish crossover and
formed red histograms which were an indication of sell signal for
ADA. In accordance with buyers exiting the market, Chaikin Money
Flow that pictures capital inflows and oubears the flows depicted
increased capital outflows in the market. To defeat the bears the
coin has to push above the $0.52 mark and consistently display
buying strength. Suggested Reading | Cardano Joins The Red Screen –
How ADA Fell To $0.45 Over Last 24 Hours Featured image from
UnSplash, chart from TradingView.com
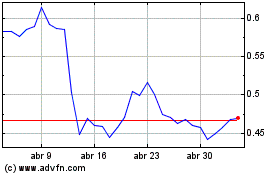
Cardano (COIN:ADAUSD)
Gráfica de Acción Histórica
De Mar 2024 a Abr 2024

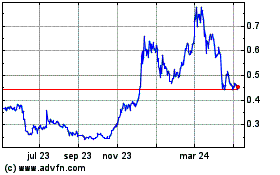
Cardano (COIN:ADAUSD)
Gráfica de Acción Histórica
De Abr 2023 a Abr 2024
