Nordic Stocks Dropped Friday; Peab Series B Took Biggest Hit
19 Enero 2024 - 12:01PM
Noticias Dow Jones
Stocks in the Nordic region dropped Friday, with the OMX Nordic
40 Index declining 0.5%.
Peab AB Series B posted the largest decline during the session,
tumbling 13.8%, followed by Ratos AB Series B shares, which tumbled
10.4%. Shares of Ratos AB Series A dropped 8.0%.
Hoegh Autoliners ASA was the biggest leader, gaining 4.9%, and
Wallenius Wilhelmsen ASA increased 4.5%. Marel hf. rounded out the
top three leaders on Friday, with shares gaining 4.1%.
In Denmark, the OMX Copenhagen 20 Index fell 0.3%, and the OMX
Helsinki 25 Index, which tracks Finland's most-traded stocks,
declined 1.3%.
Stocks on Sweden's OMX Stockholm 30 Index dropped 0.5%, while
Norway's Oslo Exchange Benchmark Index_GI gained 0.1%. Shares in
Iceland increased, with the OMX Iceland All-Share PI Equity Index
adding 1.2%.
Elsewhere in Europe, indexes were mixed, with the STOXX Europe
600 Index declining 0.3% and the FTSE 100 Index flat from the
previous close.
Stock indexes in Asia were mixed, with Japan's NIKKEI 225 Index
up 1.4% and China's Shanghai Composite Index down 0.5%.
In commodities news, Brent crude oil futures were down 0.8%,
while gold futures were up 0.3%. Bitcoin slipped 0.9% to
$40,717.
On the currency front, the WSJ Dollar Index declined 0.1% to
97.91.
Against the euro, the Icelandic krona was up 0.4%, the Norwegian
krone was up 0.2%, the Swedish krona was flat, the Danish krone was
flat, and the U.S. dollar was down 0.1%.
Against the U.S. dollar, the Icelandic krona was up 0.5%, the
Norwegian krone was up 0.3%, the euro was up 0.1%, the Swedish
krona was up 0.1%, and the Danish krone was up 0.1%.
-This article was automatically generated by MarketWatch using
technology from Automated Insights. Data source: Dow Jones Market
Data, FactSet.
Write to Barcelona Editors at barcelonaeditors@dowjones.com
(END) Dow Jones Newswires
January 19, 2024 12:46 ET (17:46 GMT)
Copyright (c) 2024 Dow Jones & Company, Inc.
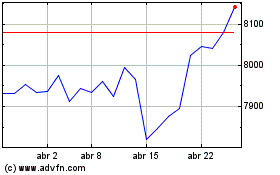
FTSE 100
Gráfica de índice
De Oct 2024 a Nov 2024

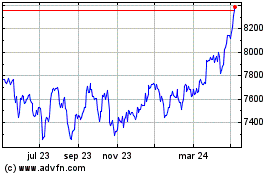
FTSE 100
Gráfica de índice
De Nov 2023 a Nov 2024


