Form NPORT-P - Monthly Portfolio Investments Report on Form N-PORT (Public)
29 Agosto 2023 - 10:44AM
Edgar (US Regulatory)
Schedule of Investments(a)
Invesco QQQ TrustSM, Series 1 (QQQ)
June 30, 2023
(Unaudited)
|
| Shares
|
| Value
|
| Common Stocks & Other Equity Interests-99.98%
|
| Automobiles-4.33%
|
Lucid Group, Inc.(b)
|
| 24,567,517
|
| $169,270,192
|
Tesla, Inc.(b)
|
| 32,723,005
|
| 8,565,901,019
|
|
|
|
|
| 8,735,171,211
|
| Beverages-2.39%
|
Keurig Dr Pepper, Inc.
|
| 18,801,922
|
| 587,936,101
|
Monster Beverage Corp.(b)
|
| 14,019,422
|
| 805,275,600
|
PepsiCo, Inc.
|
| 18,452,561
|
| 3,417,783,348
|
|
|
|
|
| 4,810,995,049
|
| Biotechnology-3.37%
|
Amgen, Inc.
|
| 7,156,612
|
| 1,588,910,996
|
Biogen, Inc.(b)
|
| 1,938,668
|
| 552,229,580
|
Gilead Sciences, Inc.
|
| 16,706,701
|
| 1,287,585,446
|
Moderna, Inc.(b)
|
| 5,105,757
|
| 620,349,475
|
Regeneron Pharmaceuticals, Inc.(b)
|
| 1,445,038
|
| 1,038,317,605
|
Seagen, Inc.(b)
|
| 2,511,272
|
| 483,319,409
|
Vertex Pharmaceuticals, Inc.(b)
|
| 3,449,491
|
| 1,213,910,378
|
|
|
|
|
| 6,784,622,889
|
| Broadline Retail-7.79%
|
Amazon.com, Inc.(b)
|
| 105,931,273
|
| 13,809,200,748
|
eBay, Inc.
|
| 7,162,085
|
| 320,073,579
|
JD.com, Inc., ADR (China)
|
| 6,080,937
|
| 207,542,380
|
MercadoLibre, Inc. (Brazil)(b)
|
| 672,465
|
| 796,602,039
|
PDD Holdings, Inc., ADR (China)(b)
|
| 8,178,383
|
| 565,453,400
|
|
|
|
|
| 15,698,872,146
|
| Commercial Services & Supplies-0.63%
|
Cintas Corp.
|
| 1,362,190
|
| 677,117,405
|
Copart, Inc.(b)
|
| 6,394,754
|
| 583,265,513
|
|
|
|
|
| 1,260,382,918
|
| Communications Equipment-1.40%
|
Cisco Systems, Inc.
|
| 54,580,335
|
| 2,823,986,533
|
| Consumer Staples Distribution & Retail-1.96%
|
Costco Wholesale Corp.
|
| 5,939,998
|
| 3,197,976,123
|
Dollar Tree, Inc.(b)
|
| 2,951,826
|
| 423,587,031
|
Walgreens Boots Alliance, Inc.
|
| 11,555,968
|
| 329,229,529
|
|
|
|
|
| 3,950,792,683
|
| Electric Utilities-0.98%
|
American Electric Power Co., Inc.
|
| 6,894,951
|
| 580,554,874
|
Constellation Energy Corp.
|
| 4,345,095
|
| 397,793,447
|
Exelon Corp.
|
| 13,321,018
|
| 542,698,274
|
Xcel Energy, Inc.
|
| 7,371,300
|
| 458,273,721
|
|
|
|
|
| 1,979,320,316
|
| Energy Equipment & Services-0.21%
|
Baker Hughes Co., Class A
|
| 13,559,333
|
| 428,610,516
|
| Entertainment-2.18%
|
Activision Blizzard, Inc.(b)
|
| 10,529,573
|
| 887,643,004
|
Electronic Arts, Inc.
|
| 3,652,703
|
| 473,755,579
|
Netflix, Inc.(b)
|
| 5,954,013
|
| 2,622,683,186
|
Warner Bros Discovery, Inc.(b)
|
| 32,628,513
|
| 409,161,553
|
|
|
|
|
| 4,393,243,322
|
| Financial Services-0.49%
|
PayPal Holdings, Inc.(b)
|
| 14,943,624
|
| 997,188,030
|
| Food Products-0.95%
|
Kraft Heinz Co. (The)
|
| 16,437,368
|
| 583,526,564
|
Mondelez International, Inc., Class A
|
| 18,240,261
|
| 1,330,444,637
|
|
|
|
|
| 1,913,971,201
|
|
| Shares
|
| Value
|
| Ground Transportation-0.73%
|
CSX Corp.
|
| 27,230,278
|
| $928,552,480
|
Old Dominion Freight Line, Inc.
|
| 1,468,657
|
| 543,035,926
|
|
|
|
|
| 1,471,588,406
|
| Health Care Equipment & Supplies-1.83%
|
Align Technology, Inc.(b)
|
| 1,024,867
|
| 362,433,966
|
DexCom, Inc.(b)
|
| 5,191,826
|
| 667,201,559
|
GE HealthCare Technologies, Inc.(b)
|
| 6,089,874
|
| 494,741,364
|
IDEXX Laboratories, Inc.(b)
|
| 1,111,765
|
| 558,361,736
|
Intuitive Surgical, Inc.(b)
|
| 4,693,078
|
| 1,604,751,091
|
|
|
|
|
| 3,687,489,716
|
| Hotels, Restaurants & Leisure-2.14%
|
Airbnb, Inc., Class A(b)
|
| 5,523,707
|
| 707,918,289
|
Booking Holdings, Inc.(b)
|
| 494,706
|
| 1,335,869,453
|
Marriott International, Inc., Class A
|
| 4,081,701
|
| 749,767,657
|
Starbucks Corp.
|
| 15,354,541
|
| 1,521,020,831
|
|
|
|
|
| 4,314,576,230
|
| Industrial Conglomerates-0.92%
|
Honeywell International, Inc.
|
| 8,915,838
|
| 1,850,036,385
|
| Interactive Media & Services-11.57%
|
Alphabet, Inc., Class A(b)
|
| 62,516,547
|
| 7,483,230,676
|
Alphabet, Inc., Class C(b)
|
| 60,645,067
|
| 7,336,233,755
|
Meta Platforms, Inc., Class A(b)
|
| 29,629,011
|
| 8,502,933,577
|
|
|
|
|
| 23,322,398,008
|
| IT Services-0.22%
|
Cognizant Technology Solutions Corp., Class A
|
| 6,796,996
|
| 443,707,899
|
| Life Sciences Tools & Services-0.20%
|
Illumina, Inc.(b)
|
| 2,117,599
|
| 397,028,637
|
| Machinery-0.29%
|
PACCAR, Inc.
|
| 6,999,245
|
| 585,486,844
|
| Media-1.63%
|
Charter Communications, Inc., Class A(b)
|
| 2,016,801
|
| 740,912,183
|
Comcast Corp., Class A
|
| 55,709,738
|
| 2,314,739,614
|
Sirius XM Holdings, Inc.
|
| 51,812,348
|
| 234,709,937
|
|
|
|
|
| 3,290,361,734
|
| Oil, Gas & Consumable Fuels-0.16%
|
Diamondback Energy, Inc.
|
| 2,425,416
|
| 318,602,646
|
| Pharmaceuticals-0.28%
|
AstraZeneca PLC, ADR (United Kingdom)
|
| 7,927,764
|
| 567,390,069
|
| Professional Services-1.33%
|
Automatic Data Processing, Inc.
|
| 5,533,291
|
| 1,216,162,029
|
CoStar Group, Inc.(b)
|
| 5,471,962
|
| 487,004,618
|
Paychex, Inc.
|
| 4,828,645
|
| 540,180,516
|
Verisk Analytics, Inc.
|
| 1,939,325
|
| 438,345,630
|
|
|
|
|
| 2,681,692,793
|
| Semiconductors & Semiconductor Equipment-18.49%
|
Advanced Micro Devices, Inc.(b)
|
| 21,568,706
|
| 2,456,891,300
|
Analog Devices, Inc.
|
| 6,715,819
|
| 1,308,308,699
|
Applied Materials, Inc.
|
| 11,247,331
|
| 1,625,689,223
|
ASML Holding N.V., New York Shares (Netherlands)
|
| 1,175,537
|
| 851,970,441
|
Broadcom, Inc.
|
| 5,584,108
|
| 4,843,822,802
|
Enphase Energy, Inc.(b)
|
| 1,835,409
|
| 307,394,299
|
GLOBALFOUNDRIES, Inc.(b)
|
| 7,336,448
|
| 473,787,812
|
Intel Corp.
|
| 55,865,348
|
| 1,868,137,237
|
KLA Corp.
|
| 1,837,573
|
| 891,259,656
|
See accompanying notes which are an
integral part of this schedule.
Invesco QQQ TrustSM, Series 1 (QQQ)—(continued)
June 30, 2023
(Unaudited)
|
| Shares
|
| Value
|
| Semiconductors & Semiconductor Equipment-(continued)
|
Lam Research Corp.
|
| 1,799,356
|
| $1,156,733,998
|
Marvell Technology, Inc.
|
| 11,518,588
|
| 688,581,191
|
Microchip Technology, Inc.
|
| 7,304,696
|
| 654,427,715
|
Micron Technology, Inc.
|
| 14,657,983
|
| 925,065,307
|
NVIDIA Corp.
|
| 33,082,605
|
| 13,994,603,567
|
NXP Semiconductors N.V. (China)
|
| 3,478,992
|
| 712,080,083
|
ON Semiconductor Corp.(b)
|
| 5,784,431
|
| 547,091,484
|
QUALCOMM, Inc.
|
| 14,920,662
|
| 1,776,155,605
|
Texas Instruments, Inc.
|
| 12,156,910
|
| 2,188,486,938
|
|
|
|
|
| 37,270,487,357
|
| Software-18.66%
|
Adobe, Inc.(b)
|
| 6,143,752
|
| 3,004,233,291
|
ANSYS, Inc.(b)
|
| 1,160,593
|
| 383,309,050
|
Atlassian Corp., Class A(b)
|
| 2,034,277
|
| 341,372,023
|
Autodesk, Inc.(b)
|
| 2,868,359
|
| 586,894,935
|
Cadence Design Systems, Inc.(b)
|
| 3,652,325
|
| 856,543,259
|
Crowdstrike Holdings, Inc., Class A(b)
|
| 3,001,751
|
| 440,867,169
|
Datadog, Inc., Class A(b)
|
| 3,968,216
|
| 390,393,090
|
Fortinet, Inc.(b)
|
| 10,516,672
|
| 794,955,236
|
Intuit, Inc.
|
| 3,751,118
|
| 1,718,724,756
|
Microsoft Corp.
|
| 76,447,494
|
| 26,033,429,607
|
Palo Alto Networks, Inc.(b)
|
| 4,096,603
|
| 1,046,723,033
|
Synopsys, Inc.(b)
|
| 2,038,019
|
| 887,373,853
|
Workday, Inc., Class A(b)
|
| 2,759,164
|
| 623,267,556
|
|
| Shares
|
| Value
|
| Software-(continued)
|
Zoom Video Communications, Inc., Class A(b)
|
| 3,360,225
|
| $228,092,073
|
Zscaler, Inc.(b)
|
| 1,943,749
|
| 284,370,479
|
|
|
|
|
| 37,620,549,410
|
| Specialty Retail-0.64%
|
O’Reilly Automotive, Inc.(b)
|
| 815,402
|
| 778,953,530
|
Ross Stores, Inc.
|
| 4,581,276
|
| 513,698,478
|
|
|
|
|
| 1,292,652,008
|
| Technology Hardware, Storage & Peripherals-12.57%
|
Apple, Inc.
|
| 130,609,030
|
| 25,334,233,549
|
| Textiles, Apparel & Luxury Goods-0.31%
|
lululemon athletica, inc.(b)
|
| 1,636,805
|
| 619,530,693
|
| Trading Companies & Distributors-0.22%
|
Fastenal Co.
|
| 7,648,465
|
| 451,182,950
|
| Wireless Telecommunication Services-1.11%
|
T-Mobile US, Inc.(b)
|
| 16,071,125
|
| 2,232,279,262
|
TOTAL INVESTMENTS IN SECURITIES-99.98%
(Cost $216,239,724,860)
|
| 201,528,431,410
|
OTHER ASSETS LESS LIABILITIES-0.02%
|
| 31,722,329
|
NET ASSETS-100.00%
|
| $201,560,153,739
|
| Investment Abbreviations:
|
| ADR
| -American Depositary Receipt
|
| Notes to Schedule of Investments:
|
| (a)
| Industry and/or sector classifications used in this report are generally according to the Global Industry Classification Standard, which was developed by and is the exclusive property and a service mark
of MSCI Inc. and Standard & Poor’s.
|
| (b)
| Non-income producing security.
|
The valuation policy and
a listing of other significant accounting policies are available in the most recent shareholder report.
See accompanying notes which are an integral part
of this schedule.
Notes to Quarterly Schedule of Portfolio Holdings
June 30, 2023
(Unaudited)
NOTE 1—Additional Valuation
Information
Generally Accepted Accounting
Principles ("GAAP") defines fair value as the price that would be received to sell an asset or paid to transfer a liability in an orderly transaction between market participants at the measurement date, under current
market conditions. GAAP establishes a hierarchy that prioritizes the inputs to valuation methods, giving the highest priority to readily available unadjusted quoted prices in an active market for identical assets
(Level 1) and the lowest priority to significant unobservable inputs (Level 3), generally when market prices are not readily available. Based on the valuation inputs, the securities or other investments are tiered
into one of three levels. Changes in valuation methods may result in transfers in or out of an investment’s assigned level:
Level 1 – Prices are
determined using quoted prices in an active market for identical assets.
Level 2 – Prices are determined using other significant observable inputs. Observable inputs are inputs that other market participants may use in pricing a security. These may include
quoted prices for similar securities, interest rates, prepayment speeds, credit risk, yield curves, loss severities, default rates, discount rates, volatilities and others.
Level 3 – Prices are determined using significant unobservable inputs. In situations where quoted prices or observable inputs are unavailable (for example, when there is little or no market
activity for an investment at the end of the period), unobservable inputs may be used. Unobservable inputs reflect Invesco Capital Management LLC’s assumptions about the factors market participants would use in
determining fair value of the securities or instruments and would be based on the best available information.
As of June 30, 2023, all of the
securities in the Trust were valued based on Level 1 inputs (see the Schedule of Investments for security categories). The level assigned to the securities valuations may not be an indication of the risk or liquidity
associated with investing in those securities. Because of the inherent uncertainties of valuation, the values reflected in the financial statements may materially differ from the value received upon actual sale of
those investments.
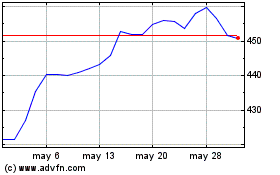
Invesco QQQ Trust Series 1 (NASDAQ:QQQ)
Gráfica de Acción Histórica
De Nov 2024 a Dic 2024

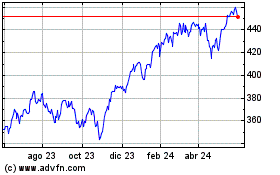
Invesco QQQ Trust Series 1 (NASDAQ:QQQ)
Gráfica de Acción Histórica
De Dic 2023 a Dic 2024
