UNITED STATES
SECURITIES AND EXCHANGE
COMMISSION
Washington, D.C.
20549
FORM 6-K
REPORT OF FOREIGN
ISSUER
PURSUANT TO RULE 13a-16 OR 15d-16 UNDER
SECURITIES EXCHANGE
ACT OF 1934
For the month
of November 08, 2023
(Commission File
No. 001-34429),
PAMPA ENERGIA S.A.
(PAMPA ENERGY INC.)
Argentina
(Jurisdiction of
incorporation or organization)
Maipú 1
C1084ABA
City of Buenos Aires
Argentina
(Address of principal
executive offices)
(Indicate by check
mark whether the registrant files or will file annual reports under cover of Form 20-F or Form 40-F.)
Form 20-F ___X___ Form 40-F ______
(Indicate
by check mark whether the registrant by furnishing the
information contained in this form is also thereby furnishing the
information to the Commission pursuant to Rule 12g3-2(b) under
the Securities Exchange Act of 1934.)
Yes ______ No ___X___
(If "Yes"
is marked, indicate below the file number assigned to the
registrant in connection with Rule 12g3-2(b): 82- .)
This Form 6-K
for Pampa Energía S.A. (“Pampa” or the “Company”) contains:
Exhibit
1: Pampa Energía, an independent company with active participation in Argentina’s electricity and gas value chain, announces the results for the nine-month period and quarter ended on September 30, 2023.
SIGNATURE
Pursuant to the requirements of the Securities
Exchange Act of 1934, the registrant has duly caused this report to be signed on its behalf by the undersigned, thereunto duly
authorized.
Date: November 08, 2023
| Pampa Energía S.A. |
| |
|
|
| |
|
|
| By: |
/s/ Gustavo Mariani
|
|
| |
Name: Gustavo Mariani
Title: Chief Executive Officer |
|
FORWARD-LOOKING
STATEMENTS
This press release may contain
forward-looking statements. These statements are statements that are not historical facts, and are based on management's current
view and estimates offuture economic circumstances, industry conditions, company performance and financial results. The words "anticipates",
"believes", "estimates", "expects", "plans" and similar expressions, as they relate to
the company, are intended to identify forward-looking statements. Statements regarding the declaration or payment of dividends,
the implementation of principal operating and financing strategies and capital expenditure plans, the direction of future operations
and the factors or trends affecting financial condition, liquidity or results of operations are examples of forward-looking statements.
Such statements reflect the current views of management and are subject to a number of risks and uncertainties. There is no guarantee
that the expected events, trends or results will a ctually occur. The statements are based on many assumptions and factors, including
general economic and market conditions, industry conditions, and operating factors. Any changes in such assumptions or factors
could cause actual results to differ materially from current expectations.

|
Pampa Energía, an independent
company with active participation in Argentina’s electricity and gas value chain, announces the results for the nine-month period
and quarter ended on September 30, 2023.
|
Buenos Aires, November 8, 2023
|
Stock information

Share capital net of repurchases and reductions
as of November 7, 2023
1,363.5 million common shares/
54.5 million ADS
Market capitalization
AR$1,718 billion/
US$2,016 million
Information about the videoconference
Date and time: Thursday
Nov, 9
10 AM Eastern Standard Time
12 PM Buenos Aires Time
Access link: bit.ly/Pampa3Q2023VC
For further information about Pampa
·
Email:
investor@pampaenergia.com
·
Website for investors:
ri.pampaenergia.com
·
Argentina’s Securities and Exchange Commission
www.argentina.gob.ar/cnv
·
Securities and Exchange Commission:
sec.gov |
|
Basis of presentation
Pampa’s financial information
adopts US$ as functional currency, converted into AR$ at transactional FX. However, for our affiliates Transener and TGS, their figures
are adjusted for inflation as of September 30, 2023, and then translated into US$ at the period’s closing FX. The reported figures
in US$ from previous periods remain unchanged.
Q3 23 main results1
7% year-on-year
sales decrease, recording US$474 million2 in Q3 23, explained by a drop in prices
and sales of petrochemicals and oil, and the impact of the AR$ devaluation in legacy energy, offset by higher gas sales and renewable
PPAs.
Operating
performance highlighted by natural gas and CTEB’s CCGT:
|
| |
|
|
|
|
| |
Pampa's main operational KPIs |
Q3 23 |
Q3 22 |
Variation |
| |
Power |
Generation (GWh) |
4,985 |
3,767 |
+32% |
| |
|
Gross margin (US$/MWh) |
23.1 |
24.2 |
-5% |
| |
|
|
|
|
|
| |
Oil and gas |
Production (k boe/day) |
80.4 |
68.5 |
+17% |
| |
|
Gas over total production |
94% |
92% |
+2% |
| |
|
Average gas price (US$/MBTU) |
4.7 |
4.8 |
-3% |
| |
|
Average oil price (US$/bbl) |
63.1 |
70.2 |
-10% |
| |
|
|
|
|
|
| |
Petrochemicals |
Volume sold (k ton) |
102 |
120 |
-14% |
| |
|
Average price (US$/ton) |
1,283 |
1,496 |
-14% |
| |
|
|
|
|
|
| |
Adjusted EBITDA3
reached US$244 million, similar to Q3 22, explained by reductions of 72% in holding and others,
16% in petrochemicals, offset by increases of 12% in oil and gas, and 2% in power generation.
The profit attributable
to the Company’s shareholders decreased by 15%, reaching US$152 million, mainly explained
by increased financial interests of AR$-debt and higher income tax charges, partially offset by gains from holding financial securities.
Net debt continued decreasing,
to US$677 million, resulting in a net leverage ratio of 1.0x.
|
1 The information
is based on FS prepared according to IFRS in force in Argentina.
2 It does not include
sales from the affiliates CTBSA, Transener and TGS, which at our ownership is US$90 million. Under IFRS, affiliates are not consolidated
in Pampa, shown as ‘Results for participation in joint businesses and associates’.
3
Consolidated adjusted EBITDA represents the results before financial results, income tax, depreciations and amortizations, extraordinary
and non-cash income and expense, equity income and other adjustments, and includes affiliates’ EBITDA at our ownership. For further
information, see section 3.1 of this Earnings release.
| | | Pampa Energía ● Earnings release Q3 23 ● 1 |
Table of contents
| | | Pampa Energía ● Earnings release Q3 23 ● 2 |
New record of peak gas
production
The first
tranche of GPNK was commissioned on August 3, 2023, operated by TGS, with a length of 573 km and a transportation capacity of 11 million
m3 per day. This infrastructure project is a significant milestone for Argentina, aiming to relieve bottlenecks in the main
gas pipelines and reduce reliance on imports and liquid fuels.
In line with
our production commitment granted under Plan Gas.Ar round 4.2, on August 31, 2023, we achieved a new all-time-high production record of
16.4 million m3 per day, representing a remarkable 44% increase compared to the 2022 record. El Mangrullo contributed 58% of
this production, and 26% came from Sierra Chata, both among the main gas-producing blocks in the Neuquina Basin.
Closing of the asset
swap with Total Austral and the granting of the CENCH
On August
16, 2023, we executed the asset swap, making Pampa the sole owner of Rincón de Aranda. In return, Pampa transferred to Total Austral
S.A. (Argentine Branch) its 100% equity stake in Greenwind, which solely owns PEMC.
Moreover,
on August 28, 2023, the Province of Neuquén granted a 35-year unconventional exploitation license (Executive Order No. 1,435/2023).
Pampa plans the development of a pilot program, which involves the completion of 1 drilled well, as well as drilling and completing 2
pads (8 wells) and constructing a processing facility, an oil pipeline and other surface facilities, totaling this initial stage an estimated
investment of US$161 million. First oil is projected for 2025, reaching the plateau of 15 to 20 kbbl per day by 2027-2028.
With this
swap’s closing, Pampa aims to diversify its energy production in a shale oil block with significant upside potential and reinforces
its commitment to developing Vaca Muerta’s unconventional reserves.
A new round of Plan
Gas.Ar
Aiming to
boost production from mature basins, on September 27, 2023, round 5.2 was awarded under SE Res. No. 799/2023. Among the awarded blocks,
Aguaragüe estimates to reach an incremental volume of over 400 thousand m3 per day from October 2023 to December 2028
at a US$9.80 per MBTU price until and including the year 2026, and the remaining period at US$6 per MBTU. Pampa holds a 15% stake in this
gas field.
Foreign currency
scheme access for hydrocarbon exports
On October
23, 2023, Executive Order No. 549/2023 was enacted, allowing oil and gas producers to settle 30% of their exports at the CCL FX and the
remaining 70% at the official FX. Access to the scheme will be available for exports until November 17, 2023.
| | | Pampa Energía ● Earnings release Q3 23 ● 3 |
| 1.2 | Power generation segment |
Tender to install thermal
power capacity
On September
26, 2023, the SE opened the bids for installing 3,000 MW of thermal power capacity to the national power grid. 66 projects were submitted
for a total potential capacity of 7,112 MW.
Pampa tendered
a 300 MW project in CTGEBA, and CTEB submitted a bid for 11 MW through a CCGT expansion. Both projects qualified in the technical evaluation
stage. As of today, the award of the projects is still pending.
Updates for the legacy
or spot pricing scheme
In September
and October 2023, the SE raised the remuneration in AR$ for spot energy through increases of 23% and 28%, applicable from September and
November 2023, respectively.
Commissioning of
the midstream business’ gathering gas pipeline
On July 27,
2023, TGS commissioned a 32 km extension for the gathering gas pipeline’s north tranche, passing through Los Toldos I Sur –
El Trapial blocks from the Vaca Muerta formation. As a result, the gathering gas pipeline reached a total length of 182 km, with a transportation
capacity of 60 million m3 per day.
Moreover,
two conditioning plants with a capacity of 6.6 million m3 per day each are expected to be commissioned by the third quarter
of 2024, with a total estimated investment of US$300 million.
This expansion
is essential for developing the midstream business, which aims to transport gas from the Neuquina Basin to the main gas pipeline, recently
enhanced by the commissioning of the GPNK.
License extension
request
On September
8, 2023, TGS submitted a request to ENARGAS for a 10-year extension of the license, specified in its concession contract for the natural
gas transportation service. As of today, the process is ongoing, and TGS has not received a formal response from ENARGAS regarding the
request.
| 1.4 | Transener’s tariff
updates |
On
September 8, 2023, Transener and Transba’s tariff schemes increased by 20.9% and 20.8%, respectively, effective from August
2023 (ENRE Res. No. 661/2023 and 660/2023). Additionally, on November 1, 2023, further updates of 37.3% and 38.4% for Transener and
Transba were enacted, respectively, applicable from November 2023 (ENRE Res. No. 780/2023 and 781/2023).
On September
12, 2023, the Board accepted the resignation of Dario Epstein as an independent member.
| | | Pampa Energía ● Earnings release Q3 23 ● 4 |
| 2.1 | Consolidated balance sheet |
| Figures in million |
|
As of 09.30.2023 |
|
As of 12.31.2022 |
| |
AR$ |
US$ FX 349.95 |
|
AR$ |
US$ FX 177.16 |
| ASSETS |
|
|
|
|
|
|
| Property, plant and equipment |
|
846,115 |
2,418 |
|
383,464 |
2,165 |
| Intangible assets |
|
34,072 |
97 |
|
24,364 |
138 |
| Right-of-use assets |
|
3,043 |
9 |
|
1,521 |
9 |
| Deferred tax asset |
|
1,616 |
5 |
|
6,326 |
36 |
| Investments in joint ventures and associates |
|
325,458 |
930 |
|
159,833 |
902 |
| Financial assets at amortized cost |
|
14,128 |
40 |
|
18,000 |
102 |
| Financial assets at fair value through profit and loss |
|
9,615 |
27 |
|
4,867 |
27 |
| Other assets |
|
158 |
0 |
|
91 |
1 |
| Trade and other receivables |
|
9,358 |
27 |
|
3,415 |
19 |
| Total non-current assets |
|
1,243,563 |
3,554 |
|
601,881 |
3,397 |
| |
|
|
|
|
|
|
| Inventories |
|
73,942 |
211 |
|
30,724 |
173 |
| Financial assets at amortized cost |
|
24,289 |
69 |
|
1,357 |
8 |
| Financial assets at fair value through profit and loss |
|
248,926 |
711 |
|
103,856 |
586 |
| Derivative financial instruments |
|
289 |
1 |
|
161 |
1 |
| Trade and other receivables |
|
158,061 |
452 |
|
83,328 |
470 |
| Cash and cash equivalents |
|
64,117 |
183 |
|
18,757 |
106 |
| Total current assets |
|
569,624 |
1,628 |
|
238,183 |
1,344 |
| |
|
|
|
|
|
|
| Total assets |
|
1,813,187 |
5,181 |
|
840,064 |
4,742 |
| |
|
|
|
|
|
|
| EQUITY |
|
|
|
|
|
|
| Equity attributable to owners of the company |
|
963,757 |
2,754 |
|
403,463 |
2,277 |
| |
|
|
|
|
|
|
| Total equity |
|
966,155 |
2,761 |
|
404,620 |
2,284 |
| |
|
|
|
|
|
|
| LIABILITIES |
|
|
|
|
|
|
| Provisions |
|
54,194 |
155 |
|
26,062 |
147 |
| Income tax and presumed minimum income tax liabilities |
|
40,593 |
116 |
|
31,728 |
179 |
| Deferred tax liabilities |
|
19,821 |
57 |
|
19,854 |
112 |
| Defined benefit plans |
|
10,060 |
29 |
|
4,908 |
28 |
| Borrowings |
|
451,083 |
1,289 |
|
237,437 |
1,340 |
| Trade and other payables |
|
13,231 |
38 |
|
3,757 |
21 |
| Total non-current liabilities |
|
588,982 |
1,683 |
|
323,746 |
1,827 |
| |
|
|
|
|
|
|
| Provisions |
|
1,205 |
3 |
|
779 |
4 |
| Income tax liabilities |
|
12,392 |
35 |
|
927 |
5 |
| Taxes payables |
|
11,762 |
34 |
|
4,966 |
28 |
| Defined benefit plans |
|
915 |
3 |
|
1,021 |
6 |
| Salaries and social security payable |
|
9,433 |
27 |
|
5,627 |
32 |
| Derivative financial instruments |
|
2 |
0 |
|
318 |
2 |
| Borrowings |
|
123,132 |
352 |
|
48,329 |
273 |
| Trade and other payables |
|
99,209 |
283 |
|
49,731 |
281 |
| Total current liabilities |
|
258,050 |
737 |
|
111,698 |
630 |
| |
|
|
|
|
|
|
| Total liabilities |
|
847,032 |
2,420 |
|
435,444 |
2,458 |
| |
|
|
|
|
|
|
| Total liabilities and equity |
|
1,813,187 |
5,181 |
|
840,064 |
4,742 |
| | | Pampa Energía ● Earnings release Q3 23 ● 5 |
| 2.2 | Consolidated income statement |
| |
|
Nine-month period |
|
Third quarter |
| Figures in million |
|
2023 |
|
2022 |
|
2023 |
|
2022 |
| |
|
AR$ |
US$ |
|
AR$ |
US$ |
|
AR$ |
US$ |
|
AR$ |
US$ |
| Sales revenue |
|
346,957 |
1,370 |
|
168,748 |
1,381 |
|
152,701 |
474 |
|
69,225 |
507 |
| Domestic sales |
|
285,892 |
1,117 |
|
136,862 |
1,114 |
|
131,583 |
408 |
|
58,154 |
426 |
| Foreign market sales |
|
61,065 |
253 |
|
31,886 |
267 |
|
21,118 |
66 |
|
11,071 |
81 |
| Cost of sales |
|
(209,953) |
(850) |
|
(104,023) |
(859) |
|
(92,014) |
(294) |
|
(43,127) |
(319) |
| |
|
|
|
|
|
|
|
|
|
|
|
|
| Gross profit |
|
137,004 |
520 |
|
64,725 |
522 |
|
60,687 |
180 |
|
26,098 |
188 |
| |
|
|
|
|
|
|
|
|
|
|
|
|
| Selling expenses |
|
(13,333) |
(51) |
|
(5,719) |
(47) |
|
(5,610) |
(17) |
|
(1,998) |
(14) |
| Administrative expenses |
|
(33,554) |
(133) |
|
(12,389) |
(101) |
|
(13,990) |
(44) |
|
(5,063) |
(38) |
| Exploration expenses |
|
(1,772) |
(7) |
|
(23) |
- |
|
(22) |
- |
|
(8) |
- |
| Other operating income |
|
31,627 |
115 |
|
10,345 |
79 |
|
17,338 |
54 |
|
5,988 |
43 |
| Other operating expenses |
|
(18,079) |
(68) |
|
(4,209) |
(33) |
|
(10,704) |
(33) |
|
(1,577) |
(10) |
| Impairment of financial assets |
|
(1,490) |
(4) |
|
(672) |
(5) |
|
(553) |
(1) |
|
(153) |
(1) |
| Rec. of imp. (impairm.) of int. assets & inventories |
|
(324) |
(1) |
|
(4,260) |
(34) |
|
(1) |
- |
|
124 |
1 |
| Results for part. in joint businesses & associates |
|
14,044 |
42 |
|
13,610 |
100 |
|
5,474 |
8 |
|
6,749 |
43 |
| Income from the sale of associates |
|
486 |
1 |
|
- |
- |
|
486 |
1 |
|
- |
- |
| |
|
|
|
|
|
|
|
|
|
|
|
|
| Operating income |
|
114,609 |
414 |
|
61,408 |
481 |
|
53,105 |
148 |
|
30,160 |
212 |
| |
|
|
|
|
|
|
|
|
|
|
|
|
| Financial income |
|
1,090 |
4 |
|
597 |
6 |
|
662 |
2 |
|
147 |
1 |
| Financial costs |
|
(71,096) |
(283) |
|
(18,127) |
(148) |
|
(30,018) |
(95) |
|
(9,333) |
(70) |
| Other financial results |
|
95,794 |
392 |
|
4,108 |
33 |
|
40,333 |
138 |
|
8,278 |
68 |
| Financial results, net |
|
25,788 |
113 |
|
(13,422) |
(109) |
|
10,977 |
45 |
|
(908) |
(1) |
| |
|
|
|
|
|
|
|
|
|
|
|
|
| Profit before tax |
|
140,397 |
527 |
|
47,986 |
372 |
|
64,082 |
193 |
|
29,252 |
211 |
| |
|
|
|
|
|
|
|
|
|
|
|
|
| Income tax |
|
(20,437) |
(69) |
|
(5,224) |
(26) |
|
(13,350) |
(40) |
|
(5,195) |
(32) |
| |
|
|
|
|
|
|
|
|
|
|
|
|
| Net income for the period |
|
119,960 |
458 |
|
42,762 |
346 |
|
50,732 |
153 |
|
24,057 |
179 |
| Attributable to the owners of the Company |
|
119,708 |
457 |
|
42,448 |
343 |
|
50,611 |
152 |
|
23,979 |
178 |
| Attributable to the non-controlling interests |
|
252 |
1 |
|
314 |
3 |
|
121 |
0.9 |
|
78 |
1 |
| |
|
|
|
|
|
|
|
|
|
|
|
|
| Net income per share to shareholders |
|
87.51 |
0.33 |
|
30.74 |
0.25 |
|
37.21 |
0.11 |
|
17.38 |
0.13 |
| Net income per ADR to shareholders |
|
2,187.65 |
8.35 |
|
768.43 |
6.21 |
|
930.35 |
2.80 |
|
434.40 |
3.23 |
| |
|
|
|
|
|
|
|
|
|
|
|
|
| Average outstanding common shares1 |
|
1,368 |
|
|
1,381 |
|
|
1,360 |
|
|
1,380 |
|
| Outstanding shares by the end of period1 |
|
1,360 |
|
|
1,380 |
|
|
1,360 |
|
|
1,380 |
|
Note:
1 It considers the Employee stock-based compensation plan shares, which amounted to 3.9 million common shares as of September 30,
2022 and 2023.
| | | Pampa Energía ● Earnings release Q3 23 ● 6 |
| 2.3 | Cash and financial borrowings |
As of September 30, 2023,
in US$ million |
|
Cash1 |
|
Financial debt |
|
Net debt |
|
| |
Consolidated
in FS |
Ownership adjusted |
|
Consolidated
in FS |
Ownership adjusted |
|
Consolidated
in FS |
Ownership adjusted |
|
| |
| Power generation |
|
856 |
853 |
|
600 |
600 |
|
(256) |
(253) |
|
| Petrochemicals |
|
- |
- |
|
- |
- |
|
- |
- |
|
| Holding and others |
|
0 |
0 |
|
- |
- |
|
(0) |
(0) |
|
| Oil and gas |
|
107 |
107 |
|
1,041 |
1,041 |
|
934 |
934 |
|
| Total under IFRS/Restricted Group |
|
964 |
960 |
|
1,641 |
1,641 |
|
677 |
681 |
|
| Affiliates at O/S2 |
|
162 |
162 |
|
309 |
309 |
|
148 |
148 |
|
| Total with affiliates |
|
1,126 |
1,122 |
|
1,950 |
1,950 |
|
824 |
828 |
|
Note: Financial
debt includes accrued interest. 1 It includes cash and cash equivalents, financial assets at fair value with changing results,
and investments at amortized cost. 2 Under IFRS, the affiliates CTBSA, Transener and TGS are not consolidated in Pampa.
Debt transactions
As of September
30, 2023, Pampa’s financial debt at the consolidated level under IFRS amounted to US$1,641 million, similar to the end of 2022 and
Q2 23, mainly explained by debt issuances, offset by the de-consolidation of PEMC’s associated financial debt. However, the net
debt continued to drop by 26% vs. December 2022, reaching US$677 million, mainly due to increased liquidity. The total US$ debt accounted
for 84% of the Company’s gross debt - 70% of the total denominated in US$, with an average interest rate of 8.3%, primarily at a
fixed rate, no coupon for US$-link debt, while the US$-MEP indebtedness rate was 5%. The average interest rate for AR$ debt was 99.3%.
The financial debt had an average life of 3.1 years. The chart below shows the principal maturity profile, net of repurchases, in US$
million by the end of Q3 23:
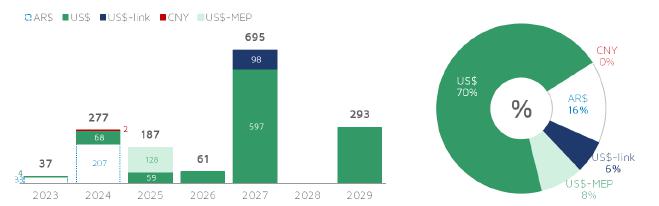
Note: The chart only
considers Pampa consolidated under IFRS; it does not include affiliates TGS, Transener, and CTBSA.
During
Q3 23, Pampa paid the outstanding AR$2.3 billion of the first Green Bond (Series VIII CB) and import financing for US$5 million. Moreover,
Pampa issued the Series XVIII CB in US$-MEP for US$72 million at a 5% rate maturing on September 2025; obtained short-term bank debt for
AR$2 billion and import financing for the equivalent of US$3 million. After Q3 23, Pampa took export pre-financing for US$19 million,
and import financing for the equivalent of US$13 million.
Regarding our affiliates, in Q3 23, TGS paid import financing
for US$0.3 million, while Transener paid borrowings for AR$83 million. After the quarter’s closing, TGS took net bank debt for US$18
million, while Transener paid borrowings for AR$56 million, and CTEB took import financing for US$0.8 million.
| | | Pampa Energía ● Earnings release Q3 23 ● 7 |
As of today,
the Company complies with the covenants established in its debt agreements.
Summary of debt securities
Company
In million |
Security |
Maturity |
Amount issued |
Amount
net of repurchases |
Coupon |
| In US$ |
|
|
|
|
|
| Pampa |
CB Series IX at par & fixed rate |
2026 |
293 |
179 |
9.5% |
| CB Series I at discount & fixed rate |
2027 |
750 |
597 |
7.5% |
| CB Series III at discount & fixed rate |
2029 |
300 |
293 |
9.125% |
| TGS1 |
CB at discount at fixed rate |
2025 |
500 |
470 |
6.75% |
| |
|
|
|
|
|
| In US$-link |
|
|
|
|
|
| Pampa |
CB Series XIII |
2027 |
98 |
98 |
0% |
| CTEB1 |
CB Series IV |
2024 |
96 |
96 |
0% |
| CB Series VI |
2025 |
84 |
84 |
0% |
| CB Series IX |
2026 |
50 |
50 |
0% |
| |
|
|
|
|
|
| In US$-MEP |
|
|
|
|
|
| Pampa |
CB Series XVI |
2025 |
56 |
56 |
4.99% |
| CB Series XVIII |
2025 |
72 |
72 |
5.00% |
| |
|
|
|
|
|
| In AR$ |
|
|
|
|
|
| Pampa |
CB Series XI |
2024 |
21,655 |
21,655 |
Badlar Privada +0% |
| CB Series XV |
2024 |
18,264 |
18,264 |
Badlar Privada +2% |
| CB Series XVII (Green Bond) |
2024 |
5,980 |
5,980 |
Badlar Privada +2% |
| CTEB1 |
CB Series VII |
2023 |
1,754 |
1,754 |
Badlar Privada +2.98% |
| CB Series VIII |
2024 |
4,236 |
4,236 |
Badlar Privada +1% |
| |
|
|
|
|
|
| In UVA |
|
|
|
|
|
| CTEB1 |
CB Series II |
2024 |
65 |
65 |
4% |
Note: 1
According to IFRS, affiliates are not consolidated in Pampa’s FS.
Credit rating of
Pampa and subsidiaries
| Company |
Agency |
Rating |
| Global |
Local |
| Pampa |
S&P |
b-1 |
na |
| Moody's |
Caa3 |
na |
| FitchRatings2 |
B- |
AA+ (long-term)
A1+ (short-term) |
| TGS |
S&P |
CCC- |
na |
| Moody's |
Caa3 |
na |
| Transener |
FitchRatings2 |
na |
A+ (long-term) |
| CTEB |
FitchRatings2 |
na |
A+ |
Note: 1
Stand-alone. 2 Local ratings issued by FIX SCR.
| | | Pampa Energía ● Earnings release Q3 23 ● 8 |
| 3. | Analysis of the Q3 23 results |
Breakdown by segment
Figures in US$ million |
Q3 23 |
Q3 22 |
Variation |
| Sales |
Adjusted EBITDA |
Net Income |
Sales |
Adjusted EBITDA |
Net Income |
Sales |
Adjusted EBITDA |
Net Income |
| |
|
|
|
|
|
|
|
|
|
| Power generation |
163 |
91 |
110 |
169 |
89 |
119 |
-4% |
+2% |
-7% |
| Oil and Gas |
207 |
132 |
2 |
189 |
117 |
5 |
+10% |
+12% |
-60% |
| Petrochemicals |
132 |
16 |
15 |
179 |
19 |
19 |
-26% |
-16% |
-21% |
| Holding and Others |
3 |
6 |
25 |
4 |
21 |
35 |
-25% |
-72% |
-29% |
| Eliminations |
(31) |
- |
- |
(34) |
- |
- |
-9% |
NA |
NA |
| |
|
|
|
|
|
|
|
|
|
| Total |
474 |
244 |
152 |
507 |
246 |
178 |
-7% |
-1% |
-15% |
Note: Net income
attributable to the Company’s shareholders.
| 3.1 | Reconciliation of consolidated
adjusted EBITDA |
Reconciliation of adjusted EBITDA,
in US$ million |
|
Nine-month period |
|
Third quarter |
| |
2023 |
2022 |
|
2023 |
2022 |
| Consolidated operating income |
|
414 |
481 |
|
148 |
212 |
| Consolidated depreciations and amortizations |
|
203 |
160 |
|
77 |
54 |
| EBITDA |
|
617 |
641 |
|
225 |
266 |
| |
|
|
|
|
|
|
| Adjustments from generation segment |
|
(5) |
(25) |
|
1 |
(36) |
| Deletion of equity income |
|
(9) |
(67) |
|
(4) |
(33) |
| Deletion of gain from commercial interests |
|
(41) |
(17) |
|
(12) |
(11) |
| Deletion of provision in outages |
|
- |
6 |
|
- |
- |
| Deletion of PPE activation in operating expenses |
|
3 |
16 |
|
- |
5 |
| Deletion of provision in hydros |
|
6 |
- |
|
1 |
- |
| Greenwind's EBITDA adjusted by ownership |
|
- |
7 |
|
- |
1 |
| CTBSA's EBITDA adjusted by ownership |
|
37 |
31 |
|
16 |
2 |
| Adjustments from oil and gas segment |
|
(0) |
27 |
|
(1) |
(2) |
| Deletion of PPE & inventories' impairment |
|
- |
29 |
|
- |
- |
| Deletion of gain from commercial interests |
|
(7) |
(2) |
|
(1) |
(2) |
| Deletion of Río Atuel's reversal losses |
|
7 |
- |
|
- |
- |
| Adjustments from petrochemicals segment |
|
3 |
(0) |
|
(0) |
(0) |
| Deletion of inventory impairment |
|
3 |
- |
|
- |
- |
| Adjustments from holding & others segment |
|
58 |
81 |
|
20 |
18 |
| Deletion of equity income |
|
(33) |
(33) |
|
(4) |
(10) |
| Deletion of gain from commercial interests |
|
(0) |
(1) |
|
0 |
(0) |
| Deletion of intang. assets' impairment/(recovery) |
|
(2) |
5 |
|
- |
(1) |
| Deletion of the sale of associates |
|
(1) |
- |
|
(1) |
- |
| Ownership adjustment |
|
(184) |
(235) |
|
(54) |
(62) |
| |
|
|
|
|
|
|
| Consolidated adjusted EBITDA |
|
672 |
724 |
|
244 |
246 |
| At our ownership |
|
659 |
723 |
|
250 |
246 |
| | | Pampa Energía ● Earnings release Q3 23 ● 9 |
| 3.2 | Analysis of the power generation
segment |
Power generation segment, consolidated
Figures in US$ million |
|
Nine-month period |
|
Third quarter |
| |
2023 |
2022 |
∆% |
|
2023 |
2022 |
∆% |
| Sales revenue |
|
507 |
500 |
+1% |
|
163 |
169 |
-4% |
| Domestic sales |
|
507 |
500 |
+1% |
|
163 |
169 |
-4% |
| Cost of sales |
|
(275) |
(278) |
-1% |
|
(94) |
(94) |
- |
| |
|
|
|
|
|
|
|
|
| Gross profit |
|
232 |
222 |
+5% |
|
69 |
75 |
-8% |
| |
|
|
|
|
|
|
|
|
| Selling expenses |
|
(1) |
(2) |
-50% |
|
- |
(1) |
-100% |
| Administrative expenses |
|
(38) |
(29) |
+31% |
|
(12) |
(10) |
+20% |
| Other operating income |
|
50 |
18 |
+178% |
|
15 |
11 |
+36% |
| Other operating expenses |
|
(24) |
(3) |
NA |
|
(10) |
(1) |
NA |
| Results for participation in joint businesses |
|
9 |
67 |
-87% |
|
4 |
33 |
-88% |
| |
|
|
|
|
|
|
|
|
| Operating income |
|
228 |
273 |
-16% |
|
66 |
107 |
-38% |
| |
|
|
|
|
|
|
|
|
| Finance income |
|
2 |
1 |
+100% |
|
1 |
- |
NA |
| Finance costs |
|
(92) |
(47) |
+96% |
|
(26) |
(20) |
+30% |
| Other financial results |
|
221 |
(11) |
NA |
|
97 |
31 |
+213% |
| Financial results, net |
|
131 |
(57) |
NA |
|
72 |
11 |
NA |
| |
|
|
|
|
|
|
|
|
| Profit before tax |
|
359 |
216 |
+66% |
|
138 |
118 |
+17% |
| |
|
|
|
|
|
|
|
|
| Income tax |
|
(48) |
(15) |
+220% |
|
(27) |
2 |
NA |
| |
|
|
|
|
|
|
|
|
| Net income for the period |
|
311 |
201 |
+55% |
|
111 |
120 |
-8% |
| Attributable to owners of the Company |
|
310 |
198 |
+57% |
|
110 |
119 |
-7% |
| Attributable to non-controlling interests |
|
1 |
3 |
-67% |
|
1 |
1 |
-10% |
| |
|
|
|
|
|
|
|
|
| Adjusted EBITDA |
|
297 |
309 |
-4% |
|
91 |
89 |
+2% |
| Adjusted EBITDA at our share ownership |
|
284 |
308 |
-8% |
|
97 |
89 |
+8% |
| |
|
|
|
|
|
|
|
|
| Increases in PPE |
|
192 |
99 |
+94% |
|
46 |
69 |
-33% |
| Depreciation and amortization |
|
74 |
61 |
+21% |
|
24 |
18 |
+33% |
Sales
during Q3 23 recorded a slight decline of 4%, explained by lower Energía Plus and legacy energy prices,
and lower income from PPAs due to PEMC’s divestment and an outage at CTLL’s GT05. These effects were partially offset by PEA’s
acquisition in December 2022 and the commissioning of PEPE IV, which contributed to the PPAs and MATER segments, respectively.
For legacy
energy, in spite of the increases received in August and September of 28% and 23%, respectively, they failed to offset the AR$ devaluation
impact on open-cycle units (GT and ST), where the capacity remuneration was US$3.9 thousand per MW-month (-17% vs. Q3 22), and for hydros
US$1.8 thousand per MW-month (-17% vs. Q3 22). Capacity remuneration for CCGTs remained similar to Q3 22, recording US$4.6 thousand per
MW-month, thanks to differential income for CCGTs (Res. No. 59/2023). Legacy energy represented 77% of the 5,332 MW operated by Pampa,
but comprised only 31% of the Q3 23 segment’s sales.
In
operating terms, Pampa’s operated power generation
grew 32% vs. Q3 22, significantly outpacing the Argentine power grid’s 7% growth, mainly explained by the higher dispatch from the
new CTEB’s CCGT, commissioned in February 2023 (+1,112 GWh), increased water input at HPPL (+301 GWh), new contributions from PEPE
IV and PEA (+174 GWh), and greater gas availability at CTGEBA (+69 GWh). These variations were partially offset by weaker demand due to
a mild winter that impacted CPB, CTPP and CTIW (-316 GWh), an outage in CTLL’s GT05 since the end of July (-80 GWh) and PEMC’s
divestment (-66 GWh).
| | | Pampa Energía ● Earnings release Q3 23 ● 10 |
The
availability of Pampa’s operated units reached 93.7%
in Q3 23 (-240 basis points vs. Q3 22’s 96.1%), mainly due to CTLL GT05’s outage mentioned above and programmed overhauls
in CTGEBA’s GT03. Therefore, a 92.1% thermal availability rate was registered in Q3 23 (-382 basis points vs. 95.9% from Q3 22).
Power generation's
key performance indicators |
|
2023 |
|
2022 |
|
Variation |
| Hydro |
Wind |
Thermal |
Total |
Hydro |
Wind |
Thermal |
Total |
Hydro |
Wind |
Thermal |
Total |
| Installed capacity (MW) |
|
938 |
287 |
4,107 |
5,332 |
|
938 |
206 |
3,826 |
4,970 |
|
- |
+39% |
+7% |
+7% |
| New capacity (%) |
|
- |
100% |
33% |
31% |
|
- |
100% |
28% |
26% |
|
- |
- |
+5% |
+5% |
| Market share (%) |
|
2.2% |
0.7% |
9.5% |
12.3% |
|
2.2% |
0.5% |
8.9% |
11.6% |
|
-0% |
+0% |
+1% |
+1% |
| |
|
|
|
|
|
|
|
|
|
|
|
|
|
|
|
| Nine-month period |
|
|
|
|
|
|
|
|
|
|
|
|
|
|
|
| Net generation (GWh) |
|
1,249 |
913 |
13,800 |
15,963 |
|
888 |
655 |
11,594 |
13,136 |
|
+41% |
+39% |
+19% |
+22% |
| Volume sold (GWh) |
|
1,250 |
913 |
14,655 |
16,818 |
|
888 |
673 |
12,437 |
13,999 |
|
+41% |
+36% |
+18% |
+20% |
| |
|
|
|
|
|
|
|
|
|
|
|
|
|
|
|
| Average price (US$/MWh) |
|
19 |
72 |
35 |
35 |
|
27 |
70 |
42 |
42 |
|
-29% |
+3% |
-17% |
-15% |
| Average gross margin (US$/MWh) |
5 |
62 |
21 |
22 |
|
8 |
57 |
25 |
25 |
|
-38% |
+9% |
-15% |
-12% |
| |
|
|
|
|
|
|
|
|
|
|
|
|
|
|
|
| Third quarter |
|
|
|
|
|
|
|
|
|
|
|
|
|
|
|
| Net generation (GWh) |
|
596 |
316 |
4,073 |
4,985 |
|
292 |
212 |
3,263 |
3,767 |
|
+104% |
+49% |
+25% |
+32% |
| Volume sold (GWh) |
|
596 |
316 |
4,340 |
5,252 |
|
292 |
218 |
3,532 |
4,042 |
|
+104% |
+45% |
+23% |
+30% |
| |
|
|
|
|
|
|
|
|
|
|
|
|
|
|
|
| Average price (US$/MWh) |
|
14 |
72 |
39 |
38 |
|
25 |
71 |
44 |
44 |
|
-45% |
+1% |
-12% |
-14% |
| Average gross margin (US$/MWh) |
3 |
61 |
23 |
23 |
|
5 |
55 |
24 |
24 |
|
-41% |
+9% |
-3% |
-5% |
Note: Gross margin before amortization
and depreciation. It includes CTEB, operated by Pampa (50% equity stake). PEMC was de-consolidated in August 2023.
Without
depreciation and amortizations, net operating costs remained
similar to Q3 22, mainly explained by lower gas purchases due to CAMMESA’s lesser thermal demand, lesser electricity purchases to
cover contracts due to the price decrease, lower maintenance and material costs, mainly in CTLL, and higher rate interests from CAMMESA’s
collection delays. Higher labor costs offset these effects.
Financial
results from Q3 23 reached a net profit of US$72 million, while a net profit of US$11 million
was recorded in Q3 22, mainly due to gains from holding financial instruments, offset by increased interests, mainly from the AR$-debt.
Adjusted
EBITDA from the power generation segment reached US$91 million (+2% vs. Q3 22), mainly due to
lower legacy energy prices affected by the AR$ devaluation and PEMC’s de-consolidation, in addition to lower Energía Plus
prices and higher labor costs. These variations were partially offset by renewable PPAs at PEA and PEPE IV, the differential remuneration
in US$ for legacy CCGTs and lower maintenance and material costs. In addition, adjusted EBITDA considers CTEB’s 50% ownership, which
improvement is because of the PPA in the CCGT (US$16 million in Q3 23 vs. US$2 million in Q3 22). It excludes items such as the commercial
interests for delayed collections, accrual of PPE’s expenses as operating expenditures and contingency provisions for the concession’s
termination at Mendoza hydros.
Finally,
without including CTEB, capital expenditures registered
US$46 million in Q3 23, -33% vs. Q3 22, explained by the commissioning of PEPE IV, offset by the PEPE VI project.
| | | Pampa Energía ● Earnings release Q3 23 ● 11 |
The following table shows the
expansion projects in power generation:
| Project |
MW |
Marketing |
Currency |
Awarded price |
|
Estimated capex in
US$ million1 |
Date of
commissioning |
Capacity per
MW-month |
Variable
per MWh |
Total
per MWh |
|
Budget |
% Executed
@9/30/23 |
| Thermal |
|
|
|
|
|
|
|
|
|
|
| Closing to CC Ensenada |
279 |
PPA for 10 years |
US$ |
23,962 |
10.5 |
43 |
|
253 |
99% |
22-Feb-23 |
| |
|
|
|
|
|
|
|
|
|
|
| Renewable |
|
|
|
|
|
|
|
|
|
|
| Pampa Energía IV |
81 |
MAT ER |
US$ |
na |
na |
58(2) |
|
128 |
98% |
17-Jun-23 |
| Pampa Energía VI |
139.5 |
MAT ER |
US$ |
na |
na |
62(2) |
|
269 |
22% |
Q4 2024 (est.) |
Note: 1 Without value-added
tax. 2 Estimated average.
| 3.3 | Analysis of the oil and
gas segment |
Oil & gas segment, consolidated
Figures in US$ million |
|
Nine-month period |
|
Third quarter |
| |
2023 |
2022 |
∆% |
|
2023 |
2022 |
∆% |
| Sales revenue |
|
548 |
491 |
+12% |
|
207 |
189 |
+10% |
| Domestic sales |
|
411 |
379 |
+8% |
|
181 |
163 |
+11% |
| Foreign market sales |
|
137 |
112 |
+22% |
|
26 |
26 |
+1% |
| Cost of sales |
|
(319) |
(264) |
+21% |
|
(121) |
(104) |
+16% |
| |
|
|
|
|
|
|
|
|
| Gross profit |
|
229 |
227 |
+1% |
|
86 |
85 |
+1% |
| |
|
|
|
|
|
|
|
|
| Selling expenses |
|
(38) |
(33) |
+15% |
|
(13) |
(9) |
+44% |
| Administrative expenses |
|
(56) |
(44) |
+27% |
|
(18) |
(16) |
+13% |
| Exploration expenses |
|
(7) |
- |
NA |
|
- |
- |
NA |
| Other operating income |
|
64 |
55 |
+16% |
|
39 |
31 |
+26% |
| Other operating expenses |
|
(26) |
(22) |
+18% |
|
(13) |
(6) |
+117% |
| Impairment of financial assets |
|
- |
(1) |
-100% |
|
- |
- |
NA |
| Impairment of PPE and inventories |
|
- |
(29) |
-100% |
|
- |
- |
NA |
| |
|
|
|
|
|
|
|
|
| Operating income |
|
166 |
153 |
+8% |
|
81 |
85 |
-5% |
| |
|
|
|
|
|
|
|
|
| Finance income |
|
2 |
2 |
- |
|
1 |
1 |
- |
| Finance costs |
|
(157) |
(83) |
+89% |
|
(60) |
(40) |
+50% |
| Other financial results |
|
7 |
(19) |
NA |
|
(18) |
(14) |
+29% |
| Financial results, net |
|
(148) |
(100) |
+48% |
|
(77) |
(53) |
+45% |
| |
|
|
|
|
|
|
|
|
| Loss before tax |
|
18 |
53 |
-66% |
|
4 |
32 |
-88% |
| |
|
|
|
|
|
|
|
|
| Income tax |
|
(2) |
- |
NA |
|
(2) |
(27) |
-93% |
| |
|
|
|
|
|
|
|
|
| Net loss for the period |
|
16 |
53 |
-70% |
|
2 |
5 |
-60% |
| |
|
|
|
|
|
|
|
|
| Adjusted EBITDA |
|
291 |
275 |
+6% |
|
132 |
117 |
+12% |
| |
|
|
|
|
|
|
|
|
| Increases in PPE and right-of-use assets |
|
385 |
209 |
+84% |
|
169 |
61 |
+177% |
| Depreciation and amortization |
|
125 |
95 |
+32% |
|
52 |
34 |
+53% |
In
Q3 23, sales from the oil and gas segment increased by
10% vs. Q3 22, mainly due to higher gas production driven by commitments under Plan Gas.Ar, linked to the GPNK. However, lower crude oil
prices and output partially offset these effects.
| | | Pampa Energía ● Earnings release Q3 23 ● 12 |
Oil and gas'
key performance indicators |
|
2023 |
|
2022 |
|
Variation |
| Oil |
Gas |
Total |
Oil |
Gas |
Total |
Oil |
Gas |
Total |
| Nine-month period |
|
|
|
|
|
|
|
|
|
|
|
|
| Volume |
|
|
|
|
|
|
|
|
|
|
|
|
| Production |
|
|
|
|
|
|
|
|
|
|
|
|
| In thousand m3/day |
|
0.8 |
10,793 |
|
|
0.8 |
9,919 |
|
|
-5% |
+9% |
+8% |
| In million cubic feet/day |
|
|
381 |
|
|
|
350 |
|
|
| In thousand boe/day |
|
5.0 |
63.5 |
68.5 |
|
5.2 |
58.4 |
63.6 |
|
| Sales |
|
|
|
|
|
|
|
|
|
|
|
|
| In thousand m3/day |
|
0.8 |
10,827 |
|
|
0.8 |
10,002 |
|
|
+1% |
+8% |
+8% |
| In million cubic feet/day |
|
|
382 |
|
|
|
353 |
|
|
| In thousand boe/day |
|
5.3 |
63.7 |
69.0 |
|
5.3 |
58.9 |
64.1 |
|
| |
|
|
|
|
|
|
|
|
|
|
|
|
| Average Price |
|
|
|
|
|
|
|
|
|
|
|
|
| In US$/bbl |
|
65.5 |
|
|
|
70.5 |
|
|
|
-7% |
+4% |
|
| In US$/MBTU |
|
|
4.5 |
|
|
|
4.3 |
|
|
|
| |
|
|
|
|
|
|
|
|
|
|
|
|
| Third quarter |
|
|
|
|
|
|
|
|
|
|
|
|
| Volume |
|
|
|
|
|
|
|
|
|
|
|
|
| Production |
|
|
|
|
|
|
|
|
|
|
|
|
| In thousand m3/day |
|
0.7 |
12,860 |
|
|
0.9 |
10,705 |
|
|
-14% |
+20% |
+17% |
| In million cubic feet/day |
|
|
454 |
|
|
|
378 |
|
|
| In thousand boe/day |
|
4.7 |
75.7 |
80.4 |
|
5.5 |
63.0 |
68.5 |
|
| Sales |
|
|
|
|
|
|
|
|
|
|
|
|
| In thousand m3/day |
|
0.7 |
12,885 |
|
|
0.9 |
10,781 |
|
|
-22% |
+20% |
+16% |
| In million cubic feet/day |
|
|
455 |
|
|
|
381 |
|
|
| In thousand boe/day |
|
4.6 |
75.8 |
80.5 |
|
5.9 |
63.5 |
69.4 |
|
| |
|
|
|
|
|
|
|
|
|
|
|
|
| Average Price |
|
|
|
|
|
|
|
|
|
|
|
|
| In US$/bbl |
|
63.1 |
|
|
|
70.2 |
|
|
|
-10% |
-3% |
|
| In US$/MBTU |
|
|
4.7 |
|
|
|
4.8 |
|
|
|
Note: The net production in
Argentina. The gas volume is standardized at 9,300 kilocalories (kCal).
In
operating terms, total production reached 80.4 kboe per
day in Q3 23 (+17% vs. Q3 22 and +19% vs. Q2 23). Gas production achieved
new record highs, reaching 12.9 million m3 per day (+20% vs. Q3 22 and +22% vs. Q2 23), explained by higher delivery volumes
under Plan Gas.Ar, despite the over-a-month delay in the commissioning of GPNK. To a lesser extent, exports to Chile and sales to the
industrial segment contributed to the increase in production. We reached a new daily production record of 16.4 million m3 in
August.
Analyzing
the gas output by block, 58% of our total gas output in Q3 23 came from El Mangrullo, which recorded
7.4 million m3 per day (-8% vs. Q3 22 but +17% vs. Q2 23 due to seasonality). On the other hand, due to shale activity, Sierra
Chata reached 3.4 million m3 per day (+435% vs. Q3 22 and +52% vs. Q2 23). At non-operated blocks, Río Neuquén
remained at 1.6 million m3 per day (+12% vs. Q3 22 and +4% vs. Q2 23), while Rincón del Mangrullo continues the natural
depletion, contributing 0.2 million m3 per day (-23% vs. Q3 22 and -3% vs. Q2 23).
Our
gas price in Q3 23 was US$4.7 per MBTU (similar to Q3 22
and Q2 23), mainly because of lower prices in the industrial segment.
In
Q3 23, under Plan Gas.Ar, 45% of our gas deliveries were
destined for the retail segment due to the winter period priority, and 32% to CAMMESA as fuel for our thermal power units. The GPNK explains
the rise in gas for power generation. Moreover, 15% was sold to the industrial/spot market, 5% was exported, and the remaining was sold
as raw material to our petchem plants. In contrast, in Q3 22, 59% was sold to the retail segment, 17% to our thermal power units, 16%
to the industrial/spot market, 5% was exported, and 2% was sold to our petchem plants.
| | | Pampa Energía ● Earnings release Q3 23 ● 13 |
Oil
production reached 4.7 kbbl per day in Q3 23 (-14% vs. Q3 22), explained by a drop of 0.9 kbbl
per day at El Tordillo due to its natural depletion, partially offset by higher output at Río Neuquén, Gobernador Ayala
and Los Blancos (+0.2 kbbl per day vs. Q3 22). However, the volume sold was higher thanks to the oil stock during Q2 23 to respond to
the growing demand. 85% of the volume traded was destined for the local market vs. 80% in Q3 22.
Our
oil price in Q3 23 was 10% lower than in Q3 22, reaching
US$63.1 per bbl, explained by the decrease in Brent and the maximum price scheme for local prices.
By
the end of Q3 23, we accounted for 810 productive wells vs.
895 as of the end of 2022. The sharp decrease is explained by the exit agreements in Estación Fernández Oro and Anticlinal
Campamento gas blocks, and the production curtailment at El Tordillo oil block due to cost efficiency.
Net
operating costs in Q3 23, excluding depreciation, amortization
and Plan Gas.Ar compensation grew 6%, reaching US$104 million vs. Q3 22, mainly due to higher labor expenses, transportation tariffs for
gas exports, and royalties and levies - all linked to higher oil and gas sales. Lower oil purchases for trading, operation and maintenance
costs of wells and treatment plants at operated blocks partially offset these effects. New wells’ productivity positively impacted
the lifting cost per boe, which decreased to US$5.6 per
boe produced in Q3 23, -7% year-on-year and -13% vs. Q2 23.
Financial
results in Q3 23 recorded higher losses of US$24 million, reaching a decrease of US$77 million,
explained by a rise in interest expenses, mainly related to the AR$-debt, and higher net losses due to the AR$ devaluation impact over
certain receivables, partially offset by higher gains from holding financial securities.
Our
oil and gas adjusted EBITDA amounted to US$132 million
in Q3 23, 12% higher than in Q3 22, mainly explained by higher volumes sold in the local market under Plan Gas.Ar commitments, offset
by lower margins and turnover in crude oil. In addition, the adjusted EBITDA of Q3 23 excludes the impairment of PPE and inventories and
commercial interests for late collection, mainly charged to CAMMESA.
Finally,
in Q3 23, capital expenditures amounted to US$169 million,
177% higher vs. Q3 22, mainly driven by the shale gas wells drilling and completion campaign to comply with the additional commitments
under Plan Gas.Ar.
| | | Pampa Energía ● Earnings release Q3 23 ● 14 |
| 3.4 | Analysis of the petrochemicals
segment |
Petrochemicals segment, consolidated
Figures in US$ million |
|
Nine-month period |
|
Third quarter |
| |
2023 |
2022 |
∆% |
|
2023 |
2022 |
∆% |
| Sales revenue |
|
389 |
463 |
-16% |
|
132 |
179 |
-26% |
| Domestic sales |
|
273 |
308 |
-11% |
|
92 |
124 |
-26% |
| Foreign market sales |
|
116 |
155 |
-25% |
|
40 |
55 |
-27% |
| Cost of sales |
|
(341) |
(405) |
-16% |
|
(110) |
(155) |
-29% |
| |
|
|
|
|
|
|
|
|
| Gross profit |
|
48 |
58 |
-17% |
|
22 |
24 |
-8% |
| |
|
|
|
|
|
|
|
|
| Selling expenses |
|
(12) |
(12) |
- |
|
(4) |
(4) |
- |
| Administrative expenses |
|
(5) |
(4) |
+25% |
|
(2) |
(2) |
- |
| Other operating expenses |
|
(2) |
(2) |
- |
|
(1) |
(1) |
- |
| Impairment of inventories |
|
(3) |
- |
NA |
|
- |
- |
NA |
| |
|
|
|
|
|
|
|
|
| Operating income |
|
26 |
40 |
-35% |
|
15 |
17 |
-12% |
| |
|
|
|
|
|
|
|
|
| Finance costs |
|
(2) |
(2) |
- |
|
(1) |
(1) |
- |
| Other financial results |
|
7 |
5 |
+40% |
|
4 |
5 |
-20% |
| Financial results, net |
|
5 |
3 |
+67% |
|
3 |
4 |
-25% |
| |
|
|
|
|
|
|
|
|
| Profit before tax |
|
31 |
43 |
-28% |
|
18 |
21 |
-14% |
| |
|
|
|
|
|
|
|
|
| Income tax |
|
(5) |
(5) |
- |
|
(3) |
(2) |
+50% |
| |
|
|
|
|
|
|
|
|
| Net income for the period |
|
26 |
38 |
-32% |
|
15 |
19 |
-21% |
| |
|
|
|
|
|
|
|
|
| Adjusted EBITDA |
|
33 |
44 |
-25% |
|
16 |
19 |
-16% |
| |
|
|
|
|
|
|
|
|
| Increases in PPE |
|
4 |
5 |
-20% |
|
1 |
3 |
-67% |
| Depreciation and amortization |
|
4 |
4 |
- |
|
1 |
2 |
-50% |
The
petrochemicals segment’s adjusted EBITDA reached
US$16 million in Q3 23, 16% lower vs. Q3 22, mainly explained by the significant drop in international reference prices and lower reforming
volumes sold, mainly in octane bases. Lower raw material costs (linked to the decline in global prices) and increased polystyrene exported
volumes and styrene domestic sales partially offset these effects. However, the adjusted EBITDA increased by US$6 million quarter-on-quarter
due to improved local styrene sales, higher polystyrene and SBR exports, and a rise in reforming prices.
| | | Pampa Energía ● Earnings release Q3 23 ● 15 |
Petrochemicals'
key performance indicators |
|
Products |
|
Total |
| |
Styrene & polystyrene1 |
SBR |
Reforming & others |
|
| Nine-month period |
|
|
|
|
|
|
| Volume sold 9M23 (thousand ton) |
|
84 |
32 |
195 |
|
311 |
| Volume sold 9M22 (thousand ton) |
|
84 |
36 |
182 |
|
302 |
| Variation 9M23 vs. 9M22 |
|
+0% |
-11% |
+8% |
|
+3% |
| |
|
|
|
|
|
|
| Average price 9M23 (US$/ton) |
|
1,860 |
1,813 |
890 |
|
1,247 |
| Average price 9M22 (US$/ton) |
|
2,148 |
2,317 |
1,097 |
|
1,535 |
| Variation 9M23 vs. 9M22 |
|
-13% |
-22% |
-19% |
|
-19% |
| |
|
|
|
|
|
|
| |
|
|
|
|
|
|
| Third quarter |
|
|
|
|
|
|
| Volume sold Q3 23 (thousand ton) |
|
30 |
12 |
60 |
|
102 |
| Volume sold Q3 22 (thousand ton) |
|
28 |
13 |
79 |
|
120 |
| Variation Q3 23 vs. Q3 22 |
|
+8% |
-2% |
-25% |
|
-14% |
| |
|
|
|
|
|
|
| Average price Q3 23 (US$/ton) |
|
1,809 |
1,639 |
939 |
|
1,283 |
| Average price Q3 22 (US$/ton) |
|
2,232 |
2,541 |
1,067 |
|
1,496 |
| Variation Q3 23 vs. Q3 22 |
|
-19% |
-36% |
-12% |
|
-14% |
Note: 1 Includes
Propylene.
Total
volume sold decreased by 14% vs. Q3 22, reaching 102 thousand
tons, mainly explained by lower sales of reforming products in the local market, partially offset by higher styrene and polystyrene sales
and a rise in local demand for SBR. Notably, in Q3 22, the SBR domestic market was affected by a labor dispute among tire manufacturing
companies.
In
Q3 23, financial results reached a net profit of US$3 million,
25% lower than the US$4 million recorded in Q3 22, explained by losses from holding financial securities, partially offset by higher net
gains due to the AR$ devaluation over payables.
| | | Pampa Energía ● Earnings release Q3 23 ● 16 |
| 3.5 | Analysis of the holding
and others segment |
Holding and others segment, consolidated
Figures in US$ million |
|
Nine-month period |
|
Third quarter |
| |
2023 |
2022 |
∆% |
|
2023 |
2022 |
∆% |
| Sales revenue |
|
11 |
16 |
-31% |
|
3 |
4 |
-25% |
| Domestic sales |
|
11 |
16 |
-31% |
|
3 |
4 |
-25% |
| |
|
|
|
|
|
|
|
|
| Gross profit |
|
11 |
16 |
-31% |
|
3 |
4 |
-25% |
| |
|
|
|
|
|
|
|
|
| Administrative expenses |
|
(34) |
(24) |
+42% |
|
(12) |
(10) |
+20% |
| Other operating income |
|
1 |
6 |
-83% |
|
- |
1 |
-100% |
| Other operating expenses |
|
(16) |
(6) |
+167% |
|
(9) |
(2) |
NA |
| Impairment of financial assets |
|
(4) |
(4) |
- |
|
(1) |
(1) |
- |
| Recovery from impair. (Impairment) of intangible assets |
|
2 |
(5) |
NA |
|
- |
1 |
-100% |
| Income from the sale of associates |
|
1 |
- |
NA |
|
1 |
- |
NA |
| Results for participation in joint businesses |
|
33 |
33 |
- |
|
4 |
10 |
-60% |
| |
|
|
|
|
|
|
|
|
| Operating income |
|
(6) |
16 |
NA |
|
(14) |
3 |
NA |
| |
|
|
|
|
|
|
|
|
| Finance income |
|
5 |
8 |
-38% |
|
2 |
2 |
- |
| Finance costs |
|
(37) |
(21) |
+76% |
|
(10) |
(11) |
-9% |
| Other financial results |
|
157 |
58 |
+171% |
|
55 |
46 |
+20% |
| Financial results, net |
|
125 |
45 |
+178% |
|
47 |
37 |
+27% |
| |
|
|
|
|
|
|
|
|
| Profit before tax |
|
119 |
61 |
+95% |
|
33 |
40 |
-18% |
| |
|
|
|
|
|
|
|
|
| Income tax |
|
(14) |
(6) |
+133% |
|
(8) |
(5) |
+60% |
| |
|
|
|
|
|
|
|
|
| Net income for the period |
|
105 |
55 |
+91% |
|
25 |
35 |
-29% |
| |
|
|
|
|
|
|
|
|
| Adjusted EBITDA |
|
52 |
97 |
-47% |
|
6 |
21 |
-72% |
| |
|
|
|
|
|
|
|
|
| Increases in PPE |
|
4 |
3 |
+33% |
|
1 |
1 |
- |
| Depreciation and amortization |
|
- |
- |
NA |
|
- |
- |
NA |
The
holding and others segment, without considering the affiliates’ equity income (Transener and TGS), posted a US$10 million operating
loss in Q3 23, while in Q3 22, it was a US$7 million loss, mainly explained by the share price
performance impacting the executive compensation plan and lower income from the arbitration award in Ecuador.
In
Q3 23, financial results reached a net gain of US$47 million
vs. US$37 million in Q3 22, mainly due to higher net profits from the devaluation of fiscal liabilities in AR$.
The
adjusted EBITDA of our holding and others segment decreased
by 72%, recording US$6 million in Q3 23. The adjusted EBITDA excludes the equity income from our participation in TGS and Transener. In
turn, it adds the EBITDA adjusted by equity ownership in these businesses. Besides, it excludes the impairment of intangible assets in
Q3 22.
In
TGS, the EBITDA adjusted by our stake was US$21 million
in Q3 23 vs. US$26 million in Q3 22. The decline was mainly due to a drop in international reference prices for natural gas liquids, lower
exported propane volumes and, to a lesser extent, the impact of AR$ devaluation on the regulated business. However, these effects were
partially offset by higher dispatch of ethane and midstream business income.
In
Transener, the EBITDA adjusted by our stake recorded US$4
million in Q3 23 (similar to Q3 22), mainly because the AR$ devaluation negatively impacts the regulated tariff.
| | | Pampa Energía ● Earnings release Q3 23 ● 17 |
| 3.6 | Analysis of the nine-month
period, by subsidiary and segment |
Subsidiary
In US$ million |
Nine-month period 2023 |
|
Nine-month period 2022 |
| % Pampa |
Adjusted EBITDA |
Net debt2 |
Net income3 |
|
% Pampa |
Adjusted EBITDA |
Net debt2 |
Net income3 |
| |
| Power generation segment |
|
|
|
|
|
|
|
|
|
| Diamante |
61.0% |
1 |
(0) |
2 |
|
61.0% |
3 |
(0) |
2 |
| Los Nihuiles |
52.0% |
(4) |
(0) |
(0) |
|
52.0% |
1 |
(0) |
4 |
| VAR4 |
100.0% |
15 |
0 |
9 |
|
- |
- |
- |
- |
| |
|
|
|
|
|
|
|
|
|
| Greenwind5 |
|
11 |
- |
3 |
|
|
13 |
- |
2 |
| Non-controlling stake adjustment |
|
- |
- |
- |
|
|
(7) |
- |
(1) |
| Subtotal Greenwind adjusted by ownership |
100.0% |
11 |
- |
3 |
|
50.0% |
7 |
- |
1 |
| |
|
|
|
|
|
|
|
|
|
| CTBSA |
|
74 |
270 |
17 |
|
|
63 |
241 |
86 |
| Non-controlling stake adjustment |
|
(37) |
(135) |
(9) |
|
|
(31) |
(120) |
(43) |
| Subtotal CTBSA adjusted by ownership |
50.0% |
37 |
135 |
9 |
|
50.0% |
31 |
120 |
43 |
| |
|
|
|
|
|
|
|
|
|
| Pampa stand-alone, other companies, & adj.1 |
|
237 |
(256) |
287 |
|
|
268 |
82 |
149 |
| Subtotal power generation |
|
297 |
(121) |
310 |
|
|
309 |
203 |
198 |
| |
|
|
|
|
|
|
|
|
|
| Oil & gas segment |
|
|
|
|
|
|
|
|
|
| Pampa Energía |
100.0% |
291 |
934 |
16 |
|
100.0% |
275 |
846 |
53 |
| Subtotal oil & gas |
|
291 |
934 |
16 |
|
|
275 |
846 |
53 |
| |
|
|
|
|
|
|
|
|
|
| Petrochemicals segment |
|
|
|
|
|
|
|
|
|
| Pampa Energía |
100.0% |
33 |
- |
26 |
|
100.0% |
44 |
- |
38 |
| Subtotal petrochemicals |
|
33 |
- |
26 |
|
|
44 |
- |
38 |
| |
|
|
|
|
|
|
|
|
|
| Holding & others segment |
|
|
|
|
|
|
|
|
|
| Transener |
|
78 |
(39) |
35 |
|
|
47 |
(29) |
15 |
| Non-controlling stake adjustment |
|
(57) |
29 |
(26) |
|
|
(35) |
21 |
(11) |
| Subtotal Transener adjusted by ownership |
26.3% |
20 |
(10) |
9 |
|
26.3% |
12 |
(8) |
4 |
| |
|
|
|
|
|
|
|
|
|
| TGS |
|
257 |
82 |
88 |
|
|
332 |
257 |
156 |
| Non-controlling stake adjustment |
|
(184) |
(59) |
(63) |
|
|
(235) |
(182) |
(110) |
| Subtotal TGS adjusted by ownership |
27.9% |
73 |
23 |
25 |
|
29.3% |
97 |
75 |
46 |
| |
|
|
|
|
|
|
|
|
|
| Pampa stand-alone, other companies, & adj.1 |
|
(42) |
(0) |
71 |
|
|
(13) |
(1) |
5 |
| Subtotal holding & others |
|
52 |
12 |
105 |
|
|
97 |
67 |
55 |
| |
|
|
|
|
|
|
|
|
|
| Deletions |
|
- |
(148) |
- |
|
|
(1) |
(188) |
(1) |
| Total consolidated |
|
672 |
677 |
457 |
|
|
724 |
927 |
343 |
| At our share ownership |
|
659 |
824 |
457 |
|
|
723 |
1,115 |
343 |
Note: 1
The deletions correspond to other companies or inter-companies. 2 Net debt includes holding companies and debt repurchases. 3
Attributable to the Company’s shareholders. 4 Acquired on December 16, 2022. 5 Consolidated in Pampa’s FS from
August 2022 to July 2023.
| | | Pampa Energía ● Earnings release Q3 23 ● 18 |
| 3.7 | Analysis of the quarter,
by subsidiary and segment |
Subsidiary
In US$ million |
Q3 23 |
|
Q3 22 |
| % Pampa |
Adjusted EBITDA |
Net debt2 |
Net income3 |
|
% Pampa |
Adjusted EBITDA |
Net debt2 |
Net income3 |
| |
| Power generation segment |
|
|
|
|
|
|
|
|
|
| Diamante |
61.0% |
1 |
(0) |
1 |
|
61.0% |
0 |
(0) |
0 |
| Los Nihuiles |
52.0% |
(1) |
(0) |
(0) |
|
52.0% |
0 |
(0) |
1 |
| VAR4 |
100.0% |
5 |
0 |
3 |
|
- |
- |
- |
- |
| |
|
|
|
|
|
|
|
|
|
| Greenwind4 |
|
2 |
- |
(0) |
|
|
2 |
- |
1 |
| Non-controlling stake adjustment |
|
- |
- |
- |
|
|
(1) |
- |
(0) |
| Subtotal Greenwind adjusted by ownership |
100.0% |
2 |
- |
(0) |
|
50.0% |
1 |
- |
0 |
| |
|
|
|
|
|
|
|
|
|
| CTBSA |
|
32 |
270 |
7 |
|
|
4 |
241 |
19 |
| Non-controlling stake adjustment |
|
(16) |
(135) |
(4) |
|
|
(2) |
(120) |
(10) |
| Subtotal CTBSA adjusted by ownership |
50.0% |
16 |
135 |
4 |
|
50.0% |
2 |
120 |
10 |
| |
|
|
|
|
|
|
|
|
|
| Pampa stand-alone, other companies, & adj.1 |
|
74 |
(256) |
106 |
|
|
86 |
82 |
108 |
| Subtotal power generation |
|
91 |
(121) |
110 |
|
|
89 |
203 |
119 |
| |
|
|
|
|
|
|
|
|
|
| Oil & gas segment |
|
|
|
|
|
|
|
|
|
| Pampa Energía |
100.0% |
132 |
934 |
2 |
|
100.0% |
117 |
846 |
5 |
| Subtotal oil & gas |
|
132 |
934 |
2 |
|
|
117 |
846 |
5 |
| |
|
|
|
|
|
|
|
|
|
| Petrochemicals segment |
|
|
|
|
|
|
|
|
|
| Pampa Energía |
100.0% |
16 |
- |
15 |
|
100.0% |
19 |
- |
19 |
| Subtotal petrochemicals |
|
16 |
- |
15 |
|
|
19 |
- |
19 |
| |
|
|
|
|
|
|
|
|
|
| Holding & others segment |
|
|
|
|
|
|
|
|
|
| Transener |
|
14 |
(39) |
5 |
|
|
12 |
(29) |
2 |
| Non-controlling stake adjustment |
|
(10) |
29 |
(3) |
|
|
(9) |
21 |
(1) |
| Subtotal Transener adjusted by ownership |
26.3% |
4 |
(10) |
1 |
|
26.3% |
3 |
(8) |
1 |
| |
|
|
|
|
|
|
|
|
|
| TGS |
|
75 |
82 |
13 |
|
|
88 |
257 |
37 |
| Non-controlling stake adjustment |
|
(54) |
(59) |
(9) |
|
|
(62) |
(182) |
(26) |
| Subtotal TGS adjusted by ownership |
27.9% |
21 |
23 |
4 |
|
29.3% |
26 |
75 |
11 |
| |
|
|
|
|
|
|
|
|
|
| Pampa stand-alone, other companies, & adj.1 |
|
(19) |
(0) |
20 |
|
|
(8) |
(1) |
24 |
| Subtotal holding & others |
|
6 |
12 |
25 |
|
|
21 |
67 |
35 |
| |
|
|
|
|
|
|
|
|
|
| Deletions |
|
- |
(148) |
- |
|
|
- |
(188) |
- |
| Total consolidated |
|
244 |
677 |
152 |
|
|
246 |
927 |
178 |
| At our share ownership |
|
250 |
824 |
152 |
|
|
246 |
1,115 |
178 |
Note:
1 The deletion corresponds to other companies or inter-companies. 2 Net debt
includes holding companies and debt repurchases. 3 Attributable to the Company’s shareholders. 4 Consolidated in Pampa’s
FS from August 2022 to July 2023.
| | | Pampa Energía ● Earnings release Q3 23 ● 19 |
| 4.1 | Power generation’s
main operational KPIs |
Power generation's
key performance indicators |
|
Hydroelectric |
|
Wind |
|
Subtotal
hydro
+wind |
Thermal |
|
Total |
| |
HINISA |
HIDISA |
HPPL |
|
PEMC1 |
PEPE2 |
PEPE3 |
PEPE42 |
PEA3 |
|
CTLL |
CTG |
CTP |
CPB |
CTPP |
CTIW |
CTGEBA |
Eco-
Energía |
CTEB4 |
Subtotal
thermal |
|
| Installed capacity (MW) |
|
265 |
388 |
285 |
|
- |
53 |
53 |
81 |
100 |
|
1,225 |
780 |
361 |
30 |
620 |
100 |
100 |
1,253 |
14 |
848 |
4,107 |
|
5,332 |
| New capacity (MW) |
|
- |
- |
- |
|
- |
53 |
53 |
81 |
100 |
|
287 |
184 |
100 |
- |
- |
100 |
100 |
565 |
14 |
279 |
1,343 |
|
1,630 |
| Market share |
|
0.6% |
0.9% |
0.7% |
|
0.0% |
0.1% |
0.1% |
0.2% |
0.2% |
|
2.8% |
1.8% |
0.8% |
0.1% |
1.4% |
0.2% |
0.2% |
2.9% |
0.03% |
2.0% |
9.5% |
|
12.3% |
| |
|
|
|
|
|
|
|
|
|
|
|
|
|
|
|
|
|
|
|
|
|
|
|
|
| Nine-month period |
|
|
|
|
|
|
|
|
|
|
|
|
|
|
|
|
|
|
|
|
|
|
|
|
| Net generation 9M23 (GWh) |
|
286 |
238 |
726 |
|
193 |
159 |
162 |
180 |
219 |
|
2,162 |
3,882 |
119 |
46 |
583 |
251 |
243 |
5,563 |
53 |
3,061 |
13,800 |
|
15,963 |
| Market share |
|
0.3% |
0.2% |
0.7% |
|
0.2% |
0.2% |
0.2% |
0.2% |
0.21% |
|
2.0% |
3.7% |
0.1% |
0.0% |
0.6% |
0.2% |
0.2% |
5.3% |
0.0% |
2.9% |
13.0% |
|
15.1% |
| Sales 9M23 (GWh) |
|
287 |
238 |
726 |
|
193 |
159 |
162 |
180 |
219 |
|
2,163 |
3,882 |
374 |
46 |
583 |
251 |
243 |
6,106 |
110 |
3,060 |
14,655 |
|
16,818 |
| |
|
|
|
|
|
|
|
|
|
|
|
|
|
|
|
|
|
|
|
|
|
|
|
|
| Net generation 9M22 (GWh) |
|
257 |
202 |
429 |
|
290 |
174 |
191 |
- |
- |
|
1,543 |
3,889 |
198 |
34 |
822 |
280 |
253 |
5,572 |
55 |
490 |
11,594 |
|
13,136 |
| Variation 9M23 vs. 9M22 |
|
+11% |
+17% |
+69% |
|
-33% |
-9% |
-15% |
na |
na |
|
+40% |
-0% |
-40% |
+34% |
-29% |
-10% |
-4% |
-0% |
-4% |
na |
+19% |
|
+22% |
| Sales 9M22 (GWh) |
|
257 |
203 |
429 |
|
290 |
193 |
191 |
- |
- |
|
1,562 |
3,889 |
369 |
34 |
822 |
280 |
253 |
6,182 |
117 |
490 |
12,437 |
|
13,999 |
| |
|
|
|
|
|
|
|
|
|
|
|
|
|
|
|
|
|
|
|
|
|
|
|
|
| Avg. price 9M23 (US$/MWh) |
|
23 |
37 |
12 |
|
70 |
75 |
68 |
68 |
80 |
|
42 |
19 |
76 |
30 |
40 |
114 |
93 |
38 |
39 |
30 |
35 |
|
35 |
| Avg. price 9M22 (US$/MWh) |
|
28 |
44 |
18 |
|
69 |
75 |
67 |
67 |
na |
|
45 |
19 |
74 |
48 |
36 |
104 |
92 |
41 |
43 |
na |
42 |
|
42 |
| Avg. gross margin 9M23 (US$/MWh) |
0 |
14 |
4 |
|
59 |
56 |
63 |
63 |
69 |
|
29 |
15 |
26 |
6 |
7 |
91 |
71 |
20 |
13 |
23 |
21 |
|
22 |
| Avg. gross margin 9M22 (US$/MWh) |
|
5 |
17 |
6 |
|
59 |
54 |
58 |
58 |
na |
|
29 |
11 |
28 |
17 |
13 |
83 |
69 |
22 |
19 |
126 |
25 |
|
25 |
| |
|
|
|
|
|
|
|
|
|
|
|
|
|
|
|
|
|
|
|
|
|
|
|
|
| |
|
|
|
|
|
|
|
|
|
|
|
|
|
|
|
|
|
|
|
|
|
|
|
|
| Third quarter |
|
|
|
|
|
|
|
|
|
|
|
|
|
|
|
|
|
|
|
|
|
|
|
|
| Net generation Q3 23 (GWh) |
|
74 |
84 |
439 |
|
28 |
57 |
57 |
97 |
77 |
|
912 |
1,211 |
34 |
10 |
- |
42 |
29 |
1,558 |
23 |
1,167 |
4,073 |
|
4,985 |
| Market share |
|
0.2% |
0.2% |
1.2% |
|
0.1% |
0.2% |
0.2% |
0.3% |
0.22% |
|
2.6% |
3.4% |
0.1% |
0.0% |
- |
0.1% |
0.1% |
4.4% |
0.1% |
3.3% |
11.4% |
|
14.0% |
| Sales Q3 23 (GWh) |
|
74 |
84 |
439 |
|
28 |
57 |
57 |
97 |
77 |
|
912 |
1,211 |
101 |
9 |
- |
42 |
29 |
1,739 |
42 |
1,167 |
4,340 |
|
5,252 |
| |
|
|
|
|
|
|
|
|
|
|
|
|
|
|
|
|
|
|
|
|
|
|
|
|
| Net generation Q3 22 (GWh) |
|
95 |
59 |
138 |
|
94 |
55 |
64 |
- |
- |
|
504 |
1,291 |
16 |
8 |
209 |
97 |
81 |
1,489 |
17 |
55 |
3,263 |
|
3,767 |
| Variation Q3 23 vs. Q3 22 |
|
-22% |
+41% |
na |
|
-71% |
+4% |
-10% |
na |
na |
|
+81% |
-6% |
+114% |
+17% |
-100% |
-57% |
-64% |
+5% |
+35% |
na |
+25% |
|
+32% |
| Sales Q3 22 (GWh) |
|
95 |
60 |
138 |
|
94 |
59 |
64 |
- |
- |
|
510 |
1,290 |
77 |
8 |
209 |
97 |
81 |
1,678 |
37 |
55 |
3,532 |
|
4,042 |
| |
|
|
|
|
|
|
|
|
|
|
|
|
|
|
|
|
|
|
|
|
|
|
|
|
| Avg. price Q3 23 (US$/MWh) |
|
25 |
31 |
8 |
|
71 |
68 |
69 |
69 |
80 |
|
34 |
16 |
85 |
43 |
na |
na |
na |
46 |
35 |
31 |
39 |
|
38 |
| Avg. price Q3 22 (US$/MWh) |
|
25 |
42 |
18 |
|
69 |
80 |
66 |
66 |
na |
|
45 |
17 |
124 |
65 |
47 |
101 |
96 |
51 |
49 |
145 |
44 |
|
44 |
| Avg. gross margin Q3 23 (US$/MWh) |
(10) |
12 |
4 |
|
57 |
42 |
64 |
64 |
69 |
|
23 |
12 |
24 |
8 |
na |
na |
na |
23 |
9 |
26 |
23 |
|
23 |
| Avg. gross margin Q3 22 (US$/MWh) |
|
4 |
8 |
5 |
|
59 |
51 |
54 |
54 |
na |
|
27 |
11 |
33 |
23 |
16 |
80 |
74 |
27 |
22 |
70 |
24 |
|
24 |
Note: Gross margin
before amortization and depreciation 1 Fully owned by Pampa from August 2022 to July 2023. 2 Acquired on December 16, 2022.
3 Operated by Pampa (50% equity stake).
| | | Pampa Energía ● Earnings release Q3 23 ● 20 |
| 4.2 | Production in the main oil
and gas blocks |
| In kboe/day at ownership |
|
Nine-month period |
|
Third quarter |
| 2023 |
2022 |
Variation |
2023 |
2022 |
Variation |
| Gas |
|
|
|
|
|
|
|
|
| El Mangrullo |
|
38.4 |
42.4 |
-9% |
|
43.8 |
47.7 |
-8% |
| Río Neuquén |
|
9.2 |
8.7 |
+6% |
|
9.6 |
8.6 |
+12% |
| Sierra Chata |
|
13.4 |
4.0 |
+231% |
|
19.8 |
3.7 |
+435% |
| Rincón del Mangrullo1 |
|
1.5 |
2.1 |
-30% |
|
1.4 |
1.8 |
-23% |
| Others |
|
1.1 |
1.2 |
-5% |
|
1.0 |
1.2 |
-16% |
| Total gas at working interest |
|
63.5 |
58.4 |
+9% |
|
75.7 |
63.0 |
+20% |
| |
|
|
|
|
|
|
|
|
| Oil |
|
|
|
|
|
|
|
|
| El Tordillo2 |
|
2.1 |
2.6 |
-20% |
|
1.8 |
2.7 |
-32% |
| Gobernador Ayala |
|
1.1 |
1.1 |
+7% |
|
1.1 |
1.2 |
-2% |
| Associated oil3 |
|
1.1 |
1.0 |
+8% |
|
1.1 |
1.1 |
+4% |
| Others |
|
0.6 |
0.5 |
+23% |
|
0.6 |
0.6 |
+8% |
| Total gas at working interest |
|
5.0 |
5.2 |
-5% |
|
4.7 |
5.5 |
-14% |
| |
|
|
|
|
|
|
|
|
| Total |
|
68.5 |
63.6 |
+8% |
|
80.4 |
68.5 |
+17% |
Note:
Production in Argentina. 1 It does not include shale formation. 2 It includes the La Tapera – Puesto Quiroga block.
3 From gas fields.
| | | Pampa Energía ● Earnings release Q3 23 ● 21 |
| Term |
Definition |
| 9M23/9M22 |
First nine months of 2023/First nine months of 2022 |
| ADR/ADS |
American Depositary Receipt |
| AR$ |
Argentine Pesos |
| Bbl |
Barrel |
| Boe |
Barrels of oil equivalent |
| ByMA |
Bolsas y Mercados Argentinos (Buenos Aires Stock Exchange) |
| CAMMESA |
Compañía Administradora del Mercado Mayorista Eléctrico S.A.(Argentine Wholesale Electricity Market Clearing Company) |
| CB |
Corporate Bonds |
| CCGT |
Combined Cycle |
| CCL |
An AR$ security settled in foreign markets |
| CENCH |
Concesión de explotación no convencional de hidrocarburos (Unconventional Hydrocarbon Exploitation Concession) |
| CNY |
Chinese Yuan |
| CPB |
Piedra Buena Thermal Power Plant |
| CTBSA |
CT Barragán S.A. |
| CTEB |
Ensenada Barragán Thermal Power Plant |
| CTG |
Güemes Thermal Power Plant |
| CTGEBA |
Genelba Thermal Power Plant |
| CTIW |
Ingeniero White Thermal Power Plant |
| CTLL |
Loma De La Lata Thermal Power Plant |
| CTP |
Piquirenda Thermal Power Plant |
| CTPP |
Parque Pilar Thermal Power Plant |
| DoP |
Deliver or Pay |
| E&P |
Exploration and Production |
| EBITDA |
Earnings before interest, tax, depreciation and amortization |
| EcoEnergía |
EcoEnergía Co-Generation Power Plant |
| ENARGAS |
Ente Nacional Regulador del Gas (National Gas Regulatory Entity) |
| ENARSA |
Energía Argentina S.A. (former Integración Energética Argentina S.A.) |
| Energía Plus |
Energía Plus Program, SE Res. No. 1,281/06 |
| ENRE |
Ente Nacional Regulador de la Electricidad (National Electricity Regulatory Entity) |
| FS |
Financial Statements |
| FX |
Nominal exchange rate |
| GO |
Gas Oil |
| GPNK |
Presidente Néstor Kirchner Gas Pipeline |
| Greenwind |
Greenwind S.A. |
| GT |
Gas turbine |
| GWh |
Gigawatt-hour |
| HIDISA |
Diamante Hydro Power Plant |
| HINISA |
Los Nihuiles Hydro Power Plant |
| HPPL |
Pichi Picún Leufú Hydro Power Plant |
| IFRS |
International Financial Reporting Standards |
| Kbbl/kboe |
Thousands of barrels/thousands of barrels of oil equivalent |
| M3 |
Cubic meters |
| MAT ER |
Term Market from Renewable Energy Sources |
| MBTU |
Million British Thermal Units |
| MW/MWh |
Megawatt/Megawatt-hour |
| | | Pampa Energía ● Earnings release Q3 23 ● 22 |
| Term |
Definition |
| N.a. |
Not applicable |
| O/S |
Share ownership |
| Pampa / The Company |
Pampa Energía S.A. |
| PEA |
Arauco II Wind Farm, stage 1 and 2 |
| PEMC |
Ingeniero Mario Cebreiro Wind Farm |
| PEPE |
Pampa Energía Wind Farm |
| Plan Gas.Ar |
Re-assurance and Strengthening of the Federal Hydrocarbon Production through Self-Supply, Exports, Replacement of Imports and the Expansion of the Transportation System to All the Country’s Hydrocarbon Basins 2023 – 2028 Plan (Executive Order No. 730/22) and the Argentine Natural Gas Production Promotion Plan – 2020 – 2024 Supply and Demand Scheme (Emergency Executive Order No. 892/20 and supplementary provisions) |
| PPA |
Power Purchase Agreement |
| PPE |
Property, Plant and Equipment |
| Q2 23 |
Second quarter of 2023 |
| Q3 23/Q3 22 |
Third quarter of 2023/Third quarter of 2022 |
| Res. |
Resolution/Resolutions |
| SE |
Secretariat of Energy |
| ST |
Steam turbine |
| TGS |
Transportadora de Gas del Sur S.A. |
| Ton |
Metric ton |
| ToP |
Take or Pay |
| Transba |
Empresa de Transporte de Energía Eléctrica
por Distribución Troncal de la Provincia de Buenos Aires
Transba S.A. |
| Transener |
Compañía de Transporte de Energía Eléctrica en Alta Tensión Transener S.A. |
| US$ |
U.S. Dollars |
| US$-link |
A security in which the underlying is linked to US$ wholesale exchange rate |
| US$-MEP |
A security in which the settlement uses US$ in the domestic market |
| UVA |
Unidad de Valor Adquisitivo (Purchasing power unit) |
| | | Pampa Energía ● Earnings release Q3 23 ● 23 |
Pampa Energia (NYSE:PAM)
Gráfica de Acción Histórica
De Mar 2024 a Abr 2024

Pampa Energia (NYSE:PAM)
Gráfica de Acción Histórica
De Abr 2023 a Abr 2024
