UNITED STATES
SECURITIES AND EXCHANGE COMMISSION
Washington, D.C. 20549
FORM N-CSR
CERTIFIED SHAREHOLDER REPORT OF REGISTERED
MANAGEMENT
INVESTMENT COMPANIES
Investment Company Act file number 811-23248
Ecofin Sustainable and Social Impact Term Fund
(Exact name of registrant as specified in charter)
6363 College Boulevard, Suite 100A, Overland
Park, KS 66211
(Address of principal executive offices) (Zip code)
Matthew G.P. Sallee
Diane Bono
6363 College Boulevard, Suite 100A, Overland
Park, KS 66211
(Name and address of agent for service)
913-981-1020
Registrant’s telephone number, including area code
Date of fiscal year end: November 30
Date of reporting period: May 31, 2024
Item 1. Report to Stockholders.
(a) Report pursuant to Rule 30e-1

Semi-Annual Report | May
31, 2024
2024 Semi-Annual Report
Closed-End Funds

Tortoise
2024 Semi-Annual Report to Stockholders
This combined report provides you
with a comprehensive review of our funds that span essential assets.
TTP and TPZ distribution policies
Tortoise Pipeline & Energy Fund, Inc. (“TTP”)
and Tortoise Power and Energy Infrastructure Fund, Inc. (“TPZ”) are relying on exemptive relief permitting them to make long-term
capital gain distributions throughout the year. Each of TTP and TPZ, with approval of its Board of Directors (the “Board”),
has adopted a managed distribution policy (the “Policy”). Annual distribution amounts are expected to fall in the range of
7% to 10% of the average week-ending net asset value (“NAV”) per share for the prior fiscal semi-annual period. In accordance
with its Policy, TTP distributes a fixed amount per common share, currently $0.59, each quarter to its common shareholders. TPZ distributes
a fixed amount per common share, currently $0.105, each month to its common shareholders. These amounts are subject to change from time
to time at the discretion of the Board. Although the level of distributions is independent of TTP’s and TPZ’s performance,
TTP and TPZ expect such distributions to correlate with its performance over time. Each quarterly and monthly distribution to shareholders
is expected to be at the fixed amount established by the Board, except for extraordinary distributions in light of TTP’s and TPZ’s
performance for the entire calendar year and to enable TTP and TPZ to comply with the distribution requirements imposed by the Internal
Revenue Code. The Board may amend, suspend or terminate the Policy without prior notice to shareholders if it deems such action to be
in the best interests of TTP, TPZ and their respective shareholders. For example, the Board might take such action if the Policy had the
effect of shrinking TTP’s or TPZ’s assets to a level that was determined to be detrimental to TTP or TPZ shareholders. The
suspension or termination of the Policy could have the effect of creating a trading discount (if TTP’s or TPZ’s stock is trading
at or above net asset value), widening an existing trading discount, or decreasing an existing premium. You should not draw any conclusions
about TTP’s or TPZ’s investment performance from the amount of the distribution or from the terms of TTP’s or TPZ’s
distribution policy. Each of TTP and TPZ estimates that it has distributed more than its income and net realized capital gains; therefore,
a portion of your distribution may be a return of capital. A return of capital may occur, for example, when some or all of the money that
you invested in TTP or TPZ is paid back to you. A return of capital distribution does not necessarily reflect TTP’s or TPZ’s
investment performance and should not be confused with “yield” or “income.” The amounts and sources of distributions
reported are only estimates and are not being provided for tax reporting purposes. The actual amounts and sources of the amounts for tax
reporting purposes will depend upon TTP’s and TPZ’s investment experience during their fiscal year and may be subject to changes
based on tax regulations. TTP and TPZ will send you a Form 1099-DIV for the calendar year that will tell you how to report these distributions
for federal income tax purposes.
2024 Semi-Annual Report | May 31, 2024
| Closed-end Fund Comparison |
| |
Name/Ticker |
Primary
focus |
Structure |
Total
Assets
($ millions)(1) |
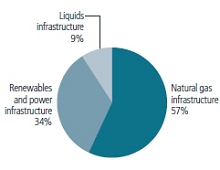
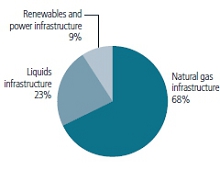
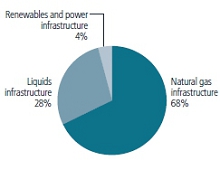
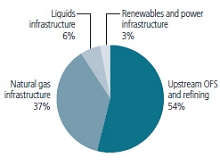
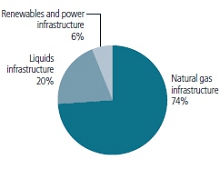
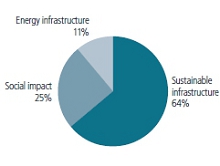
Portfolio mix
by asset type(1) |
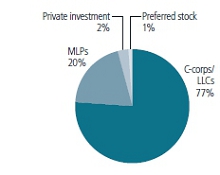
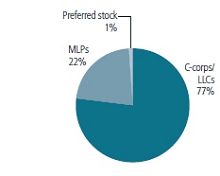
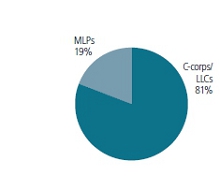
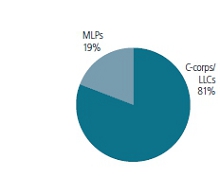
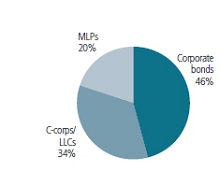
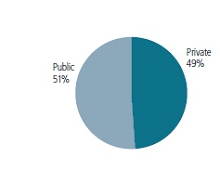
Portfolio mix
by structure(1) |
 |
Tortoise Energy Infrastructure Corp.
NYSE: TYG
Inception: 2/2004 |
Energy Infrastructure |
Regulated investment company |
$563.9 |
 |
 |
|
Tortoise Midstream Energy Fund, Inc.
NYSE: NTG
Inception: 7/2010 |
Natural Gas Infrastructure |
Regulated investment company |
$310.1 |
 |
 |
|
Tortoise Pipeline
& Energy Fund, Inc.
NYSE: TTP
Inception: 10/2011 |
North
American
pipeline
companies |
Regulated investment company |
$96.6 |
 |
 |
 |
Tortoise Energy Independence
Fund, Inc.
NYSE: NDP
Inception: 7/2012 |
North
American
oil & gas
producers |
Regulated investment company |
$76.6 |
 |
 |
 |
Tortoise Power
and Energy Infrastructure
Fund, Inc.
NYSE: TPZ
Inception: 7/2009 |
Power
& energy infrastructure companies
(Fixed income
& equity) |
Regulated investment company |
$129.2 |
 |
 |
 |
Ecofin Sustainable and Social Impact Term Fund
NYSE: TEAF
Inception: 3/2019 |
Essential
assets |
Regulated investment company |
$221.8 |
 |
 |
(1) As of 5/31/2024
(unaudited)
Tortoise
2024 Semi-Annual Report to closed-end fund stockholders
Dear stockholder,
The fiscal semi-annual period that included the start
of 2024 for the energy sector was a good one. Overall performance was positive, and it offered a constructive supply and demand environment,
capital allocation discipline, and negligible policy implications. While geopolitical turmoil continued in both Ukraine and Israel, the
energy sector sustained flows from areas of supply to demand centers. The Organization of the Petroleum Exporting Countries Plus (OPEC+)
remained constant in their goal to balance crude oil markets. And providing a boost to visibility on longer-term crude oil and natural
gas demand, electric vehicle sales slowed, and artificial intelligence’s (AI) energy demand needs became clearer. The sector’s
essentialness to global economic growth stayed ever apparent.
Energy and power infrastructure
The broad energy sector, as represented by the S&P
Energy Select Sector Index®, returned 12.2% for the first half of the 2024 fiscal year. Energy company management teams
by and large remain committed to returning cash flow to shareholders in the form of higher dividends and share buybacks, while maintaining
strong balance sheets. Along those same lines, mergers and acquisitions (M&A), while elevated, remained disciplined in terms of price
paid and the complementary nature of assets acquired. Further aiding the sector were constructive crude oil prices, gross domestic product
(GDP) growth leading to more energy demand, softness in electric vehicle sales, and AI related data centers hunger for more energy. Less
helpful for the sector were low natural gas prices due to warm winter weather and concerns about a slowing economy.
OPEC+ continued to balance global crude oil supply
with demand by extending two million barrels per day (bpd) of production curtailments through September of 2024, before gradually phasing
them out. This discipline led to modest oil inventory draws and a constructive crude oil price near $80 and $85 per barrel for West Texas
Intermediate (WTI) and Brent at the end of May, respectively. That said, tensions in the Middle East stemming from the Israeli and Hamas
conflict along with the war between Russia and Ukraine kept concerns about a supply shock top of mind. Oil transport was disrupted, yet
oil continued to find a home even if routes were not the most efficient. Oil demand continued to grow due to a resilient global economy.
Average 2024 demand growth over 2023 using forecasts from the International Energy Agency (IEA), Energy Information Administration (EIA)
and OPEC is 1.5 million barrels per day (bpd), with 2025 levels also higher by over 1 million bpd. Over the longer-term, less optimism
over electric vehicle (EV) penetration following slower sales in the U.S., Europe, and China is leading to a view that gasoline and diesel
demand will not peak before 2030. Petrochemical and jet products that make up over 50% of crude oil demand have even firmer growth prospects
over the next 20 years.
U.S. crude oil production growth carries on. According
to the EIA, U.S. crude oil production rebounded in the second quarter to 13.2 million bpd from the first quarter when harsh winter weather
reduced levels to 12.9 million bpd. For the year, the EIA forecasts crude oil production to be 2% better than 2023 levels, and to grow
4% in 2025, averaging 13.7 million bpd. The increased production is largely from the Permian basin, the source of nearly 50% of all domestic
crude oil production. This growth is anticipated despite the lower rig count and fewer frac crews as producers are doing more with less.
Drilling laterals lengthened and completion times shortened
again. The application of AI is even resulting in improved efficiencies. And aside from labor, oilfield service and material cost inflation
are in the past.
U.S. natural gas production declined from 105.6 billion
cubic feet per day (bcf/d) in the fourth quarter of 2023 to 100.4 bcf/d in the second quarter of 2024. The reason? Relatively mild winter
weather reduced the need for natural gas to heat homes and offices, leaving supply well ahead of demand. Inventories ended the winter
withdrawal season above the five-year high. Consequently, producers reduced production to better balance supply and demand. That action
is part of the reason natural gas prices improved in May to average $2.40 per million British thermal units (mmbtu) from the March low
of $1.58 per mmbtu. The EIA forecasts that second quarter production will be the trough for 2024, with volumes improving every quarter
through year-end 2025. Weather will remain a factor, yet new U.S. liquified natural gas (LNG) export facilities are set to start coming
on-line later this year that we expect to result in more supply to meet higher natural gas demand. In fact, more LNG export facilities
will continue to come on-line in the U.S. through 2027, resulting in an almost doubling of U.S. LNG export capacity. We expect production
to keep up with these adds. This increased LNG export will meet both new Asian demand tied to economic growth and European demand as the
continent looks for more secure supplies in the face of Russia’s continuing war with Ukraine.
Natural gas liquids (NGLs) are a source of heat and
the key components in making plastics. The U.S. is the world’s largest producer of NGLs with production just under 7 million bpd,
and the largest exporter at 2.7 million bpd. A unique aspect of Permian basin oil production is that the percent of production that is
NGLs increases over time as a well depletes over time. Consequently, NGL supply is sure to grow if crude oil production increases. We
expect this increased production to nearly all be exported in part to meet Asia’s growing petrochemical demand.
The midstream energy sector, as represented by the
Alerian Midstream Energy Index (AMNA), returned 12.2% for the semi-annual fiscal period, right on top of broader energy’s gain.
Supporting the sector were good earnings reports relative to consensus, continued management discipline toward capital allocation and
M&A, and benign policy implications from Washington. We think midstream’s growing free cash flow, low leverage, and attractive
valuation provide a compelling investment backdrop.
Earnings for midstream companies over the past six
months came in at the high end of expectations following strong volumes, the robust 13% inflation tariff escalator, and isolated marketing
opportunities from wide price differentials, particularly between west Texas and the Gulf Coast. On capital allocation, healthy balance
sheets were maintained with dividend growth and share buybacks remaining a management focus. Leverage targets are now generally between
3.0x to 4.0x earnings before interest, taxes, depreciation and amortization (EBITDA) with leverage being a full “turn” lower
versus levels prior to 2020. Buybacks eclipsed $2.3 billion over the past six months and are on pace to exceed our annual buyback expectation
of $4 billion. Most notable to capital returns was Cheniere Energy’s outsized share repurchase at over $1.5 billion during the past
six months and Western Midstream’s 52% distribution boost. We expect free cash flow to increasingly be targeted at dividend growth
and opportunistic share repurchases.
(unaudited)
2024 Semi-Annual Report | May 31, 2024
Midstream companies remained active in M&A with
two notable corporate transactions. First, Sunoco LP (SUN) agreed to acquire NuStar Energy (NS), a liquids pipeline company, in an all-stock
transaction at a 24% premium. Then, EQT Corp (EQT), a large natural gas producer, entered an agreement to acquire Equitrans Midstream
(ETRN), a natural gas pipeline and gathering company, in an all-stock transaction at an 18% premium. The commonality between the transactions
was the all-equity nature and vertical integration as a rationale. We do not believe vertical integration will emerge as a trend, yet
it bears watching. Midstream companies also looked to further boost their asset bases through bolt-on acquisitions from motivated private
equity sellers, with three separate deals for Permian basin gathering and processing assets topping $4.5 billion in transaction value.
Specifically, Energy Transfer agreed to acquire WTG Midstream, Kinetik bought Durango Midstream, and PSX tapped Pinnacle Midstream. Along
with being accretive, the rationale for the Permian focus and synergy is the ability for the acquirors to more fully utilize existing
infrastructure to transport increased volumes of natural gas and natural gas liquids to the demand and export center along the Gulf Coast.
It was not all buying though. Companies also divested non-core assets, with Kinetik selling its interest in Gulf Coast Express and PSX
dealing its position in Rockies Express. We believe complementary asset acquisitions combined with the pruning of non-core assets will
continue through the remainder of the year and continue to serve investors well. Speaking of non-core assets, look for TC Energy to complete
the announced spin-off of its liquids business, South Bow Corporation (SOBO), in the second half of this year.
The outsized buildout of datacenters to support AI
is resulting in meaningful electricity growth in the U.S. after years of relatively stable demand. Further, data centers require a continuous
and reliable power supply to ensure uninterrupted operations. We believe that renewables will play a role, yet neither solar nor wind
are completely reliable. For that reason, we think natural gas is the best reliable supply source to meet this need because natural gas
is relatively low cost, abundant domestically, and cleaner than coal. This idea continued to gain traction during the quarter with AI
being mentioned countless times on energy conference calls. We estimate AI power demand growth could require an additional 7 to 16 bcf/d
of U.S. natural gas production to meet electricity demand from data centers. We expect this to benefit all forms of natural gas infrastructure
over the next five years. And over the more immediate time period, we believe Independent Power Producers (IPPs) will profit from their
ability to enter into power supply contracts with data centers and to supply marginal power to data centers when regulated electric utility
companies are unable to meet demand. During these time periods, IPPs benefit from outsized power prices.
While U.S. GDP growth improved 3.4% in the fourth quarter
of 2023, with further gains to start 2024, some economic signals suggest that a recession is on the horizon. This may weigh on investor
psyche until resolved. Regarding energy, while multiple recessions occurred i n the last 40 years, energy demand still increased in 38
out of the last 41 years (2008 and 2020 decreased). Following the 2020 recession, energy companies reduced capital expenditures and focused
on reducing debt levels. We believe the energy sector, and specifically midstream, is prepared to deal with a potential recession. With
the world remaining undersupplied energy over the longer-term, sector balance sheets now less levered, and management teams looking for
share repurchase opportunities, we believe energy is well positioned should slower economic growth manifest.
High inflation persisted in early 2024, though moderated
as mid-year approached. Whatever the level, midstream provided investors with inflation protection. Pipelines typically benefit from long-term
contracts where tariffs increase based on inflation levels. Further, tariffs on regulated liquids pipelines include an inflation escalator
based on the Producer Price Index. Federal Energy Regulatory Commission (FERC) indexing allowed for a tariff increase of over 13% beginning
July 1, 2023, until June 30, 2024. We estimate the cumulative total allowable tariff increase since 2020 through year-end 2024 will exceed
26%.
On the policy front, the Department of Energy (DOE)
announced a pause in its review of pending LNG export applications. The DOE wants to update its economic and environmental analysis that
underpin this review, specifically how it assesses climate change. Importantly, the pause does not affect the projects that have already
made a Final Investment Decision. The build-out of new LNG facilities through 2027 is unaffected. We expect that once the Presidential
election is over in November, the DOE will lift its pause and continue its review of pending LNG export applications. Lastly, the Mountain
Valley Pipeline (MVP) received all construction and operational permits and full authorization under the Fiscal Responsibility Act (FRA)
last year. As a reminder, MVP is a 2 bcf/d pipeline transporting natural gas from the Marcellus shale into Virginia. After several years
of delay, MVP entered operational service in June of 2024.
Sustainable infrastructure
The semi-annual period ending May 31, 2024, had financial
markets experiencing notable shifts and uncertainties, shaped by fluctuating long-term interest rates and geopolitical tensions. Initially,
from December to January, there was a pervasive sense of skepticism surrounding the growth potential of pure renewables and utilities
due to devalued stock prices that seemingly discounted growth prospects too harshly. However, amidst these challenges, there remained
optimism driven by compelling investment opportunities, particularly in sectors benefiting from decarbonization and electrification trends.
These included renewables and utilities, which saw elevated power purchase agreement prices reflecting strong demand for cleaner energy
sources in Europe and the U.S. As the period progressed, despite initial optimism, broader infrastructure sectors, including utilities,
faced significant challenges, with Europe particularly impacted by weak economic conditions and oversupply concerns in energy markets.
Conversely, the U.S. market showed resilience driven by robust demand from AI, data centers, and electric vehicles, bolstering the performance
of U.S. utilities within portfolios. By March, sentiment began to improve as expectations of lower inflation and potential policy rate
cuts emerged, although ongoing uncertainties around interest rates and energy prices continued to weigh on infrastructure valuations.
Through April and May, U.S. utilities emerged as standout
performers fueled by increasing power demand, particularly from AI and data centers, highlighting the sector’s pivotal role in supporting
technological advancements. Meanwhile, in Europe, despite lagging behind their U.S. counterparts, utilities and environmental services
groups still delivered strong performances, buoyed by rising power prices and solid earnings reports. This period also witnessed significant
corporate actions such as National Grid’s equity issuance to fund ambitious capex plans, indicative of continued investment in grid
infrastructure to support electrification and renewables growth.
(unaudited)
Looking ahead, amidst the persisting uncertainties in interest rates and
energy prices, buying opportunities remain compelling, especially in sectors poised to benefit from ongoing electrification efforts and
technological advancements. The portfolio strategy emphasizes utilities for their predictable earnings growth and the burgeoning demand
from data centers and AI applications, which prioritize reliable and clean energy sources. Furthermore, ongoing M&A activity within
the sector, fueled by substantial private equity investment, suggests potential for a re-rating of growth opportunities in listed infrastructure,
underscoring the sector’s dynamic landscape and future prospects.
Waste transition
The second quarter of 2024 featured announcements detailing
a resurgence in green and sustainable project finance activities, indicating continued support for energy and waste transition efforts,
despite the unfavorable impacts of a high interest rate environment and a relatively soft macroeconomic environment.
Per Moody’s Investors Service, the global issuance
of green, social, sustainability, and sustainability-linked bonds rose 36% in first quarter 2024 over the prior period in fourth quarter
2023. In particular, the global issuance of sustainability bonds nearly doubled over the prior quarter and increased 16% year-over-year.
And, per the non-profit Climate Bonds Initiative, the global issuance of green bonds rose 43% in Q1 2024 over the prior period in Q4 2023
and is predicted to total $1 trillion for the full year in 2024. U.S. issuers typically account for the largest geographical share and
represented slightly more than 14% of Q1 2024 global green bond issuance. While sustainability bonds and green bonds are typically issued
on a public, rated basis, a similar trend in increased issuance has been anecdotally witnessed in the private, non-rated market as well.
In the waste-to-energy sector, there has been significant
growth in recent years in the number of projects that convert waste feedstocks into renewable natural gas, or RNG. These RNG projects
have been supported by a variety of incentives, including fuel credits provided by the federal Renewable Fuel Standard (RFS) and the California
Low Carbon Fuel Standard (LCFS), and by investment tax credits via the Inflation Reduction Act. Because there is substantial growth potential
for RNG, which provides a meaningful decarbonization of transportation fuels, there continue to be efforts to encourage more RNG production
in the U.S. In May of 2024, the U.S. Senate introduced the Renewable Natural Gas Incentive Act, which if enacted into law would provide
a $1 per gallon tax credit for RNG produced and sold as a transportation fuel. Such a per-gallon incentive would put RNG on a more level
playing field with Renewable Diesel and Sustainable Aviation Fuel, which each already receive a similar per-gallon production incentive.
In the waste-to-value sector, there has been increased
focus on eliminating PFAS, also known as “forever chemicals” and contained in plastic waste, as well as Extended Producer
Responsibility laws, which have been primarily directed toward reducing plastic waste.
In April 2024, the U.S. Environmental Protection Agency
(EPA) designated two types of PFAS chemicals as Hazardous Materials. The intent of such classification is to hold polluters accountable
for the financial burden of removing or destroying PFAS. Initially, the EPA does not intend to pursue municipal landfills or municipal
water utilities in its enforcement activities. However, the Hazardous Material classification is expected to result in an industry-wide
effort to eliminate PFAS. While early in the cycle, these efforts are expected to bolster the construction of new facilities implementing
high-temperature technologies such as gasification, pyrolysis, and incineration — each of which may also be utilized for waste-to-energy
or waste-to-value purposes, in addition to PFAS destruction.
In May 2024, the state of Minnesota enacted an Extended
Producer Responsibility (EPR) law for plastics packaging waste and boat-wrap waste. Under the law, brand manufacturers are required to
pay for plastic recycling costs at an increasing rate over time - 50% of recycling costs beginning in 2029, 75% in 2030, and 90% in 2031.
Minnesota is the fifth state to enact an EPR law for plastics packaging, joining California, Colorado, Maine, and Oregon. Although a primary
goal of such EPR programs is to reduce the upfront amount of plastic waste generated, their implementation is also expected to result
in the construction of new plastics recycling facilities near major metropolitan areas.
Social impact
Education
The public market for issuance of new K-12 charter
school and private school revenue bonds year-to-date for 2024 saw similar numbers of bond issuances as the same period in 2023, but with
a much higher par value. Through May, there were 35 new issues for $1,603,130,000 as compared to 36 issues for $835,188,000 for the period
in 2023. The 2024 numbers include six specialty investor transactions for $129,965,000 versus nine transactions totaling $214,613,000
during the same period in 2023.1
The primary driver of this increase in par value was a greater number of large school portfolio
transactions. If the market follows historical trends, Q3 and Q4 should see a significant increase in transactions volume and total par
value issuance. While there were only 101 new issues representing $3.459 billion in par value in all of 2023, we believe that to be an
outlier as par value for K-12 charter school and private school bonds increased every year from 2011 to 2021 and in 21 of 27 years since
1998.1 With steady municipal bond fund inflows year-to-date ($6.7 billion inflows for 2024 vs $1.4 billion outflows for the
period in 2023)2 and the benchmark 30-year MMD daily rate far below 2023’s high of 4.57%, and Q4 2023’s average
of 4.06%,3 Ecofin expects to see total par value of over $4.0 billion for K-12 charter school and private school revenue bond
issuance in 2024.
During the period, the Equitable Facilities Fund published
their report, “2022 Charter School Bond Default Study: Default and Loss Rates Continue to Decline”, which provided valuable
bond default analysis based on data from every charter school bond issue ever completed as of December 31, 2022. Some key findings include:
| ● |
Only “94 charter schools (or their affiliates), representing 99 transactions, or 4.3% of the entire
portfolio of 2,298 transactions, have experienced a monetary default in which borrowers failed to make full and timely debt service
payments promised at the time of issuance.” |
| ● |
“Primary causes for an obligor’s inability to make scheduled debt service payments were identified as: subpar academic
results; financial stress; lower than expected enrollment; governance.” |
| ● |
A median recovery rate of 69.1% when “you combine the 59 foreclosure property sales with the refundings, bond exchanges,
and those obligors which were able to overcome the default and make all debt service payments current again.”4 |
(unaudited)
2024 Semi-Annual Report | May 31, 2024
In April, we saw the release of U.S. News & World
Report (U.S. News) 2023-2024 rankings of the best public high schools in the country. Nineteen charter schools were recognized in the
nation’s top 100 high schools, including the top two spots overall, Arizona’s BASIS Peoria (#1) and Indiana’s Signature
School in Evansville (#2). This is particularly impressive when you consider that charter schools make up only about 8% of the nation’s
public high schools.5
In addition to charter schools, other school choice options have exploded across the nation. By the end
of 2023 seven states enacted new private school choice programs and 11 states expanded existing programs. This has resulted in access
to private school choice programs for around 20 million students nationwide.6
Ten states now have universal or near-universal
private school choice programs, meaning nearly 100% of their students are eligible to participate in their state’s program. These
programs come in the form of education savings accounts, voucher programs or tax credits. Prior to 2023, only Arizona and West Virginia
had universal eligibility, but they’ve now been joined by Arkansas, Florida, Indiana, Iowa, North Carolina, Ohio, Oklahoma, and
Utah. With 30 states now providing some type of private school choice for families, it is clear that parents will continue to embrace
these popular programs and continue to drive their expansion throughout the nation.6
Across the education universe, we continue
to see an increase in both volume and credit quality of education investment opportunities through May 2024.
Senior Living
Senior living occupancy continues to improve since
the lows of COVID and our senior population is one quarter closer to outpacing the current bed supply. In fact, within one year, the first
baby boomer turns 80 years old.
In Q1 2024, the for-profit senior living sector recorded
its eleventh quarter in a row of occupancy gains. Based on the past two years of absorption, primary market occupancy recovery should
reach pre-pandemic levels in the second half of 20247. As of Q1 2024, primary market occupancy increased 0.5% to 85.6% occupied.
Non-profit senior living has fared better than their
for-profit brethren since the pandemic hit. As of Q1 2024, non-profit entrance fee continuing care retirement communities (“CCRC’s”)
were 90.6% occupied.
Occupancy recovery has been fueled by over four years
of slowing construction starts. In fact, 2023 recorded the lowest primary market inventory growth since 2005, when NIC started recording
the data. High interest rates, persistently elevated construction costs and tighter lending conditions will continue to propel occupancy
in the months to come. In Q1 2024, primary market inventory growth continued its decline to a mere 1.4% assisted living units and 1.2%
independent living units. Given the incredibly low units under construction, the market is setting up for a severe supply and demand imbalance
just as the baby boomer population is knocking on the doorstep.
The stark reality is that given the current pace of
new senior living development, our country will only supply 40% of the projected demand by 2030. That is an extraordinary shortfall which
would require more than $275 billion of investment over the next few years to close the projected demand gap. To put that in context,
based on a current development pace of 26,000 new units annually, the industry would need to be running at more than triple the pace to
meet the future demand. 7
Anecdotally, NIC Map Vision recently published their Senior Housing Market Outlook, which highlighted
the concerning need for significant senior housing growth to keep pace with the unprecedented baby boomer deluge projected in 2027. The
timing couldn’t be better as, operationally, most communities have weathered the COVID storm and are showing rent growth and labor
market normalization which has led to margin expansion for the first time in years.
From now until 2030, an average of 10,000 baby boomers
will turn 65 every day.8 With the combination of increased population and a slow pace of new senior living inventory supply,
we are bullish on the critical need to house and care for the impending “Silver Tsunami”.
Concluding thoughts
We continue to stand by our positive long-term outlook
for the energy and power and sustainable infrastructure sectors. Opportunities for investing in education and senior living continue to
expand for many reasons positioning the sectors well for continued growth.
The S&P Energy Select Sector® Index
is a capitalization-weighted index of S&P 500® Index companies in the energy sector involved in the development or
production of energy products. The Alerian Midstream Energy Index is a broad-based composite of North American energy infrastructure companies.
The capped, float-adjusted, capitalization-weighted index, whose constituents earn the majority of their cash flow from midstream activities
involving energy commodities, is disseminated real-time on a price-return basis (AMNA) and on a total-return basis (AMNAX).
It is not possible to invest directly in an index.
Performance data quoted represent past performance;
past performance does not guarantee future results. Like any other stock, total return and market value will fluctuate so that an investment,
when sold, may be worth more or less than its original cost.
| 1 |
Electronic Municipal Market Access (https://emma.msrb.org/) & MuniOS (https://www.munios.com/) |
| 2 |
Refinitiv Lipper US Fund Flows (https://www.lipperusfundflows.com/) |
| 3 |
Bloomberg |
| 4 |
2022 Charter School Bond Default Study: Default and Loss Rates Continue to Decline, Wendy Berry, Equitable Facilities Fund |
| 5 |
U.S. News Ranks Charter Schools Among the Top Public High Schools in the Nation, May 3, 2024, https://publiccharters.org/news/us-news-ranks-charters-among-top-in-nation/ |
| 6 |
18 States embrace school choice as Illinois hurts low-income families, Hannah Schmid, January 22, 2024, https://www.illinoispolicy.org/18-states-embrace-school-choice-as-illinois-hurts-low-income-families/ |
| 7 |
NIC & NIC MAP Vision |
| 8 |
census.gov |
(unaudited)
Tortoise
Energy Infrastructure Corp. (TYG)
Fund description
TYG
seeks a high level of total return with an emphasis on current distributions paid to stockholders. TYG invests primarily in equity securities
in energy infrastructure companies. The fund is positioned to benefit from growing energy demand and accelerated efforts to reduce global
CO2 emissions in energy production. Energy infrastructure companies
generate, transport and distribute electricity, as well as process, store, distribute and market natural gas, natural gas liquids, refined
products and crude oil.
Fund performance
Good earnings reports relative to consensus, continued
management discipline toward capital allocation and mergers and acquisitions (M&A), and benign policy implications from Washington
drove midstream sector performance higher. Further, midstream’s growing free cash flow, low leverage, inflation protection, and
attractive valuation provided a compelling investment backdrop. Both dividend growth and opportunistic share repurchases continued. Enthusiasm
for artificial intelligence energy demand needs from a significant forecast for new data centers also aided the both the midstream and
renewable and power infrastructure sector. The fund’s market-based and NAV-based returns for the fiscal period ending May 31, 2024,
were 24.7% and 19.8%, respectively (including the reinvestment of distributions). The Tortoise MLP Index® returned 11.0%
during the same period.
| 2024 mid-fiscal year
summary |
|
| Quarterly distributions paid per share |
$0.7100 |
| Distribution rate (as of 5/31/2024) |
8.5% |
| Year-over-year distribution increase (decrease) |
0.0% |
| Cumulative distributions paid per share to stockholders since inception in February 2004 |
$45.2675 |
| Market-based total return |
24.72% |
| NAV-based total return |
19.80% |
| Premium (discount) to NAV (as of 5/31/2024) |
(17.2)% |
Key asset performance drivers
| Top
five contributors |
Company type |
| Constellation Energy Corp. |
Power company |
| Targa Resources Corp. |
Natural gas pipeline company |
| ONEOK, Inc. |
Natural gas pipeline company |
| NextEra Energy Partners LP |
Diversified infrastructure company |
| The Williams Companies, Inc. |
Natural gas pipeline company |
| Bottom
five contributors |
Company type |
| Tortoise Holdco II, LLC – Private |
Private renewable investment |
| Cheniere Energy, Inc. |
Natural gas pipeline company |
| New Fortress Energy, Inc. |
Natural gas pipeline company |
| Xcel Energy Inc. |
Diversified infrastructure company |
| Ameren Corporation |
Power company |
Unlike the fund return, index return is pre-expenses
and taxes.
Performance data quoted represent past performance;
past performance does not guarantee future results. Like any other stock, total return and market value will fluctuate so that an investment,
when sold, may be worth more or less than its original cost. Portfolio composition is subject to change due to ongoing management of the
fund. References to specific securities or sectors should not be construed as a recommendation by the fund or its adviser. See Schedule
of Investments for portfolio weighting at the end of the fiscal quarter.
(unaudited)
2024 Semi-Annual Report | May 31, 2024
Tortoise
Energy Infrastructure
Corp. (TYG) (continued)
Value
of $10,000 vs. Tortoise Energy Infrastructure Fund – Market (unaudited)
From May 31, 2014 through May 31, 2024
The chart assumes an initial investment of $10,000.
Performance reflects waivers of fee and operating expenses in effect. In the absence of such waivers, total return would be reduced. Performance
data quoted represents past performance and does not guarantee future results. Investment returns and principal value will fluctuate,
and when sold, may be worth more or less than their original cost. Performance current to the most recent month-end may be lower or higher
than the performance quoted and can be obtained by calling 866-362-9331. Performance assumes the reinvestment of capital gains and income
distributions. The performance does not reflect the deduction of taxes that a shareholder would pay on Fund distributions or the redemption
of Fund shares.
Annualized Rates of Return as of
May 31, 2024
| | |
1-Year | |
3-Year | |
5-Year | |
10-Year | |
Since
Inception(1) |
| Tortoise Energy Infrastructure Fund – NAV | |
| 32.41% | | |
| 15.04% | | |
| -7.67% | | |
| -7.07% | | |
| 3.35% | |
| Tortoise Energy Infrastructure Fund – Market | |
| 36.50% | | |
| 16.62% | | |
| -10.40% | | |
| -8.61% | | |
| 2.16% | |
| Tortoise MLP Index® | |
| 36.45% | | |
| 23.17% | | |
| 12.55% | | |
| 3.36% | | |
| 9.56% | |
| Tortoise Decarbonization Infrastructure IndexSM(2) | |
| 21.99% | | |
| N/A | | |
| N/A | | |
| N/A | | |
| N/A | |
| (1) |
Inception date of the Fund was Feburary 25, 2004. |
| (2) |
The Tortoise Decarbonization Infrastructure Index was added to reflect the inclusion of a broader scope of energy infrastructure
equities including midstream, utilities, and renewables in TYG effective November 30, 2021. |
Fund structure and distribution
policy
The fund is structured to qualify as a Regulated Investment
Company (RIC) allowing it to pass-through to shareholders income and capital gains earned, thus avoiding double-taxation. To qualify as
a RIC, the fund must meet specific income, diversification and distribution requirements. Regarding income, at least 90 percent of the
fund’s gross income must be from dividends, interest and capital gains. The fund must meet quarterly diversification requirements
including the requirement that at least 50 percent of the assets be in cash, cash equivalents or other securities with each single issuer
of other securities not greater than 5 percent of total assets. No more than 25 percent of total assets can be invested in any one issuer
other than government securities or other RIC’s. The fund must also distribute at least 90 percent of its investment company income.
RIC’s are also subject to excise tax rules which require RIC’s to distribute approximately 98 percent of net income and net
capital gains to avoid a 4 percent excise tax.
The fund has adopted a managed distribution policy
(“MDP”). Annual distribution amounts are expected to fall in the range of 7% to 10% of the average week-ending net asset value
(“NAV”) per share for the prior fiscal semi-annual period. Distribution amounts will be reset both up and down to provide
a consistent return on trailing NAV. Under the MDP, distribution amounts will normally be reset in February and August, with no changes
in distribution amounts in May and November.
Leverage
The fund’s leverage utilization increased $0.7
million during the six months ended May 31, 2024, compared to the six months ended November 30, 2023, and represented 20.5% of total assets
at May 31, 2024. At year-end, the fund was in compliance with applicable coverage ratios, 74.4% of the leverage cost was fixed, the weighted-average
maturity was 1.8 years and the weighted-average annual rate on leverage was 4.19%. These rates will vary in the future as a result of
changing floating rates, utilization of the fund’s credit facility and as leverage matures or is redeemed. During the six month
period ended May 31, 2024, $14.5 million of Senior Notes were paid in full upon maturity.
Please see the Financial Statements and Notes to Financial
Statements for additional detail regarding critical accounting policies, results of operations, leverage, taxes and other important fund
information.
For further information regarding the fund’s
leverage and distributions to stockholders, as well as a discussion of the tax impact on distributions, please visit www.tortoiseecofin.com.
(unaudited)
TYG Key Financial
Data (supplemental unaudited information)
(dollar amounts in thousands unless otherwise indicated)
The information presented below is supplemental
non-GAAP financial information, is not inclusive of required financial disclosures (e.g. Total Expense Ratio), and should be read in conjunction
with the full financial statements.
| | |
2023 | | |
2024 | |
| | |
Q1(1) | | |
Q2(1) | | |
Q3(1) | | |
Q4(1) | | |
Q1(1) | | |
Q2(1) | |
| Selected Financial Information | |
| | | |
| | | |
| | | |
| | | |
| | | |
| | |
| Distributions paid on common stock | |
$ | 8,045 | | |
$ | 8,046 | | |
$ | 8,045 | | |
$ | 7,643 | | |
$ | 7,643 | | |
$ | 7,643 | |
| Distributions paid on common stock per share | |
| 0.7100 | | |
| 0.7100 | | |
| 0.7100 | | |
| 0.7100 | | |
| 0.7100 | | |
| 0.7100 | |
| Total assets, end of period(2) | |
| 577,524 | | |
| 504,066 | | |
| 527,003 | | |
| 492,651 | | |
| 508,813 | | |
| 563,922 | |
| Average total assets during period(2)(3) | |
| 595,508 | | |
| 547,380 | | |
| 526,517 | | |
| 503,464 | | |
| 496,314 | | |
| 532,401 | |
| Leverage(4) | |
| 146,213 | | |
| 114,713 | | |
| 120,413 | | |
| 107,814 | | |
| 113,294 | | |
| 115,517 | |
| Leverage as a percent of total assets | |
| 25.3 | % | |
| 22.8 | % | |
| 22.8 | % | |
| 21.9 | % | |
| 22.3 | % | |
| 20.5 | % |
| Operating expenses before leverage costs and current taxes(5) | |
| 1.13 | % | |
| 1.22 | % | |
| 1.26 | % | |
| 1.73 | % | |
| 1.21 | % | |
| 1.28 | % |
| Net unrealized appreciation (depreciation), end of period | |
| (34,286 | ) | |
| (65,512 | ) | |
| (34,940 | ) | |
| (58,511 | ) | |
| (39,969 | ) | |
| 18,703 | |
| Net assets, end of period | |
| 416,799 | | |
| 380,323 | | |
| 403,510 | | |
| 380,497 | | |
| 382,860 | | |
| 435,800 | |
| Average net assets during period(6) | |
| 429,315 | | |
| 409,946 | | |
| 406,929 | | |
| 384,850 | | |
| 377,999 | | |
| 414,387 | |
| Net asset value per common share | |
| 36.78 | | |
| 33.56 | | |
| 35.61 | | |
| 35.35 | | |
| 35.57 | | |
| 40.48 | |
| Market value per share | |
| 30.89 | | |
| 26.95 | | |
| 30.13 | | |
| 28.11 | | |
| 29.27 | | |
| 33.51 | |
| Shares outstanding (000’s) | |
| 11,332 | | |
| 11,332 | | |
| 11,332 | | |
| 10,765 | | |
| 10,765 | | |
| 10,765 | |
| (1) |
Q1 is the period from December through February. Q2 is the period from March through May. Q3 is the period
from June through August. Q4 is the period from September through November. |
| (2) |
Includes deferred issuance and offering costs on senior notes and preferred stock. |
| (3) |
Computed by averaging month-end values within each period. |
| (4) |
Leverage consists of senior notes, preferred stock and outstanding borrowings under credit facilities. |
| (5) |
As a percent of total assets. |
| (6) |
Computed by averaging daily net assets within each period. |
2024 Semi-Annual Report | May 31, 2024
Tortoise
Midstream Energy Fund, Inc. (NTG)
Fund description
NTG seeks to provide stockholders
with a high level of total return with an emphasis on current distributions. NTG invests primarily in midstream energy equities that own
and operate a network of pipeline and energy related logistical infrastructure assets with an emphasis on those that transport, gather,
process and store natural gas and natural gas liquids (NGLs). NTG targets midstream energy equities, including MLPs benefiting from U.S.
natural gas production and consumption expansion, with minimal direct commodity exposure.
Fund performance
Good earnings reports relative to consensus, continued
management discipline toward capital allocation and mergers and acquisitions (M&A), and benign policy implications from Washington
drove midstream sector performance higher. Further, midstream’s growing free cash flow, low leverage, inflation protection, and
attractive valuation provided a compelling investment backdrop. Both dividend growth and opportunistic share repurchases continued. Enthusiasm
for artificial intelligence energy demand needs from a significant forecast for new data centers also aided the both the midstream and
renewable and power infrastructure sector. The fund’s market-based and NAV-based returns for the fiscal period ending May 31, 2024,
were 22.7% and 18.3%, respectively (including the reinvestment of distributions). The Tortoise MLP Index® returned 11.0%
during the same period.
| 2024 mid-fiscal year summary |
|
| Quarterly distributions paid per share |
$0.7700 |
| Distribution rate (as of 5/31/2024) |
7.6% |
| Year-over-year distribution increase (decrease) |
0.0% |
| Cumulative distributions paid per share to stockholders since inception in July 2010 |
$25.6600 |
| Market-based total return |
22.68% |
| NAV-based total return |
18.30% |
| Premium (discount) to NAV (as of 5/31/2024) |
(16.7)% |
Key asset performance drivers
| Top
five contributors |
Company type |
| Targa Resources Corp. |
Natural gas pipeline company |
| ONEOK, Inc. |
Natural gas pipeline company |
| The Williams Companies, Inc. |
Natural gas pipeline company |
| Plains GP Holdings, L.P. |
Crude oil pipeline company |
| NextEra Energy Partners LP |
Diversified infrastructure company |
| Bottom five contributors |
Company type |
| Cheniere Energy, Inc. |
Natural gas pipeline company |
| New Fortress Energy, Inc. |
Natural gas pipeline company |
| EnLink Midstream, LLC |
Natural gas pipeline company |
| Vistra Energy Corp. |
Natural gas pipeline company |
| Excelerate Energy, Inc. |
Natural gas pipeline company |
Unlike the fund return, index return is pre-expenses
and taxes.
Performance data quoted represent past performance;
past performance does not guarantee future results. Like any other stock, total return and market value will fluctuate so that an investment,
when sold, may be worth more or less than its original cost. Portfolio composition is subject to change due to ongoing management of the
fund. References to specific securities or sectors should not be construed as a recommendation by the fund or its adviser. See Schedule
of Investments for portfolio weighting at the end of the fiscal quarter.
(unaudited)
Tortoise
Midstream Energy Fund,
Inc. (NTG) (continued)
Value
of $10,000 vs. Tortoise Midstream Energy Fund – Market (unaudited)
From May 31, 2014 through May 31, 2024
The chart assumes an initial investment of $10,000.
Performance reflects waivers of fee and operating expenses in effect. In the absence of such waivers, total return would be reduced. Performance
data quoted represents past performance and does not guarantee future results. Investment returns and principal value will fluctuate,
and when sold, may be worth more or less than their original cost. Performance current to the most recent month-end may be lower or higher
than the performance quoted and can be obtained by calling 866-362-9331. Performance assumes the reinvestment of capital gains and income
distributions. The performance does not reflect the deduction of taxes that a shareholder would pay on Fund distributions or the redemption
of Fund shares.
Annualized Rates of Return as of
May 31, 2024
| | |
1-Year | |
3-Year | |
5-Year | |
10-Year | |
Since
Inception(1) |
| Tortoise Midstream Energy Fund – NAV | |
| 41.13% | | |
| 19.08% | | |
| -12.15% | | |
| -9.03% | | |
| -3.38% | |
| Tortoise Midstream Energy Fund – Market | |
| 39.08% | | |
| 21.42% | | |
| -14.29% | | |
| -10.17% | | |
| -4.97% | |
| Tortoise MLP Index® | |
| 36.45% | | |
| 23.17% | | |
| 12.55% | | |
| 3.36% | | |
| 7.69% | |
| (1) |
Inception date of the Fund was July 27, 2010. |
Fund structure and distribution
policy
The fund is structured to qualify as a Regulated Investment
Company (RIC) allowing it to pass-through to shareholders income and capital gains earned, thus avoiding double-taxation. To qualify as
a RIC, the fund must meet specific income, diversification and distribution requirements. Regarding income, at least 90 percent of the
fund’s gross income must be from dividends, interest and capital gains. The fund must meet quarterly diversification requirements
including the requirement that at least 50 percent of the assets be in cash, cash equivalents or other securities with each single issuer
of other securities not greater than 5 percent of total assets. No more than 25 percent of total assets can be invested in any one issuer
other than government securities or other RIC’s. The fund must also distribute at least 90 percent of its investment company income.
RIC’s are also subject to excise tax rules which require RIC’s to distribute approximately 98 percent of net income and net
capital gains to avoid a 4 percent excise tax.
The fund has adopted a managed distribution policy
(“MDP”). Annual distribution amounts are expected to fall in the range of 7% to 10% of the average week-ending net asset value
(“NAV”) per share for the prior fiscal semi-annual period. Distribution amounts will be reset both up and down to provide
a consistent return on trailing NAV. Under the MDP, distribution amounts will normally be reset in February and August, with no changes
in distribution amounts in May and November.
Leverage
The fund’s leverage utilization increased $3.0
million during the six months ended May 31, 2024 compared to the six months ended November 30, 2023, and represented 18.2% of total assets
at May 31, 2024. At year-end, the fund was in compliance with applicable coverage ratios, 75.8% of the leverage cost was fixed, the weighted-average
maturity was 3.1 years and the weighted-average annual rate on leverage was 3.92%. These rates will vary in the future as a result of
changing floating rates, utilization of the fund’s credit facility and as leverage matures or is redeemed.
Please see the Financial Statements and Notes to Financial
Statements for additional detail regarding critical accounting policies, results of operations, leverage, taxes and other important fund
information.
For further information regarding the fund’s
leverage and distributions to stockholders, as well as a discussion of the tax impact on distributions, please visit www.tortoiseecofin.com.
(unaudited)
2024 Semi-Annual Report | May 31, 2024
NTG Key Financial
Data (supplemental unaudited information)
(dollar amounts in thousands unless otherwise indicated)
The information presented below is supplemental
non-GAAP financial information, is not inclusive of required financial disclosures (e.g. Total Expense Ratio), and should be read in conjunction
with the full financial statements.
| | |
2023 | | |
2024 | |
| | |
Q1(1) | | |
Q2(1) | | |
Q3(1) | | |
Q4(1) | | |
Q1(1) | | |
Q2(1) | |
| Selected Financial Information | |
| | | |
| | | |
| | | |
| | | |
| | | |
| | |
| Distributions paid on common stock | |
$ | 4,128 | | |
$ | 4,128 | | |
$ | 4,128 | | |
$ | 3,921 | | |
$ | 3,921 | | |
$ | 3,921 | |
| Distributions paid on common stock per share | |
| 0.7700 | | |
| 0.7700 | | |
| 0.7700 | | |
| 0.7700 | | |
| 0.7700 | | |
| 0.7700 | |
| Total assets, end of period(2) | |
| 296,682 | | |
| 261,858 | | |
| 287,287 | | |
| 272,818 | | |
| 279,021 | | |
| 310,068 | |
| Average total assets during period(2)(3) | |
| 304,884 | | |
| 281,520 | | |
| 280,548 | | |
| 276,916 | | |
| 273,920 | | |
| 295,102 | |
| Leverage(4) | |
| 66,120 | | |
| 56,920 | | |
| 60,720 | | |
| 53,524 | | |
| 56,024 | | |
| 56,569 | |
| Leverage as a percent of total assets | |
| 22.3 | % | |
| 21.7 | % | |
| 21.1 | % | |
| 19.6 | % | |
| 20.1 | % | |
| 18.2 | % |
| Operating expenses before leverage costs and current taxes(5) | |
| 1.19 | % | |
| 1.36 | % | |
| 1.43 | % | |
| 2.15 | % | |
| 1.33 | % | |
| 1.43 | % |
| Net unrealized appreciation (depreciation), end of period | |
| 6,856 | | |
| (11,572 | ) | |
| 17,267 | | |
| 5,003 | | |
| 14,580 | | |
| 44,972 | |
| Net assets, end of period | |
| 221,555 | | |
| 200,046 | | |
| 225,096 | | |
| 217,066 | | |
| 220,886 | | |
| 246,768 | |
| Average net assets during period(6) | |
| 226,098 | | |
| 215,743 | | |
| 220,209 | | |
| 217,415 | | |
| 214,843 | | |
| 238,661 | |
| Net asset value per common share | |
| 41.33 | | |
| 37.32 | | |
| 41.99 | | |
| 42.62 | | |
| 43.37 | | |
| 48.45 | |
| Market value per common share | |
| 35.28 | | |
| 31.53 | | |
| 35.40 | | |
| 34.22 | | |
| 35.84 | | |
| 40.34 | |
| Shares outstanding (000’s) | |
| 5,361 | | |
| 5,361 | | |
| 5,361 | | |
| 5,093 | | |
| 5,093 | | |
| 5,093 | |
| (1) |
Q1 is the period from December through February. Q2 is the period from March through May. Q3 is the period
from June through August. Q4 is the period from September through November. |
| (2) |
Includes deferred issuance and offering costs on
senior notes and preferred stock. |
| (3) |
Computed by averaging month-end values within each period. |
| (4) |
Leverage consists of senior notes, preferred stock and outstanding borrowings under the credit facility. |
| (5) |
Computed as a percent
of total assets. |
| (6) |
Computed by averaging daily net assets within each period. |
Tortoise
Pipeline & Energy Fund, Inc. (TTP)
Fund description
TTP seeks a high level of total return
with an emphasis on current distributions paid to stockholders. TTP invests primarily in equity securities of North American pipeline
companies that transport natural gas, natural gas liquids (NGLs), crude oil and refined products and, to a lesser extent, in other energy
infrastructure companies.
Fund performance
Good earnings reports relative to consensus, continued
management discipline toward capital allocation and mergers and acquisitions (M&A), and benign policy implications from Washington
drove midstream sector performance higher. Further, midstream’s growing free cash flow, low leverage, inflation protection, and
attractive valuation provided a compelling investment backdrop. Both dividend growth and opportunistic share repurchases continued. Enthusiasm
for artificial intelligence energy demand needs from a significant forecast for new data centers also aided the both the midstream and
renewable and power infrastructure sector. The fund’s market-based and NAV-based returns for the fiscal period ending May 31, 2024,
were 28.5% and 18.5%, respectively (including the reinvestment of distributions). The Tortoise North American Pipeline IndexSM returned
12.1% for the same period.
| 2024 mid-fiscal year summary |
|
| Quarterly distributions paid per share |
$0.5900 |
| Distribution rate (as of 5/31/2024) |
6.8% |
| Year-over-year distribution increase (decrease) |
0.0% |
| Cumulative distributions paid per share to stockholders since inception in October 2011 |
$20.8375 |
| Market-based total return |
28.46% |
| NAV-based total return |
18.52% |
| Premium (discount) to NAV (as of 5/31/2024) |
(12.2)% |
Please refer to the inside front cover of the
report for important information about the fund’s distribution policy.
Key asset performance drivers
| Top
five contributors |
Company type |
| ONEOK, Inc. |
Natural gas pipeline company |
| Equitrans Midstream Corporation |
Gathering & processing company |
| Targa Resources Corp. |
Natural gas pipeline company |
| Plains GP Holdings, L.P. |
Crude oil pipeline company |
| The Williams Companies, Inc. |
Natural gas pipeline company |
| Bottom five contributors |
Company type |
| Cheniere Energy, Inc. |
Natural gas pipeline company |
| Sunoco LP |
Natural gas pipeline company |
| Westlake Chemical Partners LP |
Chemicals company |
| Excelerate Energy, Inc. |
Natural gas pipeline company |
| Kinetik Holdings Inc |
Gathering & processing company |
Unlike the fund return, index return is pre-expenses.
Performance data quoted represent past performance;
past performance does not guarantee future results. Like any other stock, total return and market value will fluctuate so that an investment,
when sold, may be worth more or less than its original cost. Portfolio composition is subject to change due to ongoing management of the
fund. References to specific securities or sectors should not be construed as a recommendation by the fund or its adviser. See Schedule
of Investments for portfolio weighting at the end of the fiscal quarter.
(unaudited)
2024 Semi-Annual Report | May 31, 2024
Tortoise
Pipeline & Energy
Fund, Inc. (TTP) (continued)
Value
of $10,000 vs. Tortoise Pipeline and Energy Fund – Market (unaudited)
From May 31, 2014 through May 31, 2024
The chart assumes an initial investment of $10,000.
Performance reflects waivers of fee and operating expenses in effect. In the absence of such waivers, total return would be reduced. Performance
data quoted represents past performance and does not guarantee future results. Investment returns and principal value will fluctuate,
and when sold, may be worth more or less than their original cost. Performance current to the most recent month-end may be lower or higher
than the performance quoted and can be obtained by calling 866-362-9331. Performance assumes the reinvestment of capital gains and income
distributions. The performance does not reflect the deduction of taxes that a shareholder would pay on Fund distributions or the redemption
of Fund shares.
Annualized Rates of Return as of
May 31, 2024
| | |
1-Year | |
3-Year | |
5-Year | |
10-Year | |
Since
Inception(1) |
| Tortoise Pipeline and Energy Fund – NAV | |
| 41.85% | | |
| 19.95% | | |
| -1.91% | | |
| -4.83% | | |
| 0.61% | |
| Tortoise Pipeline and Energy Fund – Market | |
| 51.20% | | |
| 24.57% | | |
| -2.27% | | |
| -5.14% | | |
| -0.79% | |
| Tortoise North American Pipeline Index | |
| 28.14% | | |
| 14.84% | | |
| 10.32% | | |
| 5.78% | | |
| 8.51% | |
| (1) |
Inception date of the Fund was October 26, 2011. |
Fund structure and distribution
policy
The fund is structured to qualify as a Regulated Investment
Company (RIC) allowing it to pass-through to shareholders income and capital gains earned, thus avoiding double-taxation. To qualify as
a RIC, the fund must meet specific income, diversification and distribution requirements. Regarding income, at least 90 percent of the
fund’s gross income must be from dividends, interest and capital gains. The fund must meet quarterly diversification requirements
including the requirement that at least 50 percent of the assets be in cash, cash equivalents or other securities with each single issuer
of other securities not greater than 5 percent of total assets. No more than 25 percent of total assets can be invested in any one issuer
other than government securities or other RIC’s. The fund must also distribute at least 90 percent of its investment company income.
RIC’s are also subject to excise tax rules which require RIC’s to distribute approximately 98 percent of net income and net
capital gains to avoid a 4 percent excise tax.
The fund has adopted a distribution policy which is
included on the inside front cover of this report. To summarize, the fund has adopted a managed distribution policy (“MDP”).
Annual distribution amounts are expected to fall in the range of 7% to 10% of the average week-ending net asset value (“NAV”)
per share for the prior fiscal semi-annual period. Distribution amounts will be reset both up and down to provide a consistent return
on trailing NAV. Under the MDP, distribution amounts will normally be reset in February and August, with no changes in distribution amounts
in May and November. The fund may designate a portion of its distributions as capital gains and may also distribute additional capital
gains in the last quarter of the year to meet annual excise distribution requirements. Distribution amounts are subject to change from
time to time at the discretion of the Board.
Leverage
The fund’s leverage utilization increased $0.8
million during the six months ended May 31, 2024, compared to the six months ended November 30, 2023, and represented 17.3% of total assets
at May 31, 2024. At year-end, the fund was in compliance with applicable coverage ratios, 60.0% of the leverage cost was fixed, the weighted-average
maturity was 0.6 years and the weighted-average annual rate on leverage was 5.37%. These rates will vary in the future as a result of
changing floating rates, utilization of the fund’s credit facility and as leverage matures or is redeemed.
Please see the Financial Statements and Notes to Financial
Statements for additional detail regarding critical accounting policies, results of operations, leverage and other important fund information.
For further information regarding the fund’s
leverage and distributions to stockholders, as well as a discussion of the tax impact on distributions, please visit www.tortoiseecofin.com.
(unaudited)
TTP Key
Financial Data (supplemental unaudited
information)
(dollar amounts in thousands unless otherwise indicated)
The information presented below is supplemental
non-GAAP financial information, is not inclusive of required financial disclosures (e.g. Total Expense Ratio), and should be read in conjunction
with the full financial statements.
| | |
2023 | | |
2024 |
| | |
Q1(1) | | |
Q2(1) | | |
Q3(1) | | |
Q4(1) | | |
Q1(1) | | |
Q2(1) | |
| Selected Financial Information | |
| | | |
| | | |
| | | |
| | | |
| | | |
| | |
| Distributions paid on common stock | |
$ | 1,248 | | |
$ | 1,249 | | |
$ | 1,249 | | |
$ | 1,186 | | |
$ | 1,186 | | |
$ | 1,186 | |
| Distributions paid on common stock per share | |
| 0.5900 | | |
| 0.5900 | | |
| 0.5900 | | |
| 0.5900 | | |
| 0.5900 | | |
| 0.5900 | |
| Total assets, end of period(2) | |
| 87,895 | | |
| 81,736 | | |
| 88,301 | | |
| 86,167 | | |
| 88,476 | | |
| 96,617 | |
| Average total assets during period(2)(3) | |
| 90,503 | | |
| 86,135 | | |
| 86,853 | | |
| 86,272 | | |
| 86,558 | | |
| 93,406 | |
| Leverage(4) | |
| 20,143 | | |
| 17,443 | | |
| 17,343 | | |
| 15,943 | | |
| 16,343 | | |
| 16,737 | |
| Leverage as a percent of total assets | |
| 22.9 | % | |
| 21.3 | % | |
| 19.6 | % | |
| 18.5 | % | |
| 18.5 | % | |
| 17.3 | % |
| Operating expenses before leverage costs(5) | |
| 1.31 | % | |
| 1.37 | % | |
| 1.39 | % | |
| 1.30 | % | |
| 1.32 | % | |
| 1.36 | % |
| Net unrealized appreciation (depreciation), end of period | |
| 13,950 | | |
| 9,483 | | |
| 17,306 | | |
| 17,779 | | |
| 21,106 | | |
| 29,711 | |
| Net assets, end of period | |
| 67,264 | | |
| 63,730 | | |
| 70,447 | | |
| 69,525 | | |
| 71,745 | | |
| 79,434 | |
| Average net assets during period(6) | |
| 69,939 | | |
| 66,399 | | |
| 69,717 | | |
| 69,161 | | |
| 69,552 | | |
| 77,012 | |
| Net asset value per common share | |
| 31.78 | | |
| 30.11 | | |
| 33.29 | | |
| 34.58 | | |
| 35.68 | | |
| 39.51 | |
| Market value per common share | |
| 27.09 | | |
| 24.81 | | |
| 28.36 | | |
| 28.02 | | |
| 29.23 | | |
| 34.70 | |
| Shares outstanding (000’s) | |
| 2,116 | | |
| 2,116 | | |
| 2,116 | | |
| 2,011 | | |
| 2,011 | | |
| 2,011 | |
| (1) |
Q1 is the period from December through February. Q2 is the period from March through May. Q3 is the period from June through
August. Q4 is the period from September through November. |
| (2) |
Includes deferred issuance and offering costs on senior notes and preferred stock. |
| (3) |
Computed by averaging month-end values within each period. |
| (4) |
Leverage consists of senior notes, preferred stock and outstanding borrowings under the revolving credit facility. |
| (5) |
Computed as a percent of total assets. |
| (6) |
Computed by averaging daily net assets within each period. |
2024 Semi-Annual Report | May 31, 2024
Tortoise
Energy Independence Fund, Inc. (NDP)
Fund description
NDP seeks a high level of total return
with an emphasis on current distributions paid to stockholders. NDP invests primarily in equity securities of upstream North American
energy companies that engage in the exploration and production of crude oil, condensate, natural gas and natural gas liquids that generally
have a significant presence in North American oil and gas fields, including shale reservoirs.
Fund performance
Good earnings reports relative to consensus, continued
management discipline toward capital allocation and mergers and acquisitions (M&A), and benign policy implications from Washington
drove broader energy sector performance higher. Further, while geopolitical turmoil continued in both Ukraine and Israel, the energy sector
sustained flows from areas of supply to demand centers. The Organization of the Petroleum Exporting Countries Plus (OPEC+) remained constant
in their goal to balance crude oil markets. Both dividend growth and opportunistic share repurchases continued. Enthusiasm for artificial
intelligence energy demand needs from a significant forecast for new data centers also specifically aided natural gas exposed areas of
energy. The fund’s market-based and NAV-based returns for the fiscal period ending May 31, 2024, were 22.0% and 16.4%, respectively
(including the reinvestment of distributions).
| 2024 mid-fiscal year summary |
|
| Quarterly distributions paid per share |
$0.6300 |
| Distribution rate (as of 5/31/2024) |
7.4% |
| Year-over-year distribution increase (decrease) |
0.0% |
| Cumulative distributions paid per share to stockholders since inception in July 2012 |
$18.5925 |
| Market-based total return |
21.99% |
| NAV-based total return |
16.36% |
| Premium (discount) to NAV (as of 5/31/2024) |
(14.4)% |
The fund utilizes a covered call strategy when appropriate,
which seeks to generate income while reducing overall volatility. No covered calls were written during the period.
Key asset performance drivers
| Top
five contributors |
Company type |
| Diamondback Energy Inc |
Oil & gas production company |
| Targa Resources Corp. |
Natural gas pipeline company |
| Kodiak Gas Services Inc. |
Gathering & processing company |
| Constellation Energy Corp. |
Power company |
| Exxon Mobil Corp. |
Oil & gas production company |
| Bottom five contributors |
Company type |
| Cheniere Energy, Inc. |
Natural gas pipeline company |
| Darling Ingredients Inc. |
Renewable infrastructure company |
| Baker Hughes Co. |
Oilfield services company |
| Excelerate Energy, Inc. |
Natural gas pipeline company |
| Kinetik Holdings Inc. |
Gathering & processing company |
Unlike the fund return, index return is pre-expenses.
Performance data quoted represent past performance:
past performance does not guarantee future results. Like any other stock, total return and market value will fluctuate so that an investment,
when sold, may be worth more or less than its original cost. Portfolio composition is subject to change due to ongoing management of the
fund. References to specific securities or sectors should not be construed as a recommendation by the fund or its adviser. See Schedule
of Investments for portfolio weighting at the end of the fiscal quarter.
(unaudited)
Tortoise
Energy Independence
Fund, Inc. (NDP) (continued)
Value
of $10,000 vs. Tortoise Energy Independence Fund – Market (unaudited)
From May 31, 2014 through May 31, 2024
The chart assumes an initial investment of $10,000.
Performance reflects waivers of fee and operating expenses in effect. In the absence of such waivers, total return would be reduced. Performance
data quoted represents past performance and does not guarantee future results. Investment returns and principal value will fluctuate,
and when sold, may be worth more or less than their original cost. Performance current to the most recent month-end may be lower or higher
than the performance quoted and can be obtained by calling 866-362-9331. Performance assumes the reinvestment of capital gains and income
distributions. The performance does not reflect the deduction of taxes that a shareholder would pay on Fund distributions or the redemption
of Fund shares.
Annualized Rates of Return as of
May 31, 2024
| | |
1-Year | |
3-Year | |
5-Year | |
10-Year | |
Since
Inception(1) |
| Tortoise Energy Independence Fund – NAV | |
| 36.31% | | |
| 28.92% | | |
| 2.57% | | |
| -8.01% | | |
| -3.88% | |
| Tortoise Energy Independence Fund – Market | |
| 35.88% | | |
| 28.61% | | |
| -4.85% | | |
| -8.28% | | |
| -5.50% | |
| S&P 500 Energy Select Sector Index | |
| 25.97% | | |
| 26.42% | | |
| 15.39% | | |
| 3.86% | | |
| 6.42% | |
| (1) |
Inception date of the Fund was July 26, 2012. |
Fund structure and distribution
policy
The fund is structured to qualify as a Regulated Investment
Company (RIC) allowing it to pass-through to shareholders income and capital gains earned, thus avoiding double-taxation. To qualify as
a RIC, the fund must meet specific income, diversification and distribution requirements. Regarding income, at least 90 percent of the
fund’s gross income must be from dividends, interest and capital gains. The fund must meet quarterly diversification requirements
including the requirement that at least 50 percent of the assets be in cash, cash equivalents or other securities with each single issuer
of other securities not greater than 5 percent of total assets. No more than 25 percent of total assets can be invested in any one issuer
other than government securities or other RIC’s. The fund must also distribute at least 90 percent of its investment company income.
RIC’s are also subject to excise tax rules which require RIC’s to distribute approximately 98 percent of net income and net
capital gains to avoid a 4 percent excise tax.
The fund has adopted a distribution policy which is
included on the inside front cover of this report. To summarize, the fund has adopted a managed distribution policy (“MDP”).
Annual distribution amounts are expected to fall in the range of 7% to 10% of the average week-ending net asset value (“NAV”)
per share for the prior fiscal semi-annual period. Distribution amounts will be reset both up and down to provide a consistent return
on trailing NAV. Under the MDP, distribution amounts will normally be reset in February and August, with no changes in distribution amounts
in May and November. The fund may designate a portion of its distributions as capital gains and may also distribute additional capital
gains in the last quarter of the year to meet annual excise distribution requirements. Distribution amounts are subject to change from
time to time at the discretion of the Board.
Leverage
The fund’s leverage utilization increased $1.4
million, during the six months ended May 31, 2024 as compared to the six months ended November 30, 2023. The fund utilizes all floating
rate leverage that had an interest rate of 6.33% and represented 13.3% of total assets at year-end. During the period, the fund maintained
compliance with its applicable coverage ratios. The interest rate on the fund’s leverage will vary in the future along with changing
floating rates.
Please see the Financial Statements and Notes to Financial
Statements for additional detail regarding critical accounting policies, results of operations, leverage and other important fund information.
For further information regarding the fund’s
leverage and distributions to stockholders, as well as a discussion of the tax impact on distributions, please visit www.tortoiseecofin.com.
(unaudited)
2024 Semi-Annual Report | May 31, 2024
NDP Key Financial
Data (supplemental unaudited information)
(dollar
amounts in thousands unless otherwise indicated)
The information presented below is supplemental
non-GAAP financial information, is not inclusive of required financial disclosures (e.g. Total Expense Ratio), and should be read in conjunction
with the full financial statements.
| | |
2023 | | |
2024 |
| | |
Q1(1) | | |
Q2(1) | | |
Q3(1) | | |
Q4(1) | | |
Q1(1) | | |
Q2(1) | |
| Selected Financial Information | |
| | | |
| | | |
| | | |
| | | |
| | | |
| | |
| Distributions paid on common stock | |
$ | 1,105 | | |
$ | 1,105 | | |
$ | 1,105 | | |
$ | 1,050 | | |
$ | 1,050 | | |
$ | 1,050 | |
| Distributions paid on common stock per share | |
| 0.6300 | | |
| 0.6300 | | |
| 0.6300 | | |
| 0.6300 | | |
| 0.6300 | | |
| 0.6300 | |
| Total assets, end of period | |
| 68,060 | | |
| 64,422 | | |
| 72,535 | | |
| 68,156 | | |
| 69,682 | | |
| 76,577 | |
| Average total assets during period(2) | |
| 69,055 | | |
| 67,241 | | |
| 69,136 | | |
| 71,088 | | |
| 67,823 | | |
| 74,387 | |
| Leverage(3) | |
| 8,400 | | |
| 8,800 | | |
| 8,600 | | |
| 8,800 | | |
| 9,700 | | |
| 10,200 | |
| Leverage as a percent of total assets | |
| 12.3 | % | |
| 13.7 | % | |
| 11.9 | % | |
| 12.9 | % | |
| 13.9 | % | |
| 13.3 | % |
| Operating expenses before leverage costs as a percent of total assets | |
| 1.31 | % | |
| 1.35 | % | |
| 1.34 | % | |
| 1.35 | % | |
| 1.31 | % | |
| 1.37 | % |
| Net unrealized appreciation (depreciation), end of period | |
| 23,977 | | |
| 20,571 | | |
| 29,184 | | |
| 24,611 | | |
| 26,314 | | |
| 33,435 | |
| Net assets, end of period | |
| 59,361 | | |
| 55,288 | | |
| 63,590 | | |
| 59,053 | | |
| 59,743 | | |
| 66,122 | |
| Average net assets during period(4) | |
| 62,487 | | |
| 58,619 | | |
| 60,016 | | |
| 62,520 | | |
| 57,737 | | |
| 65,132 | |
| Net asset value per common share | |
| 33.85 | | |
| 31.53 | | |
| 36.26 | | |
| 35.45 | | |
| 35.86 | | |
| 39.69 | |
| Market value per common share | |
| 29.46 | | |
| 27.08 | | |
| 31.15 | | |
| 28.95 | | |
| 30.81 | | |
| 33.98 | |
| Shares outstanding (000’s) | |
| 1,754 | | |
| 1,754 | | |
| 1,754 | | |
| 1,666 | | |
| 1,666 | | |
| 1,666 | |
| (1) |
Q1 is the period from December through February. Q2 is the period from March through May. Q3 is the period
from June through August. Q4 is the period from September through November. |
| (2) |
Computed by averaging month-end values within each period. |
| (3) |
Leverage consists of outstanding borrowings under the revolving credit facility. |
| (4) |
Computed by averaging daily net assets within each period. |
Tortoise
Power and Energy Infrastructure Fund, Inc. (TPZ)
Fund description
TPZ seeks to provide a high level
of current income to stockholders, with a secondary objective of capital appreciation. TPZ seeks to invest primarily in fixed income and
dividend-paying equity securities of power and energy infrastructure companies that provide stable and defensive characteristics throughout
economic cycles.
Fund performance
Good earnings reports relative to consensus, continued
management discipline toward capital allocation and mergers and acquisitions (M&A), and benign policy implications from Washington
drove midstream sector performance higher. Further, midstream’s growing free cash flow, low leverage, inflation protection, and
attractive valuation provided a compelling investment backdrop. Both dividend growth and opportunistic share repurchases continued. Enthusiasm
for artificial intelligence energy demand needs from a significant forecast for new data centers also aided the both the midstream and
renewable and power infrastructure sector. The fund’s market-based and NAV-based returns for the fiscal period ending May 31, 2024,
were 18.8% and 13.9%, respectively (including the reinvestment of distributions). Comparatively, the TPZ Benchmark Composite* returned
6.0% for the same period. The fund’s fixed income holdings outperformed its equity holdings for the period on a total return basis.
| 2024
mid-fiscal year summary |
|
| Quarterly distributions paid per share |
$0.3150 |
| Monthly distributions paid per share |
$0.1050 |
| Distribution rate (as of 5/31/2024) |
8.2% |
| Year-over-year distribution increase (decrease) |
0.0% |
| Cumulative distribution to stockholders since inception in July 2009 |
$21.5250 |
| Market-based total return |
18.77% |
| NAV-based total return |
13.94% |
| Premium (discount) to NAV (as of 5/31/2024) |
(13.0)% |
| * |
The TPZ Benchmark Composite includes the BofA Merrill Lynch U.S. Energy Index (CIEN), the BofA Merrill Lynch
U.S. Electricity Index (CUEL) and the Tortoise MLP Index® (TMLP). It is comprised of a blend of 70% fixed income and
30% equity securities issued by companies in the power and energy infrastructure sectors. |
Please refer to the inside front cover of the
report for important information about the fund’s distribution policy.
Key asset performance drivers
| Top
five contributors |
Company type |
| Targa Resources Corp. |
Natural gas pipeline company |
| Western Midstream Partners LP |
Gathering & processing company |
| ONEOK, Inc. |
Natural gas pipeline company |
| Energy Transfer LP |
Natural gas pipeline company |
| MPLX LP |
Refined products pipeline company |
| Bottom five contributors |
Company type |
| Holly Energy Partners, L.P. |
Refined products pipeline company |
| Sunoco LP |
Refined products pipeline company |
| EnLink Midstream, LLC |
Gathering & processing company |
| Excelerate Energy Inc. |
Natural gas pipeline company |
| HF Sinclair Corp. |
Refining company |
Unlike the fund return, index return is pre-expenses.
Performance data quoted represent past performance;
past performance does not guarantee future results. Like any other stock, total return and market value will fluctuate so that an investment,
when sold, may be worth more or less than its original cost. Portfolio composition is subject to change due to ongoing management of the
fund. References to specific securities or sectors should not be construed as a recommendation by the fund or its adviser. See Schedule
of Investments for portfolio weighting at the end of the fiscal quarter.
(unaudited)
2024 Semi-Annual Report | May 31, 2024
Tortoise
Power and Energy Infrastructure
Fund, Inc. (TPZ) (continued)
Value
of $10,000 vs. Tortoise Power and Energy Infrastructure Fund – Market (unaudited)
From May 31, 2014 through May 31, 2024
The chart assumes an initial investment of $10,000.
Performance reflects waivers of fee and operating expenses in effect. In the absence of such waivers, total return would be reduced. Performance
data quoted represents past performance and does not guarantee future results. Investment returns and principal value will fluctuate,
and when sold, may be worth more or less than their original cost. Performance current to the most recent month-end may be lower or higher
than the performance quoted and can be obtained by calling 866-362-9331. Performance assumes the reinvestment of capital gains and income
distributions. The performance does not reflect the deduction of taxes that a shareholder would pay on Fund distributions or the redemption
of Fund shares.
Annualized Rates of Return as of
May 31, 2024
| | |
1-Year | |
3-Year | |
5-Year | |
10-Year | |
Since
Inception(1) |
| Tortoise Power and Energy Infrastructure Fund – NAV | |
| 29.56% | | |
| 13.14% | | |
| 5.94% | | |
| 3.09% | | |
| 7.01% | |
| Tortoise Power and Energy Infrastructure Fund – Market | |
| 35.38% | | |
| 14.36% | | |
| 5.06% | | |
| 2.55% | | |
| 6.02% | |
| TPZ Benchmark Composite(1) | |
| 13.62% | | |
| 4.70% | | |
| 5.30% | | |
| 3.25% | | |
| 6.21% | |
| (1) |
The TPZ Benchmark Composite includes the BofA Merrill Lynch U.S. Energy Index (CIEN), the BofA Merrill Lynch
U.S. Electricity Index (CUEL) and the Tortoise MLP Index® (TMLP). |
| (2) |
Inception date of the Fund was July 29, 2009. |
Fund structure and distribution
policy
The fund is structured to qualify as a Regulated Investment
Company (RIC) allowing it to pass-through to shareholders income and capital gains earned, thus avoiding double-taxation. To qualify as
a RIC, the fund must meet specific income, diversification and distribution requirements. Regarding income, at least 90 percent of the
fund gross income must be from dividends, interest and capital gains. The fund must meet quarterly diversification requirements including
the requirement that at least 50 percent of the assets be in cash, cash equivalents or other securities with each single issuer of other
securities not greater than 5 percent of total assets. No more than 25 percent of total assets can be invested in any one issuer other
than government securities or other RIC’s. The fund must also distribute at least 90 percent of its investment company income. RIC’s
are also subject to excise tax rules which require RIC’s to distribute approximately 98 percent of net income and net capital gains
to avoid a 4 percent excise tax.
The fund has adopted a distribution policy which is
included on the inside front cover of this report. To summarize, the fund has adopted a managed distribution policy (“MDP”).
Annual distribution amounts are expected to fall in the range of 7% to 10% of the average week-ending net asset value (“NAV”)
per share for the prior fiscal semi-annual period. Distribution amounts will be reset both up and down to provide a consistent return
on trailing NAV. Under the MDP, distribution amounts will normally be reset in February and August, with no changes in distribution amounts
in May and November. The fund may designate a portion of its distributions as capital gains and may also distribute additional capital
gains in the last quarter of the year to meet annual excise distribution requirements. Distribution amounts are subject to change from
time to time at the discretion of the Board.
Leverage
The fund’s leverage utilization decreased $0.3
million during the six months ended May 31, 2024 as compared to the six months ended November 30, 2023, and represented 18.8% of total
assets at May 31, 2024. During the period, the fund maintained compliance with its applicable coverage ratios. The fund utilizes all floating
rate leverage that had an interest rate of 6.33% and represented 18.8% of total assets at year-end. These rates will vary in the future
as a result of changing floating rates.
Please see the Financial Statements and Notes to Financial
Statements for additional detail regarding critical accounting policies, results of operations, leverage and other important fund information.
For further information regarding the fund’s
leverage and distributions to stockholders, as well as a discussion of the tax impact on distributions, please visit www.tortoiseecofin.com.
(unaudited)
TPZ
Key Financial Data (supplemental unaudited
information)
(dollar amounts in thousands unless otherwise indicated)
The information presented below is supplemental
non-GAAP financial information, is not inclusive of required financial disclosures (e.g. Total Expense Ratio), and should be read in conjunction
with the full financial statements.
| | |
2023 | | |
2024 |
| | |
Q1(1) | | |
Q2(1) | | |
Q3(1) | | |
Q4(1) | | |
Q1(1) | | |
Q2(1) | |
| Selected Financial Information | |
| | | |
| | | |
| | | |
| | | |
| | | |
| | |
| Distributions paid on common stock | |
$ | 1,953 | | |
$ | 1,953 | | |
$ | 1,953 | | |
$ | 1,921 | | |
$ | 1,855 | | |
$ | 1,855 | |
| Distributions paid on common stock per share | |
| 0.3150 | | |
| 0.3150 | | |
| 0.3150 | | |
| 0.3150 | | |
| 0.3150 | | |
| 0.3150 | |
| Total assets, end of period | |
| 120,791 | | |
| 118,705 | | |
| 124,656 | | |
| 120,802 | | |
| 124,804 | | |
| 129,248 | |
| Average total assets during period(2) | |
| 122,422 | | |
| 120,322 | | |
| 122,556 | | |
| 122,039 | | |
| 122,267 | | |
| 127,457 | |
| Leverage(3) | |
| 24,900 | | |
| 25,300 | | |
| 25,400 | | |
| 24,600 | | |
| 25,000 | | |
| 24,300 | |
| Leverage as a percent of total assets | |
| 20.6 | % | |
| 21.3 | % | |
| 20.4 | % | |
| 20.4 | % | |
| 20.0 | % | |
| 18.8 | % |
| Operating expenses before leverage costs as a percent of total assets | |
| 1.45 | % | |
| 1.42 | % | |
| 1.40 | % | |
| 0.93 | % | |
| 1.33 | % | |
| 1.38 | % |
| Net unrealized appreciation (depreciation), end of period | |
| 10,915 | | |
| 9,116 | | |
| 15,511 | | |
| 14,867 | | |
| 19,804 | | |
| 26,623 | |
| Net assets, end of period | |
| 95,368 | | |
| 92,800 | | |
| 98,570 | | |
| 95,724 | | |
| 99,386 | | |
| 104,532 | |
| Average net assets during period(4) | |
| 96,730 | | |
| 94,512 | | |
| 97,132 | | |
| 96,174 | | |
| 96,459 | | |
| 103,258 | |
| Net asset value per common share | |
| 15.38 | | |
| 14.97 | | |
| 15.90 | | |
| 16.25 | | |
| 16.87 | | |
| 17.75 | |
| Market value per common share | |
| 13.00 | | |
| 12.47 | | |
| 13.76 | | |
| 13.57 | | |
| 14.56 | | |
| 15.45 | |
| Shares outstanding (000’s) | |
| 6,200 | | |
| 6,200 | | |
| 6,200 | | |
| 5,890 | | |
| 5,890 | | |
| 5,890 | |
| (1) |
Q1 is the period from December through February. Q2 is the period from March through May. Q3 is the period
from June through August. Q4 is the period from September through November. |
| (2) |
Computed by averaging month-end values within each period. |
| (3) |
Leverage consists of outstanding borrowings under the revolving credit facility. |
| (4) |
Computed by averaging daily net assets within each period. |
2024 Semi-Annual Report | May 31, 2024
Ecofin
Sustainable and Social Impact Term Fund (TEAF)
Fund description
The Ecofin Sustainable and Social
Impact Term Fund (TEAF) seeks to provide a high level of total return with an emphasis on current distributions. TEAF provides investors
access to a combination of public and direct investments in essential assets that are making an impact on clients and communities.
Fund Performance
TEAF generated positive performance in the first fiscal
half of 2024, the period ranging from November 30 through May 31, with a NAV return of 4.76% and a market return of 2.06%. This compares
to global infrastructure (measured by S&P Global Infrastructure Index) which returned 11.73%.
| ● |
Listed sustainable infrastructure We still believe decarbonization and electrification trends have
strong momentum. In Europe as well as in the U.S., power prices were rising, erasing early 2024 falls, and earnings results and guidance
were in line with or nicely ahead of consensus expectations, helping to fuel share prices with valuations still relatively low. Additionally,
GenAI and datacenters are still supporting the expectation for power demand growth. |
| ● |
Listed energy infrastructure Listed energy infrastructure investments have been positive drivers of performance in the
TEAF portfolio. Greater visible demand for natural gas from data center driven artificial intelligence (AI) power needs aided the
sector along with continued expectation of U.S. hydrocarbon growth across all energy commodities and the potential for growing exports. |
| ● |
Private social infrastructure closed six new investments during the period and had three realizations. Most of our private
investments have performed positively generating stable cash flows in-line with our expectations during the period. |
| ● |
Private sustainable infrastructure investments have had mixed performance with some assets suffering from age related
and interconnection issues which are all being worked on to reenergize. Other private sustainable assets continued to perform well
and as expected during the quarter. |
Most of TEAF’s social infrastructure assets have
performed well and we expect that performance to continue to generate stable cash flows. We continue to progress on transitioning the
portfolio to the targeted allocation of 60% direct investments. As of May 31, 2024, TEAF’s total direct investment commitments were
approximately $108 million or approximately 49% of the portfolio.
Market Overview
Looking ahead to the rest of 2024, we continue to have
a constructive outlook for the underlying assets in the TEAF portfolio. We expect that listed sustainable infrastructure equities, TEAF’s
largest allocation, may see compelling investment opportunities with valuations at historic lows. Utilities in the portfolio should deliver
predictable non-cyclical earnings growth. GenAI and data centers are supporting the expectation for power demand growth. We continue to
see that decarbonisation and electrification trends have strong momentum with key drivers such as increasing renewables, manufacturing
re-shoring and energy efficiency driving investment. Additionally, corporates and consumers will continue to replace carbon-emitting energy
sources with renewables, ensuring renewables growth at a reasonable rate of return. We maintain a positive outlook for energy infrastructure
equities through the rest of 2024 driven by favorable fundamentals and a focus on capital return to equity owners.
Listed Energy Infrastructure
Listed energy infrastructure were positive drivers
of performance in the TEAF portfolio for the semi-annual fiscal period. Strong equity performance during the period derived from reported
earnings at the high end of expectations, prudent allocation of free cash flow toward dividend growth and opportunistic share repurchases,
disciplined M&A, and a robust 13% inflation tariff escalator. The energy infrastructure equities also benefitted from the continued
expectation of U.S. hydrocarbon growth across all energy commodities and the potential for growing exports. M&A activity was characterized
by bolt-on acquisitions from motivated private equity sellers on the asset side. Prices paid were compelling and deals indicated immediate
synergies with complementary assets. Greater visible demand for natural gas from data center driven AI power needs also aided the sector.
Overall, higher transport volumes, capital allocation favoring shareholders along with low leverage, and constructive energy supply and
demand is leading to boosted confidence in energy infrastructure company growth. We think this environment will continue to be supportive
of valuation into the remainder of 2024.
Listed Sustainable Infrastructure
From a macro perspective, in late 2023, sustainable
infrastructure sectors initially saw some improvement, but by early 2024, utilities and broader infrastructure faced renewed challenges
while tech-oriented sectors led market momentum. Expectations of rate cuts faded due to persistent inflation and robust U.S. growth, pushing
10-year bond yields back above 4%. Warm winter weather
(unaudited)
Ecofin
Sustainable and Social
Impact Term Fund (TEAF) (continued)
and abundant supplies drove down natural gas and power
prices in Europe, hindering power generator stocks. In contrast, the U.S. portfolio benefited from strong demand driven by AI, data centers,
and EVs, bolstering its performance. March brought a rebound in sentiment and portfolio NAV, supported by hopes of easing inflation and
recovering energy prices. Despite uncertainty over interest rates and energy costs, infrastructure valuations showed a modest recovery,
though many remained disconnected from growth prospects. In April, despite rising interest rates and 10-year bond yields, listed infrastructure,
led by utilities with attractive valuations and strong earnings reports, garnered attention amid a cautious market sentiment favoring
defensive assets. The U.S. 10-year Treasury yield reached a year-to-date high of approximately 4.7%, although yield curves remained relatively
flat. Regulated utilities and inflation-protected names performed well mid-month, buoyed by increasing recognition as beneficiaries of
future data center and AI-driven power demands. American Electric Power highlighted accelerated datacenter opportunities contributing
to growth in transmission capex and earnings. Notably, Brookfield’s monumental renewable energy agreement with Microsoft to deliver
10.5 gigawatts (GW) of carbon-free energy underscored the escalating demands from AI, cloud computing, and datacenters. In May, U.S. utilities
continued to shine as renewed growth in power demand, particularly from AI-driven datacenters, boosted baseload power producers and transmission
utilities in both the U.S. and Europe. Despite European utilities trailing their U.S. counterparts, the portfolio saw robust performances
from integrated utilities and environmental services groups. In summary, we continue to look to identify high quality companies with growth
prospects and to keep a balance in the portfolio in terms of risk profiles and are positive about the underlaying drivers for the space
moving into the second half of fiscal year 2024.
Social Infrastructure
TEAF completed six direct investments in the social
impact portfolio during the period.
| ● |
Dublin Classical Academy (“Dublin”) is a new, public charter school in Dublin, Ohio, just outside of Columbus, slated to open in fall of 2024. The school will utilize the Hillsdale Classical Curriculum. It will serve 462 students in grades K-6 in its inaugural year, with a plan to grow by one grade each year until it reaches grades K-12. Only grades K-8 are contemplated in this phase of the project, with the building’s capacity at 700 students. The school’s charter is authorized by St. Aloysius, with an initial charter term of five years. Dublin’s chosen school site is in the northwest suburbs of Columbus, where there is only one school of choice within five miles, and it does not offer a classical curriculum. Dublin will be the first no-cost classical school in the area. The school board and leader/principal are highly experienced with deep ties to the community. The senior bond investment will be used to acquire, renovate, and equip an existing building, while also providing operating capital for the startup of the school. |
| ● |
Celebration Senior Living of Denison (“Celebration” or “Denison”), a not-for-profit corporation, is acquiring a stabilized senior living facility in Denison, Texas (north of Dallas). The facility has 82 units consisting of 66 assisted living units and 16 memory care units. The building was constructed in 2019 and is well-appointed and modern in design and finishes. Denison has been managed by Restoration Senior Living, LLC since opening in late 2019, which will continue to manage the community following the acquisition. The Manager also operates numerous other senior living communities in Texas, Louisiana, South Carolina, Georgia, and Florida, and has over 25 years of management experience. The investment will be used for subordinated secured bond financing which, combined with senior debt and deeply subordinated junior debt, will allow for the acquisition of the operating facility and funding of multiple reserve funds, including a working capital reserve, liquidity support fund, and a debt service reserve fund specific to these subordinated bonds. The liquidity support fund is further enhanced by personal guarantees. |
| ● |
Northeast Ohio Classical Academy (“NEOCA”) is a new, public charter school in Akron, Ohio, slated to open in fall of 2024. The school will utilize the Hillsdale Classical Curriculum. It will serve 350 students in grades K-5 in its inaugural year, with a plan to grow by one grade each year until it reaches grades K-12. Only grades K-7 are contemplated in this phase of the project, with the building’s capacity at 500 students. The school’s charter is authorized by St. Aloysius, with an initial charter term of five years. NEOCA’s chosen school site is in the very northwest corner of Akron, where there are no schools of choice within five miles. NEOCA will be the first no-cost classical school in the area. The school board and leader/principal are highly experienced with deep ties to the community. The senior secured bond investment will be used to acquire, renovate, and equip an existing building. |
| ● |
Jacaranda Trace Senior Living (“Jac Trace”), a not-for-profit corporation, is an existing Continuing Care Retirement Community (CCRC) located in Venice, FL with a total of 491 living units. There are 436 independent living, 19 assisted living, and 36 memory care units. Prior to this financing, 141 of the IL units were owned independently by the residents of those units. Since the current ownership acquired the property in 2022 (for which Ecofin provided subordinated bond financing), it has planned to acquire those independently-owned units as they become available. The company used existing cash on hand to acquire 6 villas for renovation and redeployment as part of its standard offering. Since acquisition, the property has continued to perform reasonably well, with occupancy near 90% and on track to meet all debt covenants. The investment will be used for subordinated secured bond financing which will allow for the acquisition of the six villas and the funding of a reserve fund specific to these subordinated bonds. |
(unaudited)
2024 Semi-Annual Report | May 31, 2024
Ecofin
Sustainable and Social
Impact Term Fund (TEAF) (continued)
| ● |
Belton Preparatory Academy is an existing charter school located in Belton, South Carolina that has been operating since 2018 in a temporary location while it seeks its permanent home. Belton Prep offers a classical education curriculum to an underserved population, with great success--as it was recognized as the top academic Title 1 school in the state of South Carolina. The school currently serves approximately 250 students in grades K-6, and will expand to serve K-8 while increasing enrollment over the next 4 years to reach nearly 700 students enrolled. The investment will be used to finish construction and equipping of the building, allowing the school to move in next Fall. This is the third and final scheduled investment. |
| ● |
Lastly, City View Charter School is an existing charter school located in in Hillsboro, Oregon (outside of Portland), looking to consolidate its operations from two leased facilities into a singular, permanent school campus by the end of 2023. The school has been in operation since 2004, and currently serves approximately 315 students in grades K-8. The school is the authorizer’s first and only charter school program. CVCS uses the Expeditionary Learning (“EL”) Education instructional learning model, a unique approach to hands-on, project-based education which has helped the school outperform its local school district as well as the state in ELL, Math, and Science. The demand for the program is evident, as the school has maintained an average waitlist of 280 students for the past 13 years. The senior secured bond investment will be used to acquire, renovate, and equip an existing building. The school expects to begin using a portion of the building immediately for its middle school, with the remaining students moving in once renovations are complete later in the school year. |
Finally, the fund had three realizations in H1 2024.
| ● |
The first realization was in November from a senior living project that raised additional equity to pay off a tranche of subordinated debt. The original investment was made in September 2020 to acquire an existing senior living facility as part of a capital stack that included senior bank debt and two tranches of subordinated bonds. The sponsor determined that the property would be better served with additional equity rather than the Series B subordinated debt which had a 16% coupon. In return for allowing the Series B debt to be paid off, the fund received all accrued and capitalized interest as well as a price of $103. The fund still holds Series A subordinated debt and received a consent fee for allowing the Series B payoff. The facility continues to perform as expected. |
| ● |
The second was in April from a waste-to-energy facility in North Carolina that was able to successfully complete construction and achieve commercial operations. In order to improve its cash flow and obtain additional capital for further expansion, the project obtained take-out and expansion financing. The investment was allowed to be called early at a price of $108. |
| ● |
The last realization, in April, was a charter school that had management and operations problems, ultimately resulting in the school having to sell the property to partially repay the investment. |
Private Energy Infrastructure
No deals were completed in the private energy infrastructure
portfolio during the period. We continue to have conviction behind greenfield LNG development projects in North America given the geopolitical
landscape for natural gas and favorable pricing spread between domestic supply and the global markets. The fund also remains invested
in MPL, a 15 million metric tonnes per annum (mmtpa) LNG development project focused on bringing Permian sourced gas to the west coast
of Mexico and alleviating the additional transportation costs and time it takes to bring LNG to Asian markets while avoiding Panama Canal
congestion.
Private Sustainable Infrastructure
TEAF did not invest in any additional private sustainable
infrastructure projects during the period.
EF WWW Holdings (World Water Works) – TEAF’s
investment in EF WWW Holdings, LLC, the debt funding of World Water Works Holdings, Inc., has continued to timely pay its annualized interest
rate of 10.5% and report strong credit covenants. The company has exceeded its operating budget in every year since the investment, driven
by strong backlog and revenue growth.
One Energy – As of April 4, 2024, One Energy
will begin controlled restarts of its fleet of wind turbines. On January 22, 2024, a single blade fell from a wind turbine at one of the
Company’s projects in Findlay, Ohio. No one was injured by the event and no part of the blade or debris field left the Company’s
property. The fleet has not been operating while the Company conducted, with the aid of independent engineers and research institutions,
a root cause assessment of the incident and a systematic evaluation of every turbine in its fleet.
The Company has determined that there was an abnormality
with the bolted flange assembly that connects the blade to the hub. The issue was not caused by the blade, the internals of the bearing,
or the blade bolts. The flange abnormality led to a higher than intended load transfer to the blade bolts which resulted in them fatiguing
much faster than designed. The fatigue loads eventually led multiple bolts to have a cascading failure that resulted in the blade completely
separating from the turbine and falling to the ground.
The Company has inspected every major bolted flange
in each of its wind turbines as part of the investigation. Every single field-installed bolt has had, or will have, its torque rechecked
before each turbine begins operating again.
One Energy will begin restarting the turbines in its
fleet that do not have the abnormality. The Company is replacing every single blade bolt in the turbines that have or may have an abnormality.
The Company is also correcting the abnormality in affected turbines. This 100% bolt replacement will restart the fatigue life of the bolts,
and this correction in the flanges assemblies will ensure that the bolts are properly loaded going forward.
(unaudited)
Ecofin
Sustainable and Social
Impact Term Fund (TEAF) (continued)
In conjunction with the independent engineers and research
institutions’ support, the Company has developed new monitoring programs and testing programs that it plans to implement and share
with the wind industry. These new methods will allow the Company to gain industry-leading insights into the real-time loads on its bolts
and the conditions of its flanges going forward.
TEAF is an investor in One Energy’s 9.00% convertible
preferred stock at the corporate/Holdco level. One Energy does not expect this event to have a material effect on its financial performance.
Solar Assets:
Renewable Holdco I, LLC Solar (DG Solar - Portfolio
of 14 solar assets across 4 states: CO, FL, NJ and PR) – Energy production at various operating distributed generation (“DG”)
solar assets in the Renewable Holdco I, LLC portfolio have underperformed expectations, primarily caused by inverter issues and certain
communications equipment failures inherent in the age of the assets and have required corrective maintenance attention. Certain of the
small rooftop projects in Puerto Rico within the Renewable Holdco I, LLC portfolio are expected to be reenergized in 2024 after experiencing
downtime related to required corrective maintenance. Various third-party inspections and off taker approval are required for these to
be reenergized. As such, Ecofin’s internal asset management team is taking an active role in monitoring efforts to restore full
energy production and returning the portfolio to stable cash flow generation.
Renewable Holdco II, LLC Solar - (Portfolio of 2 solar
projects in MA and CA) – Energy production at the operating DG solar assets in the Renewable Holdco II, LLC portfolio have continued
to generate stable cash flow as expected.
Renewable Holdco, LLC (Blackstone Milk Street) –
The final solar project under construction, held in Renewable Holdco, LLC, has continued to experience delays due to interconnection redesign,
additional permitting and road construction caused by the utility and is expected to be ready for commissioning and commercial operation
in H2 2024.
Saturn Solar Bermuda 1 – The construction note
has continued to pay its annualized interest rate of 10.0% on time. The payments are supported by cash flow of the now operational solar
project since the project completed construction and began full operations in November 2021. The note has remained in place as the owner
of the solar facility is seeking to sell the solar project to a new long-term owner/operator.
| 2024 mid-fiscal year
summary |
|
| Quarterly distributions paid per share |
$0.2700 |
| Monthly distributions paid per share |
$0.0900 |
| Distribution rate (as of 5/31/2024) |
9.2% |
| Year-over-year distribution increase (decrease) |
0.0% |
| Cumulative distribution to stockholders since inception in July 2009 |
$5.4305 |
| Market-based total return |
2.06% |
| NAV-based total return |
4.76% |
| Premium (discount) to NAV (as of 5/31/2024) |
(21.1)% |
Performance data quoted represent past performance;
past performance does not guarantee future results. Like any other stock, total return and market value will fluctuate so that an investment,
when sold, may be worth more or less than its original cost. Portfolio composition is subject to change due to ongoing management of the
fund. References to specific securities or sectors should not be construed as a recommendation by the fund or its adviser. See Schedule
of Investments for portfolio weighting at the end of the fiscal quarter.
(unaudited)
2024 Semi-Annual Report | May 31, 2024
Ecofin
Sustainable and Social
Impact Term Fund (TEAF) (continued)
Value
of $10,000 vs. Ecofin Sustainable and Social Impact Term Fund – Market (unaudited)
Since inception on March 29, 2019 through May 31,
2024
The chart assumes an initial investment of $10,000.
Performance reflects waivers of fee and operating expenses in effect. In the absence of such waivers, total return would be reduced. Performance
data quoted represents past performance and does not guarantee future results. Investment returns and principal value will fluctuate,
and when sold, may be worth more or less than their original cost. Performance current to the most recent month-end may be lower or higher
than the performance quoted and can be obtained by calling 866-362-9331. Performance assumes the reinvestment of capital gains and income
distributions. The performance does not reflect the deduction of taxes that a shareholder would pay on Fund distributions or the redemption
of Fund shares.
Annualized Rates of Return as of
May 31, 2024
| | |
1-Year | |
3-Year | |
5-Year | |
Since
Inception(1) |
| Ecofin Sustainable and Social Impact Term Fund – NAV | |
| 4.37% | | |
| 3.69% | | |
| 3.06% | | |
| 2.00% | |
| Ecofin Sustainable and Social Impact Term Fund – Market | |
| 4.37% | | |
| 0.13% | | |
| -1.20% | | |
| -2.58% | |
| S&P Global Infrastructure Index | |
| 13.59% | | |
| 6.02% | | |
| 6.07% | | |
| 5.83% | |
| (1) |
Inception date of the Fund was March 29, 2019. |
Fund structure and distribution
policy
The fund is structured to qualify as a Regulated Investment
Company (RIC) allowing it to pass-through to shareholders income and capital gains earned, thus avoiding double-taxation. To qualify as
a RIC, the fund must meet specific income, diversification and distribution requirements. Regarding income, at least 90 percent of the
fund gross income must be from dividends, interest and capital gains. The fund must meet quarterly diversification requirements including
the requirement that at least 50 percent of the assets be in cash, cash equivalents or other securities with each single issuer of other
securities not greater than 5 percent of total assets. No more than 25 percent of total assets can be invested in any one issuer other
than government securities or other RIC’s. The fund must also distribute at least 90 percent of its investment company income. RIC’s
are also subject to excise tax rules which require RIC’s to distribute approximately 98 percent of net income and net capital gains
to avoid a 4 percent excise tax.
The fund has adopted a distribution policy which is
included on the inside front cover of this report. To summarize, the fund has adopted a managed distribution policy (“MDP”).
Annual distribution amounts are expected to fall in the range of 6% to 8% of the average week-ending net asset value (“NAV”)
per share for the prior fiscal semi-annual period. Distribution amounts will be reset both up and down to provide a consistent return
on trailing NAV. Under the MDP, distribution amounts will normally be reset in February and August, with no changes in distribution amounts
in May and November. The fund may designate a portion of its distributions as capital gains and may also distribute additional capital
gains in the last quarter of the year to meet annual excise distribution requirements. Distribution amounts are subject to change from
time to time at the discretion of the Board.
Leverage
The fund’s leverage utilization decreased $3.1
million during the six months ended May 31, 2024, as compared to six months ended November 30, 2023. The fund utilizes all floating rate
leverage that had an interest rate of 6.33% and represented 9.4% of total assets at year-end. During the period, the fund maintained compliance
with its applicable coverage ratios. The interest rate on the fund’s leverage will vary in the future along with changing floating
rates.
Please see the Financial Statements and Notes to Financial
Statements for additional detail regarding critical accounting policies, results of operations, leverage and other important fund information.
For further information regarding the fund’s
leverage and distributions to stockholders, as well as a discussion of the tax impact on distributions, please visit www.tortoiseecofin.com.
(unaudited)
TEAF Key Financial
Data (supplemental unaudited
information)
(dollar amounts in thousands unless otherwise indicated)
The information presented below is supplemental
non-GAAP financial information, is not inclusive of required financial disclosures (e.g. Total Expense Ratio), and should be read in conjunction
with the full financial statements.
| | |
2023 | | |
2024 |
| | |
Q1(1) | | |
Q2(1) | | |
Q3(1) | | |
Q4(1) | | |
Q1(1) | | |
Q2(1) | |
| Selected Financial Information | |
| | | |
| | | |
| | | |
| | | |
| | | |
| | |
| Distributions paid on common stock | |
$ | 3,642 | | |
$ | 3,643 | | |
$ | 3,643 | | |
$ | 3,643 | | |
$ | 3,643 | | |
$ | 3,643 | |
| Distributions paid on common stock per share | |
| 0.2700 | | |
| 0.2700 | | |
| 0.2700 | | |
| 0.2700 | | |
| 0.2700 | | |
| 0.2700 | |
| Total assets, end of period | |
| 246,004 | | |
| 240,640 | | |
| 239,671 | | |
| 225,072 | | |
| 220,254 | | |
| 221,820 | |
| Average total assets during period(2) | |
| 248,950 | | |
| 246,215 | | |
| 241,187 | | |
| 231,121 | | |
| 225,597 | | |
| 218,275 | |
| Leverage(3) | |
| 30,800 | | |
| 29,500 | | |
| 30,600 | | |
| 24,000 | | |
| 23,200 | | |
| 20,900 | |
| Leverage as a percent of total assets | |
| 12.5 | % | |
| 12.3 | % | |
| 12.8 | % | |
| 10.7 | % | |
| 10.5 | % | |
| 9.4 | % |
| Operating expenses before leverage costs as a percent of total assets | |
| 1.61 | % | |
| 1.63 | % | |
| 1.60 | % | |
| 1.58 | % | |
| 1.64 | % | |
| 1.69 | % |
| Net unrealized appreciation (depreciation), end of period | |
| (912 | ) | |
| (1,269 | ) | |
| (1,168 | ) | |
| (6,150 | ) | |
| (10,314 | ) | |
| (5,042 | ) |
| Net assets, end of period | |
| 214,163 | | |
| 210,062 | | |
| 208,057 | | |
| 200,258 | | |
| 196,303 | | |
| 200,265 | |
| Average net assets during period(4) | |
| 218,352 | | |
| 214,413 | | |
| 210,656 | | |
| 201,953 | | |
| 199,309 | | |
| 197,990 | |
| Net asset value per common share | |
| 15.87 | | |
| 15.57 | | |
| 15.42 | | |
| 14.84 | | |
| 14.55 | | |
| 14.84 | |
| Market value per common share | |
| 12.97 | | |
| 12.28 | | |
| 12.62 | | |
| 12.01 | | |
| 11.32 | | |
| 11.70 | |
| Shares outstanding (000’s) | |
| 13,491 | | |
| 13,491 | | |
| 13,491 | | |
| 13,491 | | |
| 13,491 | | |
| 13,491 | |
| (1) |
Q1 represents the period from December through February. Q2 represents the period from March through May.
Q3 represents the period from June through August. Q4 represents the period from September through November. |
| (2) |
Computed by averaging month-end values within each period. |
| (3) |
Leverage consists of outstanding borrowings under the margin loan facility. |
| (4) |
Computed by averaging daily net assets within each period. |
| |
| |
| 2024 Semi-Annual Report | May 31, 2024 |
| |
TYG Consolidated Schedule of Investments (unaudited)
May 31, 2024 |
| | |
Shares/Units | | |
Fair Value | |
| | |
| | |
| |
| Common Stocks — 98.0% | |
| | | |
| | |
| United States Crude Oil Pipelines — 2.4% | |
| | | |
| | |
| Plains GP Holdings LP | |
| 583,730 | | |
$ | 10,512,978 | |
| | |
| | | |
| | |
| United States Natural Gas Gathering/Processing — 11.5% | |
| | | |
| | |
| Antero Midstream Corp. | |
| 488,403 | | |
| 7,155,104 | |
| EnLink Midstream LLC | |
| 520,687 | | |
| 6,607,518 | |
| Hess Midstream Partners LP | |
| 979,135 | | |
| 34,024,941 | |
| Kinetik Holdings, Inc. | |
| 54,924 | | |
| 2,251,335 | |
| | |
| | | |
| 50,038,898 | |
| | |
| | | |
| | |
| United States Natural Gas/Natural Gas Liquids Pipelines — 42.6% | |
| | | |
| | |
| Cheniere Energy, Inc. | |
| 127,233 | | |
| 20,076,095 | |
| DT Midstream, Inc. | |
| 114,114 | | |
| 7,654,767 | |
| Excelerate Energy, Inc. | |
| 57,737 | | |
| 1,028,296 | |
| Kinder Morgan, Inc. | |
| 897,060 | | |
| 17,483,700 | |
| New Fortress Energy, Inc. | |
| 176,000 | | |
| 4,461,600 | |
| NextDecade Corp.(a) | |
| 443,864 | | |
| 3,178,066 | |
| ONEOK, Inc. | |
| 511,748 | | |
| 41,451,588 | |
| Targa Resources Corp. | |
| 388,547 | | |
| 45,937,912 | |
| The Williams Companies, Inc. | |
| 1,069,126 | | |
| 44,379,420 | |
| | |
| | | |
| 185,651,444 | |
| | |
| | | |
| | |
| United States Renewables and Power Infrastructure — 41.5% | |
| | | |
| | |
| AES Corp. | |
| 708,155 | | |
| 15,289,066 | |
| Ameren Corp. | |
| 102,867 | | |
| 7,547,352 | |
| Atlantica Sustainable Infrastructure Plc | |
| 166,847 | | |
| 3,667,297 | |
| Clearway Energy, Inc. | |
| 623,982 | | |
| 17,471,496 | |
| CMS Energy Corp. | |
| 250,513 | | |
| 15,764,783 | |
| Constellation Energy Corp. | |
| 128,894 | | |
| 28,002,221 | |
| DTE Energy Co. | |
| 72,688 | | |
| 8,470,333 | |
| NextEra Energy Partners LP | |
| 416,688 | | |
| 14,046,552 | |
| NextEra Energy, Inc. | |
| 254,977 | | |
| 20,403,260 | |
| Sempra Energy | |
| 519,456 | | |
| 40,013,696 | |
| Vistra Corp. | |
| 103,502 | | |
| 10,254,978 | |
| | |
| | | |
| 180,931,034 | |
Total Common Stocks
(Cost $418,615,002) | |
| | | |
| 427,134,354 | |
| | |
| | | |
| | |
| Master Limited Partnerships — 25.4% | |
| | | |
| | |
| United States Natural Gas Gathering/Processing — 5.0% | |
| | | |
| | |
| Western Midstream Partners LP | |
| 583,326 | | |
| 21,769,726 | |
| | |
| | | |
| | |
| United States Natural Gas/Natural Gas Liquids Pipelines — 11.5% | |
| | | |
| | |
| Energy Transfer LP | |
| 1,879,085 | | |
| 29,445,262 | |
| Enterprise Products Partners LP | |
| 729,194 | | |
| 20,782,029 | |
| | |
| | | |
| 50,227,291 | |
| | |
| | | |
| | |
| United States Refined Product Pipelines — 8.9% | |
| | | |
| | |
| MPLX LP | |
| 947,355 | | |
| 38,538,402 | |
Total Master Limited Partnerships
(Cost $60,553,608) | |
| | | |
| 110,535,419 | |
| | |
| | |
| |
| Private Investments — 2.4% | |
| | | |
| | |
| United States Renewables — 2.4% | |
| | | |
| | |
| TK NYS Solar Holdco LLC(b)(c)(d) | |
| N/A | | |
| 10,400,393 | |
Total Private Investments
(Cost $50,141,470) | |
| | | |
| 10,400,393 | |
| | |
| | | |
| | |
| Preferred Stock — 1.2% | |
| | | |
| | |
| United States Natural Gas Gathering/Processing — 1.2% | |
| | | |
| | |
EnLink Midstream Partners, 9.70%
(3 mo. Term SOFR + 4.37%),
Perpetual | |
| 5,100 | | |
| 5,044,684 | |
Total Preferred Stock
(Cost $5,100,000) | |
| | | |
| 5,044,684 | |
| | |
| | | |
| | |
| Short-Term Investments — 0.1% | |
| | | |
| | |
| Money Market Funds — 0.1% | |
| | | |
| | |
| Invesco Government & Agency Portfolio — Class Institutional, 5.24%(e) | |
| 638,974 | | |
| 638,974 | |
Total Short-Term Investments
(Cost $638,974) | |
| | | |
| 638,974 | |
| | |
| | | |
| | |
Total Investments — 127.1%
(Cost $535,049,054) | |
| | | |
| 553,753,824 | |
| Liabilities in Excess of Other Assets — (0.6)% | |
| | | |
| (2,360,253 | ) |
| Credit Facility Borrowings — (6.8)% | |
| | | |
| (29,600,000 | ) |
| Senior Notes — (11.5)% | |
| | | |
| (50,333,333 | ) |
| Mandatory Redeemable Preferred Stock at Liquidation Value — (8.2)% | |
| | | |
| (35,660,610 | ) |
| Total Net Assets — 100.0% | |
| | | |
$ | 435,799,628 | |
Percentages are stated as a percent of net assets.
PLC – Public Limited Company
SOFR – Secured Overnight Financing Rate
| (a) |
Non-income producing security. |
| (b) |
Fair value determined using significant unobservable inputs in accordance with procedures established by and under the supervision
of the Adviser, acting as Valuation Designee. |
| |
These securities represented $10,400,393 or 2.4% of net assets as of May 31, 2024. |
| (c) |
Deemed to be an affiliate of the fund. |
| (d) |
Restricted securities have a total fair value of $10,400,393 which represents 2.4% of net assets. |
| (e) |
The rate shown represents the 7-day effective yield as of May 31, 2024. |
See accompanying Notes to Financial Statements.
| |
| |
NTG Schedule of Investments (unaudited)
May 31, 2024 |
| | |
Shares | | |
Fair Value | |
| | |
| | |
| |
| Common Stocks — 94.2% | |
| | | |
| | |
| Canada Crude Oil Pipelines — 8.0% | |
| | | |
| | |
| Enbridge, Inc. | |
| 256,103 | | |
$ | 9,368,248 | |
| Pembina Pipeline Corp. | |
| 278,903 | | |
| 10,355,668 | |
| | |
| | | |
| 19,723,916 | |
| | |
| | | |
| | |
| Canada Natural Gas/Natural Gas Liquids Pipelines — 2.4% | |
| | | |
| | |
| TC Energy Corp. | |
| 153,709 | | |
| 5,927,019 | |
| | |
| | | |
| | |
| United States Crude Oil Pipelines — 9.6% | |
| | | |
| | |
| Plains GP Holdings LP | |
| 1,315,066 | | |
| 23,684,339 | |
| | |
| | | |
| | |
| United States Natural Gas Gathering/Processing — 10.8% | |
| | | |
| | |
| EnLink Midstream LLC | |
| 416,809 | | |
| 5,289,306 | |
| Hess Midstream Partners LP | |
| 560,705 | | |
| 19,484,499 | |
| Kinetik Holdings, Inc. | |
| 46,011 | | |
| 1,885,991 | |
| | |
| | | |
| 26,659,796 | |
| | |
| | | |
| | |
| United States Natural Gas/Natural Gas Liquids Pipelines — 52.5% | |
| | | |
| | |
| Cheniere Energy, Inc. | |
| 71,192 | | |
| 11,233,386 | |
| DT Midstream, Inc. | |
| 208,030 | | |
| 13,954,652 | |
| Excelerate Energy, Inc. | |
| 70,562 | | |
| 1,256,709 | |
| Kinder Morgan, Inc. | |
| 641,386 | | |
| 12,500,613 | |
| New Fortress Energy, Inc. | |
| 109,719 | | |
| 2,781,377 | |
| NextDecade Corp.(a) | |
| 228,576 | | |
| 1,636,604 | |
| ONEOK, Inc. | |
| 327,155 | | |
| 26,499,555 | |
| Targa Resources Corp. | |
| 256,335 | | |
| 30,306,487 | |
| The Williams Companies, Inc. | |
| 710,249 | | |
| 29,482,436 | |
| | |
| | | |
| 129,651,819 | |
| | |
| | | |
| | |
| United States Renewables and Power Infrastructure — 10.8% | |
| | | |
| | |
| Atlantica Sustainable Infrastructure Plc | |
| 103,016 | | |
| 2,264,292 | |
| Clearway Energy, Inc. | |
| 322,762 | | |
| 9,037,336 | |
| NextEra Energy Partners LP | |
| 228,384 | | |
| 7,698,825 | |
| NextEra Energy, Inc. | |
| 26,725 | | |
| 2,138,534 | |
| Vistra Corp. | |
| 56,593 | | |
| 5,607,234 | |
| | |
| | | |
| 26,746,221 | |
Total Common Stocks
(Cost $214,584,338) | |
| | | |
| 232,393,110 | |
| | |
| | | |
| | |
| | |
Shares/Units | | |
| |
| | |
| | |
| |
| Master Limited Partnerships — 27.5% | |
| | | |
| | |
| United States Natural Gas Gathering/Processing — 5.3% | |
| | | |
| | |
| Western Midstream Partners LP | |
| 352,572 | | |
| 13,157,987 | |
| | |
| | | |
| | |
| United States Natural Gas/Natural Gas Liquids Pipelines — 11.8% | |
| | | |
| | |
| Energy Transfer LP | |
| 962,003 | | |
| 15,074,587 | |
| Enterprise Products Partners LP | |
| 489,300 | | |
| 13,945,050 | |
| | |
| | | |
| 29,019,637 | |
| | |
| | | |
| | |
| United States Refined Product Pipelines — 10.4% | |
| | | |
| | |
| MPLX LP | |
| 630,996 | | |
| 25,668,917 | |
Total Master Limited Partnerships
(Cost $40,635,896) | |
| | | |
| 67,846,541 | |
| | |
| | | |
| | |
| Preferred Stock — 1.3% | |
| | | |
| | |
| United States Natural Gas Gathering/Processing — 1.3% | |
| | | |
| | |
EnLink Midstream Partners, 9.70%
(3 mo. Term SOFR + 4.37%),
Perpetual | |
| 3,400 | | |
| 3,363,123 | |
Total Preferred Stock
(Cost $3,400,000) | |
| | | |
| 3,363,123 | |
| | |
| | | |
| | |
| Short-Term Investments — 0.2% | |
| | | |
| | |
| Money Market Funds — 0.2% | |
| | | |
| | |
| First American Government Obligations Fund — Class X, 5.23%(b) | |
| 465,124 | | |
| 465,124 | |
Total Short-Term Investments
(Cost $465,124) | |
| | | |
| 465,124 | |
| | |
| | | |
| | |
Total Investments — 123.2%
(Cost $259,085,358) | |
| | | |
| 304,067,898 | |
| Liabilities in Excess of Other Assets — (0.3)% | |
| | | |
| (675,725 | ) |
| Credit Facility Borrowings — (5.5)% | |
| | | |
| (13,700,000 | ) |
| Senior Notes — (11.8)% | |
| | | |
| (29,170,677 | ) |
| Mandatory Redeemable Preferred Stock at Liquidation Value — (5.6)% | |
| | | |
| (13,753,775 | ) |
| Total Net Assets — 100.0% | |
| | | |
$ | 246,767,721 | |
Percentages are stated as a percent of net assets.
PLC – Public Limited Company
SOFR – Secured Overnight Financing Rate
| (a) |
Non-income producing security. |
| (b) |
The rate shown represents the 7-day effective yield as
of May 31, 2024. |
See accompanying Notes to Financial Statements.
| |
| |
| 2024 Semi-Annual Report | May 31, 2024 |
| |
TTP Schedule of Investments (unaudited)
May 31, 2024 |
| | |
Shares | | |
Fair Value | |
| | |
| | |
| |
| Common Stocks — 98.3% | |
| | | |
| | |
| Canada Crude Oil Pipelines — 14.9% | |
| | | |
| | |
| Enbridge, Inc. | |
| 172,836 | | |
$ | 6,322,341 | |
| Gibson Energy, Inc. | |
| 50,815 | | |
| 849,309 | |
| Pembina Pipeline Corp. | |
| 124,957 | | |
| 4,641,823 | |
| | |
| | | |
| 11,813,473 | |
| | |
| | | |
| | |
| Canada Natural Gas/Natural Gas Liquids Pipelines — 7.4% | |
| | | |
| | |
| Keyera Corp. | |
| 78,735 | | |
| 2,084,850 | |
| TC Energy Corp. | |
| 98,117 | | |
| 3,783,391 | |
| | |
| | | |
| 5,868,241 | |
| | |
| | | |
| | |
| United States Crude Oil Pipelines — 11.5% | |
| | | |
| | |
| Plains GP Holdings LP | |
| 508,250 | | |
| 9,153,583 | |
| | |
| | | |
| | |
| United States Natural Gas Gathering/Processing — 12.9% | |
| | | |
| | |
| Antero Midstream Corp. | |
| 141,044 | | |
| 2,066,295 | |
| Equitrans Midstream Corp. | |
| 307,343 | | |
| 4,388,858 | |
| Hess Midstream Partners LP | |
| 98,550 | | |
| 3,424,612 | |
| Kinetik Holdings, Inc. | |
| 8,934 | | |
| 366,205 | |
| | |
| | | |
| 10,245,970 | |
| | |
| | | |
| | |
| United States Natural Gas/Natural Gas Liquids Pipelines — 47.1% | |
| | | |
| | |
| Cheniere Energy, Inc. | |
| 22,822 | | |
| 3,601,083 | |
| DT Midstream, Inc. | |
| 15,694 | | |
| 1,052,754 | |
| Excelerate Energy, Inc. | |
| 8,917 | | |
| 158,812 | |
| Kinder Morgan, Inc. | |
| 389,508 | | |
| 7,591,511 | |
| NextDecade Corp.(a) | |
| 70,953 | | |
| 508,023 | |
| ONEOK, Inc. | |
| 116,871 | | |
| 9,466,551 | |
| Targa Resources Corp. | |
| 46,463 | | |
| 5,493,321 | |
| The Williams Companies, Inc. | |
| 230,187 | | |
| 9,555,062 | |
| | |
| | | |
| 37,427,117 | |
| | |
| | | |
| | |
| United States Renewables and Power Infrastructure — 4.5% | |
| | | |
| | |
| Clearway Energy, Inc. | |
| 22,000 | | |
| 616,000 | |
| NextEra Energy Partners LP | |
| 15,014 | | |
| 506,122 | |
| Sempra Energy | |
| 32,242 | | |
| 2,483,601 | |
| | |
| | | |
| 3,605,723 | |
Total Common Stocks
(Cost $58,471,572) | |
| | | |
| 78,114,107 | |
| | |
| | | |
| | |
| | |
Shares/Units | | |
| |
| | |
| | |
| |
| Master Limited Partnerships — 22.3% | |
| | | |
| | |
| United States Natural Gas Gathering/Processing — 3.8% | |
| | | |
| | |
| Western Midstream Partners LP | |
| 82,032 | | |
| 3,061,434 | |
| | |
| | | |
| | |
| United States Natural Gas/Natural Gas Liquids Pipelines — 11.3% | |
| | | |
| | |
| Energy Transfer LP | |
| 292,468 | | |
| 4,582,974 | |
| Enterprise Products Partners LP | |
| 153,368 | | |
| 4,370,988 | |
| | |
| | | |
| 8,953,962 | |
| | |
| | | |
| | |
| United States Other — 0.1% | |
| | | |
| | |
| Westlake Chemical Partners LP | |
| 4,940 | | |
| 115,448 | |
| | |
| | | |
| | |
| United States Refined Product Pipelines — 7.1% | |
| | | |
| | |
| MPLX LP | |
| 113,530 | | |
| 4,618,400 | |
| Sunoco LP | |
| 19,354 | | |
| 987,054 | |
| | |
| | | |
| 5,605,454 | |
Total Master Limited Partnerships
(Cost $7,668,199) | |
| | | |
| 17,736,298 | |
| | |
| | | |
| | |
| Short-Term Investments — 0.4% | |
| | | |
| | |
| Money Market Funds — 0.4% | |
| | | |
| | |
| Invesco Government & Agency Portfolio — Class Institutional, 5.24%(b) | |
| 356,578 | | |
| 356,578 | |
Total Short-Term Investments
(Cost $356,578) | |
| | | |
| 356,578 | |
| | |
| | | |
| | |
Total Investments — 121.0%
(Cost $66,496,349) | |
| | | |
| 96,206,983 | |
| Liabilities in Excess of Other Assets – (0.0)% | |
| | | |
| (30,588 | ) |
| Credit Facility Borrowings — (8.3)% | |
| | | |
| (6,700,000 | ) |
| Senior Notes — (5.0)% | |
| | | |
| (3,942,857 | ) |
| Mandatory Redeemable Preferred Stock at Liquidation Value — (7.7)% | |
| | | |
| (6,100,000 | ) |
| Total Net Assets — 100.0% | |
| | | |
$ | 79,433,538 | |
Percentages are stated as a percent of net assets.
NV – Naamloze Vennootschap
| (a) |
Non-income producing security. |
| (b) |
The rate shown represents the 7-day effective yield as
of May 31, 2024. |
See accompanying Notes to Financial Statements.
| |
| |
NDP Schedule of Investments (unaudited)
May 31, 2024 |
| | |
Shares | | |
Fair Value | |
| | |
| | |
| |
| Common Stocks — 93.4% | |
| | | |
| | |
| Canada Crude Oil Pipelines — 1.3% | |
| | | |
| | |
| Enbridge, Inc. | |
| 23,865 | | |
$ | 872,982 | |
| | |
| | | |
| | |
| Canada Natural Gas/Natural Gas Liquids Pipelines — 1.1% | |
| | | |
| | |
| TC Energy Corp. | |
| 19,745 | | |
| 761,367 | |
| | |
| | | |
| | |
| Canada Oil and Gas Production — 2.5% | |
| | | |
| | |
| Suncor Energy, Inc. | |
| 40,528 | | |
| 1,654,353 | |
| | |
| | | |
| | |
| United States Natural Gas Gathering/Processing — 3.7% | |
| | | |
| | |
| Kinetik Holdings, Inc. | |
| 5,678 | | |
| 232,741 | |
| Kodiak Gas Services, Inc. | |
| 79,293 | | |
| 2,184,522 | |
| | |
| | | |
| 2,417,263 | |
| | |
| | | |
| | |
| United States Natural Gas/Natural Gas Liquids Pipelines — 22.8% | |
| | | |
| | |
| Cheniere Energy, Inc. | |
| 37,456 | | |
| 5,910,182 | |
| Excelerate Energy, Inc. — Class A | |
| 6,209 | | |
| 110,582 | |
| Kinder Morgan, Inc. | |
| 56,165 | | |
| 1,094,656 | |
| NextDecade Corp.(a) | |
| 55,204 | | |
| 395,261 | |
| ONEOK, Inc. | |
| 19,585 | | |
| 1,586,385 | |
| Targa Resources Corp. | |
| 37,880 | | |
| 4,478,553 | |
| The Williams Companies, Inc. | |
| 36,175 | | |
| 1,501,624 | |
| | |
| | | |
| 15,077,243 | |
| | |
| | | |
| | |
| United States Oil and Gas Production — 56.9% | |
| | | |
| | |
| Chevron Corp. | |
| 18,828 | | |
| 3,055,784 | |
| ConocoPhillips | |
| 21,747 | | |
| 2,533,091 | |
| Coterra Energy, Inc. | |
| 50,396 | | |
| 1,437,294 | |
| Devon Energy Corp. | |
| 71,583 | | |
| 3,513,294 | |
| Diamondback Energy, Inc. | |
| 37,179 | | |
| 7,408,288 | |
| EOG Resources, Inc. | |
| 23,070 | | |
| 2,873,368 | |
| EQT Corp. | |
| 117,402 | | |
| 4,824,048 | |
| Exxon Mobil Corp. | |
| 58,830 | | |
| 6,898,406 | |
| Marathon Oil Corp. | |
| 81,694 | | |
| 2,365,858 | |
| Occidental Petroleum Corp. | |
| 43,302 | | |
| 2,706,375 | |
| | |
| | | |
| 37,615,806 | |
| | |
| | | |
| | |
| United States Other — 2.1% | |
| | | |
| | |
| Baker Hughes Co. | |
| 38,763 | | |
| 1,297,785 | |
| Darling Ingredients, Inc.(a) | |
| 1,957 | | |
| 79,063 | |
| | |
| | | |
| 1,376,848 | |
| | |
| | | |
| | |
| United States Renewables and Power Infrastructure — 3.0% | |
| | | |
| | |
| American Electric Power Co., Inc. | |
| 2,921 | | |
| 263,620 | |
| Constellation Energy Corp. | |
| 8,071 | | |
| 1,753,425 | |
| | |
| | | |
| 2,017,045 | |
Total Common Stocks
(Cost $33,507,559) | |
| | | |
| 61,792,907 | |
| | |
| | | |
| | |
| | |
Shares/Units | | |
| |
| | |
| | |
| |
| Master Limited Partnerships — 21.4% | |
| | | |
| | |
| United States Natural Gas Gathering/Processing — 4.1% | |
| | | |
| | |
| Western Midstream Partners LP | |
| 72,535 | | |
| 2,707,006 | |
| | |
| | | |
| | |
| United States Natural Gas/Natural Gas Liquids Pipelines — 10.8% | |
| | | |
| | |
| Energy Transfer LP | |
| 293,256 | | |
| 4,595,322 | |
| Enterprise Products Partners LP | |
| 89,274 | | |
| 2,544,309 | |
| | |
| | | |
| 7,139,631 | |
| | |
| | | |
| | |
| United States Oil and Gas Production — 2.4% | |
| | | |
| | |
| Mach Natural Resources LP | |
| 26,315 | | |
| 506,037 | |
| TXO Partners LP | |
| 50,000 | | |
| 1,074,000 | |
| | |
| | | |
| 1,580,037 | |
| | |
| | | |
| | |
| United States Refined Product Pipelines — 4.1% | |
| | | |
| | |
| MPLX LP | |
| 66,440 | | |
| 2,702,779 | |
Total Master Limited Partnerships
(Cost $8,980,242) | |
| | | |
| 14,129,453 | |
| | |
| | | |
| | |
| Short-Term Investments — 0.5% | |
| | | |
| | |
| Money Market Funds — 0.5% | |
| | | |
| | |
| Invesco Government & Agency Portfolio — Class Institutional, 5.24%(b) | |
| 320,012 | | |
| 320,012 | |
Total Short-Term Investments
(Cost $320,012) | |
| | | |
| 320,012 | |
| | |
| | | |
| | |
Total Investments — 115.3%
(Cost $42,807,813) | |
| | | |
| 76,242,372 | |
| Other Assets in Excess of Liabilities — 0.1% | |
| | | |
| 79,278 | |
| Credit Facility Borrowings — (15.4)% | |
| | | |
| (10,200,000 | ) |
| Total Net Assets — 100.0% | |
| | | |
$ | 66,121,650 | |
Percentages are stated as a percent of net assets.
| (a) |
Non-income producing security. |
| (b) |
The rate shown represents the 7-day effective yield as
of May 31, 2024. |
See accompanying Notes to Financial Statements.
| |
| |
| 2024 Semi-Annual Report | May 31, 2024 |
| |
TPZ Schedule of Investments (unaudited)
May 31, 2024 |
| | |
Principal Amount | | |
Fair Value | |
| | |
| | |
| |
| Corporate Bonds — 56.2% | |
| | | |
| | |
| Canada Crude Oil Pipelines — 6.3% | |
| | | |
| | |
Enbridge, Inc.,
5.50% to 07/15/2027 then
3 mo. Term SOFR + 3.68%,
07/15/2077 | |
$ | 7,042,000 | | |
$ | 6,622,409 | |
| United States Natural Gas Gathering/Processing — 19.1% | |
| | | |
| | |
Antero Midstream Partners LP,
5.75%, 03/01/2027(a) | |
| 3,800,000 | | |
| 3,748,365 | |
Blue Racer Midstream LLC,
6.63%, 07/15/2026(a) | |
| 2,950,000 | | |
| 2,946,802 | |
EnLink Midstream LLC,
6.50%, 09/01/2030(a) | |
| 2,000,000 | | |
| 2,042,990 | |
Hess Corp.,
5.63%, 02/15/2026(a) | |
| 4,160,000 | | |
| 4,134,611 | |
Kodiak Gas Services LLC,
7.25%, 02/15/2029(a) | |
| 4,000,000 | | |
| 4,062,215 | |
The Williams Companies, Inc.,
4.55%, 06/24/2024 | |
| 3,000,000 | | |
| 2,997,225 | |
| | |
| | | |
| 19,932,208 | |
| | |
| | | |
| | |
| United States Natural Gas/Natural Gas Liquids Pipelines — 20.8% | |
| | | |
| | |
Cheniere Energy, Inc.,
4.63%, 10/15/2028 | |
| 3,100,000 | | |
| 2,987,028 | |
DT Midstream, Inc.,
4.38%, 06/15/2031(a) | |
| 2,000,000 | | |
| 1,796,299 | |
NGPL PipeCo LLC,
3.25%, 07/15/2031(a) | |
| 3,500,000 | | |
| 2,968,029 | |
ONEOK, Inc.,
6.35%, 01/15/2031 | |
| 3,000,000 | | |
| 3,124,692 | |
Tallgrass Energy LP,
5.50%, 01/15/2028(a) | |
| 3,250,000 | | |
| 3,099,895 | |
Targa Resources Corp.,
5.20%, 07/01/2027 | |
| 4,000,000 | | |
| 3,981,135 | |
Venture Global LNG, Inc.,
9.88%, 02/01/2032(a) | |
| 3,500,000 | | |
| 3,752,926 | |
| | |
| | | |
| 21,710,004 | |
| | |
| | | |
| | |
| United States Other — 4.5% | |
| | | |
| | |
New Fortress Energy, Inc.,
6.50%, 09/30/2026(a) | |
| 5,000,000 | | |
| 4,705,067 | |
| | |
| | | |
| | |
| United States Refined Product Pipelines — 1.6% | |
| | | |
| | |
Buckeye Partners LP,
5.85%, 11/15/2043 | |
| 2,000,000 | | |
| 1,707,263 | |
| | |
| | | |
| | |
| United States Renewables and Power Infrastructure — 3.9% | |
| | | |
| | |
NextEra Energy, Inc.,
4.80% to 12/01/2027 then
3 mo. LIBOR US + 2.41%,
12/01/2077(b) | |
| 4,500,000 | | |
| 4,117,429 | |
Total Corporate Bonds
(Cost $60,402,100) | |
| | | |
| 58,794,380 | |
| | |
| | | |
| | |
| | |
Shares | | |
| |
| | |
| | |
| |
| Common Stocks — 41.0% | |
| | | |
| | |
| Canada Crude Oil Pipelines — 1.3% | |
| | | |
| | |
| Enbridge, Inc. | |
| 39,056 | | |
| 1,428,668 | |
| | |
| | | |
| | |
| Canada Natural Gas/Natural Gas Liquids Pipelines — 1.8% | |
| | | |
| | |
| TC Energy Corp. | |
| 48,667 | | |
| 1,876,600 | |
| | |
| | | |
| | |
| United States Crude Oil Pipelines — 6.2% | |
| | | |
| | |
| Plains GP Holdings LP | |
| 358,745 | | |
| 6,460,997 | |
| | |
| | | |
| | |
| United States Natural Gas Gathering/Processing — 5.3% | |
| | | |
| | |
| EnLink Midstream LLC | |
| 90,965 | | |
| 1,154,346 | |
| Equitrans Midstream Corp. | |
| 108,596 | | |
| 1,550,751 | |
| Hess Midstream Partners LP | |
| 66,901 | | |
| 2,324,810 | |
| Kinetik Holdings, Inc. | |
| 11,954 | | |
| 489,994 | |
| | |
| | | |
| 5,519,901 | |
| | |
| | | |
| | |
| United States Natural Gas/Natural Gas Liquids Pipelines — 23.2% | |
| | | |
| | |
| DT Midstream, Inc. | |
| 24,885 | | |
| 1,669,286 | |
| Excelerate Energy, Inc. | |
| 11,787 | | |
| 209,927 | |
| Kinder Morgan, Inc. | |
| 160,775 | | |
| 3,133,505 | |
| NextDecade Corp.(c) | |
| 98,612 | | |
| 706,062 | |
| ONEOK, Inc. | |
| 73,551 | | |
| 5,957,631 | |
| Targa Resources Corp. | |
| 63,653 | | |
| 7,525,694 | |
| The Williams Companies, Inc. | |
| 121,546 | | |
| 5,045,374 | |
| | |
| | | |
| 24,247,479 | |
| | |
| | | |
| | |
| United States Refining — 0.4% | |
| | | |
| | |
| PBF Energy, Inc. | |
| 8,275 | | |
| 383,381 | |
| | |
| | | |
| | |
| United States Renewables and Power Infrastructure — 2.8% | |
| | | |
| | |
| Atlantica Sustainable Infrastructure Plc | |
| 16,523 | | |
| 363,175 | |
| Sempra Energy | |
| 33,854 | | |
| 2,607,774 | |
| | |
| | | |
| 2,970,949 | |
Total Common Stocks
(Cost $28,348,895) | |
| | | |
| 42,887,975 | |
See accompanying Notes to Financial Statements.
| |
| |
TPZ Schedule of Investments (unaudited)
(continued)
May 31, 2024 |
| | |
Shares/Units | | |
Fair Value | |
| Master Limited Partnerships — 24.7% | |
| | | |
| | |
| United States Natural Gas Gathering/Processing — 4.9% | |
| | | |
| | |
| Western Midstream Partners LP | |
| 135,715 | | |
$ | 5,064,884 | |
| | |
| | | |
| | |
| United States Natural Gas/Natural Gas Liquids Pipelines — 11.4% | |
| | | |
| | |
| Energy Transfer LP | |
| 425,604 | | |
| 6,669,215 | |
| Enterprise Products Partners LP | |
| 184,023 | | |
| 5,244,655 | |
| | |
| | | |
| 11,913,870 | |
| United States Refined Product Pipelines — 8.4% | |
| | | |
| | |
| MPLX LP | |
| 170,962 | | |
| 6,954,734 | |
| Sunoco LP | |
| 36,274 | | |
| 1,849,974 | |
| | |
| | | |
| 8,804,708 | |
Total Master Limited Partnerships
(Cost $12,095,453) | |
| | | |
| 25,783,462 | |
| | |
| | | |
| | |
| | |
Shares | | |
| |
| | |
| | |
| |
| Short-Term Investments — 0.4% | |
| | | |
| | |
| Money Market Funds — 0.4% | |
| | | |
| | |
| Invesco Government & Agency Portfolio — Class Institutional, 5.24%(d) | |
| 380,729 | | |
| 380,729 | |
Total Short-Term Investments
(Cost $380,729) | |
| | | |
| 380,729 | |
| | |
| | | |
| | |
Total Investments — 122.3%
(Cost $101,227,177) | |
| | | |
| 127,846,546 | |
| Other Assets in Excess of Liabilities — 0.9% | |
| | | |
| 984,984 | |
| Credit Facility Borrowings — (23.2)% | |
| | | |
| (24,300,000 | ) |
| Total Net Assets — 100.0% | |
| | | |
| 104,531,530 | |
Percentages are stated as a percent of net
assets. LIBOR - London Interbank Offered Rate
LIBOR – London Interbank Offered Rate
PLC – Public Limited Company
SOFR – Secured Overnight Financing Rate
| (a) |
Security is exempt from registration
pursuant to Rule 144A under the Securities Act of 1933, as amended. These securities may only be resold in transactions exempt from
registration to qualified institutional investors. As of May 31, 2024, the value of these securities total $33,257,199 or 31.8% of
the Fund’s net assets. |
| (b) |
Securities referencing LIBOR are expected to transition
to an alternative reference rate by the security’s next scheduled coupon reset date. |
| (c) |
Non-income producing security. |
| (d) |
The rate shown represents the 7-day effective yield as
of May 31, 2024. |
See accompanying Notes to Financial Statements.
| |
| |
| 2024 Semi-Annual Report | May 31, 2024 |
| |
TEAF Consolidated
Schedule of Investments (unaudited)
May 31, 2024 |
| | |
Shares | | |
Fair Value | |
| | |
| | |
| |
| Common Stocks — 45.1% | |
| | | |
| | |
| Australia Other — 1.8% | |
| | | |
| | |
| Atlas Arteria Ltd. | |
| 992,726 | | |
$ | 3,513,911 | |
| | |
| | | |
| | |
| Canada Renewables — 1.1% | |
| | | |
| | |
| Innergex Renewable Energy, Inc.(a) | |
| 294,405 | | |
| 2,108,216 | |
| | |
| | | |
| | |
| France Other — 0.9% | |
| | | |
| | |
| Vinci SA(a) | |
| 13,906 | | |
| 1,726,896 | |
| | |
| | | |
| | |
| France Power — 0.6% | |
| | | |
| | |
| Engie SA(a) | |
| 70,301 | | |
| 1,185,007 | |
| | |
| | | |
| | |
| Germany Power — 2.8% | |
| | | |
| | |
| E.ON SE | |
| 226,946 | | |
| 3,023,911 | |
| RWE AG(a) | |
| 68,204 | | |
| 2,578,316 | |
| | |
| | | |
| 5,602,227 | |
| | |
| | | |
| | |
| Hong Kong Solar — 0.3% | |
| | | |
| | |
| Xinyi Energy Holdings Ltd. | |
| 4,755,664 | | |
| 675,002 | |
| | |
| | | |
| | |
| Hong Kong Transportation/Storage — 0.9% | |
| | | |
| | |
| China Suntien Green Energy Corp. Ltd. | |
| 3,704,242 | | |
| 1,743,083 | |
| | |
| | | |
| | |
| Italy Power — 6.7% | |
| | | |
| | |
| ENAV SpA(a) | |
| 862,491 | | |
| 3,533,741 | |
| Enel SpA | |
| 512,946 | | |
| 3,704,529 | |
| Iren SpA | |
| 1,215,003 | | |
| 2,490,333 | |
| Terna SpA | |
| 447,937 | | |
| 3,753,141 | |
| | |
| | | |
| 13,481,744 | |
| | |
| | | |
| | |
| Portugal Power — 1.8% | |
| | | |
| | |
| EDP — Energias de Portugal SA(a) | |
| 902,432 | | |
| 3,653,321 | |
| | |
| | | |
| | |
| Spain Other — 1.8% | |
| | | |
| | |
| Ferrovial SE(a) | |
| 93,777 | | |
| 3,689,540 | |
| | |
| | | |
| | |
| Spain Power — 1.3% | |
| | | |
| | |
| Iberdrola SA(a) | |
| 195,181 | | |
| 2,562,542 | |
| | |
| | | |
| | |
| Switzerland Infrastructure, Utilities, and Renewables — 0.8% | |
| | | |
| | |
| BKW AG | |
| 10,392 | | |
| 1,635,356 | |
| | |
| | | |
| | |
| United Kingdom Power — 4.4% | |
| | | |
| | |
| National Grid Plc(a) | |
| 300,253 | | |
| 3,376,020 | |
| SSE Plc(a) | |
| 245,414 | | |
| 5,488,182 | |
| | |
| | | |
| 8,864,202 | |
| | |
| | | |
| | |
| United Kingdom Renewable Infrastructure — 0.6% | |
| | | |
| | |
| Greencoat UK Wind Plc(a) | |
| 703,747 | | |
| 1,263,513 | |
| | |
| | | |
| | |
| | |
Shares/Units | | |
| |
| | |
| | |
| |
| United States Natural Gas/Natural Gas Liquids Pipelines — 5.0% | |
| | | |
| | |
| Cheniere Energy, Inc.(a) | |
| 15,047 | | |
| 2,374,266 | |
| NextDecade Corp.(b) | |
| 75,000 | | |
| 537,000 | |
| Targa Resources Corp. | |
| 29,709 | | |
| 3,512,495 | |
| The Williams Companies, Inc.(a) | |
| 85,577 | | |
| 3,552,301 | |
| | |
| | | |
| 9,976,062 | |
| | |
| | | |
| | |
| United States Power — 8.8% | |
| | | |
| | |
| Ameren Corp.(a) | |
| 20,040 | | |
| 1,470,335 | |
| American Electric Power Co., Inc.(a) | |
| 63,582 | | |
| 5,738,275 | |
| Atlantica Sustainable Infrastructure Plc(a) | |
| 111,711 | | |
| 2,455,408 | |
| Edison International(a) | |
| 22,360 | | |
| 1,718,366 | |
| Exelon Corp.(a) | |
| 56,926 | | |
| 2,137,571 | |
| Vistra Corp. | |
| 40,770 | | |
| 4,039,492 | |
| | |
| | | |
| 17,559,447 | |
| | |
| | | |
| | |
| United States Renewables — 4.4% | |
| | | |
| | |
| Dominion Energy, Inc.(a) | |
| 48,224 | | |
| 2,600,238 | |
| NextEra Energy Partners LP(a) | |
| 80,874 | | |
| 2,726,262 | |
| NextEra Energy, Inc.(a) | |
| 43,338 | | |
| 3,467,907 | |
| | |
| | | |
| 8,794,407 | |
| | |
| | | |
| | |
| United States Utilities — 1.1% | |
| | | |
| | |
| Essential Utilities, Inc.(a) | |
| 58,349 | | |
| 2,201,508 | |
Total Common Stocks
(Cost $91,909,445) | |
| | | |
| 90,235,984 | |
| | |
| | | |
| | |
| Private Investments — 25.0% | |
| | | |
| | |
| United States Natural Gas/Natural Gas Liquids Pipelines — 1.5% | |
| | | |
| | |
| Mexico Pacific Limited LLC (MLP) Series A(c)(d) | |
| 135,180 | | |
| 2,966,390 | |
| United States Power — 6.7% | |
| | | |
| | |
| One Energy(c)(d) | |
| 21,311 | | |
| 11,747,263 | |
| TEP Montana LLC(d) | |
| 128,235 | | |
| 1,549,082 | |
| | |
| | | |
| 13,296,345 | |
| | |
| | | |
| | |
| United States Renewables — 16.8% | |
| | | |
| | |
| Renewable Holdco, LLC(c)(d)(e) | |
| N/A | | |
| 6,950,738 | |
| Renewable Holdco I, LLC(c)(d)(e) | |
| N/A | | |
| 15,334,865 | |
| Renewable Holdco II, LLC(c)(d)(e) | |
| N/A | | |
| 11,422,484 | |
| | |
| | | |
| 33,708,087 | |
Total Private Investments
(Cost $53,035,218) | |
| | | |
| 49,970,822 | |
See accompanying Notes to Financial Statements.
| |
| |
TEAF Consolidated Schedule of Investments (unaudited)
(continued)
May 31, 2024 |
| | |
Principal Amount | | |
Fair Value | |
| | |
| | |
| |
| Municipal Bonds — 18.9% | |
| | | |
| | |
| Arizona — 0.1% | |
| | | |
| | |
Maricopa County Industrial
Development Authority,
11.00%, 07/01/2033 | |
$ | 138,000 | | |
$ | 130,511 | |
| | |
| | | |
| | |
| Florida — 1.8% | |
| | | |
| | |
| Florida Development Finance Corp. | |
| | | |
| | |
| 10.00%, 07/01/2025(f) | |
| 445,000 | | |
| 422,750 | |
| 11.00%, 08/01/2032(f) | |
| 320,000 | | |
| 309,191 | |
| 10.25%, 11/01/2057 | |
| 3,110,000 | | |
| 2,979,021 | |
| | |
| | | |
| 3,710,962 | |
| | |
| | | |
| | |
| Ohio — 3.3% | |
| | | |
| | |
| Public Finance Authority | |
| | | |
| | |
| 8.35%, 06/15/2034(f) | |
| 5,355,000 | | |
| 5,092,400 | |
| 12.00%, 06/15/2034(c)(f) | |
| 1,560,000 | | |
| 1,560,000 | |
| | |
| | | |
| 6,652,400 | |
| | |
| | | |
| | |
| Oregon — 2.0% | |
| | | |
| | |
| Oregon State Facilities Authority | |
| | | |
| | |
| 8.00%, 12/15/2053(h) | |
| 3,100,000 | | |
| 3,046,369 | |
| 12.00%, 12/15/2053(i) | |
| 950,000 | | |
| 945,195 | |
| | |
| | | |
| 3,991,564 | |
| | |
| | | |
| | |
| Pennsylvania — 0.2% | |
| | | |
| | |
Pennsylvania Economic Development
Financing Authority,
14.00%, 12/01/2027(f) | |
| 405,000 | | |
| 403,840 | |
| | |
| | | |
| | |
| South Carolina — 4.3% | |
| | | |
| | |
South Carolina Jobs-Economic
Development Authority | |
| | | |
| | |
| 7.50%, 03/15/2030(f)(h) | |
| 3,850,000 | | |
| 3,725,727 | |
| 11.00%, 03/15/2030(f)(i) | |
| 575,000 | | |
| 569,581 | |
| 7.60%, 03/15/2033(f) | |
| 4,080,000 | | |
| 3,906,719 | |
| 11.00%, 03/15/2033(f) | |
| 375,000 | | |
| 358,137 | |
| | |
| | | |
| 8,560,164 | |
| | |
| | | |
| | |
| Wisconsin — 7.2% | |
| | | |
| | |
| Public Finance Authority | |
| | | |
| | |
| 7.50%, 06/01/2029(f) | |
| 8,925,000 | | |
| 8,681,025 | |
| 10.00%, 09/01/2031 | |
| 525,000 | | |
| 440,009 | |
| 10.00%, 09/01/2031(f) | |
| 145,000 | | |
| 134,312 | |
| 11.00%, 01/15/2033(f)(i) | |
| 405,000 | | |
| 404,923 | |
| 11.00%, 02/01/2033 | |
| 936,000 | | |
| 936,179 | |
| 8.35%, 12/15/2033(f) | |
| 2,355,000 | | |
| 2,256,219 | |
| 12.00%, 12/15/2033(f) | |
| 530,000 | | |
| 520,162 | |
| 11.00%, 06/30/2034 | |
| 330,000 | | |
| 323,173 | |
| 9.75%, 04/01/2054(h) | |
| 825,000 | | |
| 782,305 | |
| | |
| | | |
| 14,478,307 | |
Total Municipal Bonds
(Cost $38,134,976) | |
| | | |
| 37,927,748 | |
| | |
| | | |
| | |
| Corporate Bonds — 8.0% | |
| | | |
| | |
| United States Healthcare — 1.8% | |
| | | |
| | |
315/333 West Dawson Associates
SUB 144A NT,
11.00%, 01/31/2026(d) | |
| 3,770,000 | | |
| 3,621,370 | |
| | |
| | | |
| | |
| United States Senior Living — 6.2% | |
| | | |
| | |
Ativo Albuquerque LLC,
12.00%, 01/01/2028(d) | |
| 2,032,000 | | |
| 2,132,924 | |
Contour Propco 1735 S MISSION
SUB 144A NT,
11.00%, 10/01/2025(c)(d)(g) | |
| 5,715,000 | | |
| 317,754 | |
| Dove Mountain Residences LLC | |
| | | |
| | |
| 11.00%, 02/01/2026(d) | |
| 1,050,000 | | |
| 1,010,802 | |
| 16.00%, 02/01/2026(d) | |
| 1,116,447 | | |
| 1,070,469 | |
Drumlin Reserve Property LLC,
10.00%, 10/02/2025(d) | |
| 1,705,311 | | |
| 1,665,531 | |
JW Living Smithville Urban Ren
Sub Global 144A 27,
11.75%, 06/01/2027(d) | |
| 3,890,000 | | |
| 3,951,800 | |
Realco Perry Hall MD LLC/OPCO
Sub 144A NT,
10.00%, 10/01/2024(d) | |
| 2,198,000 | | |
| 2,194,681 | |
| | |
| | | |
| 12,343,961 | |
Total Corporate Bonds
(Cost $21,402,721) | |
| | | |
| 15,965,331 | |
| | |
| | | |
| | |
| Private Notes — 6.7% | |
| | | |
| | |
| Bermuda Renewables — 1.8% | |
| | | |
| | |
Saturn Solar Bermuda 1 Ltd.,
10.00%, 12/31/2024(c)(d) | |
| 3,510,000 | | |
| 3,672,864 | |
| | |
| | | |
| | |
| United States Water Equipment & Services — 4.9% | |
| | | |
| | |
EF WWW Holdings LLC
10.50%, 09/30/2026(c)(d) | |
| 9,600,000 | | |
| 9,792,000 | |
Total Private Notes
(Cost $13,378,904) | |
| | | |
| 13,464,864 | |
See accompanying Notes to Financial Statements.
| |
| |
| 2024 Semi-Annual Report | May 31, 2024 |
| |
TEAF Consolidated
Schedule of Investments (unaudited) (continued)
May 31, 2024 |
| | |
Units/Contracts | | |
Fair Value | |
| | |
| | |
| |
| Master Limited Partnerships — 5.8% | |
| | | |
| | |
| United States Natural Gas/Natural Gas Liquids Pipelines — 3.4% | |
| | | |
| | |
| Energy Transfer LP(a) | |
| 296,445 | | |
$ | 4,645,293 | |
| Enterprise Products Partners LP(a) | |
| 76,409 | | |
| 2,177,657 | |
| | |
| | | |
| 6,822,950 | |
| United States Refined Product Pipelines — 2.4% | |
| | | |
| | |
| MPLX LP(a) | |
| 116,925 | | |
| 4,756,509 | |
Total Master Limited Partnerships
(Cost $6,551,325) | |
| | | |
| 11,579,459 | |
| | |
| | | |
| | |
| Rights — 0.1% | |
| | | |
| | |
| United Kingdom Power — 0.1% | |
| | | |
| | |
National Grid PLC, Expires
06/10/2024, Exercise Price $6.45(b) | |
| 87,574 | | |
| 218,773 | |
Total Rights
(Cost $310,169) | |
| | | |
| 218,773 | |
| | |
| | | |
| | |
| | |
Shares | | |
| | |
| | |
| | | |
| | |
| Short-Term Investments — 0.2% | |
| | | |
| | |
| Money Market Funds — 0.2% | |
| | | |
| | |
| First American Government Obligations Fund — Class X, 5.23%(j) | |
| 442,783 | | |
$ | 442,783 | |
Total Short-Term Investments
(Cost $442,783) | |
| | | |
| 442,783 | |
| | |
| | | |
| | |
Total Investments — 109.8%
(Cost $225,165,541) | |
| | | |
| 219,805,764 | |
| Other Assets in Excess of Liabilities – 0.7% | |
| | | |
| 1,359,130 | |
| Credit Facility Borrowings — (10.5)% | |
| | | |
| (20,900,000 | ) |
| Total Net Assets — 100.0% | |
| | | |
$ | 200,264,894 | |
Percentages are stated as a percent of net assets.
PLC – Public Limited Company
SA – Sociedad Anónima
| (a) |
All or a portion of the security is
segregated as collateral for the margin borrowing facility. |
| (b) |
Non-income producing security. |
| (c) |
Fair value determined using significant unobservable
inputs in accordance with procedures established by and under the supervision of the Adviser, acting as Valuation Designee. |
| (d) |
Restricted
securities have a total fair value of $79,401,017 which represents 39.7% of net assets as of May 31, 2024. |
| (e) |
Deemed to be an affiliate of the fund. |
| (f) |
Security is exempt from registration pursuant to Rule
144A under the Securities Act of 1933, as amended. These securities may only be resold in transactions exempt from registration to
qualified institutional investors. As of May 31, 2024, the value of these securities total $28,344,986 or 14.2% of the Fund’s
net assets. |
| (g) |
Issuer is currently in default. |
| (h) |
Step coupon bond. The rate disclosed is as of May 31,
2024. |
| (i) |
Coupon rate is variable or floats based on components
including but not limited to reference rate and spread. These securities may not indicate a reference rate and/or spread in their
description. The rate disclosed is as of May 31, 2024. |
| (j) |
The rate shown represents the 7-day effective yield as
of May 31, 2024. |
See accompanying Notes to Financial Statements.
| |
| |
Statements of Assets & Liabilities (unaudited)
May 31, 2024 |
| |
| | |
Tortoise Energy | | |
Tortoise | |
| | |
Infrastructure | | |
Midstream Energy | |
| | |
Corp.(1) | | |
Fund, Inc. | |
| Assets | |
| | | |
| | |
| Investments in unaffiliated securities at fair value(2) | |
$ | 543,353,431 | | |
$ | 304,067,898 | |
| Investments in affiliated securities at fair value(3) | |
| 10,400,393 | | |
| — | |
| Cash at broker | |
| — | | |
| — | |
| Cash(6) | |
| — | | |
| — | |
| Receivable for investments sold | |
| 8,556,846 | | |
| 4,678,692 | |
| Receivable for insurance claim | |
| — | | |
| 27,365 | |
| Dividends, distributions and interest receivable from investments | |
| 367,284 | | |
| 513,702 | |
| Current tax receivable | |
| 364,730 | | |
| 239,768 | |
| Expense reimbursement receivable | |
| — | | |
| — | |
| Prepaid expenses and other assets | |
| 879,590 | | |
| 540,367 | |
| Total assets | |
| 563,922,274 | | |
| 310,067,792 | |
| Liabilities | |
| | | |
| | |
| Payable to Adviser | |
| 846,380 | | |
| 471,291 | |
| Payable for investments purchased | |
| 10,229,682 | | |
| 5,593,403 | |
| Accrued expenses and other liabilities | |
| 1,529,142 | | |
| 666,124 | |
| Credit facility borrowings | |
| 29,600,000 | | |
| 13,700,000 | |
| Senior notes, net(4) | |
| 50,292,861 | | |
| 29,132,869 | |
| Mandatory redeemable preferred stock, net(5) | |
| 35,624,581 | | |
| 13,736,384 | |
| Total liabilities | |
| 128,122,646 | | |
| 63,300,071 | |
| Net assets applicable to common stockholders | |
$ | 435,799,628 | | |
$ | 246,767,721 | |
| | |
| | | |
| | |
| Net Assets Applicable to Common Stockholders Consist of: | |
| | | |
| | |
| Capital stock, $0.001 par value per share | |
$ | 10,765 | | |
$ | 5,093 | |
| Additional paid-in capital | |
| 598,943,065 | | |
| 653,597,167 | |
| Total distributable accumulated gain (loss) | |
| (163,154,202 | ) | |
| (406,834,539 | ) |
| Net assets applicable to common stockholders | |
$ | 435,799,628 | | |
$ | 246,767,721 | |
| | |
| | | |
| | |
| Capital shares: | |
| | | |
| | |
| Authorized | |
| 100,000,000 | | |
| 100,000,000 | |
| Outstanding | |
| 10,764,933 | | |
| 5,092,810 | |
| | |
| | | |
| | |
| Net Asset Value per common share outstanding (net assets applicable to common stock, divided by common shares outstanding) | |
$ | 40.48 | | |
$ | 48.45 | |
| | |
| | | |
| | |
(1) Consolidated Statement of Assets and Liabilities
(See Note 13 to the financial statements for further disclosure). | |
| | | |
| | |
| (2) Investments in unaffiliated securities at cost | |
$ | 484,907,584 | | |
$ | 259,085,358 | |
| (3) Investments in affiliated securities at cost | |
$ | 50,141,470 | | |
$ | — | |
| (4) Deferred debt issuance and offering costs | |
$ | 40,472 | | |
$ | 37,809 | |
| (5) Deferred offering costs | |
$ | 36,029 | | |
$ | 17,391 | |
| (6) TEAF cash balance reflects cash held at TEAF Solar Holdco, LLC at the end of the period. | |
| | | |
| | |
| See Note 13 to the financial statements for additional information. | |
| | | |
| | |
See accompanying Notes to Financial Statements.
| |
| |
| 2024 Semi-Annual Report | May 31, 2024 |
| |
| |
Tortoise Pipeline
& Energy
Fund, Inc. | | |
Tortoise Energy
Independence
Fund, Inc. | | |
Tortoise Power
and Energy
Infrastructure
Fund, Inc. | | |
Ecofin
Sustainable
and Social Impact
Term Fund(1) | |
| | | | |
| | | |
| | | |
| | |
| $ | 96,206,983 | | |
$ | 76,242,372 | | |
$ | 127,846,546 | | |
$ | 186,097,677 | |
| | — | | |
| — | | |
| — | | |
| 33,708,087 | |
| | — | | |
| — | | |
| — | | |
| 113,127 | |
| | — | | |
| — | | |
| — | | |
| 40,208 | |
| | — | | |
| — | | |
| — | | |
| — | |
| | — | | |
| — | | |
| — | | |
| — | |
| | 100,076 | | |
| 171,611 | | |
| 1,279,191 | | |
| 1,727,321 | |
| | — | | |
| — | | |
| — | | |
| — | |
| | 109,523 | | |
| 51,586 | | |
| — | | |
| — | |
| | 200,526 | | |
| 111,478 | | |
| 122,278 | | |
| 133,319 | |
| | 96,617,108 | | |
| 76,577,047 | | |
| 129,248,015 | | |
| 221,819,739 | |
| | | | |
| | | |
| | | |
| | |
| | 173,264 | | |
| 139,423 | | |
| 202,004 | | |
| 478,462 | |
| | — | | |
| — | | |
| — | | |
| — | |
| | 273,521 | | |
| 115,974 | | |
| 214,481 | | |
| 176,383 | |
| | 6,700,000 | | |
| 10,200,000 | | |
| 24,300,000 | | |
| 20,900,000 | |
| | 3,939,946 | | |
| — | | |
| — | | |
| — | |
| | 6,096,839 | | |
| — | | |
| — | | |
| — | |
| | 17,183,570 | | |
| 10,455,397 | | |
| 24,716,485 | | |
| 21,554,845 | |
| $ | 79,433,538 | | |
$ | 66,121,650 | | |
$ | 104,531,530 | | |
$ | 200,264,894 | |
| | | | |
| | | |
| | | |
| | |
| | | | |
| | | |
| | | |
| | |
| $ | 2,011 | | |
$ | 1,666 | | |
$ | 5,890 | | |
$ | 13,491 | |
| | 162,993,308 | | |
| 207,311,589 | | |
| 95,504,899 | | |
| 230,431,604 | |
| | (83,561,781 | ) | |
| (141,191,605 | ) | |
| 9,020,741 | | |
| (30,180,201 | ) |
| $ | 79,433,538 | | |
$ | 66,121,650 | | |
$ | 104,531,530 | | |
$ | 200,264,894 | |
| | | | |
| | | |
| | | |
| | |
| | | | |
| | | |
| | | |
| | |
| | 100,000,000 | | |
| 100,000,000 | | |
| 100,000,000 | | |
| 100,000,000 | |
| | | | |
| | | |
| | | |
| | |
| | 2,010,566 | | |
| 1,666,014 | | |
| 5,890,167 | | |
| 13,491,127 | |
| | | | |
| | | |
| | | |
| | |
| | | | |
| | | |
| | | |
| | |
| $ | 39.51 | | |
$ | 39.69 | | |
$ | 17.75 | | |
$ | 14.84 | |
| | | | |
| | | |
| | | |
| | |
| | | | |
| | | |
| | | |
| | |
| | | | |
| | | |
| | | |
| | |
| $ | 66,496,349 | | |
$ | 42,807,813 | | |
$ | 101,227,177 | | |
$ | 184,302,006 | |
| $ | — | | |
$ | — | | |
$ | — | | |
$ | 40,863,535 | |
| $ | 2,912 | | |
$ | — | | |
$ | — | | |
$ | — | |
| $ | 3,161 | | |
$ | — | | |
$ | — | | |
$ | — | |
See accompanying Notes to Financial Statements.
| |
| |
Statements of Operations (unaudited)
Period from December 1, 2023 through May 31, 2024 |
| |
| | |
Tortoise Energy | | |
Tortoise | |
| | |
Infrastructure | | |
Midstream Energy | |
| | |
Corp.(1) | | |
Fund, Inc. | |
| Investment Income | |
| | | |
| | |
| Distributions from master limited partnerships | |
$ | 5,412,469 | | |
$ | 2,458,401 | |
| Dividends and distributions from common stock | |
| 7,586,489 | | |
| 6,056,618 | |
| Dividends and distributions from preferred stock | |
| — | | |
| — | |
| Less return of capital on distributions(2) | |
| (6,892,019 | ) | |
| (5,306,579 | ) |
| Less foreign taxes withheld | |
| — | | |
| (133,409 | ) |
| Net dividends and distributions from investments | |
| 6,106,939 | | |
| 3,075,031 | |
| Interest income | |
| 263,319 | | |
| 177,575 | |
| Total Investment Income | |
| 6,370,258 | | |
| 3,252,606 | |
| Operating Expenses | |
| | | |
| | |
| Advisory fees | |
| 2,408,803 | | |
| 1,338,055 | |
| Administrator fees | |
| 108,443 | | |
| 63,368 | |
| Professional fees | |
| 411,851 | | |
| 367,444 | |
| Directors fees | |
| 42,924 | | |
| 42,957 | |
| Stockholder communication expenses | |
| 68,581 | | |
| 45,334 | |
| Custodian fees and expenses | |
| 12,467 | | |
| 7,244 | |
| Fund accounting fees | |
| 30,484 | | |
| 23,493 | |
| Registration fees | |
| 13,467 | | |
| 13,000 | |
| Stock transfer agent fees | |
| 35,301 | | |
| 30,656 | |
| Other operating expenses | |
| 67,816 | | |
| 29,982 | |
| Total Operating Expenses | |
| 3,200,137 | | |
| 1,961,533 | |
| Leverage Expenses | |
| | | |
| | |
| Interest expense | |
| 1,639,049 | | |
| 829,848 | |
| Distributions to mandatory redeemable preferred stockholders | |
| 611,534 | | |
| 230,434 | |
| Amortization of debt issuance costs | |
| 32,422 | | |
| 7,406 | |
| Other leverage expenses | |
| 50,515 | | |
| 50,809 | |
| Total Leverage Expenses | |
| 2,333,520 | | |
| 1,118,497 | |
| Total Expenses | |
| 5,533,657 | | |
| 3,080,030 | |
| Less expense reimbursement by Adviser (Note 4) | |
| — | | |
| — | |
| Net Expenses | |
| 5,533,657 | | |
| 3,080,030 | |
| Net Investment Income (Loss) | |
$ | 836,601 | | |
$ | 172,576 | |
| (1) |
Consolidated Statement of Operations (See Note 13 to
the financial statements for further disclosure). |
| (2) |
Return of capital may be in excess of current year distributions
due to prior year adjustments. See Note 2 to the financial statements for further disclosure. |
See accompanying Notes to Financial Statements.
| |
| |
| 2024 Semi-Annual Report | May 31, 2024 |
| |
| |
Tortoise
Pipeline
& Energy
Fund, Inc. | | |
Tortoise
Energy
Independence
Fund, Inc. | | |
Tortoise
Power
and Energy
Infrastructure
Fund, Inc. | | |
Ecofin
Sustainable
and Social Impact
Term Fund(1) | |
| | | |
| | |
| | |
| |
| $ | 696,938 | | |
$ | 495,560 | | |
$ | 1,022,884 | | |
$ | 464,975 | |
| | 2,060,176 | | |
| 1,117,593 | | |
| 1,047,886 | | |
| 2,080,759 | |
| | — | | |
| — | | |
| — | | |
| 124,137 | |
| | (1,108,673 | ) | |
| (595,828 | ) | |
| (1,201,299 | ) | |
| (658,916 | ) |
| | (87,251 | ) | |
| (11,467 | ) | |
| (18,060 | ) | |
| (246,190 | ) |
| | 1,561,190 | | |
| 1,005,858 | | |
| 851,411 | | |
| 1,764,765 | |
| | 9,334 | | |
| 9,887 | | |
| 1,699,217 | | |
| 3,616,681 | |
| | 1,570,524 | | |
| 1,015,745 | | |
| 2,550,628 | | |
| 5,381,446 | |
| | | | |
| | | |
| | | |
| | |
| | 491,593 | | |
| 388,036 | | |
| 589,244 | | |
| 1,488,046 | |
| | 24,381 | | |
| 22,186 | | |
| 33,152 | | |
| 53,625 | |
| | 79,676 | | |
| 75,241 | | |
| 85,157 | | |
| 123,254 | |
| | 33,312 | | |
| 33,312 | | |
| 42,957 | | |
| 42,957 | |
| | 20,678 | | |
| 15,872 | | |
| 33,110 | | |
| 14,311 | |
| | 3,592 | | |
| 3,020 | | |
| 3,299 | | |
| 15,459 | |
| | 13,816 | | |
| 13,244 | | |
| 13,854 | | |
| 14,840 | |
| | 12,500 | | |
| 12,500 | | |
| 12,500 | | |
| 12,500 | |
| | 20,760 | | |
| 22,237 | | |
| 25,423 | | |
| 7,802 | |
| | 23,449 | | |
| 15,252 | | |
| 9,564 | | |
| 70,485 | |
| | 723,757 | | |
| 600,900 | | |
| 848,260 | | |
| 1,843,279 | |
| | | | |
| | | |
| | | |
| | |
| | 296,107 | | |
| 299,438 | | |
| 747,980 | | |
| 722,579 | |
| | 139,385 | | |
| — | | |
| — | | |
| — | |
| | 5,702 | | |
| — | | |
| — | | |
| — | |
| | 15,000 | | |
| — | | |
| — | | |
| — | |
| | 456,194 | | |
| 299,438 | | |
| 747,980 | | |
| 722,579 | |
| | 1,179,951 | | |
| 900,338 | | |
| 1,596,240 | | |
| 2,565,858 | |
| | (120,451 | ) | |
| (124,005 | ) | |
| — | | |
| — | |
| | 1,059,500 | | |
| 776,333 | | |
| 1,596,240 | | |
| 2,565,858 | |
| $ | 511,024 | | |
$ | 239,412 | | |
$ | 954,388 | | |
$ | 2,815,588 | |
See accompanying Notes to Financial Statements.
| |
| |
Statements of Operations (unaudited)
(continued)
Period
from December 1, 2023 through May 31, 2024 |
| |
| | |
Tortoise Energy
Infrastructure
Corp.(1) | | |
Tortoise
Midstream Energy
Fund, Inc. | |
| Realized and Unrealized Loss on Investments and Foreign Currency | |
| | |
| |
| Net realized gain (loss) on investments in unaffiliated securities | |
$ | (7,322,102 | ) | |
$ | (2,579,598 | ) |
| Net realized gain on written options | |
| — | | |
| — | |
| Gain from debt retirement | |
| — | | |
| — | |
| Net realized gain (loss) on foreign currency and translation of other assets and liabilities denominated in foreign currency | |
| — | | |
| — | |
| Net realized gain (loss), before income taxes | |
| (7,322,102 | ) | |
| (2,579,598 | ) |
| Current tax benefit (expense) | |
| (139,209 | ) | |
| (18,024 | ) |
| Net realized gain (loss) | |
| (7,461,311 | ) | |
| (2,597,622 | ) |
| Net change in unrealized appreciation (depreciation) of investments in unaffiliated securities | |
| 81,364,346 | | |
| 39,970,146 | |
| Net change in unrealized appreciation (depreciation) of investments in affiliated securities | |
| (4,150,222 | ) | |
| — | |
| Net change in unrealized appreciation of options | |
| — | | |
| — | |
| Net change in unrealized appreciation (depreciation) of other assets and liabilities due to foreign currency translation | |
| (93 | ) | |
| (784 | ) |
| Net unrealized appreciation (depreciation) | |
| 77,214,031 | | |
| 39,969,362 | |
| Net Realized and Unrealized Gain (Loss) | |
| 69,752,720 | | |
| 37,371,740 | |
| Net Increase (Decrease) in Net Assets Applicable to Common Stockholders Resulting from Operations | |
$ | 70,589,321 | | |
$ | 37,544,316 | |
| (1) |
Consolidated Statement of Operations
(See Note 13 to the financial statements for further disclosure). |
| (2) |
Return of capital may be in excess of current year distributions
due to prior year adjustments. See Note 2 to the financial statements for further disclosure. |
See accompanying Notes to Financial Statements.
| |
| |
| 2024 Semi-Annual Report | May 31, 2024 |
| |
| |
Tortoise Pipeline
& Energy
Fund, Inc. | | |
Tortoise Energy
Independence
Fund, Inc. | | |
Tortoise Power
and Energy
Infrastructure
Fund, Inc. | | |
Ecofin
Sustainable
and Social Impact
Term Fund(1) | |
| | | | |
| | | |
| | | |
| | |
| $ | (161,098 | ) | |
$ | 104,940 | | |
$ | (417,759 | ) | |
$ | 3,369,056 | |
| | — | | |
| — | | |
| — | | |
| 17,983 | |
| | — | | |
| — | | |
| 225,000 | | |
| — | |
| | | | |
| | | |
| | | |
| | |
| | (155 | ) | |
| — | | |
| — | | |
| (18,101 | ) |
| | (161,253 | ) | |
| 104,940 | | |
| (192,759 | ) | |
| 3,368,938 | |
| | — | | |
| — | | |
| — | | |
| — | |
| | (161,253 | ) | |
| 104,940 | | |
| (192,759 | ) | |
| 3,368,938 | |
| | 11,931,359 | | |
| 8,823,367 | | |
| 11,756,303 | | |
| 4,991,277 | |
| | — | | |
| — | | |
| — | | |
| (3,894,182 | ) |
| | — | | |
| — | | |
| — | | |
| 12,781 | |
| | | | |
| | | |
| | | |
| | |
| | 176 | | |
| — | | |
| — | | |
| (1,912 | ) |
| | 11,931,535 | | |
| 8,823,367 | | |
| 11,756,303 | | |
| 1,107,964 | |
| | 11,770,282 | | |
| 8,928,307 | | |
| 11,563,544 | | |
| 4,476,902 | |
| | | | |
| | | |
| | | |
| | |
| $ | 12,281,306 | | |
$ | 9,167,719 | | |
$ | 12,517,932 | | |
$ | 7,292,490 | |
See accompanying Notes to Financial Statements.
| |
| |
| Statements of Changes in Net Assets |
| |
| | |
Tortoise Energy Infrastructure Corp.(1) | |
| | |
Six Months
Ended May 31,
2024 | | |
Year Ended
November 30,
2023 | |
| | |
| (Unaudited) | | |
| | |
| Operations | |
| | | |
| | |
| Net investment income (loss) | |
$ | 836,601 | | |
$ | 3,332,720 | |
| Net realized gain (loss) | |
| (7,461,311 | ) | |
| 48,885,487 | |
| Net unrealized appreciation (depreciation) | |
| 77,214,031 | | |
| (67,840,820 | ) |
| Net increase (decrease) in net assets applicable to common stockholders resulting from operations | |
| 70,589,321 | | |
| (15,622,613 | ) |
| Distributions to Common Stockholders | |
| | | |
| | |
| From distributable earnings | |
| (15,286,205 | ) | |
| (18,410,881 | ) |
| From return of capital | |
| — | | |
| (13,368,334 | ) |
| Total distributions to common stockholders | |
| (15,286,205 | ) | |
| (31,779,215 | ) |
| Capital Stock Transactions | |
| | | |
| | |
| Cost of shares repurchased and retired through tender offer | |
| — | | |
| (18,719,638 | ) |
| Net increase (decrease) in net assets applicable to common stockholders from capital stock transactions | |
| — | | |
| (18,719,638 | ) |
| Total increase (decrease) in net assets applicable to common stockholders | |
| 55,303,116 | | |
| (66,121,466 | ) |
| Net Assets | |
| | | |
| | |
| Beginning of period | |
| 380,496,512 | | |
| 446,617,978 | |
| End of period | |
$ | 435,799,628 | | |
$ | 380,496,512 | |
| Transactions in common shares | |
| | | |
| | |
| Shares outstanding at beginning of period | |
| 10,764,933 | | |
| 11,331,508 | |
| Shares repurchased | |
| — | | |
| (566,575 | ) |
| Shares outstanding at end of period | |
| 10,764,933 | | |
| 10,764,933 | |
| (1) |
Consolidated Statement of Changes in Net Assets (See Note 13 to the financial statements for further disclosure). |
See accompanying Notes to Financial Statements.
| |
| |
| 2024 Semi-Annual Report | May 31, 2024 |
| |
| |
| | | |
| |
| Tortoise Midstream Energy Fund, Inc. | | |
Tortoise Pipeline & Energy Fund, Inc. | |
Six
Months
Ended May 31,
2024 | | |
Year
Ended
November 30,
2023 | | |
Six
Months
Ended May 31,
2024 | | |
Year
Ended
November 30,
2023 | |
| (Unaudited) | | |
| | |
(Unaudited) | | |
| |
| | | |
| | |
| | |
| |
| $ | 172,576 | | |
$ | 1,547,631 | | |
$ | 511,024 | | |
$ | 327,453 | |
| | (2,597,622 | ) | |
| 28,010,841 | | |
| (161,253 | ) | |
| 5,349,200 | |
| | 39,969,362 | | |
| (22,608,088 | ) | |
| 11,931,535 | | |
| (1,338,009 | ) |
| | | | |
| | | |
| | | |
| | |
| | 37,544,316 | | |
| 6,950,384 | | |
| 12,281,306 | | |
| 4,338,644 | |
| | | | |
| | | |
| | | |
| | |
| | (7,842,927 | ) | |
| (8,701,938 | ) | |
| — | | |
| (1,109,052 | ) |
| | — | | |
| (7,603,071 | ) | |
| (2,372,468 | ) | |
| (3,823,183 | ) |
| | (7,842,927 | ) | |
| (16,305,009 | ) | |
| (2,372,468 | ) | |
| (4,932,235 | ) |
| | | | |
| | | |
| | | |
| | |
| | — | | |
| (10,600,666 | ) | |
| — | | |
| (3,390,441 | ) |
| | | | |
| | | |
| | | |
| | |
| | — | | |
| (10,600,666 | ) | |
| — | | |
| (3,390,441 | ) |
| | 29,701,389 | | |
| (19,955,291 | ) | |
| 9,908,838 | | |
| (3,984,032 | ) |
| | | | |
| | | |
| | | |
| | |
| | 217,066,332 | | |
| 237,021,623 | | |
| 69,524,700 | | |
| 73,508,732 | |
| $ | 246,767,721 | | |
$ | 217,066,332 | | |
$ | 79,433,538 | | |
$ | 69,524,700 | |
| | | | |
| | | |
| | | |
| | |
| | 5,092,810 | | |
| 5,360,842 | | |
| 2,010,566 | | |
| 2,116,385 | |
| | — | | |
| (268,032 | ) | |
| — | | |
| (105,819 | ) |
| | 5,092,810 | | |
| 5,092,810 | | |
| 2,010,566 | | |
| 2,010,566 | |
See accompanying Notes to Financial Statements.
| |
| |
| Statements of Changes in Net Assets (continued) |
| |
| | |
Tortoise Energy Independence Fund, Inc. | |
| | |
Six Months
Ended May 31,
2024 | | |
Year Ended
November 30,
2023 | |
| | |
(Unaudited) | | |
| |
| Operations | |
| | | |
| | |
| Net investment income (loss) | |
$ | 239,412 | | |
$ | 769,819 | |
| Net realized gain (loss) | |
| 104,940 | | |
| 4,831,148 | |
| Net unrealized appreciation (depreciation) | |
| 8,823,367 | | |
| (6,194,820 | ) |
| Net increase (decrease) in net assets applicable to common stockholders resulting from operations | |
| 9,167,719 | | |
| (593,853 | ) |
| Distributions to Common Stockholders | |
| | | |
| | |
| From distributable earnings | |
| — | | |
| (1,293,398 | ) |
| From return of capital | |
| (2,099,178 | ) | |
| (3,070,680 | ) |
| Total distributions to common stockholders | |
| (2,099,178 | ) | |
| (4,364,078 | ) |
| Capital Stock Transactions | |
| | | |
| | |
| Cost of shares repurchased and retired through tender offer | |
| — | | |
| (3,055,787 | ) |
| Net increase (decrease) in net assets applicable to common stockholders from capital stock transactions | |
| — | | |
| (3,055,787 | ) |
| Total increase (decrease) in net assets applicable to common stockholders | |
| 7,068,541 | | |
| (8,013,718 | ) |
| Net Assets | |
| | | |
| | |
| Beginning of period | |
| 59,053,109 | | |
| 67,066,827 | |
| End of period | |
$ | 66,121,650 | | |
$ | 59,053,109 | |
| Transactions in common shares | |
| | | |
| | |
| Shares outstanding at beginning of period | |
| 1,666,014 | | |
| 1,753,698 | |
| Shares repurchased | |
| — | | |
| (87,684 | ) |
| Shares outstanding at end of period | |
| 1,666,014 | | |
| 1,666,014 | |
| (1) |
Consolidated Statement of Changes in Net Assets (See
Note 13 to the financial statements for further disclosure). |
See accompanying Notes to Financial Statements.
| |
| |
| 2024 Semi-Annual Report | May 31, 2024 |
| |
| |
Tortoise
Power and Energy
Infrastructure Fund, Inc. | | |
| Ecofin
Sustainable and Social
Impact Term Fund(1) | |
Six
Months
Ended May 31,
2024 | | |
| Year
Ended
November 30,
2023 | | |
| Six
Months
Ended May 31,
2024 | | |
| Year
Ended
November 30,
2023 | |
| (Unaudited) | | |
| | | |
| (Unaudited) | | |
| | |
| | | | |
| | | |
| | | |
| | |
| $ | 954,388 | | |
$ | 1,980,315 | | |
$ | 2,815,588 | | |
$ | 5,146,824 | |
| | (192,759 | ) | |
| 5,973,783 | | |
| 3,368,938 | | |
| (4,142,366 | ) |
| | 11,756,303 | | |
| 1,989,386 | | |
| 1,107,964 | | |
| (6,974,383 | ) |
| | | | |
| | | |
| | | |
| | |
| | 12,517,932 | | |
| 9,943,484 | | |
| 7,292,490 | | |
| (5,969,925 | ) |
| | | | |
| | | |
| | | |
| | |
| | — | | |
| (3,812,109 | ) | |
| (3,729,813 | ) | |
| (4,770,361 | ) |
| | (3,710,805 | ) | |
| (3,967,561 | ) | |
| (3,555,396 | ) | |
| (9,800,056 | ) |
| | (3,710,805 | ) | |
| (7,779,670 | ) | |
| (7,285,209 | ) | |
| (14,570,417 | ) |
| | | | |
| | | |
| | | |
| | |
| | — | | |
| (4,684,221 | ) | |
| — | | |
| — | |
| | | | |
| | | |
| | | |
| | |
| | — | | |
| (4,684,221 | ) | |
| — | | |
| — | |
| | 8,807,127 | | |
| (2,520,407 | ) | |
| 7,281 | | |
| (20,540,342 | ) |
| | | | |
| | | |
| | | |
| | |
| | 95,724,403 | | |
| 98,244,810 | | |
| 200,257,613 | | |
| 220,797,955 | |
| $ | 104,531,530 | | |
$ | 95,724,403 | | |
$ | 200,264,894 | | |
$ | 200,257,613 | |
| | | | |
| | | |
| | | |
| | |
| | 5,890,167 | | |
| 6,200,175 | | |
| 13,491,127 | | |
| 13,491,127 | |
| | — | | |
| (310,008 | ) | |
| — | | |
| — | |
| | 5,890,167 | | |
| 5,890,167 | | |
| 13,491,127 | | |
| 13,491,127 | |
See accompanying Notes to Financial Statements.
| |
| |
Statements of Cash Flows (unaudited))
Period from December 1, 2023 through May 31, 2024 |
| |
| | |
Tortoise
Energy
Infrastructure
Corp.(1) | | |
Tortoise
Midstream
Energy Fund, Inc. | |
| | |
| | |
| |
| Cash Flows From Operating Activities | |
| | | |
| | |
| Dividends, distributions and interest received from
investments | |
$ | 13,880,733 | | |
$ | 8,741,300 | |
| Purchases of long-term investments | |
| (156,064,236 | ) | |
| (25,373,669 | ) |
| Proceeds from sales of long-term investments | |
| 158,571,072 | | |
| 22,806,209 | |
| Sales (purchases) of short-term investments, net | |
| (230,875 | ) | |
| 3,433,683 | |
| Call options written, net | |
| — | | |
| — | |
| Proceeds from debt retirement | |
| — | | |
| — | |
| Interest received on securities sold, net | |
| — | | |
| — | |
| Interest expense paid | |
| (1,762,707 | ) | |
| (828,113 | ) |
| Distributions to mandatory redeemable preferred stockholders | |
| (611,533 | ) | |
| (230,434 | ) |
| Other leverage expenses paid | |
| — | | |
| — | |
| Net income taxes paid | |
| (2,633,619 | ) | |
| (1,517,234 | ) |
| Operating expenses paid | |
| (3,642,630 | ) | |
| (2,288,815 | ) |
| Net cash provided by (used in) operating
activities | |
| 7,506,205 | | |
| 4,742,927 | |
| Cash Flows From Financing Activities | |
| | | |
| | |
| Advances (payments) on credit facilities, net | |
| 22,300,000 | | |
| 3,100,000 | |
| Repayment of senior notes | |
| (14,520,000 | ) | |
| — | |
| Distributions paid to common stockholders | |
| (15,286,205 | ) | |
| (7,842,927 | ) |
| Net cash provided by (used in) financing
activities | |
| (7,506,205 | ) | |
| (4,742,927 | ) |
| Net change in cash | |
| — | | |
| — | |
| Cash — beginning of period | |
| — | | |
| — | |
| Cash — end of period | |
$ | — | | |
$ | — | |
| (1) |
Consolidated Statement of Cash Flows (See Note 13 to the financial statements for further disclosure). |
See accompanying Notes to Financial Statements.
| |
| |
| 2024 Semi-Annual Report | May 31, 2024 |
| |
| |
Tortoise Pipeline
& Energy
Fund, Inc. | | |
Tortoise Energy
Independence
Fund, Inc. | | |
Tortoise Power
and Energy
Infrastructure
Fund, Inc. | | |
Ecofin
Sustainable
and Social Impact
Term Fund(1) | |
| | | |
| | |
| | |
| |
| $ | 2,686,141 | | |
$ | 1,612,944 | | |
$ | 3,473,062 | | |
$ | 5,159,944 | |
| | (750,982 | ) | |
| (1,350,832 | ) | |
| (12,622,234 | ) | |
| (34,317,147 | ) |
| | 755,798 | | |
| 1,350,395 | | |
| 14,461,668 | | |
| 41,565,935 | |
| | 100,971 | | |
| 16,940 | | |
| (40,165 | ) | |
| (8,986 | ) |
| | — | | |
| — | | |
| — | | |
| (16,042 | ) |
| | — | | |
| — | | |
| 225,000 | | |
| — | |
| | — | | |
| — | | |
| 276,417 | | |
| 821,623 | |
| | (287,558 | ) | |
| (346,408 | ) | |
| (816,746 | ) | |
| (781,995 | ) |
| | (139,385 | ) | |
| — | | |
| — | | |
| — | |
| | (30,000 | ) | |
| — | | |
| — | | |
| — | |
| | — | | |
| — | | |
| — | | |
| — | |
| | (762,517 | ) | |
| (583,861 | ) | |
| (946,197 | ) | |
| (2,035,006 | ) |
| | 1,572,468 | | |
| 699,178 | | |
| 4,010,805 | | |
| 10,388,326 | |
| | | | |
| | | |
| | | |
| | |
| | 800,000 | | |
| 1,400,000 | | |
| (300,000 | ) | |
| (3,100,000 | ) |
| | — | | |
| — | | |
| — | | |
| — | |
| | (2,372,468 | ) | |
| (2,099,178 | ) | |
| (3,710,805 | ) | |
| (7,285,209 | ) |
| | (1,572,468 | ) | |
| (699,178 | ) | |
| (4,010,805 | ) | |
| (10,385,209 | ) |
| | — | | |
| — | | |
| — | | |
| 3,117 | |
| | — | | |
| — | | |
| — | | |
| 150,218 | |
| $ | — | | |
$ | — | | |
$ | — | | |
$ | 153,335 | |
See accompanying Notes to Financial Statements.
| |
| |
Statements of Cash Flows (unaudited) (
continued)
Period from December 1, 2023 through May 31, 2024 |
| |
| | |
Tortoise Energy
Infrastructure
Corp.(1) | | |
Tortoise
Midstream Energy
Fund, Inc. | |
| Reconciliation of net increase in net assets applicable to common stockholders resulting from operations to net cash provided by (used in) operating activities | |
| | |
| |
| Net increase in net assets applicable to common stockholders resulting from operations | |
$ | 70,589,321 | | |
$ | 37,544,316 | |
| Adjustments to reconcile net increase in net assets applicable to common stockholders resulting from operations to net cash provided by (used in) operating activities: | |
| | | |
| | |
| Purchases of long-term investments | |
| (166,293,918 | ) | |
| (30,967,072 | ) |
| Proceeds from sales of long-term investments | |
| 167,127,918 | | |
| 27,484,901 | |
| Sales (purchases) of short-term investments, net | |
| (230,875 | ) | |
| 3,433,683 | |
| Proceeds from debt retirement | |
| — | | |
| — | |
| Call options written, net | |
| — | | |
| — | |
| Return of capital on distributions received | |
| 6,892,019 | | |
| 5,306,579 | |
| Net unrealized (appreciation) depreciation | |
| (77,214,031 | ) | |
| (39,969,362 | ) |
| Amortization (accretion) of market premium (discount), net | |
| — | | |
| — | |
| Net realized (gain) loss | |
| 7,322,102 | | |
| 2,579,598 | |
| Amortization of debt issuance costs | |
| 32,422 | | |
| 7,406 | |
| Changes in operating assets and liabilities: | |
| | | |
| | |
| (Increase) decrease in dividends, distributions and interest receivable from investments | |
| 618,456 | | |
| 182,115 | |
| (Increase) decrease in current tax receivable | |
| (364,730 | ) | |
| (239,768 | ) |
| (Increase) decrease in receivable for investments sold | |
| (8,556,846 | ) | |
| (4,678,692 | ) |
| (Increase) decrease in prepaid expenses and other assets | |
| (571,266 | ) | |
| (381,341 | ) |
| Increase (decrease) in payable for investments purchased | |
| 10,229,682 | | |
| 5,593,403 | |
| Increase (decrease) in payable to Adviser, net of fees waived | |
| 71,877 | | |
| 43,211 | |
| Decrease in current tax liability | |
| (2,129,680 | ) | |
| (1,259,442 | ) |
| Increase (decrease) in accrued expenses and other liabilities | |
| (16,246 | ) | |
| 63,392 | |
| Total adjustments | |
| (63,083,116 | ) | |
| (32,801,389 | ) |
| Net cash provided by (used in) operating activities | |
$ | 7,506,205 | | |
$ | 4,742,927 | |
| (1) |
Consolidated Statement of Cash
Flows (See Note 13 to the financial statements for further disclosure). |
See accompanying Notes to Financial Statements.
| |
| |
| 2024 Semi-Annual Report | May 31, 2024 |
| |
| |
Tortoise
Pipeline
& Energy
Fund, Inc. | | |
Tortoise
Energy
Independence
Fund, Inc. | | |
Tortoise
Power
and Energy
Infrastructure
Fund, Inc. | | |
Ecofin
Sustainable
and Social Impact
Term Fund(1) | |
| | | |
| | |
| | |
| |
| | | | |
| | | |
| | | |
| | |
| $ | 12,281,306 | | |
$ | 9,167,719 | | |
$ | 12,517,932 | | |
$ | 7,292,490 | |
| | | | |
| | | |
| | | |
| | |
| | | | |
| | | |
| | | |
| | |
| | (471,402 | ) | |
| (1,350,832 | ) | |
| (12,622,234 | ) | |
| (34,317,147 | ) |
| | 474,265 | | |
| 1,350,395 | | |
| 14,461,668 | | |
| 41,565,935 | |
| | 100,971 | | |
| 16,940 | | |
| (40,165 | ) | |
| (8,986 | ) |
| | — | | |
| — | | |
| 225,000 | | |
| — | |
| | — | | |
| — | | |
| — | | |
| (16,042 | ) |
| | 1,108,673 | | |
| 595,828 | | |
| 1,201,299 | | |
| 658,916 | |
| | (11,931,535 | ) | |
| (8,823,367 | ) | |
| (11,756,303 | ) | |
| (1,107,964 | ) |
| | — | | |
| — | | |
| 47,284 | | |
| (6,508 | ) |
| | 161,253 | | |
| (104,940 | ) | |
| 192,759 | | |
| (3,368,938 | ) |
| | 5,702 | | |
| — | | |
| — | | |
| — | |
| | | | |
| | | |
| | | |
| | |
| | 6,944 | | |
| 1,371 | | |
| (49,732 | ) | |
| (52,287 | ) |
| | — | | |
| — | | |
| — | | |
| — | |
| | 281,533 | | |
| — | | |
| — | | |
| — | |
| | (121,548 | ) | |
| (104,980 | ) | |
| (105,212 | ) | |
| (129,232 | ) |
| | (279,580 | ) | |
| — | | |
| — | | |
| — | |
| | (40,543 | ) | |
| 8,785 | | |
| 12,108 | | |
| (31,663 | ) |
| | — | | |
| — | | |
| — | | |
| — | |
| | (3,571 | ) | |
| (57,741 | ) | |
| (73,599 | ) | |
| (90,248 | ) |
| | (10,708,838 | ) | |
| (8,468,541 | ) | |
| (8,507,127 | ) | |
| 3,095,836 | |
| $ | 1,572,468 | | |
$ | 699,178 | | |
$ | 4,010,805 | | |
$ | 10,388,326 | |
See accompanying Notes to Financial Statements.
TYG Financial Highlights
| | |
Six
Months
Ended May 31,
2024 | | |
Year
Ended
November 30,
2023 | | |
Year
Ended
November 30,
2022 | | |
Year
Ended
November 30,
2021 | | |
Year
Ended
November 30,
2020 | | |
Year
Ended
November 30,
2019 | |
| | |
(unaudited) | | |
| | |
| | |
| | |
| | |
| |
| Per Common Share Data(1)(2) | |
| | | |
| | | |
| | | |
| | | |
| | | |
| | |
| Net Asset Value, beginning of the period | |
$ | 35.35 | | |
$ | 39.41 | | |
$ | 33.54 | | |
$ | 25.42 | | |
$ | 69.24 | | |
$ | 94.00 | |
| Income (Loss) from Investment Operations | |
| | | |
| | | |
| | | |
| | | |
| | | |
| | |
| Net investment income (loss)(3) | |
| 0.08 | | |
| 0.30 | | |
| 0.12 | | |
| (0.45 | ) | |
| (0.44 | ) | |
| (1.20 | ) |
| Net realized and unrealized gain (loss)(3) | |
| 6.47 | | |
| (1.52 | ) | |
| 8.59 | | |
| 10.04 | | |
| (41.20 | ) | |
| (13.08 | ) |
| Total income (loss) from investment operations | |
| 6.55 | | |
| (1.22 | ) | |
| 8.71 | | |
| 9.59 | | |
| (41.64 | ) | |
| (14.28 | ) |
| Distributions to Common Stockholders | |
| | | |
| | | |
| | | |
| | | |
| | | |
| | |
| Net investment income | |
| (1.42 | ) | |
| (1.65 | ) | |
| — | | |
| — | | |
| — | | |
| — | |
| From return of capital | |
| — | | |
| (1.19 | ) | |
| (2.84 | ) | |
| (1.47 | ) | |
| (2.18 | ) | |
| (10.48 | ) |
| Total distributions to common stockholders | |
| (1.42 | ) | |
| (2.84 | ) | |
| (2.84 | ) | |
| (1.47 | ) | |
| (2.18 | ) | |
| (10.48 | ) |
| Capital Stock Transactions | |
| | | |
| | | |
| | | |
| | | |
| | | |
| | |
| Premiums less underwriting discounts and offering costs on issuance of common stock(4) | |
| — | | |
| — | | |
| — | | |
| — | | |
| — | | |
| (0.00 | ) |
| Total capital stock transactions | |
| — | | |
| — | | |
| — | | |
| — | | |
| — | | |
| (0.00 | ) |
| Net Asset Value, end of period | |
$ | 40.48 | | |
$ | 35.35 | | |
$ | 39.41 | | |
$ | 33.54 | | |
$ | 25.42 | | |
$ | 69.24 | |
| Per common share market value, end of period | |
$ | 33.51 | | |
$ | 28.11 | | |
$ | 33.54 | | |
$ | 27.27 | | |
$ | 19.16 | | |
$ | 67.28 | |
| Total investment return based on market value(5)(6) | |
| 24.72 | % | |
| (7.77 | )% | |
| 33.82 | % | |
| 50.27 | % | |
| (69.69 | )% | |
| (15.46 | )% |
| | |
| | | |
| | | |
| | | |
| | | |
| | | |
| | |
| Supplemental Data and Ratios | |
| | | |
| | | |
| | | |
| | | |
| | | |
| | |
| Net assets applicable to common stockholders, end of period (000’s) | |
$ | 435,800 | | |
$ | 380,497 | | |
$ | 446,618 | | |
$ | 400,044 | | |
$ | 311,398 | | |
$ | 930,286 | |
| Average net assets (000’s) | |
$ | 396,292 | | |
$ | 407,705 | | |
$ | 438,035 | | |
$ | 403,236 | | |
$ | 473,041 | | |
$ | 1,203,943 | |
| Ratio of Expenses to Average Net Assets(7) | |
| | | |
| | | |
| | | |
| | | |
| | | |
| | |
| Advisory fees | |
| 1.22 | % | |
| 1.24 | % | |
| 1.25 | % | |
| 1.18 | % | |
| 1.54 | % | |
| 1.62 | % |
| Other operating expenses | |
| 0.39 | | |
| 0.51 | | |
| 0.24 | | |
| 0.29 | | |
| 0.27 | | |
| 0.14 | |
| Total operating expenses, before fee waiver | |
| 1.61 | | |
| 1.75 | | |
| 1.50 | | |
| 1.47 | | |
| 1.81 | | |
| 1.76 | |
| Fee waiver(8) | |
| — | | |
| — | | |
| — | | |
| — | | |
| — | | |
| (0.00 | ) |
| Total operating expenses | |
| 1.61 | | |
| 1.75 | | |
| 1.50 | | |
| 1.47 | | |
| 1.81 | | |
| 1.76 | |
| Leverage expenses | |
| 1.18 | | |
| 1.29 | | |
| 1.18 | | |
| 1.32 | | |
| 3.48 | | |
| 2.15 | |
| Income tax expense (benefit)(9) | |
| 0.07 | | |
| (3.30 | ) | |
| 2.02 | | |
| 9.06 | | |
| (22.97 | ) | |
| (5.49 | ) |
| Total expenses | |
| 2.86 | % | |
| (0.26 | )% | |
| 4.70 | % | |
| 11.85 | % | |
| (17.68 | )% | |
| (1.58 | )% |
See accompanying Notes to Financial Statements.
2024 Semi-Annual Report | May 31, 2024
| | |
Six
Months
Ended May 31,
2024 | | |
Year
Ended
November 30,
2023 | | |
Year
Ended
November 30,
2022 | | |
Year
Ended
November 30,
2021 | | |
Year
Ended
November 30,
2020 | | |
Year
Ended
November 30,
2019 | |
| | |
(unaudited) | | |
| | |
| | |
| | |
| | |
| |
| Ratio of net investment loss to average net assets before fee waiver | |
| 0.42 | % | |
| 0.82 | % | |
| 0.32 | % | |
| (1.35 | )% | |
| (2.80 | )% | |
| (1.33 | )% |
| Ratio of net investment loss to average net assets after fee waiver | |
| 0.42 | % | |
| 0.82 | % | |
| 0.32 | % | |
| (1.35 | )% | |
| (2.80 | )% | |
| (1.33 | )% |
| Portfolio turnover rate | |
| 32.63 | % | |
| 41.98 | % | |
| 73.84 | % | |
| 65.30 | % | |
| 36.79 | % | |
| 26.35 | % |
| Credit facility borrowings, end of period (000’s) | |
$ | 29,600 | | |
$ | 7,300 | | |
$ | 30,700 | | |
$ | 19,200 | | |
$ | 13,200 | | |
$ | 93,900 | |
| Senior notes, end of period (000’s) | |
$ | 50,333 | | |
$ | 64,853 | | |
$ | 81,632 | | |
$ | 83,893 | | |
$ | 87,927 | | |
$ | 365,000 | |
| Preferred stock, end of period (000’s) | |
$ | 35,661 | | |
$ | 35,661 | | |
$ | 35,661 | | |
$ | 32,300 | | |
$ | 32,300 | | |
$ | 165,000 | |
| Per common share amount of senior notes outstanding, end of period | |
$ | 4.68 | | |
$ | 6.02 | | |
$ | 7.20 | | |
$ | 7.03 | | |
$ | 7.18 | | |
$ | 27.17 | |
| Per common share amount of net assets, excluding senior notes, end of period | |
$ | 45.16 | | |
$ | 41.37 | | |
$ | 46.61 | | |
$ | 40.57 | | |
$ | 32.60 | | |
$ | 96.41 | |
| Asset coverage, per $1,000 of principal amount of senior period and credit facility borrowings(10) | |
$ | 6,898 | | |
$ | 6,768 | | |
$ | 5,293 | | |
$ | 5,194 | | |
$ | 4,399 | | |
$ | 3,387 | |
| Asset coverage ratio of senior notes and credit facility borrowings(10) | |
| 690 | % | |
| 677 | % | |
| 529 | % | |
| 519 | % | |
| 440 | % | |
| 339 | % |
| Asset coverage, per $10 liquidation value per share of mandatory redeemable preferred stock(11) | |
$ | 48 | | |
$ | 45 | | |
$ | 40 | | |
$ | 40 | | |
$ | 33 | | |
$ | 25 | |
| Asset coverage ratio of preferred stock(11) | |
| 477 | % | |
| 453 | % | |
| 402 | % | |
| 395 | % | |
| 333 | % | |
| 249 | % |
| (1) |
Information presented relates to a share of common stock outstanding for the entire period. |
| (2) |
During the year ended November 30, 2020, the Fund effected the following reverse stock split: May 1, 2020, 1 for 4. All historical
per share information has been retroactively adjusted to reflect this reverse stock split. |
| (3) |
The per common share data for the years ended November 30, 2023, 2022, 2021, 2020, and 2019 do not reflect the change in estimate
of investment income and return of capital, for the respective year. See Note 2C to the financial statements for further disclosure. |
| (4) |
Represents underwriting and offering costs of less than $0.01 for the year ended November 30, 2019. |
| (5) |
Not annualized for periods less than one full year. |
| (6) |
Total investment return is calculated assuming a purchase of common stock at the beginning of the period and a sale at the closing
price on the last day of the period reported (excluding brokerage commissions). The calculation also assumes reinvestment of distributions
at actual prices pursuant to TYG’s dividend reinvestment plan. |
| (7) |
Annualized for periods less than one full year. |
| (8) |
Less than 0.01% for the years ended November 30, 2019. |
| (9) |
For the period from December 1, 2023 through May 31, 2024, TYG accrued $139,209 for current income tax expense. For the year
ended November 30, 2023, TYG accrued $13,467,645 for current tax benefit. For the year ended November 30, 2022, TYG accrued $8,864,115
for current tax expense. For the year ended November 30, 2021, TYG accrued $36,546,777 for current income tax expense. For the year
ended November 30, 2020, TYG accrued $116,472,157 for net deferred income tax benefit and $7,747,729 for current income tax expense.
For the year ended November 30, 2019, TYG accrued $73,090,370 for net deferred income tax benefit and $7,034,755 for current income
tax expense. |
| (10) |
Represents value of total assets less all liabilities and indebtedness not represented by senior notes, credit facility borrowings
and preferred stock at the end of the period divided by senior notes and credit facility borrowings outstanding at the end of the
period. |
| (11) |
Represents value of total assets less all liabilities and indebtedness not represented by senior notes, credit facility borrowings
and preferred stock at the end of the period divided by senior notes, credit facility borrowings and preferred stock outstanding
at the end of the period. |
See accompanying Notes to Financial Statements.
NTG Financial Highlights
| | |
Six Months
Ended May 31,
2024 | | |
Year Ended
November 30,
2023 | | |
Year Ended
November 30,
2022 | | |
Year Ended
November 30,
2021 | | |
Year Ended
November 30,
2020 | | |
Year Ended
November 30,
2019 | |
| | |
(unaudited) | | |
| | |
| | |
| | |
| | |
| |
| Per Common Share Data(1)(2) | |
| | | |
| | | |
| | | |
| | | |
| | | |
| | |
| Net Asset Value, beginning of period | |
$ | 42.62 | | |
$ | 44.21 | | |
$ | 35.59 | | |
$ | 25.56 | | |
$ | 105.60 | | |
$ | 144.80 | |
| Income (Loss) from Investment Operations | |
| | | |
| | | |
| | | |
| | | |
| | | |
| | |
| Net investment income (loss)(3) | |
| 0.03 | | |
| 0.29 | | |
| 0.18 | | |
| (0.41 | ) | |
| (0.30 | ) | |
| (2.80 | ) |
| Net realized and unrealized gain (loss)(3) | |
| 7.34 | | |
| 1.20 | | |
| 11.52 | | |
| 12.09 | | |
| (76.77 | ) | |
| (19.50 | ) |
| Total income (loss) from investment operations | |
| 7.37 | | |
| 1.49 | | |
| 11.70 | | |
| 11.68 | | |
| (77.07 | ) | |
| (22.30 | ) |
| Distributions to Common Stockholders | |
| | | |
| | | |
| | | |
| | | |
| | | |
| | |
| Net investment income | |
| (1.54 | ) | |
| (1.64 | ) | |
| — | | |
| — | | |
| — | | |
| — | |
| From return of capital | |
| — | | |
| (1.44 | ) | |
| (3.08 | ) | |
| (1.65 | ) | |
| (2.97 | ) | |
| (16.90 | ) |
| Total distributions to common stockholders | |
| (1.54 | ) | |
| (3.08 | ) | |
| (3.08 | ) | |
| (1.65 | ) | |
| (2.97 | ) | |
| (16.90 | ) |
| Capital stock transactions | |
| | | |
| | | |
| | | |
| | | |
| | | |
| | |
| Premiums less underwriting discounts and offering costs on issuance of common stock(4) | |
| — | | |
| — | | |
| — | | |
| — | | |
| — | | |
| (0.00 | ) |
| Net Asset Value, end of period | |
$ | 48.45 | | |
$ | 42.62 | | |
$ | 44.21 | | |
$ | 35.59 | | |
$ | 25.56 | | |
$ | 105.60 | |
| Per common share market value, end of period | |
$ | 40.34 | | |
$ | 34.22 | | |
$ | 37.69 | | |
$ | 30.31 | | |
$ | 19.46 | | |
$ | 98.80 | |
| Total investment return based on market value(5)(6) | |
| 22.68 | % | |
| (0.83 | )% | |
| 34.99 | % | |
| 64.86 | % | |
| (78.77 | )% | |
| (17.63 | )% |
| |
| Supplemental Data and Ratios | |
| | | |
| | | |
| | | |
| | | |
| | | |
| | |
| Net assets applicable to common stockholders, end of period (000’s) | |
$ | 246,768 | | |
$ | 217,066 | | |
$ | 237,022 | | |
$ | 200,841 | | |
$ | 149,407 | | |
$ | 667,708 | |
| Average net assets (000’s) | |
$ | 226,817 | | |
$ | 219,839 | | |
$ | 229,874 | | |
$ | 200,484 | | |
$ | 289,147 | | |
$ | 871,496 | |
| Ratio of Expenses to Average Net Assets(7) | |
| | | |
| | | |
| | | |
| | | |
| | | |
| | |
| Advisory fees | |
| 1.18 | % | |
| 1.21 | % | |
| 1.21 | % | |
| 1.28 | % | |
| 1.61 | % | |
| 1.59 | % |
| Other operating expenses | |
| 0.55 | | |
| 0.77 | | |
| 0.33 | | |
| 0.37 | | |
| 0.33 | | |
| 0.14 | |
| Total operating expenses, before fee waiver | |
| 1.73 | | |
| 1.98 | | |
| 1.54 | | |
| 1.65 | | |
| 1.94 | | |
| 1.73 | |
| Fee waiver | |
| — | | |
| — | | |
| — | | |
| — | | |
| — | | |
| (0.03 | ) |
| Total operating expenses | |
| 1.73 | | |
| 1.98 | | |
| 1.54 | | |
| 1.65 | | |
| 1.94 | | |
| 1.70 | |
| Leverage expenses | |
| 0.98 | | |
| 1.16 | | |
| 0.98 | | |
| 0.84 | | |
| 4.43 | | |
| 2.34 | |
| Income tax expense (benefit)(8) | |
| 0.02 | | |
| (2.29 | ) | |
| 2.04 | | |
| 8.82 | | |
| 2.19 | | |
| (4.80 | ) |
| Total expenses | |
| 2.73 | % | |
| 0.85 | % | |
| 4.56 | % | |
| 11.31 | % | |
| 8.56 | % | |
| (0.76 | )% |
See accompanying Notes to Financial Statements.
2024 Semi-Annual Report | May 31, 2024
| | |
Six Months
Ended May 31,
2024 | | |
Year Ended
November 30,
2023 | | |
Year Ended
November 30,
2022 | | |
Year Ended
November 30,
2021 | | |
Year Ended
November 30,
2020 | | |
Year Ended
November 30,
2019 | |
| | |
(unaudited) | | |
| | |
| | |
| | |
| | |
| |
| Ratio of net investment loss to average net assets before fee waiver | |
| 0.15 | % | |
| 0.70 | % | |
| 0.44 | % | |
| (1.17 | )% | |
| (3.11 | )% | |
| (2.05 | )% |
| Ratio of net investment loss to average net assets after fee waiver | |
| 0.15 | % | |
| 0.70 | % | |
| 0.44 | % | |
| (1.17 | )% | |
| (3.11 | )% | |
| (2.02 | )% |
| Portfolio turnover rate | |
| 9.74 | % | |
| 56.07 | % | |
| 72.67 | % | |
| 58.40 | % | |
| 38.08 | % | |
| 29.21 | % |
| Credit facility borrowings, end of period (000’s) | |
$ | 13,700 | | |
$ | 10,600 | | |
$ | 10,500 | | |
$ | 40,900 | | |
$ | 40,000 | | |
$ | 53,600 | |
| Senior notes, end of period (000’s) | |
$ | 29,171 | | |
$ | 29,171 | | |
$ | 32,150 | | |
$ | 7,150 | | |
$ | 15,321 | | |
$ | 277,000 | |
| Preferred stock, end of period (000’s) | |
$ | 13,754 | | |
$ | 13,754 | | |
$ | 19,719 | | |
$ | 12,219 | | |
$ | 12,700 | | |
$ | 132,000 | |
| Per common share amount of senior notes outstanding, end of period | |
$ | 5.73 | | |
$ | 5.73 | | |
$ | 6.00 | | |
$ | 1.27 | | |
$ | 2.62 | | |
$ | 43.82 | |
| Per common share amount of net assets, excluding senior notes, end of period | |
$ | 54.18 | | |
$ | 48.35 | | |
$ | 50.21 | | |
$ | 36.86 | | |
$ | 28.18 | | |
$ | 149.42 | |
| Asset coverage, per $1,000 of principal amount of senior notes and credit facility borrowings(9) | |
$ | 7,077 | | |
$ | 6,804 | | |
$ | 7,020 | | |
$ | 5,434 | | |
$ | 3,930 | | |
$ | 3,419 | |
| Asset coverage ratio of senior notes and credit facility borrowings(9) | |
| 708 | % | |
| 680 | % | |
| 702 | % | |
| 543 | % | |
| 393 | % | |
| 342 | % |
| Asset coverage, per $25 liquidation value per share of mandatory redeemable preferred stock(10) | |
$ | 134 | | |
$ | 126 | | |
$ | 120 | | |
$ | 108 | | |
$ | 80 | | |
$ | 61 | |
| Asset coverage ratio of preferred stock(10) | |
| 536 | % | |
| 506 | % | |
| 480 | % | |
| 433 | % | |
| 320 | % | |
| 244 | % |
| (1) |
Information presented relates to a share of common stock outstanding for the entire period. |
| (2) |
During the year ended November 30, 2020, the Fund effected the following reverse stock split: May 1, 2020, 1 for 10. All historical
per share information has been retroactively adjusted to reflect this reverse stock split. |
| (3) |
The per common share data for the years ended November 30, 2023, 2022, 2021, 2020, and 2019 do not reflect the change in estimate
of investment income and return of capital, for the respective year. See Note 2C to the financial statements for further disclosure.
|
| (4) |
Represents underwriting and offering costs of less than $0.01 for the year ending November 30, 2019. |
| (5) |
Not annualized for periods less than one full year. |
| (6) |
Total investment return is calculated assuming a purchase of common stock at the beginning of the period and a sale at the closing
price on the last day of the period reported (excluding brokerage commissions). This calculation also assumes reinvestment of distributions
at actual prices pursuant to NTG’s dividend reinvestment plan. |
| (7) |
Annualized for periods less than one full year. |
| (8) |
For the period from December 1, 2023 through May 31, 2024, NTG accrued $18,024 for current income tax expense. For the year ended
November 30, 2023, NTG accrued $5,026,388 for current tax benefit. For the year ended November 30, 2022, NTG accrued $4,679,689 for
current tax expense. For the year ended November 30, 2021, NTG accrued $17,691,276 for current income tax expense. For the year ended
November 30, 2020, NTG accrued $27,892,485 for net deferred income tax benefit and $34,222,098 for current tax expense. For the year
ended November 30, 2019, NTG accrued $40,282,948 for net deferred income tax benefit and $1,510,530 for current tax benefit. |
| (9) |
Represents value of total assets less all liabilities and indebtedness not represented by senior notes, credit facility borrowings
and preferred stock at the end of the period divided by senior notes and credit facility borrowings outstanding at the end of the
period. |
| (10) |
Represents value of total assets less all liabilities and indebtedness not represented by senior notes, credit facility borrowings
and preferred stock at the end of the period divided by senior notes, credit facility borrowings and preferred stock outstanding
at the end of the period. |
See accompanying Notes to Financial Statements.
TTP Financial Highlights
| | |
Six Months
Ended May 31,
2024 | | |
Year Ended
November 30,
2023 | | |
Year Ended
November 30,
2022 | | |
Year Ended
November 30,
2021 | | |
Year Ended
November 30,
2020 | | |
Year Ended
November 30,
2019 | |
| | |
(unaudited) | | |
| | |
| | |
| | |
| | |
| |
| Per Common Share Data(1)(2) | |
| | |
| | |
| | |
| | |
| | |
| |
| Net Asset Value, beginning of period | |
$ | 34.58 | | |
$ | 34.73 | | |
$ | 27.96 | | |
$ | 19.97 | | |
$ | 51.88 | | |
$ | 65.16 | |
| Income (Loss) from Investment Operations | |
| | | |
| | | |
| | | |
| | | |
| | | |
| | |
| Net investment income (loss)(3) | |
| 0.25 | | |
| 0.16 | | |
| 0.08 | | |
| (0.23 | ) | |
| (0.12 | ) | |
| (0.48 | ) |
| Net realized and unrealized gain (loss)(3) | |
| 5.86 | | |
| 2.05 | | |
| 9.05 | | |
| 9.28 | | |
| (30.17 | ) | |
| (7.24 | ) |
| Total income (loss) from investment operations | |
| 6.11 | | |
| 2.21 | | |
| 9.13 | | |
| 9.05 | | |
| (30.29 | ) | |
| (7.72 | ) |
| Distributions to Common Stockholders | |
| | | |
| | | |
| | | |
| | | |
| | | |
| | |
| From net investment income | |
| — | | |
| (0.53 | ) | |
| (0.49 | ) | |
| — | | |
| — | | |
| — | |
| From return of capital | |
| (1.18 | ) | |
| (1.83 | ) | |
| (1.87 | ) | |
| (1.06 | ) | |
| (1.62 | ) | |
| (5.56 | ) |
| Total distributions to common stockholders | |
| (1.18 | ) | |
| (2.36 | ) | |
| (2.36 | ) | |
| (1.06 | ) | |
| (1.62 | ) | |
| (5.56 | ) |
| Net Asset Value, end of period | |
$ | 39.51 | | |
$ | 34.58 | | |
$ | 34.73 | | |
$ | 27.96 | | |
$ | 19.97 | | |
$ | 51.88 | |
| Per common share market value, end of period | |
$ | 34.70 | | |
$ | 28.02 | | |
$ | 28.58 | | |
$ | 23.16 | | |
$ | 15.15 | | |
$ | 46.08 | |
| Total investment return based on market value(4)(5) | |
| 28.46 | % | |
| 6.72 | % | |
| 33.85 | % | |
| 60.09 | % | |
| (64.69 | )% | |
| (11.10 | )% |
| |
| Supplemental Data and Ratios | |
| | | |
| | | |
| | | |
| | | |
| | | |
| | |
| Net assets applicable to common stockholders, end of period (000’s) | |
$ | 79,434 | | |
$ | 69,525 | | |
$ | 73,509 | | |
$ | 62,289 | | |
$ | 48,108 | | |
$ | 129,887 | |
| Average net assets (000’s) | |
$ | 73,302 | | |
$ | 68,797 | | |
$ | 72,122 | | |
$ | 61,943 | | |
$ | 70,052 | | |
$ | 157,017 | |
| Ratio of Expenses to Average Net Assets(6) | |
| | | |
| | | |
| | | |
| | | |
| | | |
| | |
| Advisory fees | |
| 1.34 | % | |
| 1.39 | % | |
| 1.41 | % | |
| 1.46 | % | |
| 1.67 | % | |
| 1.54 | % |
| Other operating expenses | |
| 0.64 | | |
| 0.61 | | |
| 0.60 | | |
| 0.74 | | |
| 0.75 | | |
| 0.35 | |
| Total operating expenses, before fee waiver | |
| 1.98 | | |
| 2.00 | | |
| 2.01 | | |
| 2.20 | | |
| 2.42 | | |
| 1.89 | |
| Fee waiver | |
| (0.33 | ) | |
| (0.29 | ) | |
| (0.28 | ) | |
| (0.21 | ) | |
| — | | |
| — | |
| Total operating expenses | |
| 1.65 | | |
| 1.71 | | |
| 1.73 | | |
| 1.99 | | |
| 2.42 | | |
| 1.89 | |
| Leverage expenses | |
| 1.24 | | |
| 1.53 | | |
| 1.19 | | |
| 1.67 | | |
| 2.66 | | |
| 1.62 | |
| Total expenses | |
| 2.89 | % | |
| 3.24 | % | |
| 2.92 | % | |
| 3.66 | % | |
| 5.08 | % | |
| 3.51 | % |
See accompanying Notes to Financial Statements.
2024 Semi-Annual Report | May 31, 2024
| | |
Six Months
Ended May 31,
2024 | | |
Year Ended
November 30,
2023 | | |
Year Ended
November 30,
2022 | | |
Year Ended
November 30,
2021 | | |
Year Ended
November 30,
2020 | | |
Year Ended
November 30,
2019 | |
| | |
(unaudited) | | |
| | |
| | |
| | |
| | |
| |
| Ratio of net investment income (loss) to average net assets before fee waiver | |
| 1.07 | % | |
| 0.18 | % | |
| (0.05 | )% | |
| (1.04 | )% | |
| (0.97 | )% | |
| (0.79 | )% |
| Ratio of net investment income (loss) to average net assets after fee waiver | |
| 1.39 | % | |
| 0.48 | % | |
| 0.24 | % | |
| (0.83 | )% | |
| (0.97 | )% | |
| (0.79 | )% |
| Portfolio turnover rate | |
| 0.53 | % | |
| 7.66 | % | |
| 8.20 | % | |
| 14.77 | % | |
| 35.61 | % | |
| 21.31 | % |
| Credit facility borrowings, end of period (000’s) | |
$ | 6,700 | | |
$ | 5,900 | | |
$ | 9,800 | | |
$ | 8,100 | | |
$ | — | | |
$ | 11,800 | |
| Senior notes, end of period (000’s) | |
$ | 3,943 | | |
$ | 3,943 | | |
$ | 3,943 | | |
$ | 3,943 | | |
$ | 14,457 | | |
$ | 34,000 | |
| Preferred stock, end of period (000’s) | |
$ | 6,100 | | |
$ | 6,100 | | |
$ | 6,100 | | |
$ | 6,100 | | |
$ | 6,100 | | |
$ | 16,000 | |
| Per common share amount of senior notes outstanding, end of period | |
$ | 1.96 | | |
$ | 1.96 | | |
$ | 1.86 | | |
$ | 1.77 | | |
$ | 6.00 | | |
$ | 13.58 | |
| Per common share amount of net assets, excluding senior notes, end of period | |
$ | 41.47 | | |
$ | 36.54 | | |
$ | 36.59 | | |
$ | 29.73 | | |
$ | 25.97 | | |
$ | 65.46 | |
| Asset coverage, per $1,000 of principal amount of senior notes and credit facility borrowings(7) | |
$ | 9,037 | | |
$ | 8,683 | | |
$ | 6,793 | | |
$ | 6,679 | | |
$ | 4,750 | | |
$ | 4,185 | |
| Asset coverage ratio of senior notes and credit facility borrowings(7) | |
| 904 | % | |
| 868 | % | |
| 679 | % | |
| 668 | % | |
| 475 | % | |
| 419 | % |
| Asset coverage, per $25 liquidation value per share of mandatory redeemable preferred stock(8) | |
$ | 144 | | |
$ | 134 | | |
$ | 118 | | |
$ | 111 | | |
$ | 84 | | |
$ | 78 | |
| Asset coverage ratio of preferred stock(8) | |
| 574 | % | |
| 536 | % | |
| 470 | % | |
| 443 | % | |
| 334 | % | |
| 310 | % |
| (1) |
Information presented relates to a share of common stock outstanding for the entire period. |
| (2) |
During the year ended November 30, 2020, the Fund effected the following reverse stock split: May 1, 2020, 1 for 4. All historical
per share information has been retroactively adjusted to reflect this reverse stock split. |
| (3) |
The per common share data for the years ended November 30, 2023, 2022, 2021, 2020, and 2019 do not reflect the change in estimate
of investment income and return of capital, for the respective year. See Note 2C to the financial statements for further disclosure.
|
| (4) |
Not annualized for periods less than one full year. |
| (5) |
Total investment return is calculated assuming a purchase of common stock at the beginning of the period and a sale at the closing
price on the last day of the period reported (excluding brokerage commissions). The calculation also assumes reinvestment of distributions
at actual prices pursuant to TTP’s dividend reinvestment plan. |
| (6) |
Annualized for periods less than one full year. |
| (7) |
Represents value of total assets less all liabilities and indebtedness not represented by senior notes, credit facility borrowings
and preferred stock at the end of the period divided by senior notes and credit facility borrowings outstanding at the end of the
year. |
| (8) |
Represents value of total assets less all liabilities and indebtedness not represented by senior notes, credit facility borrowings
and preferred stock at the end of the period divided by senior notes, credit facility borrowings and preferred stock outstanding
at the end of the year. |
See accompanying Notes to Financial Statements.
NDP Financial Highlights
| | |
Six Months
Ended May 31,
2024 | | |
Year Ended
November 30,
2023 | | |
Year Ended
November 30,
2022 | | |
Year Ended
November 30,
2021 | | |
Year Ended
November 30,
2020 | | |
Year Ended
November 30,
2019 | |
| | |
(unaudited) | | |
| | |
| | |
| | |
| | |
| |
| Per Common Share Data(1)(2) | |
| | |
| | |
| | |
| | |
| | |
| |
| Net Asset Value, beginning of period | |
$ | 35.45 | | |
$ | 38.24 | | |
$ | 25.13 | | |
$ | 16.42 | | |
$ | 33.36 | | |
$ | 72.16 | |
| Income (Loss) from Investment Operations | |
| | | |
| | | |
| | | |
| | | |
| | | |
| | |
| Net investment income (loss)(3) | |
| 0.14 | | |
| 0.44 | | |
| 0.80 | | |
| 0.13 | | |
| — | | |
| (0.80 | ) |
| Net realized and unrealized gain (loss)(3) | |
| 5.36 | | |
| (0.71 | ) | |
| 14.39 | | |
| 9.20 | | |
| (16.14 | ) | |
| (29.36 | ) |
| Total income (loss) from investment operations | |
| 5.50 | | |
| (0.27 | ) | |
| 15.19 | | |
| 9.33 | | |
| (16.14 | ) | |
| (30.16 | ) |
| Distributions to Common Stockholders | |
| | | |
| | | |
| | | |
| | | |
| | | |
| | |
| From net investment income | |
| — | | |
| (0.75 | ) | |
| (0.82 | ) | |
| (0.05 | ) | |
| — | | |
| — | |
| From return of capital | |
| (1.26 | ) | |
| (1.77 | ) | |
| (1.26 | ) | |
| (0.57 | ) | |
| (0.80 | ) | |
| (8.64 | ) |
| Total distributions to common stockholders | |
| (1.26 | ) | |
| (2.52 | ) | |
| (2.08 | ) | |
| (0.62 | ) | |
| (0.80 | ) | |
| (8.64 | ) |
| Net Asset Value, end of period | |
$ | 39.69 | | |
$ | 35.45 | | |
$ | 38.24 | | |
$ | 25.13 | | |
$ | 16.42 | | |
$ | 33.36 | |
| Per common share market value, end of period | |
$ | 33.98 | | |
$ | 28.95 | | |
$ | 32.41 | | |
$ | 22.24 | | |
$ | 12.63 | | |
$ | 29.04 | |
| Total investment return based on market value(4)(5) | |
| 21.99 | % | |
| (2.80 | )% | |
| 55.70 | % | |
| 81.36 | % | |
| (54.88 | )% | |
| (52.35 | )% |
| |
| Supplemental Data and Ratios | |
| | | |
| | | |
| | | |
| | | |
| | | |
| | |
| Net assets applicable to common stockholders, end of period (000’s) | |
$ | 66,122 | | |
$ | 59,053 | | |
$ | 67,067 | | |
$ | 46,398 | | |
$ | 30,307 | | |
$ | 61,550 | |
| Average net assets (000’s) | |
$ | 61,455 | | |
$ | 61,082 | | |
$ | 61,932 | | |
$ | 41,323 | | |
$ | 37,057 | | |
$ | 94,144 | |
| Ratio of Expenses to Average Net Assets(6) | |
| | | |
| | | |
| | | |
| | | |
| | | |
| | |
| Advisory fees | |
| 1.26 | % | |
| 1.23 | % | |
| 1.16 | % | |
| 1.20 | % | |
| 1.40 | % | |
| 1.52 | % |
| Other operating expenses | |
| 0.69 | | |
| 0.70 | | |
| 0.54 | | |
| 1.04 | | |
| 1.18 | | |
| 0.51 | |
| Total operating expenses, before fee waiver | |
| 1.95 | | |
| 1.93 | | |
| 1.70 | | |
| 2.24 | | |
| 2.58 | | |
| 2.03 | |
| Fee waiver | |
| (0.40 | ) | |
| (0.42 | ) | |
| (0.28 | ) | |
| (0.22 | ) | |
| — | | |
| — | |
| Total operating expenses | |
| 1.55 | | |
| 1.51 | | |
| 1.42 | | |
| 2.02 | | |
| 2.58 | | |
| 2.03 | |
| Leverage expenses | |
| 0.97 | | |
| 0.79 | | |
| 0.18 | | |
| 0.16 | | |
| 0.66 | | |
| 1.30 | |
| Total expenses | |
| 2.52 | % | |
| 2.30 | % | |
| 1.60 | % | |
| 2.18 | % | |
| 3.24 | % | |
| 3.33 | % |
See accompanying Notes to Financial Statements.
2024 Semi-Annual Report | May 31, 2024
| | |
Six Months
Ended May 31,
2024 | | |
Year Ended
November 30,
2023 | | |
Year Ended
November 30,
2022 | | |
Year Ended
November 30,
2021 | | |
Year Ended
November 30,
2020 | | |
Year Ended
November 30,
2019 | |
| | |
(unaudited) | | |
| | |
| | |
| | |
| | |
| |
| Ratio of net investment income (loss) to average net assets before fee waiver | |
| 0.38 | % | |
| 0.84 | % | |
| 2.09 | % | |
| 0.36 | % | |
| 0.03 | % | |
| (1.58 | )% |
| Ratio of net investment income (loss) to average net assets after fee waiver | |
| 0.78 | % | |
| 1.26 | % | |
| 2.37 | % | |
| 0.58 | % | |
| 0.03 | % | |
| (1.58 | )% |
| Portfolio turnover rate | |
| 1.91 | % | |
| 14.33 | % | |
| 13.67 | % | |
| 53.15 | % | |
| 72.19 | % | |
| 182.52 | % |
| Credit facility borrowings, end of period (000’s) | |
$ | 10,200 | | |
$ | 8,800 | | |
$ | 3,700 | | |
$ | 2,700 | | |
$ | 5,000 | | |
$ | 26,500 | |
| Asset coverage, per $1,000 of principal amount of credit facility borrowings(7) | |
$ | 7,483 | | |
$ | 7,711 | | |
$ | 19,126 | | |
$ | 18,185 | | |
$ | 7,061 | | |
$ | 3,323 | |
| Asset coverage ratio of credit facility borrowings(7) | |
| 748 | % | |
| 771 | % | |
| 1,913 | % | |
| 1,818 | % | |
| 706 | % | |
| 332 | % |
| (1) |
Information presented relates to a share of common stock outstanding for the entire period. |
| (2) |
During the year ended November 30, 2020, the Fund effected the following reverse stock split: May 1, 2020, 1 for 8. All historical
per share information has been retroactively adjusted to reflect this reverse stock split. |
| (3) |
The per common share data for the years ended November 30, 2023, 2022, 2021, 2020, and 2019 do not reflect the change in estimate
of investment income and return of capital, for the respective year. See Note 2C to the financial statements for further disclosure.
|
| (4) |
Not annualized for periods less than one full year. |
| (5) |
Total investment return is calculated assuming a purchase of common stock at the beginning of the period and a sale at the closing
price on the last day of the period reported (excluding brokerage commissions). The calculation also assumes reinvestment of distributions
at actual prices pursuant to NDP’s dividend reinvestment plan. |
| (6) |
Annualized for periods less than one full year. |
| (7) |
Represents value of total assets less all liabilities and indebtedness not represented by credit facility borrowings at the end
of the year divided by credit facility borrowings outstanding at the end of the period. |
See accompanying Notes to Financial Statements.
TPZ Financial Highlights
| | |
Six Months
Ended May 31,
2024 | | |
Year Ended
November 30,
2023 | | |
Year Ended
November 30,
2022 | | |
Year Ended
November 30,
2021 | | |
Year Ended
November 30,
2020 | | |
Year Ended
November 30,
2019 | |
| | |
(unaudited) | | |
| | |
| | |
| | |
| | |
| |
| Per Common Share Data(1) | |
| | |
| | |
| | |
| | |
| | |
| |
| Net Asset Value, beginning of period | |
$ | 16.25 | | |
$ | 15.85 | | |
$ | 15.09 | | |
$ | 13.01 | | |
$ | 17.70 | | |
$ | 19.76 | |
| Income (loss) from Investment Operations | |
| | | |
| | | |
| | | |
| | | |
| | | |
| | |
| Net investment income(2) | |
| 0.16 | | |
| 0.32 | | |
| 0.24 | | |
| 0.23 | | |
| 0.35 | | |
| 0.39 | |
| Net realized and unrealized gain (loss)(2) | |
| 1.97 | | |
| 1.34 | | |
| 1.69 | | |
| 2.49 | | |
| (3.99 | ) | |
| (0.95 | ) |
| Total income (loss) from investment operations | |
| 2.13 | | |
| 1.66 | | |
| 1.93 | | |
| 2.72 | | |
| (3.64 | ) | |
| (0.56 | ) |
| Distributions to Common Stockholders | |
| | | |
| | | |
| | | |
| | | |
| | | |
| | |
| From net investment income | |
| — | | |
| (0.62 | ) | |
| (0.29 | ) | |
| (0.28 | ) | |
| (0.60 | ) | |
| (1.12 | ) |
| From net realized gains from investment transactions | |
| — | | |
| — | | |
| — | | |
| — | | |
| — | | |
| (0.28 | ) |
| From return of capital | |
| (0.63 | ) | |
| (0.64 | ) | |
| (0.88 | ) | |
| (0.36 | ) | |
| (0.45 | ) | |
| (0.10 | ) |
| Total distributions to common stockholders | |
| (0.63 | ) | |
| (1.26 | ) | |
| (1.17 | ) | |
| (0.64 | ) | |
| (1.05 | ) | |
| (1.50 | ) |
| Net Asset Value, end of period | |
$ | 17.75 | | |
$ | 16.25 | | |
$ | 15.85 | | |
$ | 15.09 | | |
$ | 13.01 | | |
$ | 17.70 | |
| Per common share market value, end of period | |
$ | 15.45 | | |
$ | 13.57 | | |
$ | 13.63 | | |
$ | 12.92 | | |
$ | 9.99 | | |
$ | 15.57 | |
| Total investment return based on market value(3)(4) | |
| 18.77 | % | |
| 9.43 | % | |
| 14.87 | % | |
| 35.99 | % | |
| (29.23 | )% | |
| (1.38 | )% |
| |
| Supplemental Data and Ratios | |
| | | |
| | | |
| | | |
| | | |
| | | |
| | |
| Net assets applicable to common stockholders, end of period (000’s) | |
$ | 104,532 | | |
$ | 95,724 | | |
$ | 98,245 | | |
$ | 98,462 | | |
$ | 89,426 | | |
$ | 123,015 | |
| Average net assets (000’s) | |
$ | 99,877 | | |
$ | 96,134 | | |
$ | 101,421 | | |
$ | 100,853 | | |
$ | 93,027 | | |
$ | 137,701 | |
| Ratio of Expenses to Average Net Assets(5) | |
| | | |
| | | |
| | | |
| | | |
| | | |
| | |
| Advisory fees | |
| 1.18 | % | |
| 1.20 | % | |
| 1.18 | % | |
| 1.18 | % | |
| 1.28 | % | |
| 1.32 | % |
| Other operating expenses | |
| 0.52 | | |
| 0.45 | | |
| 0.56 | | |
| 0.47 | | |
| 0.94 | | |
| 0.38 | |
| Total operating expenses | |
| 1.70 | | |
| 1.65 | | |
| 1.74 | | |
| 1.65 | | |
| 2.22 | | |
| 1.70 | |
| Leverage expenses | |
| 1.50 | | |
| 1.05 | | |
| 0.85 | | |
| 0.82 | | |
| 1.04 | | |
| 1.25 | |
| Total expenses | |
| 3.20 | % | |
| 2.70 | % | |
| 2.59 | % | |
| 2.47 | % | |
| 3.26 | % | |
| 2.95 | % |
See accompanying Notes to Financial Statements.
2024 Semi-Annual Report | May 31, 2024
| | |
Six Months
Ended May 31,
2024 | | |
Year Ended
November 30,
2023 | | |
Year Ended
November 30,
2022 | | |
Year Ended
November 30,
2021 | | |
Year Ended
November 30,
2020 | | |
Year Ended
November 30,
2019 | |
| | |
(unaudited) | | |
| | |
| | |
| | |
| | |
| |
| Ratio of net investment income to average net assets | |
| 1.91 | % | |
| 2.06 | % | |
| 1.53 | % | |
| 1.48 | % | |
| 2.61 | % | |
| 1.98 | % |
| Portfolio turnover rate | |
| 10.24 | % | |
| 9.72 | % | |
| 4.85 | % | |
| 26.70 | % | |
| 29.95 | % | |
| 25.27 | % |
| Credit facility borrowings, end of period (000’s) | |
$ | 24,300 | | |
$ | 24,600 | | |
$ | 25,900 | | |
$ | 24,000 | | |
$ | 26,200 | | |
$ | 54,100 | |
| Asset coverage, per $1,000 of principal amount of senior notes and credit facility borrowings(6) | |
$ | 5,302 | | |
$ | 4,891 | | |
$ | 4,793 | | |
$ | 5,103 | | |
$ | 4,413 | | |
$ | 3,274 | |
| Asset coverage ratio of senior notes and credit facility borrowings(6) | |
| 530 | % | |
| 489 | % | |
| 479 | % | |
| 510 | % | |
| 441 | % | |
| 327 | % |
| (1) |
Information presented relates to a share of common stock outstanding for the entire period. |
| (2) |
The per common share data for the years ended November 30, 2023, 2022, 2021, 2020, and 2019 do not reflect the change in estimate
of investment income and return of capital, for the respective year. See Note 2C to the financial statements for further disclosure.
|
| (3) |
Not annualized for periods less than one full year. |
| (4) |
Total investment return is calculated assuming a purchase of common stock at the beginning of the period and a sale at the closing
price on the last day of the period reported (excluding brokerage commissions). The calculation also assumes reinvestment of distributions
at actual prices pursuant to TPZ’s dividend reinvestment plan. |
| (5) |
Annualized for periods less than one full year. |
| (6) |
Represents value of total assets less all liabilities and indebtedness not represented by credit facility borrowings at the end
of the period divided by credit facility borrowings outstanding at the end of the period. |
See accompanying Notes to Financial Statements.
TEAF Financial Highlights
| | |
Six Months
Ended May 31,
2024 | | |
Year Ended
November 30,
2023 | | |
Year Ended
November 30,
2022 | | |
Year Ended
November 30,
2021 | | |
Year Ended
November 30,
2020 | | |
Period From
March 29, 2019(1)
through
November 30,
2019 | |
| | |
(unaudited) | | |
| | |
| | |
| | |
| | |
| |
| Per Common Share Data(2) | |
| | |
| | |
| | |
| | |
| | |
| |
| Net Asset Value, beginning of period | |
$ | 14.84 | | |
$ | 16.37 | | |
$ | 17.15 | | |
$ | 15.85 | | |
$ | 17.60 | | |
$ | 20.00 | |
| Income (loss) from Investment Operations | |
| | | |
| | | |
| | | |
| | | |
| | | |
| | |
| Net investment income | |
| 0.21 | | |
| 0.38 | | |
| 0.44 | | |
| 0.54 | | |
| 0.51 | | |
| 0.31 | |
| Net realized and unrealized gain (loss) | |
| 0.33 | | |
| (0.83 | ) | |
| (0.17 | ) | |
| 1.66 | | |
| (1.16 | ) | |
| (1.95 | ) |
| Total income (loss) from investment operations | |
| 0.54 | | |
| (0.45 | ) | |
| 0.27 | | |
| 2.20 | | |
| (0.65 | ) | |
| (1.64 | ) |
| Distributions to Common Stockholders | |
| | | |
| | | |
| | | |
| | | |
| | | |
| | |
| From net investment income | |
| (0.28 | ) | |
| (0.35 | ) | |
| (0.46 | ) | |
| (0.64 | ) | |
| (0.46 | ) | |
| (0.34 | ) |
| From return of capital | |
| (0.26 | ) | |
| (0.73 | ) | |
| (0.59 | ) | |
| (0.26 | ) | |
| (0.64 | ) | |
| (0.42 | ) |
| Total distributions to common stockholders | |
| (0.54 | ) | |
| (1.08 | ) | |
| (1.05 | ) | |
| (0.90 | ) | |
| (1.10 | ) | |
| (0.76 | ) |
| Net Asset Value, end of period | |
$ | 14.84 | | |
$ | 14.84 | | |
$ | 16.37 | | |
$ | 17.15 | | |
$ | 15.85 | | |
$ | 17.60 | |
| Per common share market value, end of period | |
$ | 11.71 | | |
$ | 12.01 | | |
$ | 13.85 | | |
$ | 14.64 | | |
$ | 13.04 | | |
$ | 15.60 | |
| Total investment return based on market value(3)(4) | |
| 2.06 | % | |
| (5.48 | )% | |
| 1.74 | % | |
| 19.50 | % | |
| (8.66 | )% | |
| (18.45 | )% |
| |
| Supplemental Data and Ratios | |
| | | |
| | | |
| | | |
| | | |
| | | |
| | |
| Net assets applicable to common stockholders, end of period (000’s) | |
$ | 200,265 | | |
$ | 200,258 | | |
$ | 220,798 | | |
$ | 231,382 | | |
$ | 213,825 | | |
$ | 237,461 | |
| Average net assets (000’s) | |
$ | 198,646 | | |
$ | 211,331 | | |
$ | 225,912 | | |
$ | 228,533 | | |
$ | 210,055 | | |
$ | 252,217 | |
| Ratio of Expenses to Average Net Assets(5) | |
| | | |
| | | |
| | | |
| | | |
| | | |
| | |
| Advisory fees | |
| 1.50 | % | |
| 1.54 | % | |
| 1.51 | % | |
| 1.53 | % | |
| 1.55 | % | |
| 1.51 | % |
| Other operating expenses | |
| 0.35 | | |
| 0.29 | | |
| 0.38 | | |
| 0.33 | | |
| 0.37 | | |
| 0.81 | |
| Total operating expenses, before fee waiver | |
| 1.85 | | |
| 1.83 | | |
| 1.89 | | |
| 1.86 | | |
| 1.92 | | |
| 2.32 | |
| Fee waiver | |
| — | | |
| — | | |
| — | | |
| — | | |
| (0.10 | ) | |
| (0.28 | ) |
| Total operating expenses | |
| 1.85 | | |
| 1.83 | | |
| 1.89 | | |
| 1.86 | | |
| 1.82 | | |
| 2.04 | |
| Leverage expenses | |
| 0.73 | | |
| 0.84 | | |
| 0.31 | | |
| 0.13 | | |
| 0.23 | | |
| 0.36 | |
| Income tax expense (benefit)(6) | |
| — | | |
| (0.02 | ) | |
| (0.03 | ) | |
| (0.03 | ) | |
| 0.28 | | |
| (0.24 | ) |
| Total expenses | |
| 2.58 | % | |
| 2.65 | % | |
| 2.17 | % | |
| 1.96 | % | |
| 2.33 | % | |
| 2.16 | % |
See accompanying Notes to Financial Statements.
2024 Semi-Annual Report | May 31, 2024
| | |
Six
Months
Ended May 31,
2024 | | |
Year
Ended
November 30,
2023 | | |
Year
Ended
November 30,
2022 | | |
Year
Ended
November 30,
2021 | | |
Year
Ended
November 30,
2020 | | |
Period
From
March 29, 2019(1)
through
November 30,
2019 | |
| | |
(unaudited) | | |
| | |
| | |
| | |
| | |
| |
| Ratio of net investment income to average net assets before fee waiver(5) | |
| 2.83 | % | |
| 2.44 | % | |
| 2.62 | % | |
| 3.20 | % | |
| 3.16 | % | |
| 2.15 | % |
| Ratio of net investment income to average net assets after fee waiver(5) | |
| 2.83 | % | |
| 2.44 | % | |
| 2.62 | % | |
| 3.20 | % | |
| 3.26 | % | |
| 2.43 | % |
| Portfolio turnover rate | |
| 15.33 | % | |
| 23.23 | % | |
| 18.08 | % | |
| 68.31 | % | |
| 73.22 | % | |
| 50.44 | % |
| Credit facility borrowings, end of period (000’s) | |
$ | 20,900 | | |
$ | 24,000 | | |
$ | 29,500 | | |
$ | 21,600 | | |
$ | 31,100 | | |
$ | 32,000 | |
| Asset coverage, per $1,000 of principal amount of senior notes and credit facility
borrowings(7) | |
$ | 10,582 | | |
$ | 9,344 | | |
$ | 8,490 | | |
$ | 11,712 | | |
$ | 7,875 | | |
$ | 8,421 | |
| Asset coverage ratio of senior notes and credit facility borrowings(7) | |
| 1,058 | % | |
| 934 | % | |
| 849 | % | |
| 1,171 | % | |
| 788 | % | |
| 842 | % |
| (1) |
Commencement of operations. |
| (2) |
Information presented relates to a share of common stock outstanding for the entire period. |
| (3) |
Not annualized for period less than one year. |
| (4) |
Total investment return is calculated assuming a purchase of common stock at the beginning of the period and a sale at the closing
price on the last day of the period reported (excluding brokerage commissions). The calculation also assumes reinvestment of distributions
at actual prices pursuant to TEAF’s dividend reinvestment plan. |
| (5) |
Annualized for period less than one year. |
| (6) |
For the period December 1, 2023 through May 31, 2024, TEAF did not accrue net deferred income tax expense. For the year ended
November 30, 2023 TEAF accrued $51,306 for net deferred income tax benefit. For the year ended November 30, 2022 TEAF accrued $57,377
for net deferred income tax benefit. For the year ended November 31, 2021, TEAF accrued $67,015 for net deferred income tax expense.
For the year ended November 30, 2020, TEAF accrued $594,668 for net deferred income tax expense. For the period ended November 30,
2019, TEAF accrued $418,970 for net deferred income tax benefit. |
| (7) |
Represents value of total assets less all liabilities and indebtedness not represented by margin facility borrowings at the end
of the period divided by margin facility borrowings outstanding at the end of the period. |
See accompanying Notes to Financial Statements.
Notes to Financial Statements
(unaudited)
May 31, 2024
1. General Organization
This report covers the following companies, each of
which is listed on the New York Stock Exchange (“NYSE”): Tortoise Energy Infrastructure Corp. (“TYG”), Tortoise
Midstream Energy Fund, Inc. (“NTG”), Tortoise Pipeline & Energy Fund, Inc. (“TTP”), Tortoise Energy Independence
Fund, Inc. (“NDP”), Tortoise Power and Energy Infrastructure Fund, Inc. (“TPZ”), and Ecofin Sustainable and Social
Impact Term Fund (“TEAF”). These companies are individually referred to as a “Fund” or by their respective NYSE
symbols, or collectively as the “Funds”, and each is a non-diversified, closed-end management investment company under the
Investment Company Act of 1940, as amended (the “1940 Act”). Each of TYG, NTG, TTP, NDP and TEAF has a primary investment
objective to seek a high level of total return with an emphasis on current distributions. TPZ has a primary investment objective to provide
a high level of current income, with a secondary objective of capital appreciation.
2. Significant Accounting Policies
The Funds are investment companies and follow accounting
and reporting guidance under Financial Accounting Standards Board Accounting Standards Codification (“ASC”) Topic 946, “Financial
Services-Investment Companies.” The following is a summary of significant accounting policies followed by the Fund in the preparation
of its financial statements. These policies are in conformity with generally accepted accounting principles in the United States of America
(“GAAP”).
A. Use of Estimates
The preparation of financial statements in conformity
with U.S. generally accepted accounting principles (“GAAP”) requires management to make estimates and assumptions that affect
the reported amount of assets and liabilities and disclosure of contingent assets and liabilities as of the date of the financial statements,
and the amount of income and expenses during the period reported. Actual results could differ from those estimates.
B. Security Valuation
In general, and where applicable, the Funds use readily
available market quotations based upon the last updated sales price from the principal market to determine fair value. The Funds primarily
own securities that are listed on a securities exchange or are traded in the over-the-counter market. The Funds value those securities
at their last sale price on that exchange or over-the-counter market on the valuation date. If the security is listed on more than one
exchange, the Funds use the price from the exchange that it considers to be the principal exchange on which the security is traded. If
there has been no sale on such exchange or over-the-counter market on such day, the security is valued at the mean between the last bid
price and last ask price on such day. Securities listed on the NASDAQ are valued at the NASDAQ Official Closing Price, which may not necessarily
represent the last sale price. These securities are categorized as Level 1 in the fair value hierarchy.
Restricted securities are subject to statutory or contractual
restrictions on their public resale, which may make it more difficult to obtain a valuation and may limit a Fund’s ability to dispose
of them. Investments in private placement securities and other securities for which market quotations are not readily available are valued
in good faith by using fair value procedures. Such fair value procedures consider factors such as discounts to publicly traded issues,
time until conversion date, securities with similar yields, quality, type of issue, coupon, duration and rating. If events occur that
affect the value of a Fund’s portfolio securities before the net asset value has been calculated (a “significant event”),
the portfolio securities so affected are generally priced using fair value procedures.
An equity security of a publicly traded company acquired
in a private placement transaction without registration under the Securities Act of 1933, as amended (the “1933 Act”), is
subject to restrictions on resale that can affect the security’s liquidity and fair value. If such a security is convertible into
publicly traded common shares, the security generally will be valued at the common share market price adjusted by a percentage discount
due to the restrictions and categorized as Level 2 in the fair value hierarchy. To the extent that such securities are convertible or
otherwise become freely tradable within a time frame that may be reasonably determined, an amortization schedule may be used to determine
the discount. If the security has characteristics that are dissimilar to the class of security that trades on the open market, the security
will generally be valued and categorized as Level 3 in the fair value hierarchy.
Unobservable inputs are used to measure fair value
to the extent that observable inputs are not available, thereby allowing for situations in which there is little, if any, market activity.
Unobservable inputs reflect the Funds’ own beliefs about the assumptions that market participants would use in pricing the asset
or liability (including assumptions about risk). Unobservable inputs are developed based on the best information available in the circumstances,
which might include the Fund’s own data. The Fund’s own data are adjusted if information is reasonably available without undue
cost and effort that indicates that market participants would use different assumptions. Due to the inherent uncertainty of valuations
of such investments, the fair values may differ significantly from the values that would have been used had an active market existed.
Options (including options on futures contracts) and
futures contracts are valued using readily available market quotations. Exchange-traded options are valued at the last reported sale price
on any exchange on which they trade. If there are no sales reported on any exchange, exchange-traded options shall be valued at the mean
between the last highest bid and last lowest asked prices obtained as of the closing of the exchanges on which the option is traded. Exchange-traded
domestic futures contracts are valued at the last reported sale price on the Chicago Mercantile Exchange. Exchange-traded foreign futures
contracts are valued at the last reported sale price on the primary foreign exchange on which they principally trade. The value of Flexible
Exchange Options (FLEX Options) are determined (i) by an evaluated price as determined by a third-party valuation service; or (ii) by
using a quotation provided by a broker-dealer.
2024 Semi-Annual Report | May 31, 2024
Notes to Financial Statements (unaudited)
(continued)
The Funds generally value debt securities at evaluated
prices obtained from an independent third-party valuation service that utilizes a pricing matrix based upon yield data for securities
with similar characteristics, or based on a direct written broker-dealer quotation from a dealer who has made a market in the security.
Debt securities with 60 days or less to maturity at time of purchase are valued on the basis of amortized cost, which approximates fair
value. The securities are categorized as level 2 in the fair value hierarchy.
Interest rate swap contracts are valued by using industry-accepted
models, which discount the estimated future cash flows based on a forward rate curve and the stated terms of the interest rate swap agreement
by using interest rates currently available in the market, or based on dealer quotations, if available, and are categorized as Level 2
in the fair value hierarchy.
Various inputs are used in determining the fair value
of the Funds’ investments and financial instruments. These inputs are summarized in the three broad levels listed below:
Level 1 — quoted prices in active markets for
identical investments
Level 2 — other significant observable inputs
(including quoted prices for similar investments, market corroborated inputs, etc.)
Level 3 — significant unobservable inputs (including
a Fund’s own assumptions in determining the fair value of investments)
The inputs or methodologies used for valuing securities
are not necessarily an indication of the risk associated with investing in those securities.
The following tables provide the fair value
measurements of applicable assets and liabilities by level within the fair value hierarchy as of May 31, 2024. These assets and liabilities
are measured on a recurring basis.
| TYG: | |
| | |
| | |
| | |
| |
| Description | |
Level 1 | | |
Level 2 | | |
Level 3 | | |
Total | |
| Assets | |
| | | |
| | | |
| | | |
| | |
| Investments: | |
| | | |
| | | |
| | | |
| | |
| Common Stock(a) | |
$ | 427,134,354 | | |
$ | — | | |
$ | — | | |
$ | 427,134,354 | |
| Master Limited Partnerships(a) | |
| 110,535,419 | | |
| — | | |
| — | | |
| 110,535,419 | |
| Private Investment(a) | |
| — | | |
| — | | |
| 10,400,393 | | |
| 10,400,393 | |
| Preferred Stock(a) | |
| — | | |
| 5,044,684 | | |
| — | | |
| 5,044,684 | |
| Short-Term Investment(b) | |
| 638,974 | | |
| — | | |
| — | | |
| 638,974 | |
| Total Assets | |
$ | 538,308,747 | | |
$ | 5,044,684 | | |
$ | 10,400,393 | | |
$ | 553,753,824 | |
| | |
| | | |
| | | |
| | | |
| | |
| NTG: | |
| | | |
| | | |
| | | |
| | |
| Description | |
Level 1 | | |
Level 2 | | |
Level 3 | | |
Total | |
| Assets | |
| | | |
| | | |
| | | |
| | |
| Investments: | |
| | | |
| | | |
| | | |
| | |
| Common Stock(a) | |
$ | 232,393,110 | | |
$ | — | | |
$ | — | | |
$ | 232,393,110 | |
| Master Limited Partnerships(a) | |
| 67,846,541 | | |
| — | | |
| — | | |
| 67,846,541 | |
| Preferred Stock(a) | |
| — | | |
| 3,363,123 | | |
| — | | |
| 3,363,123 | |
| Short-Term Investment(b) | |
| 465,124 | | |
| — | | |
| — | | |
| 465,124 | |
| Total Assets | |
$ | 300,704,775 | | |
$ | 3,363,123 | | |
$ | — | | |
$ | 304,067,898 | |
| | |
| | | |
| | | |
| | | |
| | |
| TTP: | |
| | | |
| | | |
| | | |
| | |
| Description | |
Level 1 | | |
Level 2 | | |
Level 3 | | |
Total | |
| Assets | |
| | | |
| | | |
| | | |
| | |
| Investments: | |
| | | |
| | | |
| | | |
| | |
| Common Stock(a) | |
$ | 78,114,107 | | |
$ | — | | |
$ | — | | |
$ | 78,114,107 | |
| Master Limited Partnerships(a) | |
| 17,736,298 | | |
| — | | |
| — | | |
| 17,736,298 | |
| Short-Term Investment(b) | |
| 356,578 | | |
| — | | |
| — | | |
| 356,578 | |
| Total Assets | |
$ | 96,206,983 | | |
$ | — | | |
$ | — | | |
$ | 96,206,983 | |
| | |
| | | |
| | | |
| | | |
| | |
| NDP: | |
| | | |
| | | |
| | | |
| | |
| Description | |
Level 1 | | |
Level 2 | | |
Level 3 | | |
Total | |
| Assets | |
| | | |
| | | |
| | | |
| | |
| Investments: | |
| | | |
| | | |
| | | |
| | |
| Common Stock(a) | |
$ | 61,792,907 | | |
$ | — | | |
$ | — | | |
$ | 61,792,907 | |
| Master Limited Partnerships(a) | |
| 14,129,453 | | |
| — | | |
| — | | |
| 14,129,453 | |
| Short-Term Investment(b) | |
| 320,012 | | |
| — | | |
| — | | |
| 320,012 | |
| Total Assets | |
$ | 76,242,372 | | |
$ | — | | |
$ | — | | |
$ | 76,242,372 | |
Notes to Financial Statements (unaudited)
(continued)
| TPZ: | |
| | |
| | |
| | |
| |
| Description | |
Level
1 | | |
Level
2 | | |
Level
3 | | |
Total | |
| Assets | |
| | | |
| | | |
| | | |
| | |
| Investments: | |
| | | |
| | | |
| | | |
| | |
| Corporate Bonds(a) | |
$ | — | | |
$ | 58,794,380 | | |
$ | — | | |
$ | 58,794,380 | |
| Common Stock(a) | |
| 42,887,975 | | |
| — | | |
| — | | |
| 42,887,975 | |
| Master Limited Partnerships(a) | |
| 25,783,462 | | |
| — | | |
| — | | |
| 25,783,462 | |
| Short-Term Investment(b) | |
| 380,729 | | |
| — | | |
| — | | |
| 380,729 | |
| Total Assets | |
$ | 69,052,116 | | |
$ | 58,794,380 | | |
$ | — | | |
$ | 127,846,546 | |
| | |
| | | |
| | | |
| | | |
| | |
| TEAF: | |
| | | |
| | | |
| | | |
| | |
| Description | |
Level
1 | | |
Level
2 | | |
Level
3 | | |
Total | |
| Assets | |
| | | |
| | | |
| | | |
| | |
| Investments: | |
| | | |
| | | |
| | | |
| | |
| Common Stock(a) | |
$ | 90,235,984 | | |
$ | — | | |
$ | — | | |
$ | 90,235,984 | |
| Private Investments(a) | |
| — | | |
| 1,549,082 | | |
| 48,421,740 | | |
| 49,970,822 | |
| Corporate Bonds(a) | |
| — | | |
| 15,647,577 | | |
| 317,754 | | |
| 15,965,331 | |
| Municipal Bonds(a) | |
| — | | |
| 36,367,748 | | |
| 1,560,000 | | |
| 37,927,748 | |
| Master Limited Partnerships(a) | |
| 11,579,459 | | |
| — | | |
| — | | |
| 11,579,459 | |
| Private Notes(a) | |
| — | | |
| — | | |
| 13,464,864 | | |
| 13,464,864 | |
| Rights(a) | |
| 218,773 | | |
| — | | |
| — | | |
| 218,773 | |
| Short-Term Investment(b) | |
| 442,783 | | |
| — | | |
| — | | |
| 442,783 | |
| Total Assets | |
$ | 102,476,999 | | |
$ | 53,564,407 | | |
$ | 63,764,358 | | |
$ | 219,805,764 | |
(a) All other industry classifications are identified
in the Schedule of Investments.
(b) Short-term investment is a sweep investment for
cash balances.
The following tables present each Fund’s assets
measured at fair value on a recurring basis using significant unobservable inputs (Level 3) for the period ended May 31, 2024:
| | |
| | |
| | |
| | |
| | |
| | |
| |
| Preferred
Stock | |
TYG | | |
NTG | | |
TTP | | |
NDP | | |
TPZ | | |
TEAF | |
| Balance — beginning of period | |
$ | — | | |
$ | — | | |
$ | — | | |
$ | — | | |
$ | — | | |
$ | 4,769,400 | |
| Purchases | |
| — | | |
| — | | |
| — | | |
| — | | |
| — | | |
| — | |
| Return of capital | |
| — | | |
| — | | |
| — | | |
| — | | |
| — | | |
| — | |
| Sales | |
| — | | |
| — | | |
| — | | |
| — | | |
| — | | |
| (4,850,000 | ) |
| Total realized gain/loss | |
| — | | |
| — | | |
| — | | |
| — | | |
| — | | |
| (728,732 | ) |
| Change in unrealized gain/loss | |
| — | | |
| — | | |
| — | | |
| — | | |
| — | | |
| 809,332 | |
| Balance — end of period | |
$ | — | | |
$ | — | | |
$ | — | | |
$ | — | | |
$ | — | | |
$ | — | |
| | |
| | | |
| | | |
| | | |
| | | |
| | | |
| | |
| Private
Investments | |
| TYG | | |
| NTG | | |
| TTP | | |
| NDP | | |
| TPZ | | |
| TEAF | |
| Balance — beginning of period | |
$ | 14,550,615 | | |
$ | — | | |
$ | — | | |
$ | — | | |
$ | — | | |
$ | 50,403,458 | |
| Purchases | |
| — | | |
| — | | |
| — | | |
| — | | |
| — | | |
| 103,483 | |
| Return of capital | |
| — | | |
| — | | |
| — | | |
| — | | |
| — | | |
| — | |
| Sales | |
| — | | |
| — | | |
| — | | |
| — | | |
| — | | |
| — | |
| Total realized gain/loss | |
| — | | |
| — | | |
| — | | |
| — | | |
| — | | |
| — | |
| Change in unrealized gain/loss | |
| (4,150,222 | ) | |
| — | | |
| — | | |
| — | | |
| — | | |
| (2,085,201 | ) |
| Balance — end of period | |
$ | 10,400,393 | | |
$ | — | | |
$ | — | | |
$ | — | | |
$ | — | | |
$ | 48,421,740 | |
2024 Semi-Annual Report | May 31, 2024
Notes to Financial Statements (unaudited)
(continued)
| Bank
Loan | |
TYG | | |
NTG | | |
TTP | | |
NDP | | |
TPZ | | |
TEAF | |
| Balance — beginning of period | |
$ | — | | |
$ | — | | |
$ | — | | |
$ | — | | |
$ | — | | |
$ | 503,725 | |
| Transfers into level 3 | |
| — | | |
| — | | |
| — | | |
| — | | |
| — | | |
| — | |
| Purchases | |
| — | | |
| — | | |
| — | | |
| — | | |
| — | | |
| — | |
| Return of capital | |
| — | | |
| — | | |
| — | | |
| — | | |
| — | | |
| — | |
| Sales | |
| — | | |
| — | | |
| — | | |
| — | | |
| — | | |
| (438,049 | ) |
| Total realized gain/loss | |
| — | | |
| — | | |
| — | | |
| — | | |
| — | | |
| (361,951 | ) |
| Change in unrealized gain/loss | |
| — | | |
| — | | |
| — | | |
| — | | |
| — | | |
| 296,275 | |
| Balance — end of period | |
$ | — | | |
$ | — | | |
$ | — | | |
$ | — | | |
$ | — | | |
$ | — | |
| | |
| | | |
| | | |
| | | |
| | | |
| | | |
| | |
| Corporate
Bond | |
| TYG | | |
| NTG | | |
| TTP | | |
| NDP | | |
| TPZ | | |
| TEAF | |
| Balance — beginning of period | |
$ | — | | |
$ | — | | |
$ | — | | |
$ | — | | |
$ | — | | |
$ | 3,976,106 | |
| Transfers into level 3 | |
| — | | |
| — | | |
| — | | |
| — | | |
| — | | |
| — | |
| Purchases | |
| — | | |
| — | | |
| — | | |
| — | | |
| — | | |
| — | |
| Return of capital | |
| — | | |
| — | | |
| — | | |
| — | | |
| — | | |
| — | |
| Sales | |
| — | | |
| — | | |
| — | | |
| — | | |
| — | | |
| — | |
| Total realized gain/loss | |
| — | | |
| — | | |
| — | | |
| — | | |
| — | | |
| — | |
| Change in unrealized gain/loss | |
| — | | |
| — | | |
| — | | |
| — | | |
| — | | |
| (3,658,352 | ) |
| Balance — end of period | |
$ | — | | |
$ | — | | |
$ | — | | |
$ | — | | |
$ | — | | |
$ | 317,754 | |
| | |
| | | |
| | | |
| | | |
| | | |
| | | |
| | |
| Municipal
Bond | |
| TYG | | |
| NTG | | |
| TTP | | |
| NDP | | |
| TPZ | | |
| TEAF | |
| Balance — beginning of period | |
$ | — | | |
$ | — | | |
$ | — | | |
$ | — | | |
$ | — | | |
$ | — | |
| Transfers into level 3 | |
| — | | |
| — | | |
| — | | |
| — | | |
| — | | |
| — | |
| Purchases | |
| — | | |
| — | | |
| — | | |
| — | | |
| — | | |
| 1,560,000 | |
| Return of capital | |
| — | | |
| — | | |
| — | | |
| — | | |
| — | | |
| — | |
| Sales | |
| — | | |
| — | | |
| — | | |
| — | | |
| — | | |
| — | |
| Total realized gain/loss | |
| — | | |
| — | | |
| — | | |
| — | | |
| — | | |
| — | |
| Change in unrealized gain/loss | |
| — | | |
| — | | |
| — | | |
| — | | |
| — | | |
| — | |
| Balance — end of period | |
$ | — | | |
$ | — | | |
$ | — | | |
$ | — | | |
$ | — | | |
$ | 1,560,000 | |
| | |
| | | |
| | | |
| | | |
| | | |
| | | |
| | |
| Private
Notes | |
| TYG | | |
| NTG | | |
| TTP | | |
| NDP | | |
| TPZ | | |
| TEAF | |
| Balance — beginning of period | |
$ | — | | |
$ | — | | |
$ | — | | |
$ | — | | |
$ | — | | |
$ | 13,441,698 | |
| Purchases | |
| — | | |
| — | | |
| — | | |
| — | | |
| — | | |
| — | |
| Return of capital | |
| — | | |
| — | | |
| — | | |
| — | | |
| — | | |
| — | |
| Sales | |
| — | | |
| — | | |
| — | | |
| — | | |
| — | | |
| — | |
| Total realized gain/loss | |
| — | | |
| — | | |
| — | | |
| — | | |
| — | | |
| — | |
| Change in unrealized gain/loss | |
| — | | |
| — | | |
| — | | |
| — | | |
| — | | |
| 23,166 | |
| Balance — end of period | |
$ | — | | |
$ | — | | |
$ | — | | |
$ | — | | |
$ | — | | |
$ | 13,464,864 | |
| | |
| | | |
| | | |
| | | |
| | | |
| | | |
| | |
| | |
| TYG | | |
| NTG | | |
| TTP | | |
| NDP | | |
| TPZ | | |
| TEAF | |
| Change in unrealized gain/loss on investments still held at May 31, 2024 | |
$ | (4,150,222 | ) | |
$ | — | | |
$ | — | | |
$ | — | | |
$ | — | | |
$ | (4,614,780 | ) |
TEAF owns units of preferred stock of One Energy Enterprises
Inc. (“One Energy Pfd”) that were issued in a transaction that closed on April 12, 2023. One Energy Enterprises Inc. is a
private company. The preferred stock carries a conversion option into common stock on and after the earlier to occur of (i) the closing
of a DeSPAC, (ii) the consummation of an IPO or (iii) the effectiveness of a direct listing in which the Common Stock becomes listed on
a national securities exchange (such date the “Initial Liquidity Date”). A discounted cash flow model prepared by an independent
third party is being used to determine fair value of the One Energy Pfd security. Unobservable inputs used to determine the discount rate
include a debt discount rate that generally reflects the credit worthiness of the company. An increase (decrease) in the debt discount
rate would lead to a corresponding decrease (increase) in fair value of the preferred stock.
TEAF owns units of Mexico Pacific Limited LLC (“MPL”),
which was issued in a private transaction that closed on October 23, 2019. As of November 30, 2023, the investment in MPL was valued at
the most recent transaction price, which was a capital raise that closed on September 30, 2021, as the company is still in development
with no day-to-day operations.
Notes to Financial Statements (unaudited)
(continued)
TEAF owns a private note in Saturn Solar Bermuda 1,
Ltd (“Saturn”). Under the terms of the note, Saturn pays interest monthly at an annual rate of 10%. A discounted cash flows
model is being utilized to determine fair value of the private note. Unobservable inputs used to determine the discount rate include a
risk spread based on similar projects and an illiquidity spread due to the note being issued in the private market. An increase (decrease)
in the risk spread or illiquidity spread would lead to a corresponding decrease (increase) in fair value of the note.
TEAF owns a note in EF WWW Holdings, LLC, for debt
funding of World Water Works Holdings, Inc. Under the terms of the note, EF WWW Holdings pays interest monthly at an annual rate of 10.50%.
A discounted cash flows model is being utilized to determine fair value of the private note. Unobservable inputs used to determine the
discount rate include a risk spread based on similar projects and an illiquidity spread due to the note being issued in the private market.
An increase (decrease) in the risk spread or illiquidity spread would lead to a corresponding decrease (increase) in fair value of the
note.
TYG wholly-owns private investments in TK NYS Solar
Holdco, LLC and TEAF wholly-owns private investments in Renewable Holdco, LLC, Renewable Holdco I, LLC, and Renewable Holdco II, LLC.
Discounted cash flow models are being utilized to determine the fair value of these holdings. Unobservable inputs used within the discounted
cash flow models include weighted average cost of capital. An increase (decrease) in the weighted average cost of capital would lead to
a corresponding decrease (increase) in the fair value of the private investment.
TEAF owns a private corporate bond in Contour Propco.
A discounted cash flows model is being utilized to determine fair value of the private bond. Unobservable inputs used to determine the
discount rate include a risk spread based on similar projects and an illiquidity spread due to the bond being issued in the private market.
An increase (decrease) in the risk spread or illiquidity spread would lead to a corresponding decrease (increase) in fair value of the
bond.
TEAF owns a municipal bond in Ohio Public Finance Authority,
12.00%, 12/15/2053, Obligor Heart of America Classical Foundation, which was issued in a private transaction that closed on May 30, 2024.
As of May 31, 2024, the investment in the private municipal bond was valued at the most recent transaction price, and thus held at cost.
The following tables summarize the fair value and significant
unobservable inputs that each Fund used to value its portfolio investments categorized as Level 3 as of May 31, 2024:
| Assets
at Fair Value | |
TYG | | |
NTG | | |
TTP | | |
NDP | | |
TPZ | | |
TEAF | |
| Private Notes | |
$ | — | | |
$ | — | | |
$ | — | | |
$ | — | | |
$ | — | | |
$ | 13,464,864 | |
| Corporate Bonds | |
$ | — | | |
$ | — | | |
$ | — | | |
$ | — | | |
$ | — | | |
$ | 317,754 | |
| Municipal Bonds | |
$ | — | | |
$ | — | | |
$ | — | | |
$ | — | | |
$ | — | | |
$ | 1,560,000 | |
| Private Investments | |
$ | 10,400,393 | | |
$ | — | | |
$ | — | | |
$ | — | | |
$ | — | | |
$ | 48,421,740 | |
| Assets at Fair Value | |
Valuation Technique | |
Unobservable Inputs | |
Input | |
| Private Investment (One Energy Pfd) | |
Lattice model | |
Debt discount rate | |
| 31.7 | % |
| Private Investment (TK NYS Solar Holdco, LLC) | |
Discounted cash flow model | |
Post-contracted weighted average cost of capital | |
| 8.70 | % |
| Private Investment (TK NYS Solar Holdco, LLC) | |
Discounted cash flow model | |
Contracted weighted average cost of capital | |
| 7.80% - 7.90 | % |
| Private Investment (Mexico Pacific Limited) | |
Recent transaction | |
Purchase price | |
$ | 21.94 | |
| Private Investment (Renewable Holdco, LLC) | |
Recent transaction | |
Purchase price | |
$ | 6,892,925 | |
| Private Investment (Renewable Holdco I, LLC) | |
Discounted cash flow model | |
Contracted weighted average cost of capital | |
| 7.70% - 8.50 | % |
| Private Investment (Renewable Holdco I, LLC) | |
Discounted cash flow model | |
Post-contracted weighted average cost of capital | |
| 8.70 | % |
| Private Investment (Renewable Holdco II, LLC) | |
Discounted cash flow model | |
Contracted weighted average cost of capital | |
| 7.80 | % |
| Private Investment (Renewable Holdco II, LLC) | |
Discounted cash flow model | |
Post-contracted weighted average cost of capital | |
| 8.70 | % |
| Saturn Bermuda Note | |
Discounted cash flow model | |
Risk spread | |
| 1.7500 | % |
| Saturn Bermuda Note | |
Discounted cash flow model | |
Illiquidity spread | |
| 1.7255 | % |
| EF WWW Holdings Note | |
Market Approach | |
Pending Sale Price | |
$ | 102.00 | |
| Contour Propco | |
Income Approach | |
Discount Rate | |
| 17.00 | % |
| | |
Market Approach | |
Pending Sale Price | |
$ | 653,050 | |
| Heart of Ohio Classical Academy Series 2024B | |
Recent transaction | |
Purchase price | |
$ | 100.00 | |
C. Securities Transactions and Investment Income
Securities transactions are accounted for on the date
the securities are purchased or sold (trade date). Realized gains and losses are reported on an identified cost basis. Interest income
is recognized on the accrual basis, including amortization of premiums and accretion of discounts. Discounts and premiums on fixed income
securities are amortized or accreted over the life of the respective securities using the effective interest method. Dividend income and
distributions are recorded on the ex-dividend date. Distributions received from investments generally are comprised of ordinary income
and return of capital. The Funds estimate the allocation of distributions between investment income and return of capital at the time
such distributions are received based on historical information or regulatory filings. These estimates may subsequently be revised based
on actual allocations received from the portfolio companies after their tax reporting periods are concluded, as the actual character of
these distributions is not known until after the fiscal year-end of the Funds.
2024 Semi-Annual Report | May 31, 2024
Notes to Financial Statements (unaudited)
(continued)
Subsequent to November 30, 2023, the Funds reallocated
the amount of return of capital recognized for the period from December 1, 2022 through November 30, 2023 based on the 2023 tax reporting
information received. The impact of this reclass is as follows:
| | |
Estimated
Return
of Capital % | |
Revised
Return
of Capital % | |
Increase/(Decrease)
in Return of Capital |
| TYG | |
| 48 | % | |
| 51 | % | |
$ | 814,394 | |
| NTG | |
| 52 | % | |
| 57 | % | |
$ | 855,789 | |
| TTP | |
| 53 | % | |
| 51 | % | |
$ | (100,821 | ) |
| NDP | |
| 32 | % | |
| 36 | % | |
$ | 137,444 | |
| TPZ | |
| 72 | % | |
| 69 | % | |
$ | (115,875 | ) |
| TEAF | |
| 37 | % | |
| 37 | % | |
$ | (2,281 | ) |
In addition, the Funds may be subject to withholding
taxes on foreign-sourced income. The Funds accrue such taxes when the related income is earned in accordance with the Funds’ understanding
of the applicable country’s tax rules and rates.
D. Foreign Currency Translation
For foreign currency, investments in foreign securities,
and other assets and liabilities denominated in a foreign currency, the Funds translate these amounts into U.S. dollars on the following
basis: (i) market value of investment securities, assets and liabilities at the current rate of exchange on the valuation date, and (ii)
purchases and sales of investment securities, income and expenses at the relevant rates of exchange on the respective dates of such transactions.
The Funds do not isolate the portion of gains and losses on investments that is due to changes in the foreign exchange rates from that
which is due to changes in market prices of securities.
E. Federal and State Income Taxation
The Funds each qualify as a regulated investment company
(“RIC”) under the Internal Revenue Code (“IRC”). As a result, the Funds generally will not be subject to U.S.
federal income tax on income and gains that they distribute each taxable year to stockholders if they meet certain minimum distribution
requirements. However, TEAF’s taxable subsidiary, created to hold certain investments is generally subject to federal and state
income taxes on its income. RICs are required to distribute substantially all of their income, in addition to meeting certain asset diversification
requirements, and are subject to a 4% non-deductible U.S. federal excise tax on certain undistributed income unless the fund makes sufficient
distributions to satisfy the excise tax avoidance requirement.
The Funds recognize the tax benefits of uncertain tax
positions only when the position is “more likely than not” to be sustained upon examination by the tax authorities based on
the technical merits of the tax position. The Funds’ policy is to record interest and penalties on uncertain tax positions as part
of tax expense.
As of May 31, the Funds had no uncertain tax positions,
and no penalties or interest was accrued. The Funds do not expect any change in their unrecognized tax positions in the next twelve months.
The tax years ended November 30, 2020 through 2023 remain open to examination by federal and state tax authorities.
F. Distributions to Stockholders
Distributions to common stockholders are recorded on
the ex-dividend date. The Funds may not declare or pay distributions to its common stockholders if it does not meet asset coverage ratios
required under the 1940 Act or the rating agency guidelines for its debt and preferred stock following such distribution. The amount of
any distributions will be determined by the Board of Directors. The character of distributions to common stockholders made during the
year may differ from their ultimate characterization for federal income tax purposes.
As RICs, the Funds each intend to make cash distributions
of its investment company taxable income and capital gains to common stockholders. In addition, on an annual basis, the Funds each may
distribute additional capital gains in the last calendar quarter if necessary to meet minimum distribution requirements and thus avoid
being subject to excise taxes. Distributions paid to stockholders in excess of investment company taxable income and net realized gains
will be treated as return of capital to stockholders.
Distributions to mandatory redeemable preferred (“MRP”)
stockholders are accrued daily based on applicable distribution rates for each series and paid periodically according to the terms of
the agreements. The Funds may not declare or pay distributions to its preferred stockholders if it does not meet a 200% asset coverage
ratio for its debt or the rating agency basic maintenance amount for the debt following such distribution. The character of distributions
to preferred stockholders made during the year may differ from their ultimate characterization for federal income tax purposes.
Notes to Financial Statements (unaudited)
(continued)
Distributions to stockholders for the year ended November
30, 2023 were characterized as follows:
| | |
TYG | |
NTG | |
TTP | |
NDP | |
TPZ | |
TEAF |
| | |
Common | |
Preferred | |
Common | |
Preferred | |
Common | |
Preferred | |
Common | |
Common | |
Common |
| Qualified dividend income | |
| 40 | % | |
| 70 | % | |
| 46 | % | |
| 86 | % | |
| 22 | % | |
| 100 | % | |
| 30 | % | |
| 16 | % | |
| 31 | % |
| Ordinary dividend income | |
| 18 | % | |
| 30 | % | |
| 7 | % | |
| 14 | % | |
| — | | |
| — | | |
| — | | |
| 33 | % | |
| 2 | % |
| Return of capital | |
| 42 | % | |
| — | | |
| 47 | % | |
| — | | |
| 78 | % | |
| 0 | % | |
| 70 | % | |
| 51 | % | |
| 67 | % |
| Long-term capital gain | |
| — | | |
| — | | |
| — | | |
| — | | |
| — | | |
| — | | |
| — | | |
| — | | |
| — | |
* For Federal income tax purposes, distributions of
short-term capital gains are included in qualified dividend income.
G. Offering and Debt Issuance Costs
Offering costs related to the issuance of common stock
are charged to additional paid-in capital when the stock is issued. Debt issuance costs related to senior notes and MRP Stock are deferred
and amortized over the period the debt or MRP Stock is outstanding.
There were no offering or debt issuance costs recorded
during the period December 1, 2023 through May 31, 2024 for TYG, NTG, TTP, NDP, TPZ or TEAF.
H. Derivative Financial Instruments
The Funds have established policies and procedures
for risk assessment and the approval, reporting and monitoring of derivative financial instrument activities. The Funds do not hold or
issue derivative financial instruments for speculative purposes. All derivative financial instruments are recorded at fair value with
changes in fair value during the reporting period, and amounts accrued under the agreements, included as unrealized gains or losses in
the accompanying Statements of Operations. Derivative instruments that are subject to an enforceable master netting arrangement allow
a Fund and the counterparty to the instrument to offset any exposure to the other party with amounts owed to the other party. The fair
value of derivative financial instruments in a loss position are offset against the fair value of derivative financial instruments in
a gain position, with the net fair value appropriately reflected as an asset or liability within the accompanying Statements of Assets
& Liabilities.
TYG, NTG, TTP, NDP and TEAF may seek to provide current
income from gains earned through an option strategy that normally consists of writing (selling) call options on selected equity securities
held in the portfolio (“covered calls”). The premium received on a written call option is initially recorded as a liability
and subsequently adjusted to the then current fair value of the option written. Premiums received from writing call options that expire
unexercised are recorded as a realized gain on the expiration date. Premiums received from writing call options that are exercised are
added to the proceeds from the sale of the underlying security to calculate the realized gain (loss). If a written call option is repurchased
prior to its exercise, the realized gain (loss) is the difference between the premium received and the amount paid to repurchase the option.
TEAF may enter into forward currency contracts, which
represent agreements to exchange currencies on specific future dates at predetermined rates. TEAF uses forward currency contracts to manage
exposure to changes in exchange rates. On a daily basis, TEAF’s investment adviser values forward currency contracts and records
unrealized appreciation or depreciation for open forward currency contracts in the Statements of Assets & Liabilities. Realized gains
or losses are recorded at the time the forward currency contracts are closed. TEAF did not enter into any forward currency contracts during
the period ended May 31, 2024.
I. Indemnifications
Under each of the Funds’ organizational documents,
its officers and directors are indemnified against certain liabilities arising out of the performance of their duties to the Funds. In
addition, in the normal course of business, the Funds may enter into contracts that provide general indemnification to other parties.
A Fund’s maximum exposure under these arrangements is unknown, as this would involve future claims that may be made against the
Funds that have not yet occurred, and may not occur. However, the Funds have not had prior claims or losses pursuant to these contracts
and expect the risk of loss to be remote.
J. Cash and Cash Equivalents
Cash and cash equivalents include short-term, liquid
investments with an original maturity of three months or less and money market fund accounts.
2024 Semi-Annual Report | May 31, 2024
Notes to Financial Statements (unaudited)
(continued)
K. Recent Accounting and Regulatory Updates
In March 2020, the Financial Accounting Standards Board
(“FASB”) issued Accounting Standards Update (“ASU”) No. 2020-04 Reference Rate Reform (Topic 848); Facilitation
of the Effects of Reference Rate Reform on Financial Reporting, which provides optional guidance for a limited period of time to ease
the potential burden in accounting for (or recognizing the effects of) reference rate reform. The guidance is applicable to contracts
referencing London Interbank Offered Rate (“LIBOR”) or another reference rate that is expected to be discontinued due to reference
rate reform. The original guidance and the scope clarification become effective upon issuance in March 2020 and January 2021, respectively.
However, the guidance in ASC 848 is temporary in nature and generally cannot be applied to contract modifications that occur after December
31, 2022 or hedging relationships entered into or evaluated after that date. In December 2022, FASB deferred ASU 2022-04 and issued ASU
2022-06, Reference Rate Reform: Deferral of the Sunset Date of Topic 848, which extends the application of the amendments through December
31, 2024. Management is evaluating and believes it is unlikely the ASU’s adoption will have a significant impact on the Fund’s
financial statements.
The FASB issued final guidance (ASU No. 2022-08) to
clarify that a contractual restriction on the sale of an equity security is not considered part of the unit of account of the equity security
and, therefore, is not considered when measuring fair value. Recognizing a contractual restriction on the sale of an equity security as
a separate unit of account is not permitted. The guidance applies to all entities that have investments in equity securities measured
at fair value that are subject to contractual sale restrictions. Entities that hold equity securities subject to contractual sale restrictions
are required to make additional disclosures. The guidance will be applied prospectively, with special transition provisions for entities
that qualify as investment companies under ASC 946. For public business entities, the guidance is effective for fiscal years beginning
after 15 December 2023, and interim periods within those fiscal years. Management is currently assessing the potential impact of the new
guidance on the Funds’ financial statements.
3. Risks and Uncertainties
TYG, NTG, TTP, NDP and TPZ concentrate their investments
in the energy sector. TEAF concentrates its investments in issuers operating in essential asset sectors. Funds that primarily invest in
a particular sector may experience greater volatility than companies investing in a broad range of industry sectors. A Fund may, for defensive
purposes, temporarily invest all or a significant portion of its assets in investment grade securities, short-term debt securities and
cash or cash equivalents. To the extent a Fund uses this strategy, it may not achieve its investment objective.
4. Agreements
The Funds have each entered into an Investment Advisory
Agreement with Tortoise Capital Advisors, L.L.C. (the “Adviser”). The Funds each pay the Adviser a fee based on the Fund’s
average monthly total assets (including any assets attributable to leverage and excluding any net deferred tax asset) minus accrued liabilities
(other than net deferred tax liability, debt entered into for purposes of leverage and the aggregate liquidation preference of outstanding
preferred stock) (“Managed Assets”), in exchange for the investment advisory services provided. Average monthly Managed Assets
is the sum of the daily Managed Assets for the month divided by the number of days in the month. Accrued liabilities are expenses incurred
in the normal course of each Fund’s operations. Waived fees are not subject to recapture by the Adviser. The annual fee rates paid
to the Adviser as of May 31, 2024 are as follows:
TYG — 0.95% up to $2,500,000,000, 0.90% between
$2,500,000,000 and $3,500,000,000, and 0.85% above $3,500,000,000.
NTG — 0.95%.
TTP — 1.10%.
NDP — 1.10%.
TPZ — 0.95%.
TEAF — 1.35%.
On August 9, 2021, the Adviser voluntarily agreed to
reimburse TTP and NDP for their Operating Expenses in order to ensure that Operating Expenses do not exceed 1.35% of average daily managed
assets, effective September 1, 2021. In its sole discretion and at any time, the Adviser may elect to extend, terminate or modify the
temporary expense reimbursement upon written notice.
U.S. Bancorp Fund Services, LLC d/b/a U.S. Bank Global
Fund Services serves as each Fund’s administrator. Each Fund pays the administrator a monthly fee computed at an annual rate of
0.04% of the first $1,000,000,000 of the Fund’s Managed Assets, 0.01% on the next $500,000,000 of Managed Assets and 0.005% on the
balance of the Fund’s Managed Assets.
U.S. Bank, N.A. serves as the Funds’ custodian.
Each Fund pays the custodian a monthly fee computed at an annual rate of 0.004% of the Fund’s U.S. Dollar-denominated assets and
0.015% of the Fund’s Canadian Dollar-denominated assets, plus portfolio transaction fees.
Notes to Financial Statements (unaudited)
(continued)
5. Income Taxes
TYG and NTG:
It is the intention of TYG and NTG to qualify as RICs
under Subchapter M of the IRC and distribute all of its taxable income. Accordingly, no provision for federal income taxes is required
in the financial statements, except as discussed below.
For the period ending May 31, 2024, TYG and NTG have
a net tax expense of $139,209 and $18,024 respectively, relating to prior periods in which they were C Corporations (TYG: $139,209; NTG:
$18,024), and built-in gains taxes related to the conversion transaction (TYG: $0; NTG: $0). TYG and NTG are expected to be subject to
federal income tax on any built-in gains recognized related to the conversion transaction (as described below) during its fiscal year
ending November 30, 2024, but do not expect to be subject to excise tax during calendar year ending December 31, 2024.
Income taxes relating to prior periods in which TYG
and NTG were subject to tax as C Corporations are being calculated by applying the federal rate plus a blended state income tax rate of
approximately 23%.
As part of the conversion transaction, TYG and NTG
may be subject to corporate level-tax on the net unrecognized built-in gains inherent on the conversion date recognized during the subsequent
5-year period which ends November 30, 2027 (“the recognition period”). The conversion transaction requires TYG and NTG to
track built-in gains throughout the recognition period and potentially pay a corporate-level tax on any built-in gains recognized. During
the recognition period, tax is imposed on the lesser of the net built-in gain recognized, the taxable income as if the Fund were a corporation
or the net unrealized built-in gain at the conversion date. If the unrecognized built-in gains are recognized in the recognition period,
the Funds calculate tax based on the lesser of these three calculations and utilize pre-conversion capital loss carryforwards, it is possible
that the sale of the conversion property will not result in a current tax liability. Therefore, each year during the recognition period,
TYG and NTG will determine if any of these built-in gains have been recognized, such gain is not offset by the capital loss carryforwards
and calculate tax accordingly. If a tax liability is generated, TYG and NTG will record the current tax liability and current tax expense
in the period in which it is incurred. After the recognition period has ended, any built-in gains recognized will no longer be subject
to corporate-level tax.
Deferred income taxes reflect the net tax effect of
temporary differences between the carrying amount of assets and liabilities for financial reporting and tax purposes. The difference between
the financial reporting basis and the tax basis of the investment in the MLP investments (i.e., the outside basis difference) may create
a taxable temporary difference or a deductible temporary difference. In measuring and determining the character of the tax consequences
of the outside basis differences in its MLP investments, the Funds consider the expected types of taxable or deductible amounts in future
years and have concluded that the nature of the outside basis differences are capital in character because the Funds do not have the ability
to control the MLPs’ investment, distribution, or allocation decisions and, therefore, expect to recover the outside basis differences
upon disposal of the interests in the MLPs, which are considered capital assets in accordance with the tax law. The conversion transaction
does not impose or trigger a sale of securities held by TYG or NTG as of the conversion date. TYG and NTG do not estimate or forecast
future events, including the potential recharacterization of capital gains as ordinary income associated with selling MLP investments
when evaluating their deferred income taxes. The sale of MLP unit typically results in the recognition of a capital gain or loss. In accordance
with the tax law, a portion of any gain or loss recognized by the Funds may be recharacterized as ordinary income (“recapture”)
to the extent attributable to assets of the MLP that give rise to depreciation recapture in the recognition period. Any such gain may
exceed the net taxable gain realized on the sale and will be recognized regardless of whether there is a net taxable gain or loss on the
sale of such unit. The Funds will record any current and deferred taxes as appropriate.
Components of TYG’s and NTG’s deferred
tax assets and liabilities as of May 31, 2024 are as follows:
| | |
TYG | | |
NTG | |
| Deferred tax assets: | |
| | | |
| | |
| Capital loss carryforwards | |
$ | 17,636,498 | | |
$ | 6,444,434 | |
| | |
| 17,636,498 | | |
| 6,444,434 | |
| Deferred tax liabilities: | |
| | | |
| | |
| Net unrealized gain on investment securities | |
| 17,636,498 | | |
| 6,444,434 | |
| | |
| 17,636,498 | | |
| 6,444,434 | |
| Total net deferred tax liability (asset) | |
$ | — | | |
$ | — | |
The amount and character of income and capital gain
distributions to be paid, if any, are determined in accordance with federal income tax regulations, which may differ from U.S. generally
accepted accounting principles. These differences are primarily due to return of capital distributions, book/tax differences from underlying
investments and the timing of recognition of gains or losses on investments.
2024 Semi-Annual Report | May 31, 2024
Notes to Financial Statements (unaudited)
(continued)
As of November 30,2023, the components of accumulated
earnings (deficit) on a tax basis were as follows:
| | |
TYG | | |
NTG | |
| Unrealized appreciation (depreciation) | |
$ | 39,123,613 | | |
$ | 24,096,912 | |
| Capital loss carryforwards | |
| (257,000,023 | ) | |
| (460,471,361 | ) |
| Undistributed ordinary income | |
| — | | |
| — | |
| Other temporary differences | |
| (580,908 | ) | |
| (161,479 | ) |
| Accumulated earnings (deficit) | |
$ | (218,457,318 | ) | |
$ | (436,535,928 | ) |
As of November 30, 2023, for federal income tax purposes,
TYG and NTG had capital loss carryforwards of approximately $257,000,000 and $461,000,000 respectively, which may be carried forward for
5 years. If not utilized, these capital losses will expire in the year ending November 30, 2025. Because of TYG and NTG’s intent
to be subject to tax as a RIC, any temporary differences such as capital loss carryforwards from periods in which each fund was a C-Corporation
must be further evaluated to determine what the expected future tax rate would be upon reversal. As such, TYG and NTG expect capital loss
carryforwards of $84,592,032 and $32,854,042 respectively, to reverse at 21%, the tax rate applicable to built-in gains that were generated
when the funds were C-Corporations. The remaining capital loss carryforwards are expected to reverse at 0%, the tax rate applicable to
RICs.
As of May 31, 2024, TYG and NTG generated approximately
$4,800,000 and $2,800,000 of capital loss carryforwards in the current year.
As of May 31, 2024, the aggregate cost of investments,
aggregate gross unrealized appreciation and aggregate gross unrealized depreciation on a federal income tax basis were as follows:
| | |
TYG | | |
NTG | |
| Tax cost of investments | |
$ | 438,068,009 | | |
$ | 237,648,186 | |
| Gross unrealized appreciation of investments | |
$ | 146,843,097 | | |
$ | 77,032,937 | |
| Gross unrealized depreciation of investments | |
| (31,157,282 | ) | |
| (10,613,225 | ) |
| Net unrealized appreciation (depreciation) of investments | |
$ | 115,685,815 | | |
$ | 66,419,712 | |
TTP, NDP, TPZ and TEAF:
It is the intention of TTP, NDP, TPZ and TEAF to qualify
as RICs under Subchapter M of the IRC and distribute all of its taxable income. Accordingly, no provision for federal income taxes is
required in the financial statements. However, TEAF’s taxable subsidiary created to make and hold certain investments is generally
subject to federal and state income taxes on its income.
As of May 31, 2024, TEAF consolidated the balance of
a deferred tax expense of $0 related to the investment activities of its taxable subsidiary. Total income taxes are computed by applying
the federal statutory rate plus a blended state income tax rate totaling 25.62%.
At May 31, 2024, a valuation allowance on deferred
tax assets was necessary because TEAF believes it is not more likely than not that its able to realize its deferred tax assets through
future taxable income. TEAF has recorded a valuation allowance of $2,306,101. Any adjustments to TEAF’s estimates of future taxable
income will be made in the period such determination is made.
Total income tax expense for TEAF’s taxable subsidiary
differs from the amount computed by applying the federal statutory income tax rate of 21% to net income for the period ended May 31, 2024,
as follows:
| Application of Statutory Income tax rate | |
$ | (859,384 | ) |
|
|
|
|
| State Income taxes, net of federal tax effect | |
| (188,960 | ) |
|
|
|
|
| Permanent differences | |
| 4,597 | |
|
|
|
|
| Other | |
| — | |
|
|
|
|
| Change in valuation allowance | |
| 1,043,747 | |
|
|
|
|
| Total income tax benefit | |
$ | — | |
|
|
|
|
The amount and character of income and capital gain
distributions to be paid, if any, are determined in accordance with federal income tax regulations, which may differ from U.S. generally
accepted accounting principles. The sale of a MLP unit results in the recognition of a capital gain or loss with a portion of any gain
or loss recognized by the Funds subject to being treated as ordinary income to the extent attributable to assets of the MLP that give
rise to depreciation recapture. Any such gain may exceed the net taxable gain realized on the sale and will be recognized regardless of
whether there is a net taxable gain or loss on the sale of such unit. As such, net, ordinary gains recognized upon the sale of MLP units
may change the character of distributions to shareholders. These differences are primarily due to return of capital distributions and
book/tax differences from underlying investments.
Notes to Financial Statements (unaudited)
(continued)
As of November 30, 2023, the components of accumulated
earnings (deficit) on a tax basis were as follows:
| | |
TTP | | |
NDP | | |
TPZ | | |
TEAF | |
| Unrealized appreciation (depreciation) | |
$ | (42,908 | ) | |
$ | 19,617,973 | | |
$ | 6,402,962 | | |
$ | (6,607,080 | ) |
| Capital loss carryforwards | |
| (95,739,349 | ) | |
| (169,977,297 | ) | |
| (9,898,554 | ) | |
| (26,808,574 | ) |
| Undistributed ordinary income | |
| — | | |
| — | | |
| — | | |
| — | |
| Other temporary differences | |
| (60,830 | ) | |
| — | | |
| (1,599 | ) | |
| (327,224 | )(1) |
| Accumulated earnings (deficit) | |
$ | (95,843,087 | ) | |
$ | (150,359,324 | ) | |
$ | (3,497,191 | ) | |
$ | (33,742,878 | ) |
(1) Primarily related to losses deferred under straddle
regulations per IRC Sec. 1092.
As of November 30, 2023, TTP, NDP, TPZ and TEAF had
short-term capital loss carryforwards of $16,580,238, $69,928,235, $202,707, and $22,613,457 respectively, and TTP, NDP, TPZ and TEAF
had long-term capital loss carryforwards of $79,159,111, $100,049,062, $9,695,844, and 4,195,117 respectively, which may be carried forward
for an unlimited period under the Regulated Investment Company Modernization Act of 2010. To the extent future net capital gains are realized,
those gains will be offset by any unused capital loss carryforwards. Capital loss carryforwards will retain their character as either
short-term or long-term capital losses. Thus, such losses must be used first to offset gains of the same character; for example, long-term
loss carryforwards will first offset long-term gains, before they can be used to offset short-term gains.
As of May 31, 2024 TTP, NDP, TPZ and TEAF utilized
(generated) approximately $(125,000), $180,000, $(1,145,000) and $832,000 of capital loss carryforwards in the current year.
In order to meet certain excise tax distribution requirements,
TTP, NDP, TPZ and TEAF are required to measure and distribute annually net capital gains realized during a twelve month period ending
October 31 and net investment income earned during a twelve month period ending December 31. In connection with this, TTP, NDP, TPZ and
TEAF are permitted for tax purposes to defer into their next fiscal year, qualified late year losses. Qualified late year ordinary losses
are any net ordinary losses incurred between January 1 and the end of their fiscal year, November 30, 2023. For the taxable year ended
November 30, 2023, TTP, NDP, TPZ and TEAF do not plan to defer any losses.
As of May 31, 2024, the aggregate cost of investments,
aggregate gross unrealized appreciation and aggregate gross unrealized depreciation on a federal income tax basis were as follows:
| | |
TTP | | |
NDP | | |
TPZ | | |
TEAF | |
| Tax cost of investments | |
$ | 65,421,317 | | |
$ | 44,739,557 | | |
$ | 96,224,335 | | |
$ | 223,525,996 | |
| Gross unrealized appreciation of investments | |
$ | 32,918,023 | | |
$ | 31,612,850 | | |
$ | 34,922,208 | | |
$ | 20,763,672 | |
| Gross unrealized depreciation of investments | |
| (2,132,357 | ) | |
| (110,035 | ) | |
| (3,299,997 | ) | |
| (24,483,904 | ) |
| Net unrealized appreciation (depreciation) of investments | |
$ | 30,785,666 | | |
$ | 31,502,815 | | |
$ | 31,622,211 | | |
$ | (3,720,232 | ) |
6. Restricted Securities
Certain of the Funds’ investments are restricted
and are valued as determined in accordance with fair value procedures, as more fully described in Note 2. The following table shows the
principal amount or shares, acquisition date(s), acquisition cost, fair value and the percent of net assets which the securities comprise
at May 31, 2024.
| TYG: | |
| |
| | |
| |
| | |
| | |
| |
|
| Investment
Security | |
Investment
Type | |
Shares | | |
Acquisition
Date(s) | |
Acquisition
Cost | | |
Fair
Value | | |
Fair Value
as Percent
of Net Assets |
| TK NYS Solar Holdco, LLC | |
Private Investment | |
| N/A | | |
08/18/17-08/19/19 | |
$ | 50,141,470 | | |
$ | 10,400,393 | | |
| 2.4 | % |
|
| | |
| |
| | | |
| |
$ | 50,141,470 | | |
$ | 10,400,393 | | |
| 2.4 | % |
|
| | |
| |
| | | |
| |
| | | |
| | | |
| | |
|
| TPZ: | |
| |
| | | |
| |
| | | |
| | | |
| | |
|
| Investment
Security | |
Investment
Type | |
| Principal
Amount | | |
Acquisition
Date(s) | |
| Acquisition
Cost | | |
| Fair
Value | | |
Fair Value
as Percent
of Net Assets |
| Antero Midstream Partners LP, 5.750%, 03/01/2027* | |
Corporate Bond | |
$ | 3,800,000 | | |
04/03/19-09/07/21 | |
$ | 3,890,000 | | |
$ | 3,748,365 | | |
| 3.6 | % |
|
| Blue Racer Midstream, LLC, 6.625%, 07/15/2026* | |
Corporate Bond | |
$ | 2,950,000 | | |
06/14/18-02/01/19 | |
| 2,997,313 | | |
| 2,946,802 | | |
| 2.8 | |
|
| DT Midstream, Inc., 4.375%, 06/15/2031* | |
Corporate Bond | |
$ | 2,000,000 | | |
09/03/21-09/07/21 | |
| 2,085,000 | | |
| 1,796,299 | | |
| 1.7 | |
|
| EnLink Midstream, 6.500%, 09/01/2030 | |
Corporate Bond | |
$ | 2,000,000 | | |
04/16/24 | |
| 2,024,000 | | |
| 2,042,990 | | |
| 2.0 | |
|
2024 Semi-Annual Report | May 31, 2024
Notes to Financial Statements (unaudited)
(continued)
| TPZ: (continued) | | |
| |
| | |
| | |
| |
|
| Investment
Security | |
Investment
Type | |
Shares | | |
Acquisition
Date(s) | |
Acquisition
Cost | | |
Fair
Value | | |
Fair
Value
as Percent
of Net Assets |
| Hess Corporation, 5.625%, 02/15/2026* | |
Corporate Bond | |
$ | 4,160,000 | | |
07/17/18-08/02/18 | |
$ | 4,196,600 | | |
$ | 4,134,611 | | |
| 4.0 | % |
|
| Kodiak Gas Services, 7.250%, 02/15/2029* | |
Corporate Bond | |
$ | 4,000,000 | | |
02/12/24-03/06/24 | |
| 4,087,025 | | |
| 4,062,215 | | |
| 3.9 | |
|
| New Fortress Energy, Inc., 6.500%, 09/30/2026* | |
Corporate Bond | |
$ | 5,000,000 | | |
03/26/21-10/07/21 | |
| 4,999,844 | | |
| 4,705,067 | | |
| 4.5 | |
|
| NGPL Pipe Co, 3.250%, 07/15/2031* | |
Corporate Bond | |
$ | 3,500,000 | | |
11/09/21-07/10/23 | |
| 3,182,015 | | |
| 2,968,029 | | |
| 2.8 | |
|
| Tallgrass Energy LP, 5.500%, 01/15/2028* | |
Corporate Bond | |
$ | 3,250,000 | | |
09/24/18-02/04/19 | |
| 3,261,250 | | |
| 3,099,895 | | |
| 2.9 | |
|
| Venture Global LNG, 9.875%, 01/15/2028* | |
Corporate Bond | |
$ | 3,500,000 | | |
02/13/24-02/27/24 | |
| 3,710,469 | | |
| 3,752,926 | | |
| 3.6 | |
|
| | |
| |
| | | |
| |
$ | 34,433,516 | | |
$ | 33,257,199 | | |
| 31.8 | % |
|
| | |
| |
| | | |
| |
| | | |
| | | |
| | |
|
| TEAF: | |
| |
| | | |
| |
$ | 33,257,199 | | |
| 31.8% | | |
| | |
|
| Investment Security | |
Investment Type | |
Principal
Amount/Shares | | |
Acquisition Date(s) | |
Acquisition Cost | | |
Fair Value | | |
Fair Value
as Percent
of Net Assets |
| 315/333 West Dawson Associates, 11.000%, 01/31/26* | |
Corporate Bond | |
$ | 3,770,000 | | |
03/30/21 | |
$ | 3,590,476 | | |
$ | 3,621,370 | | |
| 1.8 | % |
|
| Ativo Albuquerque LLC, 12.000%, 01/01/2028* | |
Corporate Bond | |
$ | 2,032,000 | | |
12/28/22 | |
| 2,032,000 | | |
| 2,132,924 | | |
| 1.1 | |
|
| Contour Propco, 11.000%, 10/01/25 | |
Corporate Bond | |
$ | 5,715,000 | | |
09/30/21 | |
| 5,715,000 | | |
| 317,754 | | |
| 0.2 | |
|
| Dove Mountain Residences, LLC 11.000%, 02/01/2026* | |
Corporate Bond | |
$ | 1,050,000 | | |
12/02/21 | |
| 1,050,000 | | |
| 1,010,802 | | |
| 0.5 | |
|
| Dove Mountain Residences, LLC 16.000%, 02/01/2026* | |
Corporate Bond | |
$ | 1,116,447 | | |
12/02/21-02/01/24 | |
| 1,116,447 | | |
| 1,070,469 | | |
| 0.5 | |
|
| Drumlin Reserve Property LLC, 10.000%, 10/02/2025* | |
Corporate Bond | |
$ | 1,705,311 | | |
09/30/20 | |
| 1,705,311 | | |
| 1,665,531 | | |
| 0.8 | |
|
| JW Living Smithville Urban Ren Sub Global 144A 27 11.750%,
06/01/2027 | |
Corporate Bond | |
$ | 3,890,000 | | |
05/24/22 | |
| 3,890,000 | | |
| 3,951,800 | | |
| 2.0 | |
|
| Realco Perry Hall MD LLC/OPCO, 10.000%, 10/01/2024* | |
Corporate Bond | |
$ | 2,198,000 | | |
09/30/19 | |
| 2,198,000 | | |
| 2,194,681 | | |
| 1.1 | |
|
| Mexico Pacific Limited LLC (MPL) Series A | |
Private Investment | |
| 135,180 | | |
10/23/19-05/10/23 | |
| 2,031,683 | | |
| 2,966,390 | | |
| 1.5 | |
|
| One Energy | |
Private Investment | |
| 21,311 | | |
04/12/23-05/17/2024 | |
| 9,050,000 | | |
| 11,747,263 | | |
| 5.9 | |
|
| TEP Montana LLC | |
Private Investment | |
| 128,235 | | |
05/10/2024 | |
| 1,090,000 | | |
| 1,549,082 | | |
| 0.8 | |
|
| Renewable Holdco, LLC | |
Private Investment | |
| N/A | | |
07/25/19-01/24/24 | |
| 6,539,248 | | |
| 6,950,738 | | |
| 3.4 | |
|
| Renewable Holdco I, LLC | |
Private Investment | |
| N/A | | |
09/09/19 | |
| 22,010,876 | | |
| 15,334,865 | | |
| 7.7 | |
|
| Renewable Holdco II, LLC | |
Private Investment | |
| N/A | | |
11/15/16-12/22/21 | |
| 12,313,411 | | |
| 11,422,484 | | |
| 5.7 | |
|
| Saturn Solar Ber-muda 1 Ltd., 10.000%, 12/31/2023 | |
Private Note | |
$ | 3,510,000 | | |
05/24/19-07/03/19 | |
| 3,778,904 | | |
| 3,672,864 | | |
| 1.8 | |
|
| EF WWW Holdings, LLC, 10.500%, 09/30/2026 | |
Private Note | |
$ | 9,600,000 | | |
12/06/21-04/06/23 | |
| 9,600,000 | | |
| 9,792,000 | | |
| 4.9 | |
|
| | |
| |
| | | |
| |
$ | 87,711,356 | | |
$ | 79,401,017 | | |
| 39.7 | % |
|
* Security is eligible for resale under Rule 144A under
the 1933 Act.
Notes to Financial Statements (unaudited)
(continued)
7. Affiliated Company Transactions
| TYG: | |
| | |
| | |
| | |
| | |
| | |
| | |
| | |
| |
| Investment Security | |
11/30/23
Share
Balance | |
Gross
Additions | | |
Gross
Reductions | | |
Realized
Gain/(Loss) | | |
Distributions
Received | | |
5/31/24
Share
Balance | | |
5/31/24
Value | | |
Net
Change in
Unrealized
Appreciation
(Depreciation) | |
| TK NYS Solar Holdco, LLC | |
| N/A | | |
$ | — | | |
$ | — | | |
$ | — | | |
$ | — | | |
| N/A | | |
$ | 10,400,393 | | |
$ | (4,150,222 | ) |
| | |
| | | |
| | | |
| | | |
| | | |
| | | |
| | | |
| | | |
| | |
| TEAF: | |
| | | |
| | | |
| | | |
| | | |
| | | |
| | | |
| | | |
| | |
| Investment
Security | |
11/30/23
Share
Balance | |
| Gross
Additions | | |
| Gross
Reductions | | |
| Realized
Gain/(Loss) | | |
| Distributions
Received | | |
5/31/24
Share
Balance | | |
| 5/31/24
Value | | |
| Net
Change in
Unrealized
Appreciation
(Depreciation) | |
| Renewable Holdco, LLC | |
| N/A | | |
$ | 100,000 | | |
$ | — | | |
$ | — | | |
$ | — | | |
| N/A | | |
$ | 6,950,738 | | |
$ | (56,456 | ) |
| Renewable Holdco I, LLC | |
| N/A | | |
$ | — | | |
$ | — | | |
$ | — | | |
$ | — | | |
| N/A | | |
$ | 15,334,865 | | |
$ | (2,660,508 | ) |
| Renewable Holdco II, LLC | |
| N/A | | |
$ | — | | |
$ | — | | |
$ | — | | |
$ | — | | |
| N/A | | |
$ | 11,422,484 | | |
$ | (1,177,218 | ) |
| | |
| | | |
| | | |
| | | |
| | | |
| | | |
| | | |
| | | |
| | |
| Total | |
| N/A | | |
$ | 100,000 | | |
$ | — | | |
$ | — | | |
$ | — | | |
| N/A | | |
$ | 33,708,087 | | |
$ | (3,894,182 | ) |
8. Investment Transactions
For the period ended May 31, 2024, the amount of security
transactions (other than U.S. government securities and short-term investments), is as follows:
| | |
|
TYG | | |
NTG | | |
TTP | | |
NDP | | |
TPZ | | |
TEAF | |
| Purchases | |
|
$ | 166,293,918 | | |
$ | 30,967,072 | | |
$ | 471,402 | | |
$ | 1,350,832 | | |
$ | 12,622,234 | | |
$ | 34,317,147 | |
| Sales | |
|
$ | 167,127,918 | | |
$ | 27,484,901 | | |
$ | 474,265 | | |
$ | 1,350,395 | | |
$ | 14,461,668 | | |
$ | 41,565,935 | |
9. Senior Notes
TYG, NTG and TTP each have issued private senior notes
(collectively, the “Notes”), which are unsecured obligations and, upon liquidation, dissolution or winding up of a Fund, will
rank: (1) senior to all of the Fund’s outstanding preferred shares, if any; (2) senior to all of the Fund’s outstanding common
shares; (3) on parity with any unsecured creditors of the Fund and any unsecured senior securities representing indebtedness of the Fund
and (4) junior to any secured creditors of the Fund. Holders of the Notes are entitled to receive periodic cash interest payments until
maturity. The Notes are not listed on any exchange or automated quotation system.
The Notes are redeemable in certain circumstances at
the option of a Fund, subject to payment of any applicable make-whole amounts or early redemption premiums. The Notes for a Fund are also
subject to a mandatory redemption if the Fund fails to meet asset coverage ratios required under the 1940 Act or the rating agency guidelines
if such failure is not waived or cured. At May 31, 2024, each of TYG, NTG and TTP were in compliance with asset coverage covenants and
basic maintenance covenants for its senior notes.
Details of each Fund’s outstanding Notes, including
estimated fair value, as of May 31, 2024 are included below. The estimated fair value of each series of fixed-rate Notes was calculated,
for disclosure purposes, by discounting future cash flows by a rate equal to the current U.S. Treasury rate with an equivalent maturity
date, plus either 1) the spread between the interest rate on recently issued debt and the U.S. Treasury rate with a similar maturity date
or 2) if there has not been a recent debt issuance, the spread between the AAA corporate finance debt rate and the U.S. Treasury rate
with an equivalent maturity date plus the spread between the fixed rates of the Notes and the AAA corporate finance debt rate. The estimated
fair value of floating rate Notes approximates the carrying amount because the interest rate fluctuates with changes in interest rates
available in the current market. The estimated fair values in the following tables are Level 2 valuations within the fair value hierarchy.
| TYG: | |
| |
|
| | |
| |
| | |
| |
| Series | |
Maturity
Date | |
|
Interest Rate | | |
Payment
Frequency | |
Notional
Amount | | |
Estimated
Fair Value | |
| Series L | |
December 19, 2024 | |
| 3.99% | | |
Semi-Annual | |
$ | 6,453,333 | | |
$ | 6,485,979 | |
| Series AA | |
June 14, 2025 | |
| 3.48% | | |
Semi-Annual | |
| 3,226,666 | | |
| 3,192,647 | |
| Series NN | |
June 14, 2025 | |
| 3.20% | | |
Semi-Annual | |
| 9,680,000 | | |
| 9,540,379 | |
| Series KK | |
December 18, 2025 | |
| 3.53% | | |
Semi-Annual | |
| 3,226,667 | | |
| 3,161,744 | |
| Series OO | |
April 9, 2026 | |
| 3.27% | | |
Semi-Annual | |
| 9,680,000 | | |
| 9,279,829 | |
| Series PP | |
September 25, 2027 | |
| 3.33% | | |
Semi-Annual | |
| 8,066,667 | | |
| 7,558,271 | |
| Series QQ | |
December 17, 2028 | |
| 2.50% | | |
Semi-Annual | |
| 10,000,000 | | |
| 9,588,401 | |
| | |
| |
| | | |
| |
$ | 50,333,333 | | |
$ | 48,807,250 | |
2024 Semi-Annual Report | May 31, 2024
Notes to Financial Statements (unaudited)
(continued)
On December 18, 2023, TYG’s Series JJ Notes,
with a notional amount of $6,453,333 and a fixed interest rate of 3.34% were paid in full at maturity.
On January 22, 2024, TYG’s Series T Notes, with
a notional amount of $8,066,667 and a fixed interest rate of 4.16% were paid in full at maturity.
| NTG: | |
| |
|
| | |
| |
| | |
| |
| Series | |
Maturity
Date | |
|
Interest
Rate | | |
Payment
Frequency | |
Notional
Amount | | |
Estimated
Fair Value | |
| Series Q | |
October 16, 2025 | |
| 3.97% | | |
Semi-Annual | |
$ | 2,234,291 | | |
$ | 2,183,693 | |
| Series R | |
October 16, 2026 | |
| 4.02% | | |
Semi-Annual | |
| 1,936,386 | | |
| 1,870,632 | |
| Series S | |
December 17, 2028 | |
| 2.50% | | |
Semi-Annual | |
| 25,000,000 | | |
| 22,295,578 | |
| | |
| |
| | | |
| |
$ | 29,170,677 | | |
$ | 26,349,903 | |
| | |
| |
| | | |
| |
| | | |
| | |
| TTP: | |
| |
| | |
| |
| | |
| |
| Series | |
Maturity
Date | |
Interest
Rate | | |
Payment
Frequency | |
Notional
Amount | | |
Estimated
Fair Value | |
| Series H | |
December 13, 2024 | |
| 3.97% | | |
Semi-Annual | |
$ | 3,942,857 | | |
$ | 3,966,018 | |
10. Mandatory Redeemable Preferred Stock
TYG, NTG and TTP each have issued and outstanding MRP
Stock at May 31, 2024. The MRP Stock has rights determined by the Board of Directors. Except as otherwise indicated in the Funds’
Charter or Bylaws, or as otherwise required by law, the holders of MRP Stock have voting rights equal to the holders of common stock (one
vote per MRP share) and will vote together with the holders of shares of common stock as a single class except on matters affecting only
the holders of preferred stock or the holders of common stock. The 1940 Act requires that the holders of any preferred stock (including
MRP Stock), voting separately as a single class, have the right to elect at least two directors at all times.
Under the 1940 Act, a Fund may not declare dividends
or make other distributions on shares of common stock or purchases of such shares if, at the time of the declaration, distribution or
purchase, asset coverage with respect to the outstanding MRP Stock would be less than 200%. The MRP Stock is also subject to a mandatory
redemption if a Fund fails to meet an asset coverage ratio of at least 225% as determined in accordance with the 1940 Act or a rating
agency basic maintenance amount if such failure is not waived or cured. At May 31, 2024, each of TYG, NTG and TTP were in compliance with
asset coverage covenants and basic maintenance covenants for its MRP Stock.
Details of each Fund’s outstanding MRP Stock,
including estimated fair value, as of May 31, 2024 is included below. The estimated fair value of each series of TYG, NTG and TTP MRP
Stock was calculated for disclosure purposes by discounting future cash flows at a rate equal to the current U.S. Treasury rate with an
equivalent maturity date, plus either 1) the spread between the interest rate on recently issued preferred stock and the U.S. Treasury
rate with a similar maturity date or 2) if there has not been a recent preferred stock issuance, the spread between the AA corporate finance
debt rate and the U.S. Treasury rate with an equivalent maturity date plus the spread between the fixed rates of the MRP Stock and the
AA corporate finance debt rate. The estimated fair values of each series of the TYG, NTG and TTP MRP Stock are Level 2 valuations within
the fair value hierarchy.
TYG:
TYG has 65,000,000 shares of preferred stock authorized
and 3,566,061 shares of MRP Stock outstanding at May 31, 2024. TYG’s MRP Stock has a liquidation value of $10.00 per share plus
any accumulated but unpaid distributions, whether or not declared. Holders of the MRP E Stock and MRP F Stock are entitled to receive
cash interest payments semi-annually at a fixed rate until maturity. The TYG MRP Stock is not listed on any exchange or automated quotation
system.
| Series | |
Mandatory
Redemption Date | |
|
Fixed
Rate |
| |
Shares
Outstanding | |
Aggregate Liquidation
Preference | |
Estimated
Fair Value |
| Series E | |
December 17, 2024 | |
|
4.34% |
| |
| 1,566,061 | | |
$ | 15,660,610 | | |
$ | 15,763,671 | |
| Series F | |
December 17, 2026 | |
|
2.67% |
| |
| 2,000,000 | | |
| 20,000,000 | | |
| 18,374,643 | |
| | |
| |
|
|
| |
| 3,566,061 | | |
$ | 35,660,610 | | |
$ | 34,138,314 | |
TYG’s MRP Stock is redeemable in certain circumstances
at the option of TYG, subject to payment of any applicable make-whole amounts.
Notes to Financial Statements (unaudited)
(continued)
NTG:
NTG has 10,000,000 shares of preferred stock authorized
and 550,151 shares of MRP Stock outstanding at May 31, 2024. NTG’s MRP Stock has a liquidation value of $25.00 per share plus any
accumulated but unpaid distributions, whether or not declared. Holders of NTG MRP Stock are entitled to receive cash interest payments
each quarter at a fixed rate until maturity. The NTG MRP Stock is not listed on any exchange or automated quotation system.
| Series | |
Mandatory
Redemption Date | |
|
Fixed Rate |
| |
Shares Outstanding | |
Aggregate Liquidation
Preference | |
Estimated
Fair Value |
| Series E | |
December 13, 2024 | |
|
3.78% |
| |
| 153,939 | | |
$ | 3,848,475 | | |
$ | 3,805,735 | |
| Series F | |
December 13, 2027 | |
|
4.07% |
| |
| 96,212 | | |
| 2,405,300 | | |
| 2,269,873 | |
| Series H | |
December 17, 2027 | |
|
2.90% |
| |
| 300,000 | | |
| 7,500,000 | | |
| 6,672,436 | |
| | |
| |
|
|
| |
| 550,151 | | |
$ | 13,753,775 | | |
$ | 12,748,044 | |
NTG’s MRP Stock is redeemable in certain circumstances
at the option of NTG, subject to payment of any applicable make-whole amounts.
TTP:
TTP has 10,000,000 shares of preferred stock authorized
and 244,000 shares of MRP Stock outstanding at May 31, 2024. TTP’s MRP Stock has a liquidation value of $25.00 per share plus any
accumulated but unpaid distributions, whether or not declared. Holders of TTP MRP Stock are entitled to receive cash interest payments
each quarter at a fixed rate until maturity. The TTP MRP Stock is not listed on any exchange or automated quotation system.
| Series | |
Mandatory
Redemption Date | |
|
Fixed Rate |
| |
Shares Outstanding | |
Aggregate
Liquidation
Preference | | |
Estimated
Fair Value |
| Series B | |
December 13, 2024 | |
|
4.57% |
| |
| 244,000 | | |
$ | 6,100,000 | | |
$ | 6,157,038 | |
TTP’s MRP Stock is redeemable in certain circumstances
at the option of TTP, subject to payment of any applicable make-whole amounts.
2024 Semi-Annual Report | May 31, 2024
Notes to Financial Statements (unaudited)
(continued)
11. Credit Facilities
The following table shows key terms, average borrowing
activity and interest rates for the period during which the facility was utilized during the period from December 1, 2023 through May
31, 2024 as well as the principal balance and interest rate in effect at May 31, 2024 for each of the Funds’ credit facilities:
| | |
TYG | | |
NTG | | |
TTP | | |
NDP | | |
TPZ | | |
TEAF | |
| Lending syndicate agent | |
| U.S. Bank, N.A. | | |
| U.S. Bank, N.A. | | |
| The Bank
of Nova Scotia | | |
| The Bank
of Nova Scotia | | |
| The Bank
of Nova Scotia | | |
| The Bank
of Nova Scotia | |
| | |
| | | |
| | | |
| | | |
| | | |
| | | |
| | |
| Type of facility | |
| Unsecured,
revolving credit
facility | | |
| Unsecured,
revolving credit
facility | | |
| Unsecured,
revolving credit
facility | | |
| Margin loan
facility | | |
| Margin loan
facility | | |
| Margin loan
facility | |
| | |
| | | |
| | | |
| | | |
| | | |
| | | |
| | |
| Borrowing capacity | |
$ | 45,000,000 | | |
$ | 35,000,000 | | |
$ | 15,000,000 | | |
$ | 12,000,000 | | |
$ | 30,000,000 | | |
$ | 45,000,000 | |
| | |
| | | |
| | | |
| December 23, | | |
| 179-day rolling | | |
| 179-day rolling | | |
| 179-day rolling | |
| Maturity date | |
| June 12, 2025 | | |
| June 12, 2025 | | |
| 2024 | | |
| ever-green | | |
| evergreen | | |
| ever-green | |
| Interest rate | |
| 1-month
Term SOFR
plus 1.35% | | |
| 1-month
Term SOFR
plus 1.35% | | |
| Simple SOFR
plus 0.10%
plus 1.30% | | |
| 1-month
Term SOFR
plus 1.00% | | |
| 1-month
Term SOFR
plus 1.00% | | |
| 1-month
Term SOFR
plus 1.00% | |
| Non-usage fee | |
| 0.15%-0.25%(1) | | |
| 0.15%-0.25%(2) | | |
| 0.00%-0.30%(3) | | |
| 0.20 | % | |
| 0.20 | % | |
| 0.20 | % |
| | |
| | | |
| | | |
| | | |
| | | |
| | | |
| | |
| For the period ended May 31, 2024: | | |
| | | |
| | | |
| | | |
| | | |
| | |
| Average principal balance | |
$ | 21,913,661 | | |
$ | 11,933,333 | | |
$ | 6,037,705 | | |
$ | 9,203,825 | | |
$ | 22,049,180 | | |
$ | 21,806,557 | |
| Average interest rate | |
| 6.68 | % | |
| 6.68 | % | |
| 6.72 | % | |
| 6.34 | % | |
| 6.34 | % | |
| 6.34 | % |
| | |
| | | |
| | | |
| | | |
| | | |
| | | |
| | |
| As of May 31, 2024: | |
| | | |
| | | |
| | | |
| | | |
| | | |
| | |
| Principal balance outstanding | |
$ | 29,600,000 | | |
$ | 13,700,000 | | |
$ | 6,700,000 | | |
$ | 10,200,000 | | |
$ | 24,300,000 | | |
$ | 20,900,000 | |
| Interest rate | |
| 6.68 | % | |
| 6.68 | % | |
| 6.74 | % | |
| 6.33 | % | |
| 6.33 | % | |
| 6.33 | % |
| (1) |
Non-use fees are tiered with a rate of 0.25% when the outstanding balance is below $22,500,000 and 0.15% when
the outstanding balance is at least $22,500,000, but below $31,500,000. The outstanding balance will not be subject to the non-use
fee when the amount outstanding is at least $31,500,000. |
| (2) |
Non-use fees are tiered with a rate of 0.25% when the outstanding balance is below $17,500,000 and 0.15% when the outstanding
balance is at least $17,500,000, but below $24,500,000. The outstanding balance will not be subject to the non-use fee when the amount
outstanding is at least $24,500,000. |
| (3) |
Non-use fee is 0.00% when the amount outstanding is at least $13,500,000, and 0.15% when the amount outstanding is less than
$13,500,000 and greater than or equal to $10,500,000, and 0.20% when the amount outstanding is less than $10,500,000 and greater
than or equal to $7,500,000, and 0.30% when the amount outstanding is less than $7,500,000. |
On December 27, 2023, TTP executed an amendment to
its existing credit agreement to extend the termination date to December 23, 2024. The facility borrowing capacity remains $15,000,000,
and the reference rate continues to be the adjusted Simple SOFR plus 130 basis points (1.30%).
On December 27, 2023, NDP allowed its existing $12,000,000
credit agreement to terminate and executed a new margin loan agreement. The term of the newly executed margin loan agreement is 179-day
rolling evergreen, the facility borrowing capacity to $12,000,000, and the reference rate is the 1-month term SOFR plus 100 basis points
(1.00%).
On December 27, 2023, TPZ allowed its existing $30,000,000
credit agreement to terminate and executed a new margin loan agreement. The term of the newly executed margin loan agreement is 179-day
rolling evergreen, the facility borrowing capacity to $30,000,000, and the reference rate is the 1-month term SOFR plus 100 basis points
(1.00%).
Under the terms of the credit and margin facilities,
the Funds must maintain asset coverage required under the 1940 Act. If a Fund fails to maintain the required coverage, it may be required
to repay a portion of an outstanding balance until the coverage requirement has been met. At May 31, 2024, each Fund was in compliance
with facility terms.
Notes to Financial Statements (unaudited)
(continued)
12. Derivative Financial Instruments
The Funds have adopted the disclosure provisions of
FASB Accounting Standard Codification 815, Derivatives and Hedging (“ASC 815”). ASC 815 requires enhanced disclosures about
the Funds’ use of and accounting for derivative instruments and the effect of derivative instruments on the Funds’ results
of operations and financial position. Tabular disclosure regarding derivative fair value and gain/loss by contract type (e.g., interest
rate contracts, foreign exchange contracts, credit contracts, etc.) is required and derivatives accounted for as hedging instruments under
ASC 815 must be disclosed separately from those that do not qualify for hedge accounting. Even though the Funds may use derivatives in
an attempt to achieve an economic hedge, the Funds’ derivatives are not accounted for as hedging instruments under ASC 815 because
investment companies account for their derivatives at fair value and record any changes in fair value in current period earnings.
Forward Currency Contracts
TEAF may invest in derivative instruments for hedging
or risk management purposes, and for short-term purposes such as maintaining market exposure pending investment of the proceeds of an
offering or transitioning its portfolio between different asset classes. The Fund’s use of derivatives could enhance or decrease
the cash available to the Fund for payment of distributions or interest, as the case may be. Derivatives can be illiquid, may disproportionately
increase losses and have a potentially large negative impact on the Fund’s performance. Derivative transactions, including options
on securities and securities indices and other transactions in which the Fund may engage (such as forward currency transactions, futures
contracts and options thereon and total return swaps), may subject the Fund to increased risk of principal loss due to unexpected movements
in stock prices, changes in stock volatility levels, interest rates and foreign currency exchange rates and imperfect correlations between
the Fund’s securities holdings and indices upon which derivative transactions are based. The Fund also will be subject to credit
risk with respect to the counterparties to any OTC derivatives contracts the Fund enters into.
As of May 31, 2024, TEAF held no forward currency contracts.
Interest Rate Swap Contracts
TYG may enter into interest rate swap contracts in
an attempt to protect it from increasing interest expense on its leverage resulting from increasing interest rates. A decline in interest
rates may result in a decline in the value of the swap contracts, which may result in a decline in the net assets of TYG. At the time
the interest rate swap contracts reach their scheduled termination, there is a risk that TYG will not be able to obtain a replacement
transaction, or that the terms of the replacement would not be as favorable as on the expiring transaction. In addition, if TYG is required
to terminate any swap contract early due to a decline in net assets below a threshold amount or failing to maintain a required 300% asset
coverage of the liquidation value of the outstanding debt, then TYG could be required to make a payment to the extent of any net unrealized
depreciation of the terminated swaps, in addition to redeeming all or some of its outstanding debt. TYG segregates a portion of its assets
as collateral for the amount of any net liability of its interest rate swap contracts.
TYG may be subject to credit risk on the interest rate
swap contracts if the counterparty should fail to perform under the terms of the interest rate swap contracts. The amount of credit risk
is limited to the net appreciation of the interest rate swap contracts, if any, as no collateral is pledged by the counterparty. In addition,
if the counterparty to the interest rate swap contracts defaults, the Fund would incur a loss in the amount of the receivable and would
not receive amounts due from the counterparty to offset the interest payments on the Fund’s leverage. As of May 31, 2024, TYG held
no interest rate swap contracts.
Written Call Options
Transactions in written option contracts for TEAF for
the period from December 1, 2023 through May 31, 2024 are as follows:
| | |
TEAF |
| | |
Number of
Contracts | | |
Premium | |
| Options outstanding at November 30, 2023 | |
| 1,000 | | |
$ | 34,025 | |
| Options written | |
| 245 | | |
| 17,983 | |
| Options closed | |
| — | | |
| — | |
| Options exercised | |
| (1,000 | ) | |
| (34,025 | ) |
| Options expired | |
| (245 | ) | |
| (17,983 | ) |
| Options outstanding at May 31, 2024 | |
| — | | |
$ | — | |
There were no written option contracts in TYG, NTG,
TTP and NDP during the period December 1, 2023 through May 2024. As of May 31, 2024, TEAF held no written options contracts.
The following table presents the effect of derivatives
on the Statements of Operations for the period ended May 31, 2024:
Derivatives
not accounted for
as hedging instruments under ASC 815 | |
Location
of Gains (Losses)
on Derivatives | |
Net
Realized
Gain (Loss) on
Derivatives | | |
Net
Change
in Unrealized
Appreciation
(Depreciation)
of Derivatives | |
| TEAF: Written equity call options | |
Options | |
$ | 17,983 | | |
$ | 12,781 | |
2024 Semi-Annual Report | May 31, 2024
Notes to Financial Statements (unaudited)
(continued)
13. Basis For Consolidation
As of May 31, 2024, TYG has committed a total of $55,256,470
of equity funding to Tortoise Holdco II, LLC, a wholly-owned investment of TYG. Tortoise Holdco II, LLC wholly owns TK NYS Solar Holdco,
LLC, which owns and operates renewable energy assets. TK NYS Solar Holdco, LLC acquired the commercial and industrial solar portfolio
between August 2017 and November 2019. Fair value of TK NYS Solar Holdco, LLC is net of tax benefits.
TYG’s consolidated schedule of investments includes
the portfolio holdings of the Fund and its subsidiary, Tortoise Holdco II, LLC. All inter-company transactions and balances have been
eliminated.
As of May 31, 2024, TEAF has committed $63,939,819
to TEAF Solar Holdco, LLC, a wholly-owned investment of TEAF. TEAF Solar Holdco, LLC wholly owns each of Renewable Holdco, LLC and Renewable
Holdco I, LLC, which owns and operates renewable energy assets. TEAF Solar Holdco, LLC owns a majority partnership interest in Renewable
Holdco II, LLC. Renewable Holdco, LLC and Renewable Holdco II, LLC’s acquisition of the commercial and industrial solar portfolio
is ongoing. Renewable Holdco I, LLC acquired the commercial and industrial solar portfolio in September 2019.
As of May 31, 2024, TEAF has provided $3,770,670 to
TEAF Solar Holdco I, LLC, a wholly-owned investment of TEAF. TEAF Solar Holdco I, LLC has committed to $6,667,100 of debt funding to Saturn
Solar Bermuda 1, Ltd. through a private note. Under the terms of the note Tortoise Solar Holdco I, LLC receives cash payments monthly
at an annual rate of 10%. As of November 30, 2023, $3,510,000 of the private note had been funded.
As of May 31, 2024, TEAF has provided $9,600,000 to
EF WWW Holdings, LLC., a wholly-owned investment of TEAF. EF WWW Holdings, LLC has committed to $15,000,000 of debt funding to World Water
Works, Inc. through a senior secured convertible note. All of the committed debt funding has been drawn today. Under the terms of the
note TEAF receives cash payments monthly at an annual rate of 10.50%.
TEAF’s consolidated schedule of investments includes
the portfolio holdings of the Fund and its subsidiaries, TEAF Solar Holdco, LLC and TEAF Solar Holdco I, LLC. All inter-company transactions
and balances have been eliminated.
14. Subsequent Events
TYG:
TYG has performed an evaluation of subsequent events
through the date the financial statements were issued and has determined that no additional items require recognition or disclosure.
NTG:
NTG has performed an evaluation of subsequent events
through the date the financial statements were issued and has determined that no additional items require recognition or disclosure.
TTP:
TTP has performed an evaluation of subsequent events
through the date the financial statements were issued and has determined that no additional items require recognition or disclosure.
NDP:
NDP has performed an evaluation of subsequent events
through the date the financial statements were issued and has determined that no items require recognition or disclosure.
TPZ:
On June 28, 2024, TPZ paid a distribution in the amount
of $0.105 per common share, for a total of $618,467.57. Of this total the dividend reinvestment amounted to $15.7621.
TPZ has performed an evaluation of subsequent events
through the date the financial statements were issued and has determined that no additional items require recognition or disclosure.
TEAF:
On June 28, 2024, TEAF paid a distribution in the amount
of $0.09 per common share, for a total of $1,214,201.43. Of this total the dividend reinvestment amounted to $11.5287.
TEAF has performed an evaluation of subsequent events
through the date the financial statements were issued and has determined that no additional items require recognition or disclosure.
Additional Information (unaudited)
Director and Officer Compensation
The Funds do not compensate any of its directors who
are “interested persons,” as defined in Section 2(a)(19) of the 1940 Act, nor any of its officers. For the period from December
1, 2023 through May 31, 2024, the aggregate compensation paid by the Funds to the independent directors was as follows:
| TYG | |
NTG | |
TTP | |
NDP | |
TPZ | |
TEAF |
| $45,000 | |
$45,000 | |
$33,000 | |
$33,000 | |
$45,000 | |
$45,000 |
The Funds did not pay any special compensation to any
of its directors or officers.
Forward-Looking Statements
This report contains “forward-looking statements”
within the meaning of the 1933 Act and the Securities Exchange Act of 1934, as amended. By their nature, all forward-looking statements
involve risks and uncertainties, and actual results could differ materially from those contemplated by the forward-looking statements.
Several factors that could materially affect each Fund’s actual results are the performance of the portfolio of investments held
by it, the conditions in the U.S. and international financial, petroleum and other markets, the price at which shares of each Fund will
trade in the public markets and other factors discussed in filings with the Securities and Exchange Commission (SEC).
Proxy Voting Policies
A description of the policies and procedures that each
Fund uses to determine how to vote proxies relating to portfolio securities owned by the Fund and information regarding how each Fund
voted proxies relating to the portfolio of securities during the 12-month period ended June 30, 2021 are available to stockholders (i)
without charge, upon request by calling the Adviser at (913) 981-1020 or toll-free at (866) 362-9331 and on or through the Adviser’s
Web site at www.tortoiseecofin.com; and (ii) on the SEC’s Web site at www.sec.gov.
Form N-PORT
Each Fund files its complete schedule of portfolio
holdings for the first and third quarters of each fiscal year with the SEC on Part F of Form N-PORT. Each Fund’s Form Part F of
Form N-PORT are available without charge upon request by calling the Adviser at (866) 362-9331 or by visiting the SEC’s Web site
at www.sec.gov.
Each Fund’s N-PORTs are also available through
the Adviser’s Web site at www.tortoiseecofin.com.
Statement of Additional Information
The Statement of Additional Information (“SAI”)
includes additional information about each Fund’s directors and is available upon request without charge by calling the Adviser
at (866) 362-9331 or by visiting the SEC’s Web site at www.sec.gov.
Certifications
Each Fund’s Chief Executive Officer has submitted
to the New York Stock Exchange the annual CEO certification as required by Section 303A.12(a) of the NYSE Listed Company Manual.
Each Fund has filed with the SEC, as an exhibit to
its most recently filed Form N-CSR, the certification of its Chief Executive Officer and Principal Financial Officer required by Section
302 of the Sarbanes-Oxley Act.
Privacy Policy
In order to conduct its business, each Fund collects
and maintains certain nonpublic personal information about its stockholders of record with respect to their transactions in shares of
each Fund’s securities. This information includes the stockholder’s address, tax identification or Social Security number,
share balances, and distribution elections. We do not collect or maintain personal information about stockholders whose share balances
of our securities are held in “street name” by a financial institution such as a bank or broker.
We do not disclose any nonpublic personal information
about you, the Funds’ other stockholders or the Funds’ former stockholders to third parties unless necessary to process a
transaction, service an account, or as otherwise permitted by law.
To protect your personal information internally, we
restrict access to nonpublic personal information about the Funds’ stockholders to those employees who need to know that information
to provide services to our stockholders. We also maintain certain other safeguards to protect your nonpublic personal information.
Repurchase Disclosure
Notice is hereby given in accordance with Section 23(c)
of the 1940 Act, that each Fund may from time to time purchase shares of its common stock in the open market.
2024 Semi-Annual Report | May 31, 2024
Additional Information (unaudited)
(continued)
Automatic Dividend Reinvestment
Each of NTG, TTP, NDP and TPZ have an Automatic Dividend
Reinvestment Plan and TYG has an Automatic Dividend Reinvestment and Cash Purchase Plan (each, a “Plan”). Each Plan allows
participating common stockholders to reinvest distributions, including dividends, capital gains and return of capital in additional shares
of the Fund’s common stock and TYG’s Plan also allows registered holders of the TYG’s common stock to make optional
cash investments, in accordance with TYG’s Plan, on a monthly basis.
If a stockholder’s shares are registered directly
with the Fund or with a brokerage firm that participates in the Fund’s Plan, all distributions are automatically reinvested for
stockholders by the Agent in additional shares of common stock of the Fund (unless a stockholder is ineligible or elects otherwise). Stockholders
holding shares that participate in the Plan in a brokerage account may not be able to transfer the shares to another broker and continue
to participate in the Plan. Stockholders who elect not to participate in the Plan will receive all distributions payable in cash paid
by check mailed directly to the stockholder of record (or, if the shares are held in street or other nominee name, then to such nominee)
by Computershare, as dividend paying agent. Distributions subject to tax (if any) are taxable whether or not shares are reinvested.
Any single investment pursuant to the cash purchase
option under TYG’s Plan must be in an amount of at least $100 and may not exceed $5,000 per month unless a request for waiver has
been granted. A request for waiver should be directed to TYG at 1-866-362-9331 and TYG has the sole discretion to grant any requested
waiver. Optional cash investments may be delivered to the Agent by personal check, by automatic or electronic bank account transfer or
by online access at www.computershare.com. TYG reserves the right to reject any purchase order. Stockholders who hold shares in street
or other nominee name who want to participate in optional cash investments should contact their broker, bank or other nominee and follow
their instructions. There is no obligation to make an optional cash investment at any time, and the amount of such investments may vary
from time to time. Optional cash investments must be received by the Agent no later than two business days prior to the monthly investment
date (the “payment date”) for purchase of common shares on the next succeeding purchase date under TYG’s Plan. Scheduled
optional cash purchases may be cancelled or refunded upon a participant’s written request received by the Agent at least two business
days prior to the purchase date. Participants will not be able to instruct the Agent to purchase common shares at a specific time or at
a specific price.
If on the distribution payment date or, for TYG, the
purchase date for optional cash investments, the net asset value per share of the common stock is equal to or less than the market price
per share of common stock plus estimated brokerage commissions, the Fund will issue additional shares of common stock to participants.
The number of shares will be determined by the greater of the net asset value per share or 95 percent of the market price. Otherwise,
shares generally will be purchased on the open market by the Agent as soon as possible following the payment date or purchase date, but
in no event later than 30 days after such date except as necessary to comply with applicable law. There are no brokerage charges with
respect to shares issued directly by the Fund as a result of distributions payable either in shares or in cash or, for TYG, as a result
of optional cash investments. However, each participant will pay a pro rata share of brokerage commissions incurred with respect to the
Agent’s open-market purchases in connection with the reinvestment of distributions or optional cash investments. If a participant
elects to have the Agent sell part or all of his or her common stock and remit the proceeds, such participant will be charged a transaction
fee of $15.00 plus his or her pro rata share of brokerage commissions on the shares sold.
Participation is completely voluntary. Stockholders
may elect not to participate in the Plan, and participation may be terminated or resumed at any time without penalty, by giving notice
in writing, by telephone or Internet to Computershare, the Plan Agent, at the address set forth below. Such termination will be effective
with respect to a particular distribution if notice is received prior to such record date.
Additional information about the Plan may be obtained by writing
to Computershare Trust Company, N.A, P.O. Box 30170, College Station, TX 77842-3170. You may also contact Computershare by phone at
(800) 426-5523 or visit their Web site at www.computershare.com.
Office of the Company
and of the Investment Adviser
Tortoise Capital Advisors, L.L.C.
6363 College Boulevard,
Suite 100A
Overland Park, KS 66211
(913) 981-1020
(913) 981-1021
(fax) www.tortoiseecofin.com
Board of Directors of
Tortoise Energy Infrastructure Corp.
Tortoise Midstream Energy Fund, Inc.
Tortoise Pipeline & Energy Fund, Inc.
Tortoise Energy Independence Fund, Inc.
Tortoise Power and Energy Infrastructure Fund, Inc.
Ecofin Sustainable and Social Impact Term
Fund
H. Kevin Birzer, Chairman
Tortoise Capital Advisors,
L.L.C.
Rand C. Berney
Independent
Conrad S. Ciccotello
Independent
Alexandra Herger
Independent
Jennifer Paquette
Independent
Administrator
U.S. Bancorp Fund Services, LLC
615 East Michigan St.
Milwaukee, Wis. 53202
Custodian
U.S. Bank, N.A.
1555 North Rivercenter Drive, Suite 302
Milwaukee,
Wis. 53212
Transfer, Dividend Disbursing
and
Reinvestment Agent
Computershare Trust Company, N.A. /
Computershare Inc.
P.O. Box 30170
College Station, Tex. 77842-3170
(800) 426-5523
www.computershare.com
Legal Counsel
Husch Blackwell LLP
4801 Main St.
Kansas City, Mo. 64112
Investor Relations
(866) 362-9331
info@tortoiseecofin.com
Stock Symbols
Listed NYSE Symbols: TYG, NTG, TTP, NDP, TPZ, TEAF
This report is for stockholder information. This is
not a prospectus intended for use in the purchase or sale of fund shares. Past performance is no guarantee of future results and your
investment may be worth more or less at the time you sell.
6363 College Boulevard, Suite 100A
Overland Park, KS 66211
www.tortoiseecofin.com
Item 1. (b) Notice pursuant to Rule 30e-3.
Not applicable.
Item 2. Code of Ethics.
Not applicable for semi-annual reports.
Item 3. Audit Committee Financial Expert.
Not applicable for semi-annual reports.
Item 4. Principal Accountant Fees and Services.
Not applicable for semi-annual reports.
Item 5. Audit Committee of Listed Registrants.
Not applicable for semi-annual reports.
Item 6. Investments.
| (a) | Schedule of Investments is included as part of the report to shareholders filed under Item 1. |
Item 7. Financial Statements and Financial Highlights
for Open-End Management Investment Companies.
| (a) | Not applicable to closed-end investment companies. |
| (b) | Not applicable to closed-end investment companies. |
Item 8. Changes in and Disagreements with Accountants
for Open-End Management Investment Companies.
Not applicable to closed-end investment companies.
Item 9. Proxy Disclosures for Open-End Management
Investment Companies.
Not applicable to closed-end investment companies.
Item 10. Remuneration Paid to Directors, Officers,
and Others of Open-End Management Investment Companies.
Not applicable to closed-end investment companies.
Item 11. Statement Regarding Basis for Approval
of Investment Advisory Contract.
Not applicable to this filing.
Item 12. Disclosure of Proxy Voting Policies
and Procedures for Closed-End Management Investment Companies.
Not applicable to this filing.
Item 13. Portfolio Managers of Closed-End Management Investment Companies.
As of the date
of this filing of this semi-annual report, Stephen Pang is no longer a portfolio manager for TEAF.
Item 14. Purchases of Equity Securities by Closed-End
Management Investment Company and Affiliated Purchasers.
None in the reporting period.
Item 15. Submission of Matters to a Vote of Security Holders.
There have been no material changes
to the procedures by which shareholders may recommend nominees to the registrant’s board of directors that have been implemented after
the registrant last provided disclosure in response to this Item.
Item 16. Controls and Procedures.
(a) The Registrant’s
Chief Executive Officer, and its Principal Financial Officer and Treasurer have concluded that the Registrant’s disclosure controls and
procedures (as defined in Rule 30a-3(c) under the Investment Company Act of 1940, as amended (the “1940 Act”) (17
CFR 270.30a-3(c))) are effective, as of a date within 90 days of the filing date of this report
that includes the disclosure required by this paragraph, based on the evaluation of these controls and procedures required by Rule 30a-3(b)
under the 1940 Act (17 CFR 270.30a-3(b)) and
Rules 13a-15(b) or 15d-15(b) under the Securities Exchange Act of 1934, as amended (the “Exchange
Act”) (17 CFR 240.13a-15(b) or 240.15d-15(b)).
(b) There were no changes
in the Registrant’s internal control over financial reporting (as defined in Rule 30a-3(d) under the 1940 Act (17
CFR 270.30a-3(d)) that occurred during the period covered by this report that have materially
affected, or are reasonably likely to materially affect, the Registrant’s internal control over financial reporting.
Item 17. Disclosure of Securities Lending Activities
For Closed-End Management Investment Companies.
The Registrant does not participate in securities
lending activities.
Item 18. Recovery of Erroneously Awarded Compensation.
Not applicable.
Item 19. Exhibits.
(a)(1) Any code of ethics or amendment thereto, that is the subject
of the disclosure required by Item 2, to the extent that the Registrant intends to satisfy Item 2 requirements through filing of an exhibit.
Not applicable.
(a)(2) Not applicable.
(a)(3) Certifications pursuant to Rule 30a-2(a) under the Investment Company Act of 1940 and Section 302 of the Sarbanes-Oxley Act of 2002. Filed herewith.
(a)(3) Any written solicitation to purchase
securities under Rule 23c-1 under the Act (17 CFR 270.23c-1) sent or given during the period
covered by the report by or on behalf of the Registrant to 10 or more persons. None.
(a)(4) Not applicable
SIGNATURES
Pursuant to the requirements of the Securities
Exchange Act of 1934 and the Investment Company Act of 1940, the Registrant has duly caused this report to be signed on its behalf by
the undersigned, thereunto duly authorized.
| (Registrant) |
Ecofin Sustainable and Social Impact Term Fund |
|
| |
|
|
| By (Signature and Title) |
/s/ Matthew G.P. Sallee |
|
| |
Matthew G.P. Sallee, Chief Executive Officer |
|
Date August 8, 2024
Pursuant to the requirements of the Securities
Exchange Act of 1934 and the Investment Company Act of 1940, this report has been signed below by the following persons on behalf of the
Registrant and in the capacities and on the dates indicated.
| By (Signature and Title) |
/s/ Matthew G.P. Sallee |
|
| |
Matthew G.P. Sallee, Chief Executive Officer |
|
Date August 8, 2024
| By (Signature and Title) |
/s/ Sean Wickliffe |
|
| |
Sean Wickliffe, Principal Financial Officer and Treasurer |
|
Date August 8, 2024
EX-99.CERT
CERTIFICATIONS
I, Matthew G.P. Sallee, certify that:
1. I have reviewed this report
on Form N-CSR of Ecofin Sustainable and Social Impact Term Fund;
2. Based on my knowledge,
this report does not contain any untrue statement of a material fact or omit to state a material fact necessary to make the statements
made, in light of the circumstances under which such statements were made, not misleading with respect to the period covered by this report;
3. Based on my knowledge,
the financial statements, and other financial information included in this report, fairly present in all material respects the financial
condition, results of operations, changes in net assets, and cash flows (if the financial statements are required to include a statement
of cash flows) of the registrant as of, and for, the periods presented in this report;
4. The registrant’s other
certifying officer(s) and I are responsible for establishing and maintaining disclosure controls and procedures (as defined in Rule 30a-3(c)
under the Investment Company Act of 1940) and internal control over financial reporting (as defined in Rule 30a-3(d) under the Investment
Company Act of 1940) for the registrant and have:
(a) Designed such disclosure
controls and procedures, or caused such disclosure controls and procedures to be designed under our supervision, to ensure that material
information relating to the registrant, including its consolidated subsidiaries, is made known to us by others within those entities,
particularly during the period in which this report is being prepared;
(b) Designed such internal
control over financial reporting, or caused such internal control over financial reporting to be designed under our supervision, to provide
reasonable assurance regarding the reliability of financial reporting and the preparation of financial statements for external purposes
in accordance with generally accepted accounting principles;
(c) Evaluated the effectiveness
of the registrant’s disclosure controls and procedures and presented in this report our conclusions about the effectiveness of the disclosure
controls and procedures, as of a date within 90 days prior to the filing date of this report based on such evaluation; and
(d) Disclosed in this report
any change in the registrant’s internal control over financial reporting that occurred during the period covered by this report
that has materially affected, or is reasonably likely to materially affect, the registrant’s internal control over financial reporting;
and
5. The registrant’s other
certifying officer(s) and I have disclosed to the registrant’s auditors and the audit committee of the registrant’s board of directors
(or persons performing the equivalent functions):
(a) All significant deficiencies
and material weaknesses in the design or operation of internal control over financial reporting which are reasonably likely to adversely
affect the registrant’s ability to record, process, summarize, and report financial information; and
(b) Any fraud, whether or not
material, that involves management or other employees who have a significant role in the registrant’s internal control over financial
reporting.
| Date: August 8, 2024 |
|
/s/ Matthew G.P. Sallee |
| |
|
Matthew G.P. Sallee
Chief Executive Officer
|
EX-99.CERT
CERTIFICATIONS
I, Sean Wickliffe, certify that:
1. I have reviewed this report
on Form N-CSR of Ecofin Sustainable and Social Impact Term Fund;
2. Based on my knowledge,
this report does not contain any untrue statement of a material fact or omit to state a material fact necessary to make the statements
made, in light of the circumstances under which such statements were made, not misleading with respect to the period covered by this report;
3. Based on my knowledge,
the financial statements, and other financial information included in this report, fairly present in all material respects the financial
condition, results of operations, changes in net assets, and cash flows (if the financial statements are required to include a statement
of cash flows) of the registrant as of, and for, the periods presented in this report;
4. The registrant’s other
certifying officer(s) and I are responsible for establishing and maintaining disclosure controls and procedures (as defined in Rule 30a-3(c)
under the Investment Company Act of 1940) and internal control over financial reporting (as defined in Rule 30a-3(d) under the Investment
Company Act of 1940) for the registrant and have:
(a) Designed such disclosure
controls and procedures, or caused such disclosure controls and procedures to be designed under our supervision, to ensure that material
information relating to the registrant, including its consolidated subsidiaries, is made known to us by others within those entities,
particularly during the period in which this report is being prepared;
(b) Designed such internal
control over financial reporting, or caused such internal control over financial reporting to be designed under our supervision, to provide
reasonable assurance regarding the reliability of financial reporting and the preparation of financial statements for external purposes
in accordance with generally accepted accounting principles;
(c) Evaluated the effectiveness
of the registrant’s disclosure controls and procedures and presented in this report our conclusions about the effectiveness of the disclosure
controls and procedures, as of a date within 90 days prior to the filing date of this report based on such evaluation; and
(d) Disclosed in this report
any change in the registrant’s internal control over financial reporting that occurred during the period covered by this report
that has materially affected, or is reasonably likely to materially affect, the registrant’s internal control over financial reporting;
and
5. The registrant’s other
certifying officer(s) and I have disclosed to the registrant’s auditors and the audit committee of the registrant’s board of directors
(or persons performing the equivalent functions):
(a) All significant deficiencies
and material weaknesses in the design or operation of internal control over financial reporting which are reasonably likely to adversely
affect the registrant’s ability to record, process, summarize, and report financial information; and
(b) Any fraud, whether or not
material, that involves management or other employees who have a significant role in the registrant’s internal control over financial
reporting.
| Date: August 8, 2024 |
|
/s/ Sean Wickliffe |
| |
|
Sean Wickliffe
Principal Financial Officer and Treasurer
|
EX-99.906CERT
Certification Pursuant to Section 906 of
the Sarbanes-Oxley Act
Pursuant to Section 906 of the Sarbanes-Oxley Act of 2002, the undersigned
officer of Ecofin Sustainable and Social Impact Term Fund does hereby certify, to such officer’s knowledge, that the report on Form
N-CSR of Ecofin Sustainable and Social Impact Term Fund for the period ended May 31, 2024 fully complies with the requirements of Section
13(a) or 15(d) of the Securities Exchange Act of 1934, as applicable, and that the information contained in the Form N-CSR fairly presents,
in all material respects, the financial condition and results of operations of Ecofin Sustainable and Social Impact Term Fund for the
stated period.
| /s/ Matthew G.P. Sallee |
|
|
Matthew G.P. Sallee
Chief Executive Officer
Ecofin Sustainable and Social Impact Term Fund |
|
| |
|
| Dated: August 8, 2024 |
|
| /s/ Sean Wickliffe |
|
|
Sean Wickliffe
Principal Financial Officer and Treasurer
Ecofin Sustainable and Social Impact Term Fund |
|
| |
|
| Dated: August 8, 2024 |
|
This certification is being furnished pursuant to Item 13(b) of Form N-CSR
and Section 906 of the Sarbanes-Oxley Act of 2002 and shall not be deemed filed by Ecofin Sustainable and Social Impact Term Fund for
purposes of Section 18 of the Securities Exchange Act of 1934.
Ecofin Sustainable and S... (NYSE:TEAF)
Gráfica de Acción Histórica
De Jul 2024 a Ago 2024

Ecofin Sustainable and S... (NYSE:TEAF)
Gráfica de Acción Histórica
De Ago 2023 a Ago 2024
