Dogecoin Crossover That Led To 90% & 180% Rallies Could Soon Form Again
03 Octubre 2024 - 1:30AM
NEWSBTC
An analyst has pointed out how a Dogecoin indicator could be about
to show a crossover that proved bullish the last two times for the
DOGE price. Dogecoin May Be About To Show A Bullish MACD Crossover
As explained by analyst Ali Martinez in a new post on X, a MACD
crossover could be about to happen for DOGE soon. The “Moving
Average Convergence/Divergence” (MACD) is a technical analysis
indicator momentum indicator tracking the difference between two
Exponential Moving Averages (EMAs) of an asset. The EMAs that the
metric typically uses are the 26-period and the 12-period ones. The
latter is subtracted from the former to get the indicator’s value
and the line on which these values are plotted is known as the MACD
line. Related Reading: Shiba Inu Leads Whale Frenzy: Large SHIB
Transfers See Massive 360% Spike There is also another line
relevant to the indicator called the signal line, which is just the
nine-period EMA of the MACD line. The crossovers between these two
lines can serve as buy or sell signals for the given asset. Now,
here is the chart shared by the analyst, which shows the trend in
the MACD for the Dogecoin weekly price over the past year or so: As
displayed in the above graph, the Dogecoin MACD and its signal line
have recently come close to touching each other. Currently, the
signal line is above the MACD line, but if they continue in their
recent trajectories, then their arrangement could be reversed. A
crossover of this type is generally considered a bullish sign. In
the chart, Martinez has highlighted what happened the last two
times that the DOGE weekly price witnessed this trend. “The last
two times Dogecoin $DOGE had a MACD bullish crossover on the weekly
chart, it rallied 90% and 180%, respectively,” notes the analyst.
Given this trend, it’s possible that the meme coin could benefit
from a price boost this time as well, should the crossover take
place. In some other news, the DOGE Active Addresses have shot up
to pretty high levels recently, as Martinez has pointed out in
another X post. The “Active Addresses” indicator keeps track of the
total amount of Dogecoin addresses that are taking part in some
kind of transaction activity on the network every day. In the
latest spike, the metric has reached a high of of 84,306, which is
the highest that it has been in around six months. Thus, it would
seem that users have been quite active with their trades recently.
Related Reading: Bitcoin Hype Bites Back As BTC Crashes Under
$64,000 From the chart, it’s apparent that the trigger for the
spike has been the plunge that DOGE has witnessed recently.
Investors generally make panic moves when volatility occurs, so
this trend isn’t too unusual. DOGE Price At the time of writing,
Dogecoin is trading around $0.105, down almost 4% over the past
week. Featured image from Dall-E, Santiment.net, chart from
TradingView.com
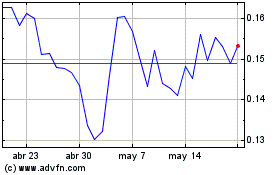
Dogecoin (COIN:DOGEUSD)
Gráfica de Acción Histórica
De Oct 2024 a Nov 2024

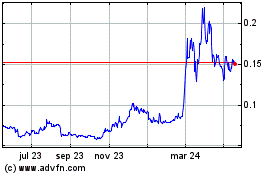
Dogecoin (COIN:DOGEUSD)
Gráfica de Acción Histórica
De Nov 2023 a Nov 2024
